Article

Removal of Crop Ion Components in Relation to Mollisol Acidification under Long-Term Management

1
Key Laboratory of Mollisols Agroecology, Northeast Institute of Geography and Agroecology, Chinese Academy of Sciences, Harbin 150081, China
2
University of Chinese Academy of Sciences, Beijing 100049, China
*
Author to whom correspondence should be addressed.
Agronomy 2024, 14(1), 191; https://doi.org/10.3390/agronomy14010191
Submission received: 19 December 2023 / Revised: 12 January 2024 / Accepted: 13 January 2024 / Published: 15 January 2024

Abstract

:
Crop removal of cations and anions is one of the main factors causing soil acidification. Mollisols, also known as black soils, which are inherently neutral soils, have been acidified due to irrational land use. However, the magnitude of acidification of black soils in relation to crop removal under crop rotation and field management remains unclear. In this study, we collect soil samples from 9- and 10-year long-term trials with seven treatments of soybean and corn monoculture, and corn–soybean rotation under different fertilization or straw return in the Mollisol region of Northeast China. Total removal of cations and anions is 371–508 and 92–125 kg ha−1 in corn but 166–250 and 56–82 kg ha−1 in soybean, which leads to the production of 7.06–10.2 kmol ha−1 H+ for corn and 4.43–5.77 kmol ha−1 H+ for soybean. Among the four cations (K+, Ca2+, Na+, and Mg2+) analyzed in different tissues of crops, K+ contributes more to the total H+ production, where K+ in corn stem contributes more than 55% H+, while K+ in soybean seed contributes more than 64% H+. The sum of Ca2+ and Mg2+ removal for soybean is 37.6–66.9 kg ha−1, 1.26–2.07 times (p < 0.05) greater than for corn. Net H+ produced by corn and soybean removal may potentially lead to a soil acidification of 0.053–0.074 and 0.032–0.045 year−1 units pH, respectively. The greater the corn or soybean biomass, the higher the net H+ production. Continuous soybean and combination of chemical fertilizer for corn but no chemical fertilizer for soybean reduce the soil pH buffering capacity (pHBC), while other treatments increase the soil pHBC, but there is no effect for continuous corn. Compared to normal corn–soybean rotation, soil pH in 9-year continuous corn declines from 5.76 to 5.63, while 10-year continuous soybean declines from 5.68 to 5.43 (p < 0.05). However, soil pH with chemical fertilizer for corn and dairy manure for soybean increases by 0.60 and 0.89 units (p < 0.05). Changes in pH might not be fully related to crop ion removal. Manure application with crop rotation is an effective approach to alleviate soil acidification.

1. Introduction

Soil acidification is defined as a decrease in the acid-neutralizing capacity of the soil, which results from the production of protons (H+) and the depletion of cationic components (such as K+, Ca2+, Na+, and Mg2+) [1,2]. Under natural conditions without artificial disturbance, soil acidification is a slow process driven by the dissociation of carbon dioxide (CO2) and organic acids and can take hundreds of years before a significant reduction in pH [3,4].
On the other hand, with human intervention, soil acidification could occur primarily due to fertilizer application, crop removal of cationic and anionic components, and acid deposition [5]. Fertilizer application, especially overuse of nitrogen (N) fertilizer, is a major determinant for accelerated soil acidification, and an average pH decline of 0.5 units between the 1980s and 2000s in China’s major croplands has been reported [6,7,8]. Long-term extensive use of chemical N fertilizer could contribute to more severe soil acidification in agro-ecosystems [9,10,11,12]. The magnitude of pH reduction is influenced by soil types, cropping practices, and the rates of fertilizer application, especially for N fertilizer addition [9,11,13,14]. Acidification caused by the application of N fertilizer is 25 times greater than that caused by acid deposition [15]. In past decades, elevated N fertilizer use played an important role in producing sufficient food to feed the rapidly increasing population [15,16]. Globally, the extensive use of chemical N fertilizer in agriculture is harmful to the environment, costly in economic terms, and known to compromise soil health [17]. Using the very simple dynamic (VSD+) model, Zhu et al. [7] predict that relative yield reductions are anticipated to rise from approximately 4% to 24% between 2010 and 2050, assuming N fertilizer input increases at a rate of 1% annually and that the anticipated average soil pH drop is about 1 unit.
Soil pH buffer capacity (pHBC) is a key factor determining the rate of pH changes as the soil acidifies and thus can be used for forecasting soil acidification tendency [18]. The higher the pHBC, the slower the pH change rate. In addition, the generation of H+ in maintaining the charge balance when plants absorb more cations than anions from the soil will further accelerate soil acidification [19,20]. What is more, H+ produced by the removal of anions and cations in crops is the dominant driving factor of soil acidification [2,21]. H+ produced by crop straw removal of anions and cations contributes over 50% of the total H+ production under three fertilization treatments in corn–wheat, rice–fallow, and rice–wheat cropping systems [22]. Unbalanced uptake of anions and cations contributes over 64.4–80.5% of H+ under different cropping systems and fertilization managements, and the outputs of cations (4.82 to 6.67 kmol ha−1) by crop removal are far higher than anions (1.11 to 1.34 kmol ha−1) in Oxisols. The removal of cations and anions by corn is significantly enhanced under N100, N200, and N400 treatment, compared to the nitrogen-free control [2].
Mollisols in Northeast China constitute one of the four continuous Mollisol bodies in the world [23]. Its neutral to slightly alkaline property with high soil fertility makes it well-suited to plant growth [24,25], and thus the Mollisol region has been an important commercial grain production base in China [26]. However, long-term continuous cropping and unreasonable or intensive farming practices have already led to the degradation of the Mollisols, including soil acidification [27,28,29], which may threaten food security in the long run. Understanding the removal of crop cation and anion components in relation to black soil acidification under different managements will provide insight for developing strategies of Mollisol conservation.
The main aims of this study are to identify the production of net H+, total H+, and OH computed by anions and cations in crop removal under monoculture, crop rotation with fertilization, and crop residue return in Mollisols, and examine the responses of differences in crop ion removal to long-term management, and thus reveal the relationship between net H+ production and soil acidification.

2. Materials and Methods

2.1. Field Sites

The study was carried out in the Monitoring and Research Station of Black Soil Erosion with the Northeast Institute of Geography and Agroecology, Chinese Academy of Sciences, at Guangrong Village, Hailun City, China (126.49 E latitude and 47.21 N longitude, 244 m above sea level). The region has a semi-humid continental monsoon climate. The average annual temperature is 1.5 °C with an average annual precipitation of 554 mm. The soil consists of typical Mollisols with an A horizon of 30 cm thick. Corn–soybean rotation or monoculture is the predominant cropping system in this area.

2.2. Experimental Design and Crop Management

A long-term experiment with monoculture, crop rotation under different fertilization, or straw return was initiated in 2013. Before the experiment, the properties of the topsoil (0–20 cm) were measured. The general physiochemical properties were as follows: soil pH of 6.8; bulk density, 1.45 g cm−3; soil organic matter, 32.2 g kg−1; total nitrogen, 1.63 g kg−1; available nitrogen (nitrate and ammonia nitrogen), 73 mg kg−1; NaHCO3−AP, 17 mg kg−1; NH4OAc–K, 248 mg kg−1. The mechanical composition of the soil was 38.6% sand, 26.9% silt, and 34.5% clay, and the soil texture was clay loam according to the USDA soil texture classification.
The experiment consisted of seven treatments in a randomized complete block design with three replications. Each plot measured 9 m in length and 8.4 m in width with an area of 75.6 m2. The specific experiment treatments were as follows:
  • Continuous Corn (CC): continuous corn with chemical fertilizer.
  • Continuous Soybean (CS): continuous soybean with chemical fertilizer.
  • CornCF–SoybeanCF (CCFSCF): corn–soybean rotation with chemical fertilizer.
  • CornCF–Soybean1/2CF (CCFS1/2CF): corn–soybean rotation with chemical fertilizer for corn, but 1/2 chemical fertilizer for soybean.
  • CornCF–SoybeanNOF (CCFSNOF): corn–soybean rotation with chemical fertilizer for corn, but no chemical fertilizer for soybean.
  • CornCR–SoybeanNOR (CCRSNOR): corn–soybean rotation with chemical fertilizer plus straw return for corn, no chemical fertilizer but straw return for soybean.
  • CornCF–SoybeanDM (CCFSDM): corn–soybean rotation with chemical fertilizer for corn, and dairy manure only for soybean.
All crop straws were removed from the field after harvest except for CCRSNOR. For this treatment, the corn or soybean straws were mechanically cut into approximately 5 cm pieces after harvest in autumn, plowed into, and mixed within the 30 cm topsoil. A total of 15,000 kg ha−1 of naturally fermented and decomposed dairy manure (containing 20.2 g kg−1 N, 206 g kg−1 C) in autumn was surface applied and mixed into 30 cm topsoil under CCFSDM. The rate of chemical fertilizers at seeding for soybean was 50 kg ha−1 of urea, 150 kg ha−1 of diammonium phosphate, and 50 kg ha−1 of potassium sulfate, while that for corn was 75 kg ha−1 of urea, 150 kg ha−1 of diammonium phosphate, and 50 kg ha−1 of potassium sulfate. Additional urea with a rate of 225 kg ha−1 was applied at the jointing stage of corn as the topdressing fertilizer. The varieties of corn and soybean were Xingken 5 and Dongsheng 1, respectively. In the trial, the planting density of soybean was 270,000 plants ha−1 and that of corn was 48,000 plants ha−1. Manual weeding, mechanical tillage, and pest control were employed during the corn– and soybean–growing seasons.

2.3. Sampling and Chemical Analysis

Soil samples from each plot were collected at 0–20 cm depth in 2021 (after 9-year treatment) and 2022 (after 10-year treatment). Plant samples were collected in 2021 for corn and in 2022 for soybean. Ten representative plants of soybean and six corn plants were randomly selected from each plot. Corn was divided into seeds, stems, leaves, husks, and cobs, while soybean was separated into seeds, stems, and pod walls. Samples of the plants mentioned above were dried in an oven at 65 °C to constant weight and weighed. Crop biomass was the sum of dry weight of different tissues in crop. Plot yield was adjusted to standard grain moisture content, and transformed into yield per hectare. Crop samples were milled to <0.5 mm using a ball mill (Retsol MM 200, Retsch, Haan, Germany) for analyzing the contents of anions and cations in various crop tissues.
K+, Ca2+, Na+, and Mg2+ concentrations were digested by HNO3–HClO4 solution and measured with atomic absorption spectrophotometer (HGA-E50, Hai Guang, Beijing, China). Phosphate (H2PO4) concentration was determined by using a molybdenum–antimony anti-colorimetric. Water-soluble anions (SO42−) were subjected to a HNO3−HClO4 solution and measured with inductively coupled plasma-atomic emission spectrometry (ICPS−7500, Shimadzu, Kyoto City, Japan). Total Cl was determined by the method of titration with silver nitrate. High-purity water was used as a reference material.
Soil pH was determined in CO2-free deionized water using a pH electrode, with a soil–liquid ratio of 1:5 (w/v). Soil pH buffer capacity was measured by titration techniques [18]. Titration curves were established by adding incremental amounts of HCl or NaOH to soil/water ratios 1:5 (w/v). For each titration curve, 4 g of soil was weighed into eleven polyethylene tubes, and different HCl gradients (0, 14.75, 29.5, 59, 88.5, and 118 mmol H+ kg−1 soil) as well as different NaOH gradients (12.75, 25.5, 51, 76.0, and 102 mmol H+ kg−1 soil) were added. Then, deionized water was added to each tube so that the total volume after acid/alkali addition was 20 mL. The suspensions were thoroughly shaken at 25 °C and equilibrated for a further 7 days at 25 °C, and then pH was determined by a digital pH meter (PHS−3C, Lei Ci, Shanghai, China). All substances were purchased from Comeo Chemical Reagent Co., Ltd. (Tianjin, China).

2.4. Data Calculation

Amounts of base cations (K+, Ca2+, Na+, and Mg2+) and anions (SO42−, Cl, and H2PO4) are the dominant respective sources of acidity and alkalinity when these ions are removed from the soil by plants, which leaves equivalent H+ and OH in the soil [30]. Net H+ production is therefore estimated by the following equations [11,31]:
Total H+ (kmol ha−1) = Kuptake/Kmm + Nauptake/Namm + 2 × Cauptake/Camm + 2 × Mguptake/Mgmm
Total OH (kmol ha−1) = Puptake/Pmm + Cluptake/Clmm + 2 × Suptake/Smm
Net H+ (kmol ha−1) = Total H+ − Total OH
In Equations (1) and (2), Kuptake, Nauptake, Cauptake, Mguptake, Puptake, Cluptake, and Suptake represent the uptake amounts of K+, Ca2+, Na+, Mg2+, SO42−, Cl, and H2PO4 in different tissues of corn and soybean, respectively. They are the sum of ion concentration multiplied by biomass and planting density. Kmm, Namm, Camm, Mgmm, Pmm, Clmm, and Smm represent the molar mass of each element.
Potential soil pH reduction was calculated by the following equation.
Potential pH reduction = amount of acid added/(pHBC × BD × V)
The amount of acid added (mol H+ ha−1) represents H+ produced by removal of harvested corn or soybean, pHBC (mol H+ kg−l pH unit−1) represents pH buffer capacity, BD (kg m−3) represents soil bulk density, and V (m3) represents volume of soil [12].

2.5. Data Analysis

Repeated-measures analysis of variance (ANOVA) was used to identify the effects of crop removal and H+ production in each treatment. The least significant difference (LSD) test was used to determine the significance of the difference between means at p < 0.05. All figures were drawn using Origin (2022, OriginLab, Northampton, MA, USA) and R (3.6.2, R Core Team, Vienna, Austria). The linear regression and Pearson correlation analysis were carried out using SPSS (25.0, IBM Corp, Chicago, IL, USA) for Windows software (10, Microsoft, Redmond, WA, USA).

3. Results

3.1. Crop Biomass, Seed Yield, Total H+, OH, and Net H+ Production

Compared to the treatment of CCFSCF in corn–soybean rotation, 9-year continuous corn (CC) had no effect on the biomass of corn per hectare (Figure 1A), while 10-year continuous soybean (CS) significantly decreased the biomass of soybean per hectare by 18.3% (p < 0.05) (Figure 1B). Fertilization regimes varied in the biomass of corn and soybean under corn–soybean rotation. Compared to normal fertilization treatment (CCFSCF), CCRSNOR and CCFSNOF decreased the biomass of corn by 6.38 and 6.73% (p < 0.05), respectively, while CCFSDM considerably increased the biomass of corn by 6.82% (p < 0.05) after 9-year treatment (Figure 1A). Meanwhile, the biomass of soybean was 12.5 and 20.0% lower for CCRSNOR and CCFSNOF than CCFSCF, but 9.65% higher (p < 0.05) for CCFSDM after 10-year treatment (Figure 1B).
Seed yield per hectare of CC and CS had a similar tendency to biomass in response to long-term crop rotation compared to CCFSCF (Figure 1C,D), while there was no difference in seed yield of corn per hectare for CCRSNOR, CCFSNOF, CCFS1/2CF, and CCFSDM in comparison to CCFSCF after 9-year treatment (Figure 1C). However, compared to CCFSCF, seed yield per hectare of soybean in CCRSNOR, CCFSNOF, and CCFS1/2CF was reduced by 12.5, 18.6, and 6.70% (p < 0.05), respectively, but significantly enhanced in CCFSDM by 9.96% (p < 0.05) after 10-year treatment (Figure 1D). In general, total biomass and seed yield of corn per hectare were 2.10–2.61 and 1.81–2.41 times greater than that of soybean under long-term management.
Compared with CCFSCF, 9-year continuous corn (CC) significantly increased the total H+ production by 2.22% (p < 0.05), but 10-year continuous soybean (CS) considerably reduced the total H+ production by 12.2% (p < 0.05) (Figure 1E,F). Nevertheless, in comparison to CCFSCF, CCFSDM significantly enhanced the total H+ production of corn by 22.7% and that of soybean by 14.4% (p < 0.05), while CCRSNOR and CCFS1/2CF reduced the total H+ production of corn by 7.78 and 7.25% (p < 0.05). CCRSNOR, CCFSNOF, and CCFS1/2CF significantly reduced the total H+ production of soybean by 2.32−16.3% (p < 0.05).
Total OH production of continuous corn (CC) and continuous soybean (CS) was decreased by 5.47 and 13.5% (p < 0.05) compared to CCFSCF after 9- and 10-year treatment, respectively (Figure 1G,H). However, compared to CCFSCF, CCRSNOR, CCFSNOF, and CCFS1/2CF under corn–soybean rotation considerably decreased the total OH production of corn by 3.63−18.2% and that of soybean by 3.52−23.4% (p < 0.05), while CCFSDM substantially increased the total OH production of corn by 8.97% and that of soybean by 12.9% (p < 0.05). Moreover, corn produced considerably more total H+ and OH than soybean.
The range of net H+ production was 7.06–10.2 kmol ha−1 for corn and 4.43–5.77 kmol ha−1 for soybean. Compared with CCFSCF, the net H+ production of 9-year continuous corn (CC) was 6.37% (p < 0.05) higher, but that of 10-year continuous soybean (CS) was 11.5% (p < 0.05) lower (Figure 1I,J). Under corn–soybean rotation, the net H+ production of corn in CCRSNOR and CCFS1/2CF was 10.0 and 4.08% (p < 0.05) lower but that in CCFSNOF and CCFSDM was 7.07 and 30.1% (p < 0.05) higher than CCFSCF after 9-year treatment. Net H+ production of soybean in CCRSNOR and CCFSNOF was significantly reduced by 7.91 and 12.3% (p < 0.05), but considerably enhanced in CCFSDM by 15.2% (p < 0.05) compared to CCFSCF after 10-year treatment. No difference was found between CCFS1/2NOF and CCFSCF (p > 0.05).

3.2. Total Amount of Cations and Anions Removed in Crops

Total cations and anions of corn at harvest ranged from 371 to 508 and 92 to 125 kg ha−1, while that of soybean ranged from 166 to 250 and 56 to 82 kg ha−1 (Table 1). In general, the total amount of cations and anions in corn was substantially greater than that of soybean, mostly due to the difference in biomass. Specifically, the total amount of cations for corn was 3.41–4.16-fold more than that of anions, while for soybean, it was 2.86–3.06 times greater. Moreover, corn and soybean exhibited different preferences to absorb cations. The preference order of the four main cations in corn was K+ > Mg2+ > Ca2+ > Na+, but it was K+ > Ca2+ ≈ Mg2+ > Na+ in soybean, while the preference order of the three main anions in corn and soybean was the same as H2PO4 > SO42− > Cl.
Compared with CCFSCF, 9-year continuous corn (CC) increased the amount of Ca2+ and Mg2+ by 108 and 11.3% (p < 0.05), reduced the amount of K+, Na+, and Cl by 3.41, 26.2, and 26.5% (p < 0.05), but did not affect the amount of H2PO4 and SO42−. However, 10-year continuous soybean (CS) reduced the amount of the seven ions significantly (p < 0.05).
For corn, the amount of K+ in CCFSDM, Mg2+ in CCFSNOF, as well as Ca2+ in CCFSNOF, CCFS1/2CF, and CCFSDM was 21.5, 20.9, and 143–157% (p < 0.05) higher than CCFSCF after 9-year treatment. The amount of SO42−, H2PO4 in CCFSDM, and Cl in CCRSNOR was 9.80, 10.9, and 5.83% (p < 0.05) higher than CCFSCF, but that of K+, Na+, SO42− in CCFSNOR and H2PO4 in CCFS1/2CF was lower than CCFSCF.
Likewise, for soybean, compared to CCFSCF, the amount of K+ in CCFSDM, Mg2+ in CCFS1/2CF, as well as Ca2+ in CCRSNOR, CCFS1/2CF, and CCFSDM was 22.8, 2.38, and 9.43–22.0% higher after 10-year treatment (p < 0.05). Moreover, the amount of Cl in CCRSNOR and CCFSDM, H2PO4 in CCFS1/2CF and CCFSDM was 7.41, 30.7, 2.12, and 22.2% (p < 0.05) greater than in CCFSCF. The amount of Na+ in CCFSCF was significantly higher than all other treatments with CCFSNOF and CCFSDM was the lowest.

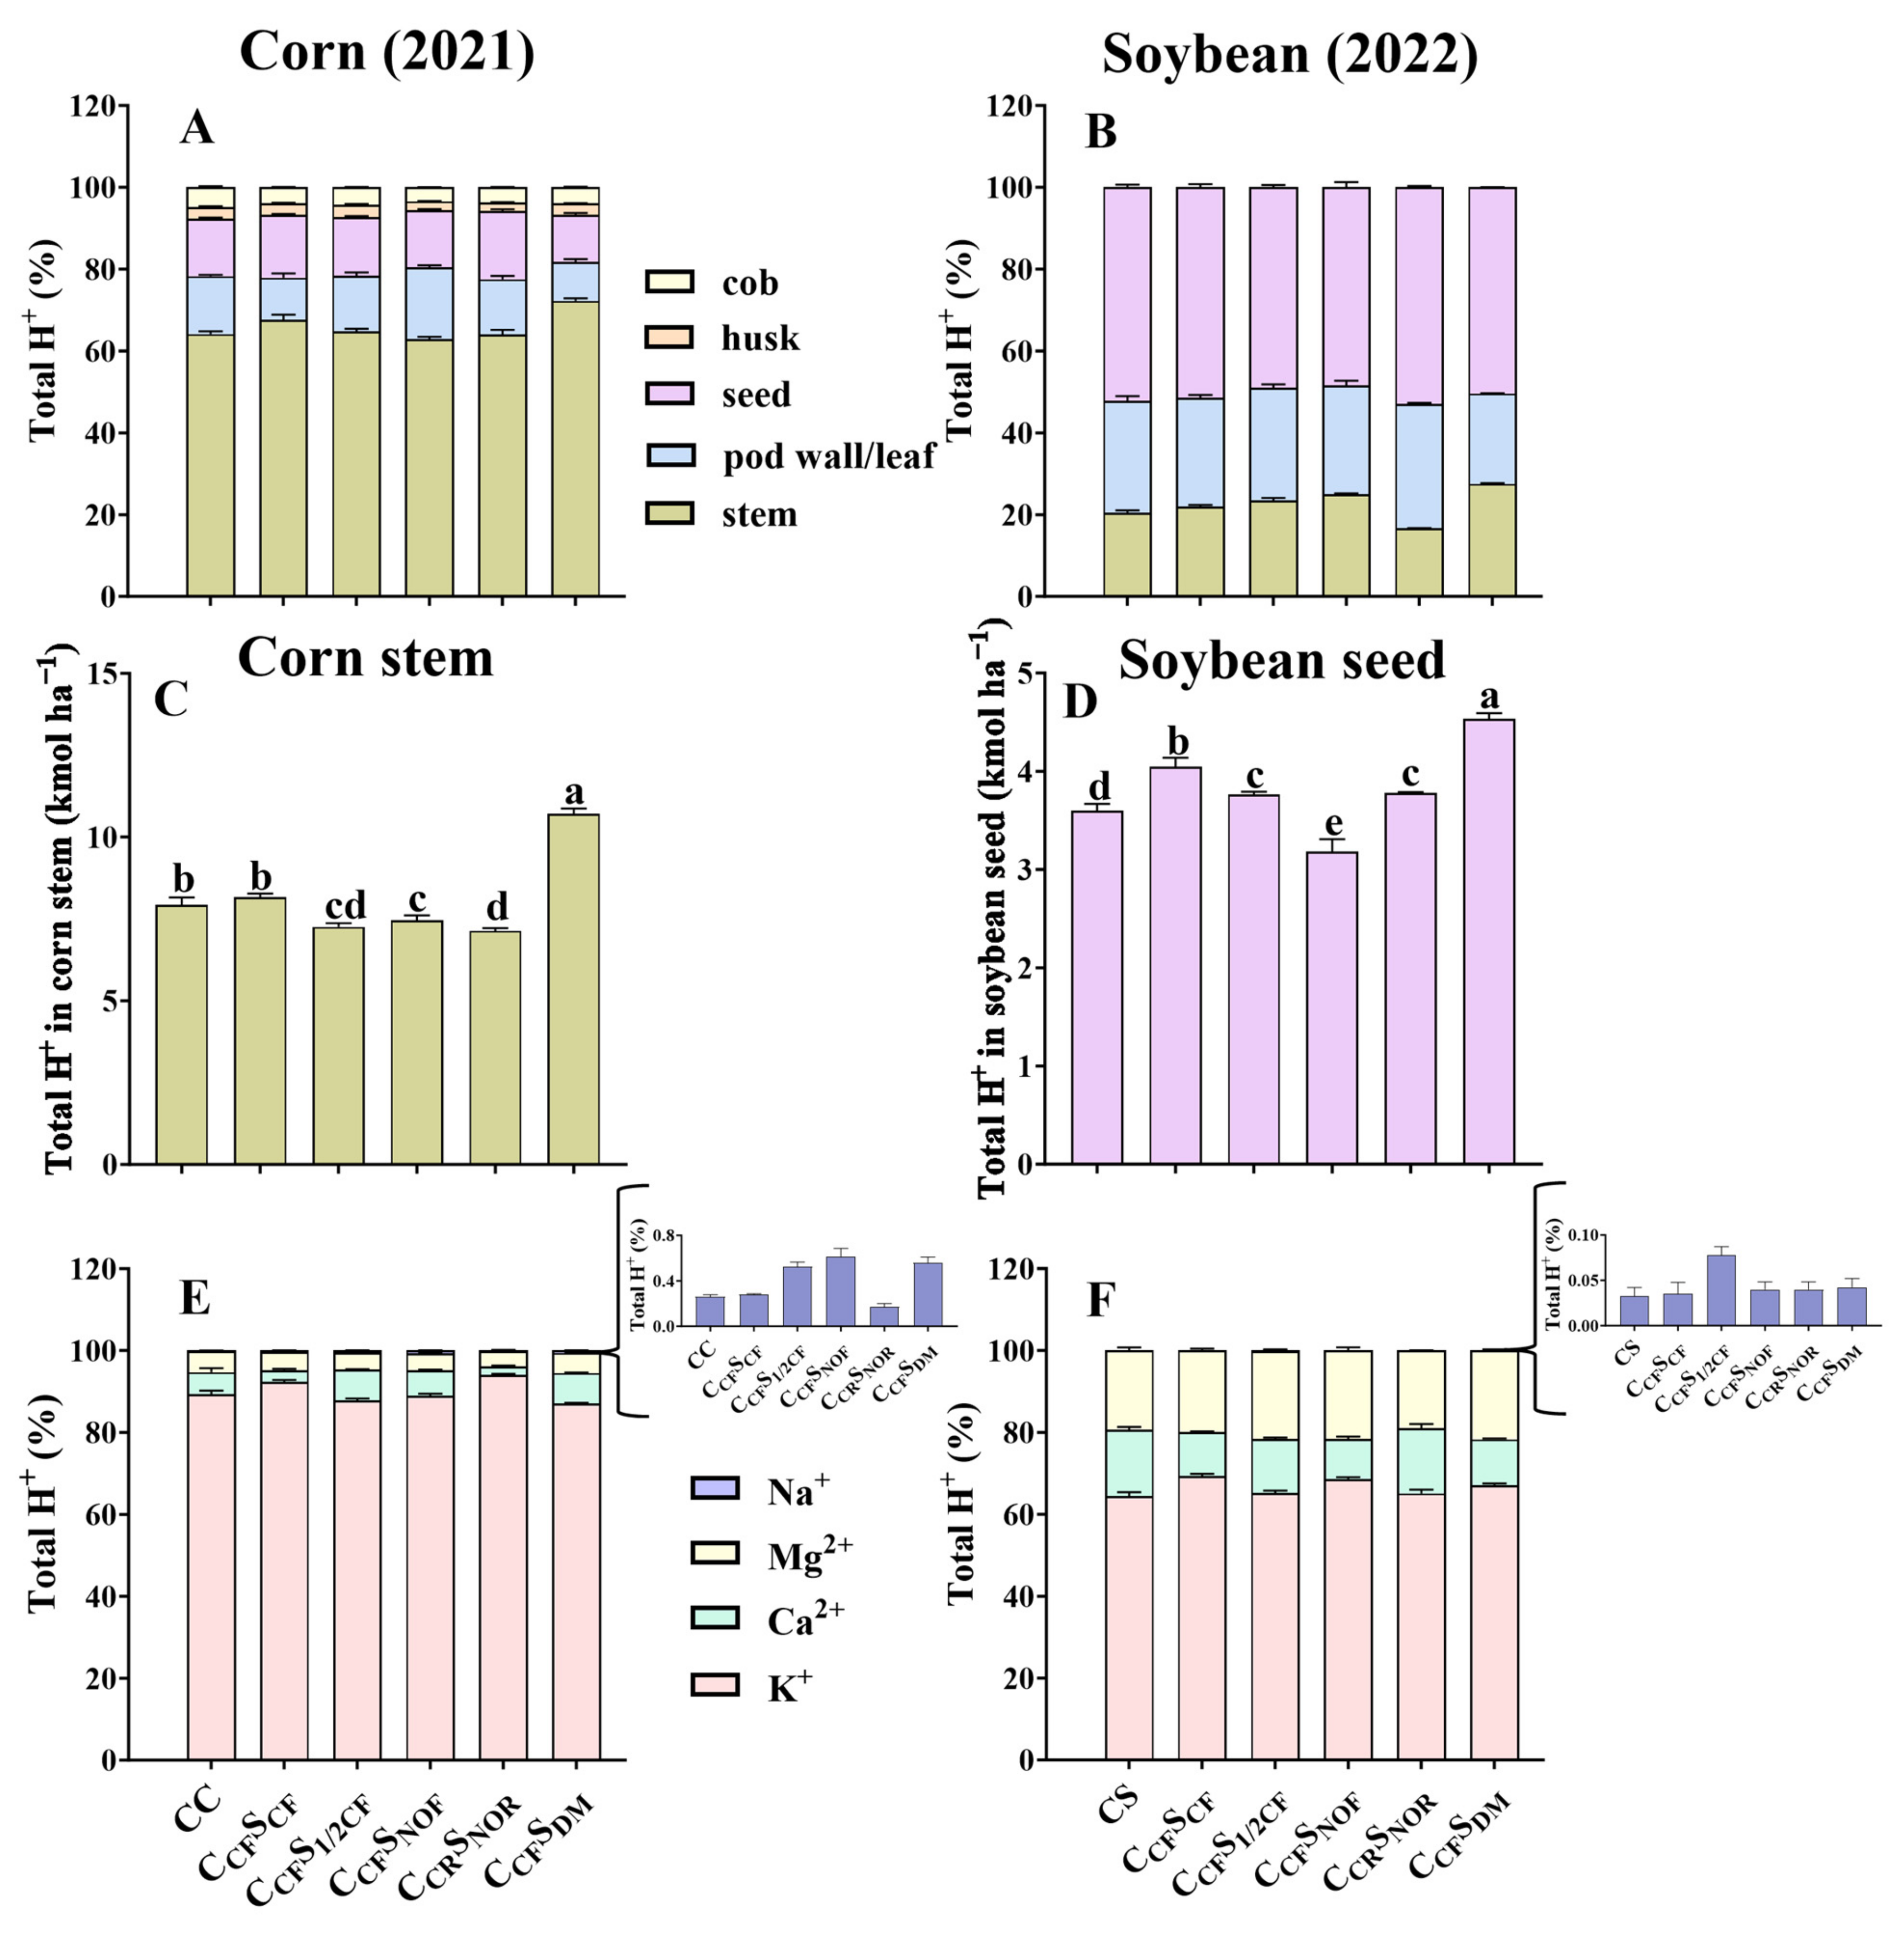
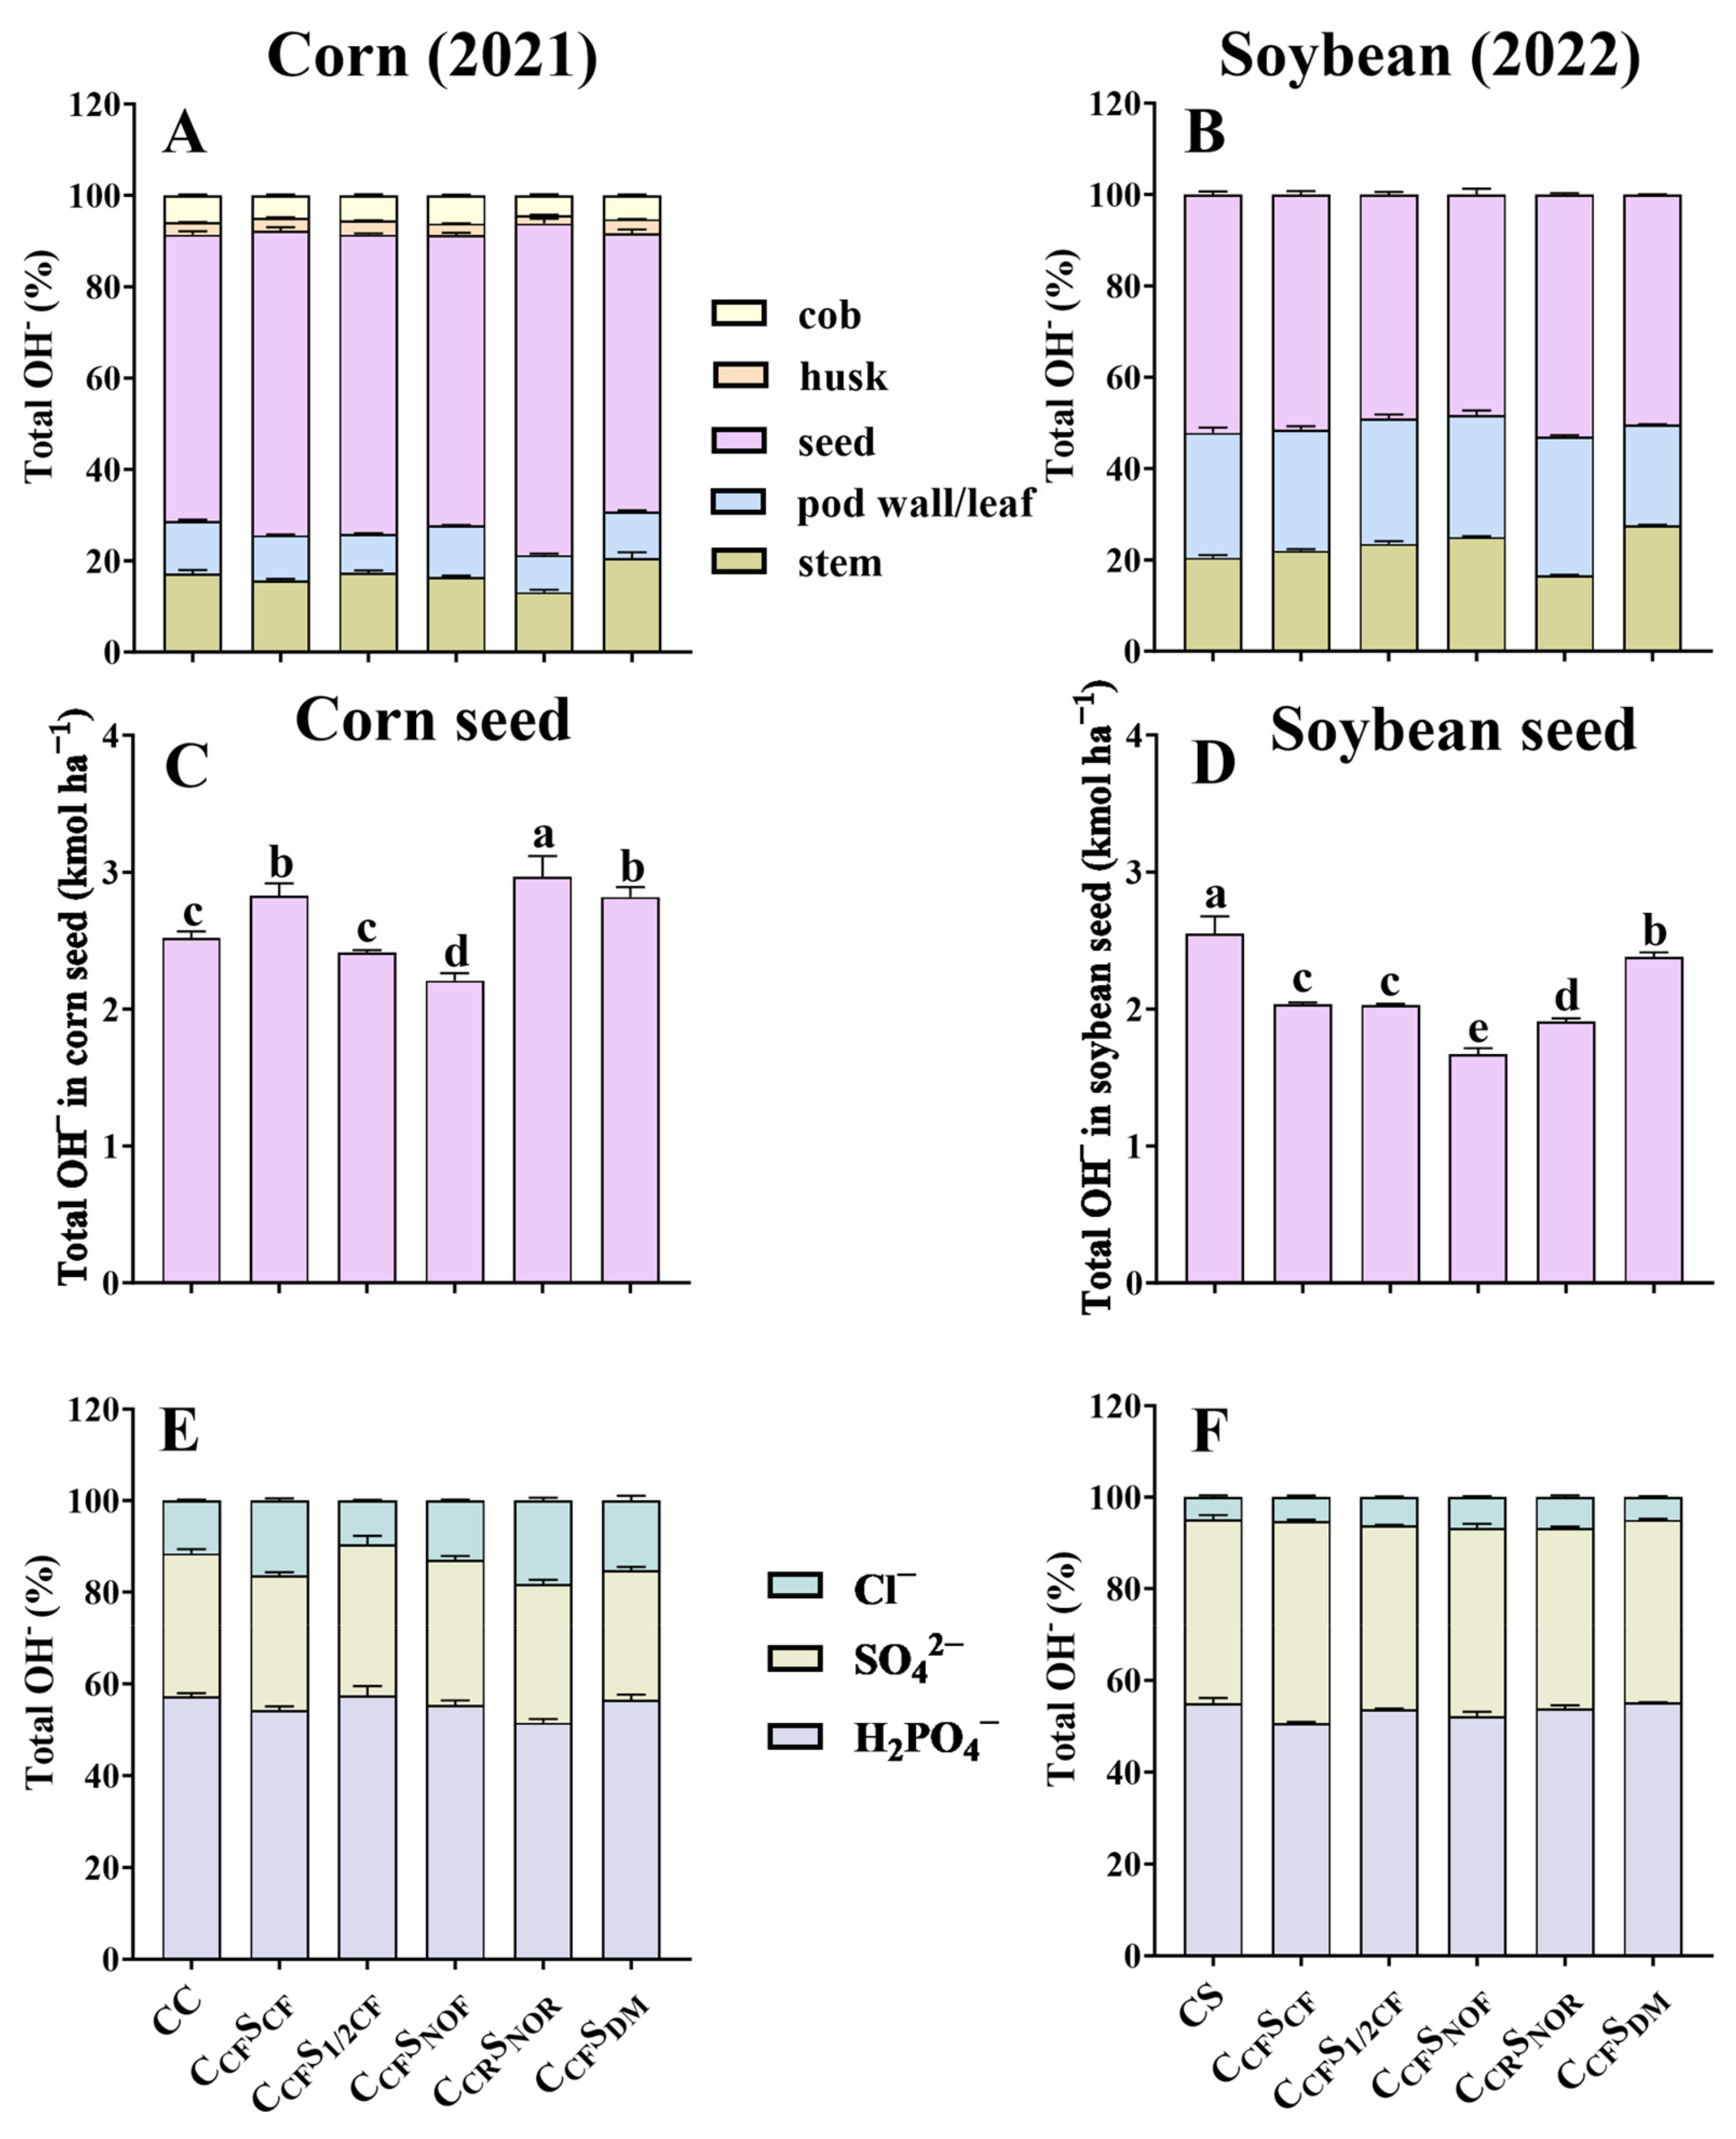
3.3. Percentage of Different Tissues for Total H+ and OH and Contribution Rate of Ion Components

Total H+ production in different tissues of corn was in the order of stem > seed ≈ leaf > cob > husk, but it was seed > pod wall > stem in soybean (Figure 2A,B). Stem had the highest total H+ production among different tissues in corn, with a range of 7.26–10.7 kmol ha−1, where K+ accounted for over 55% of the total H+ production. Soybean seed had the highest total H+ production among different tissues with a lower range of 3.18–4.53 kmol ha−1. Nevertheless, K+ accounted for 64–69% of the total H+ production in soybean (Figure 2C,D).
The order of total OH production in different tissues of corn and soybean was similar to total H+ production (Figure 3A,B). In addition, the seed of corn and soybean produced 2.21–2.97 kmol ha−1 and 1.67–2.38 kmol ha−1 OH, with the sum of HPO4 and SO42− accounting for more than 82% for corn and 93% for soybean (Figure 3C,D).

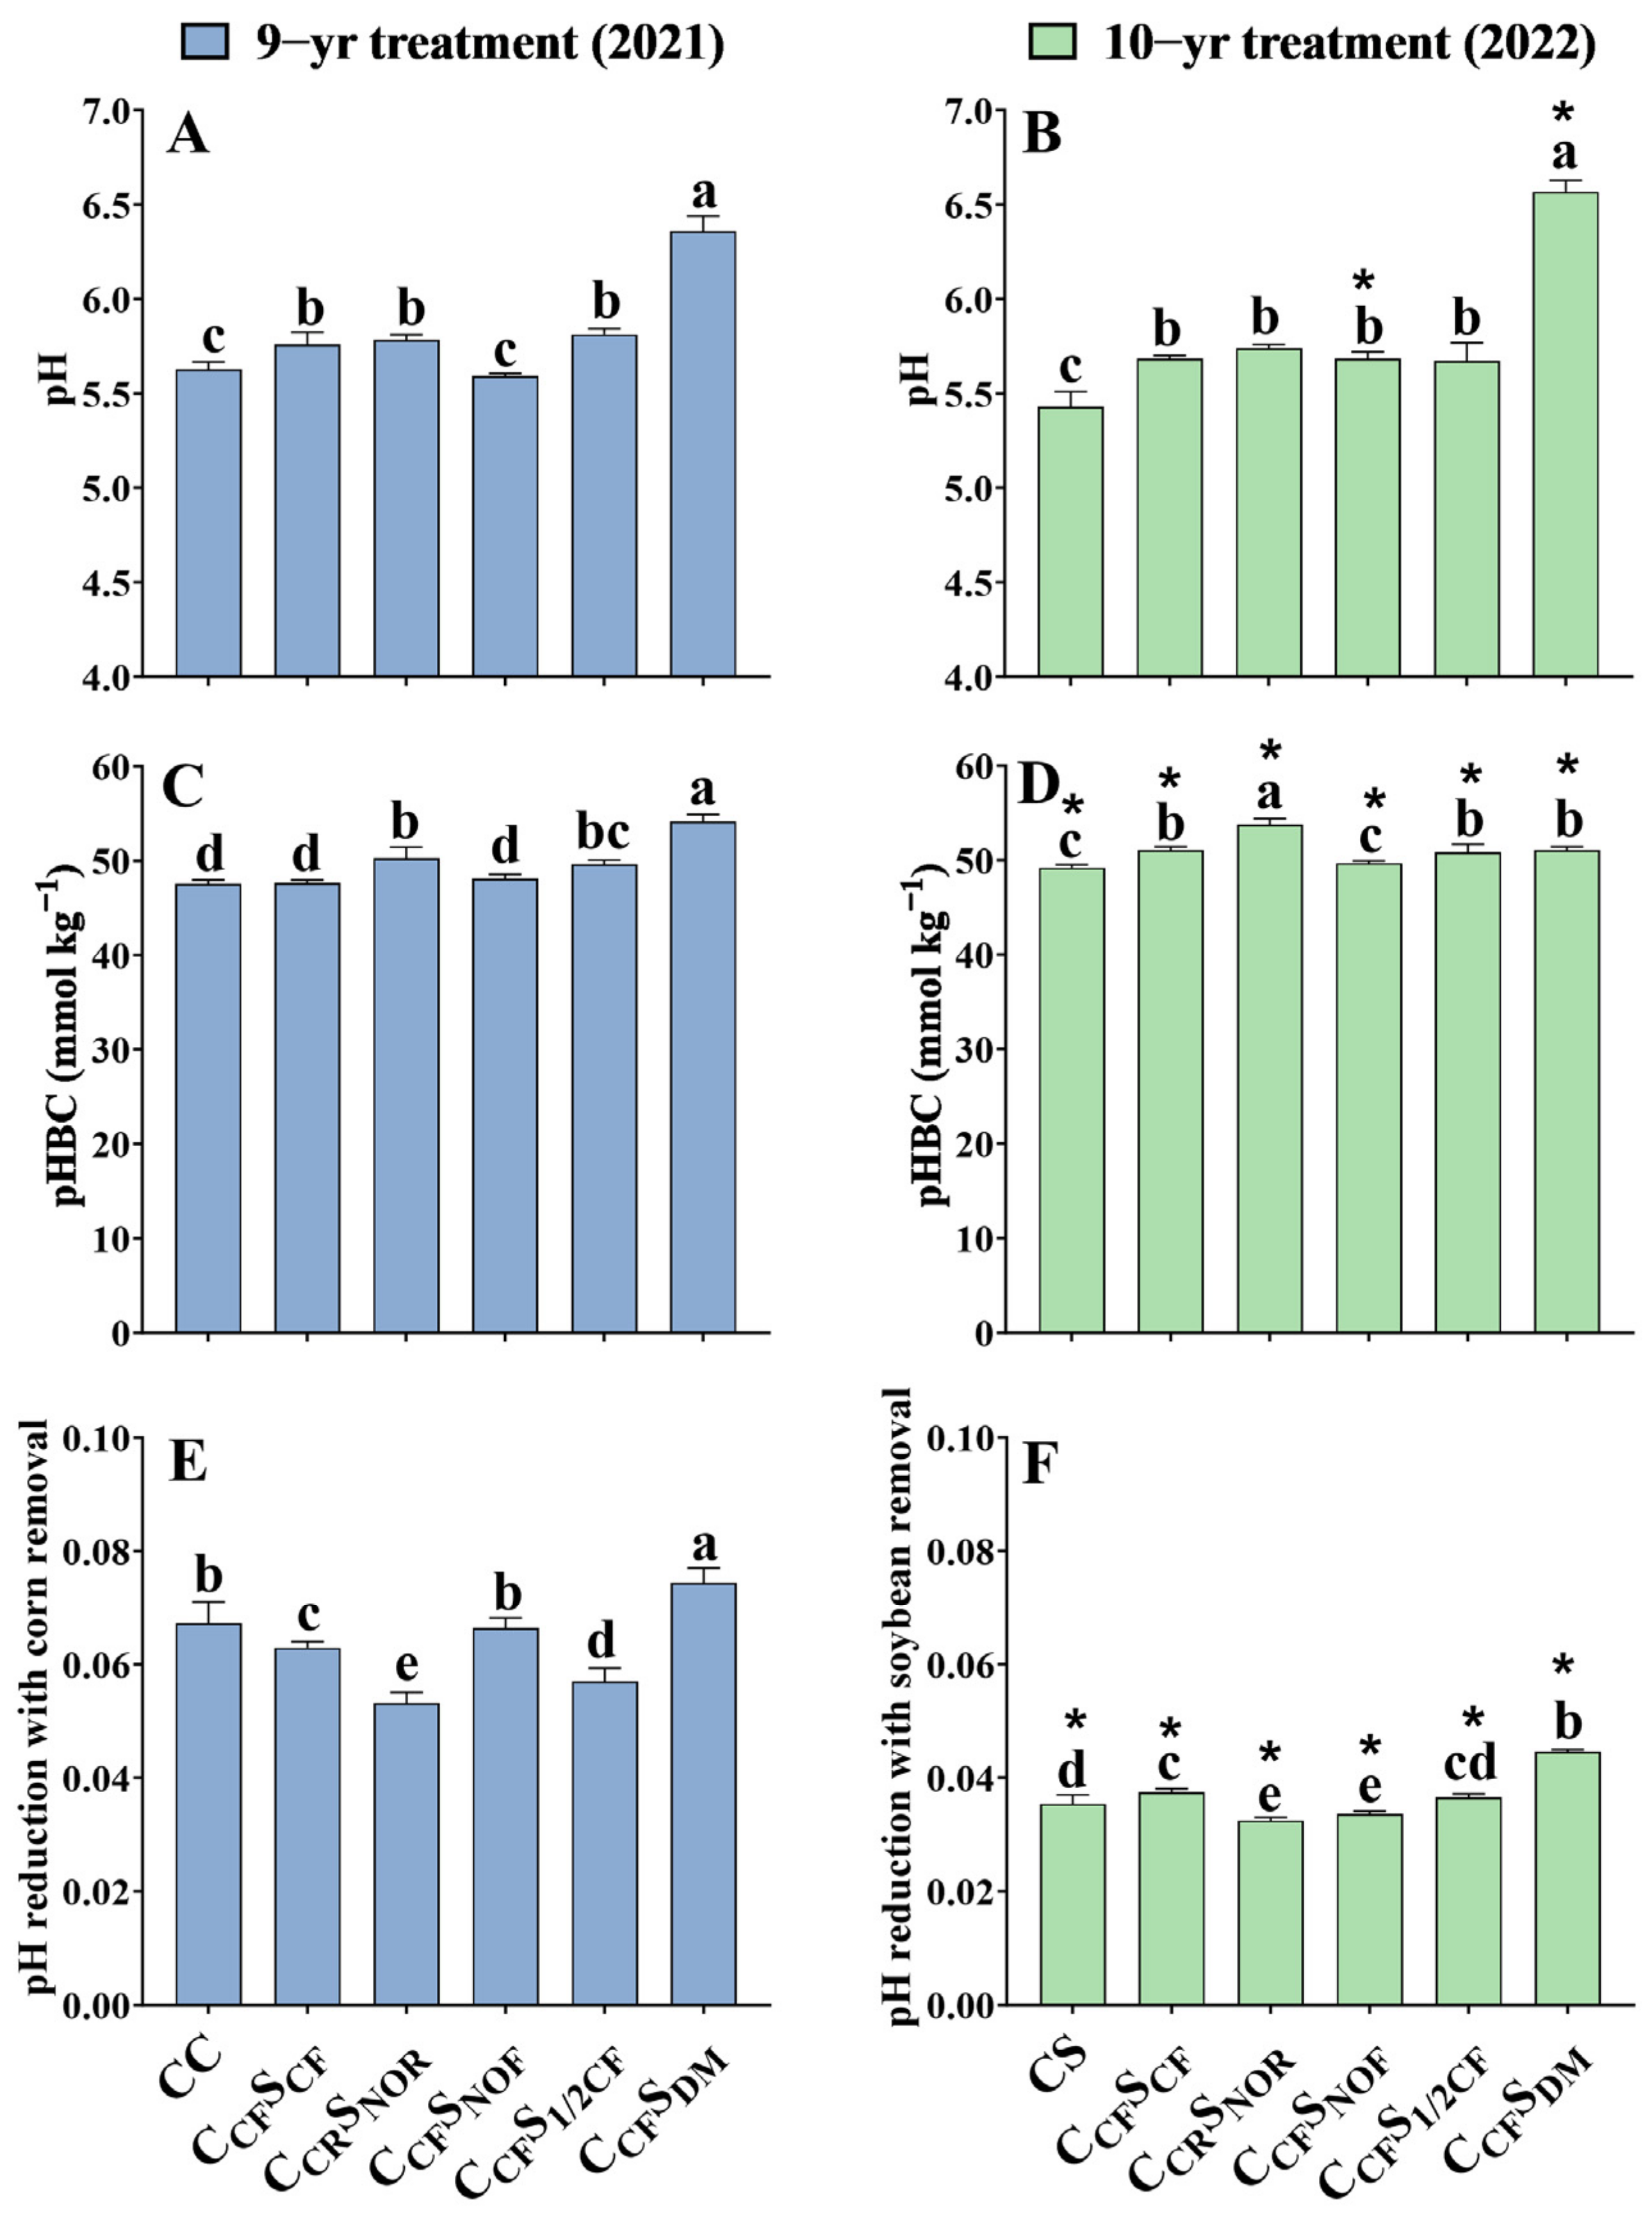
3.4. Soil pH, pHBC, and pH Reduction with Crop Removal

Soil pH in 9-year continuous corn (CC) and 10-year continuous soybean (CS) was considerably reduced by 0.13 and 0.25 units (p < 0.05) in comparison with CCFSCF, respectively (Figure 4A,B). Under corn–soybean rotation, compared with CCFSCF, CCFSNOF significantly decreased the soil pH by 0.17 units (p < 0.05) after 9-year treatment, but CCFSDM considerably increased soil pH by 0.60 and 0.89 units (p < 0.05) after 9- and 10-year treatment, respectively. No difference was found in CCFS1/2CF and CCRSNOR compared to CCFSCF after 9- and 10-year treatment. Furthermore, there was a consistent trend towards net H+ production with pH reduction.
Soil pHBC in 9-year continuous corn (CC) was not affected, while that of 10-year continuous soybean (CS) was 1.89 mmol kg−1 (p < 0.05) less than CCFSCF. Under crop rotation, compared to CCFSCF, the soil pHBC in CCRSNOR, CCFS1/2CF, and CCFSDM was considerably increased by 2.63, 2.01, and 6.51 mmol kg−1 (p < 0.05) after 9-year treatment. Similarly, compared to CCFSCF, the soil pHBC in CCRSNOR and CCFSDM was considerably increased by 2.68 and 1.13 mmol kg−1 (p < 0.05), but CCFSNOF was considerably decreased by 1.14 mmol kg−1 (p < 0.05) after 10-year treatment (Figure 4C,D). Moreover, the soil pHBC in corn was 0.96–1.07 times more than in soybean.
In general, the pH reduction with corn or soybean removal ranged from 0.053 to 0.074 and 0.032 to 0.045 pH units year−1 after 9- and 10-year treatment (Figure 4E,F).

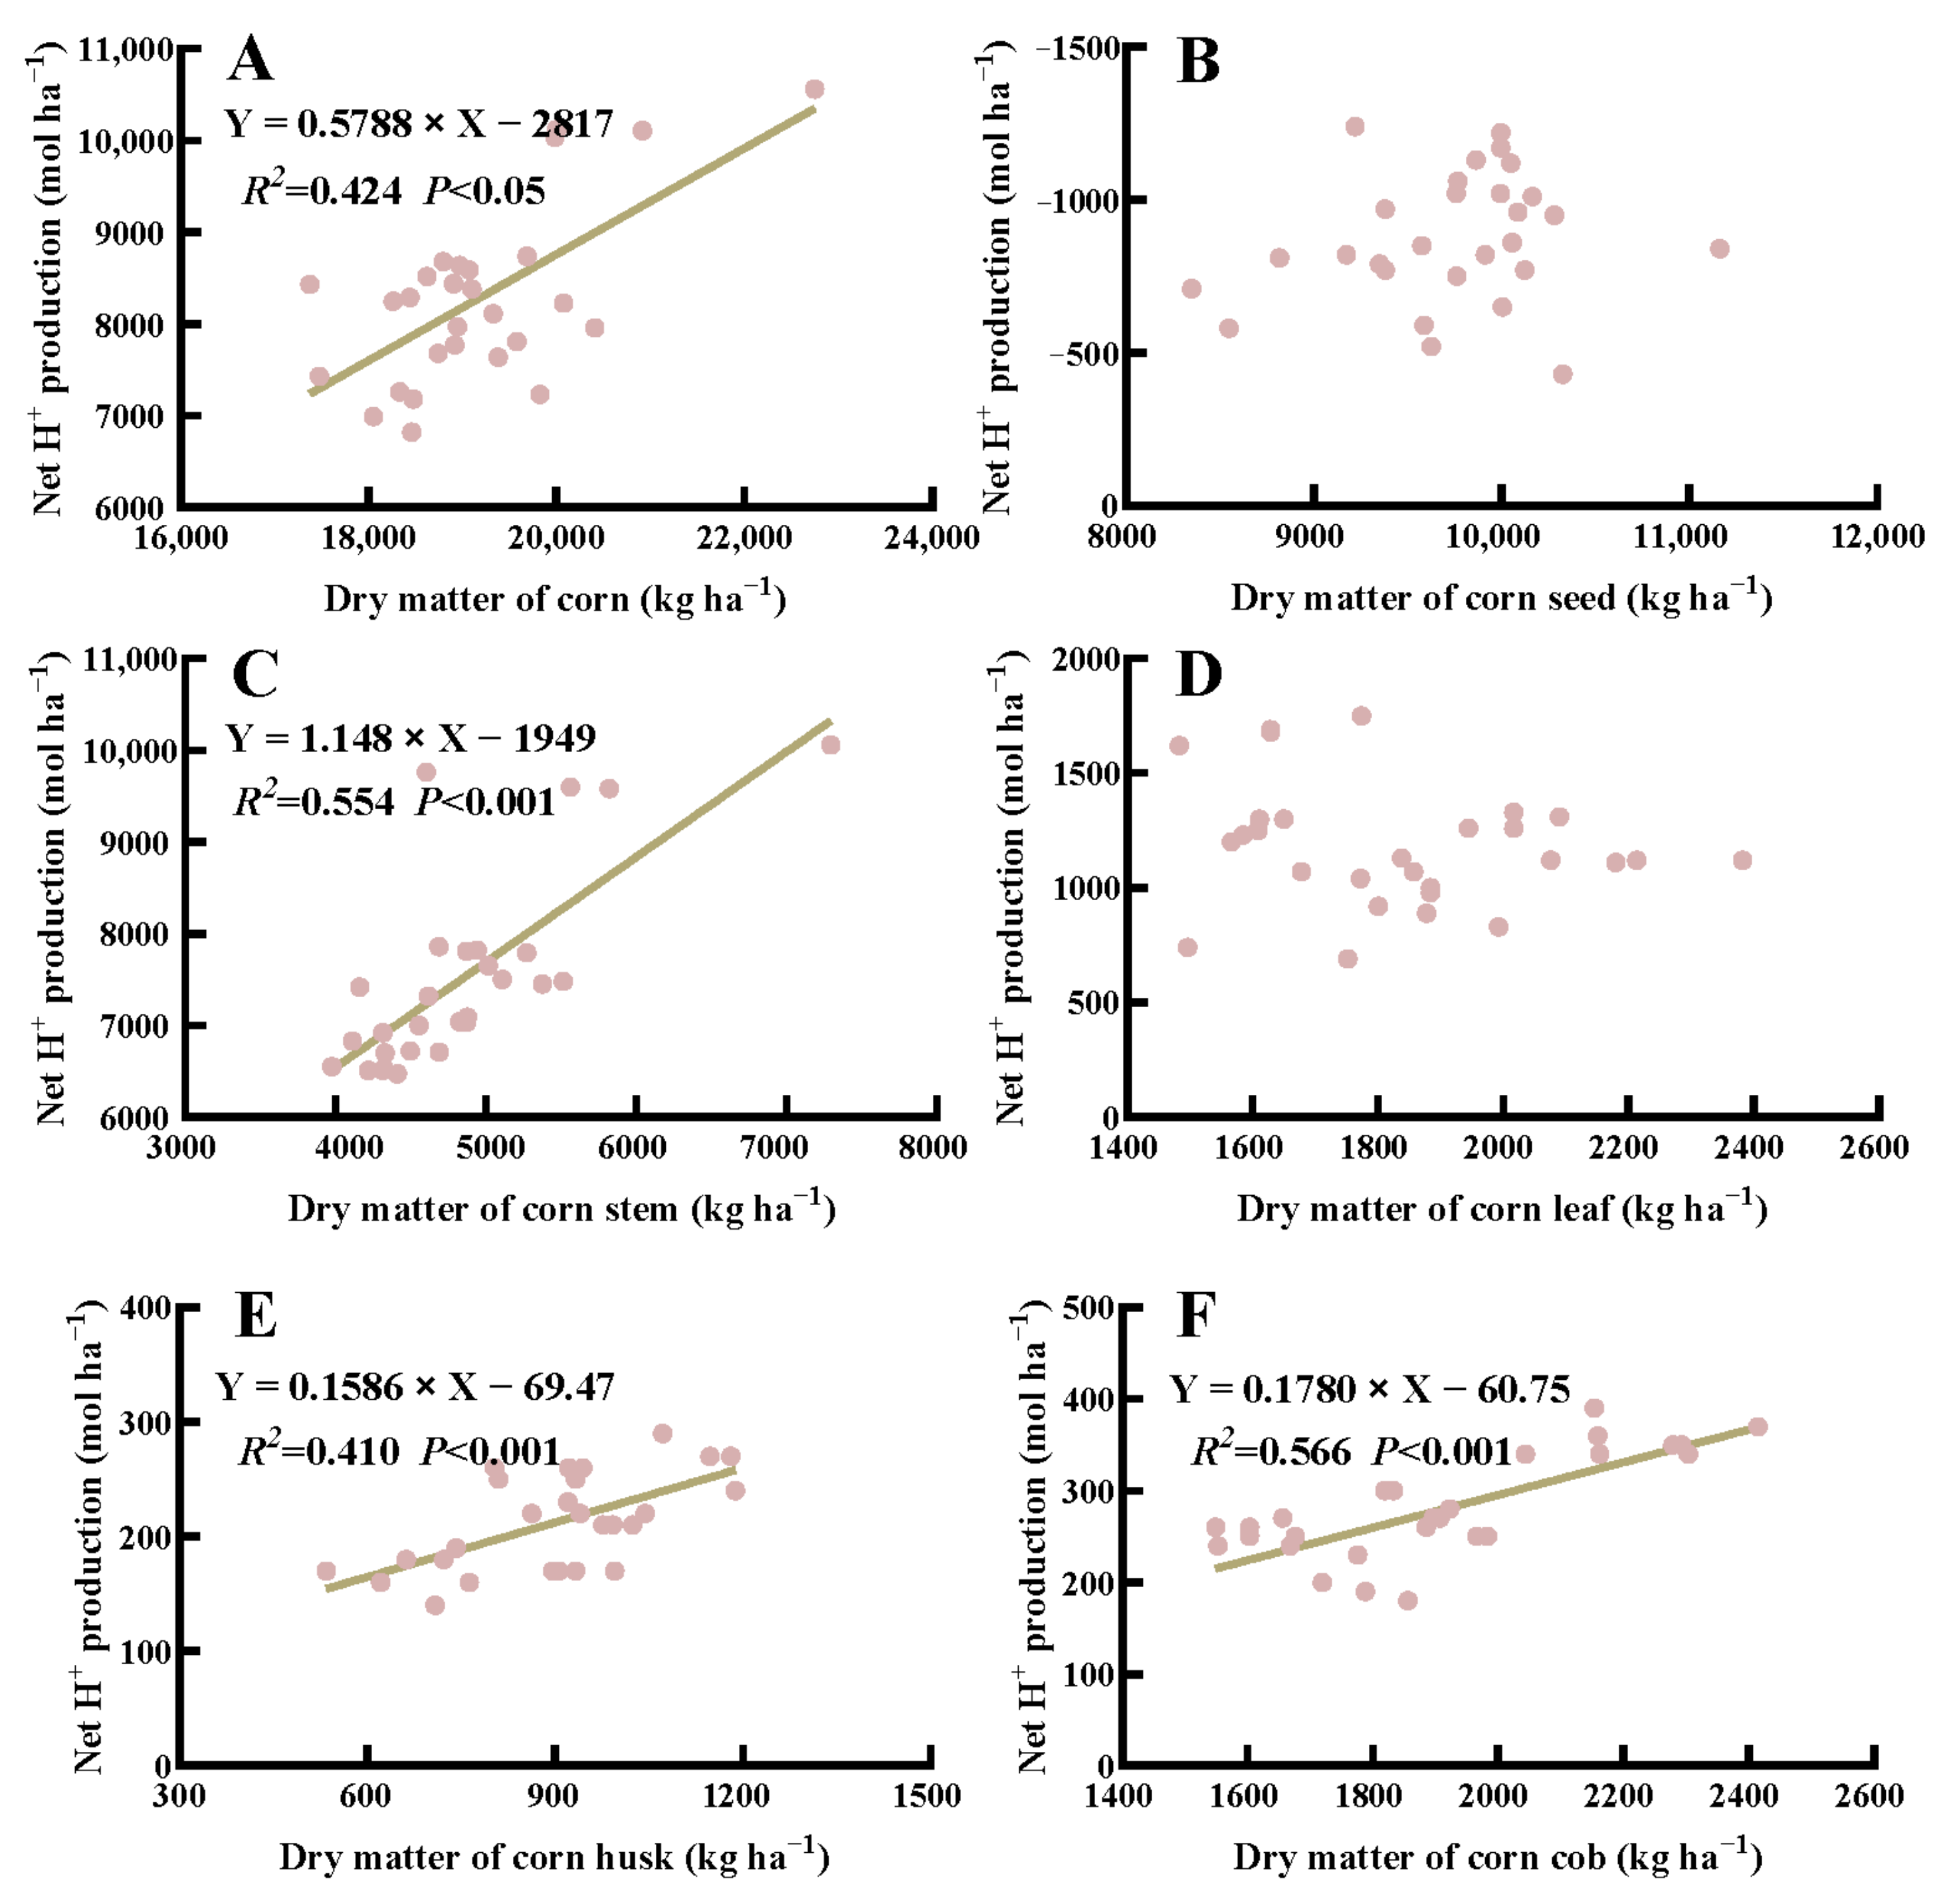
3.5. Correlations between Dry Weight and Net H+ Production in Crops

In general, the net H+ production in corn was positively correlated with above-ground dry matter under crop rotation and fertilization (p < 0.05) (Figure 5). Specifically, the net H+ production from stem, husk, and cob of corn was positively correlated with their respective dry weight (p < 0.001), whereas no significant correlation was detected in the seed and leaf dry weight of corn (p > 0.05). Additionally, there was a significant correlation between the net H+ production from above-ground dry matter, stem, seed, and pod wall and their corresponding dry weight in soybean (p < 0.001) (Figure 6).
More importantly, the total H+ production had a significant and positive correlation with K+ and Na+ (p < 0.001) but a negative correlation with Ca2+ and Mg2+ (p < 0.001) (Figure 7). Total OH production was positively correlated with SO42−, Cl, and H2PO4 (p < 0.001), while net H+ production was highly correlated with total H+ and total OH (p < 0.001).

4. Discussion

Harvesting of the produce permanently removes the soil’s base cations (K+, Ca2+, Na+, and Mg2+), which decreases soil buffer capacity (pHBC) and thus is one of the reasons for aggravating soil acidification [13,32]. In this study, corn removes 371–508 kmol ha−1 cations, while soybean removes 166–250 kmol ha−1 cations (Table 1). Continuously removing such a large amount of base cations would definitely reduce the soil pHBC. However, we discover that only continuous soybean and the combination of chemical fertilizer for corn but no chemical fertilizer for soybean reduce the soil pHBC, while other treatments increase the soil pHBC, except that there is no effect for continuous corn. In addition, despite the fact that the removal of cations in corn is 2.03–2.23 times more than in soybean, the soil pHBC in corn is not lower than in soybean (Figure 4). We thus speculate that the reduction in soil pHBC is management- and crop-dependent.
Among the four cations (K+, Ca2+, Na+, and Mg2+) in different tissues of crops, we find that K+ contributes more H+ but differs in the tissues of crops. K+ in the stem of corn accounts for over 55%, while K+ in the seed of soybean contributes more than 64% of the total H+ production. Though ion removal is dominated by the differences in crop biomass and not concentration [22,33]; dry matter accumulation and allocation in crops may affect their contributions [34,35]. The present study detects that tremendous K+ is accumulated in the corn stem, which is not translocated and redistributed to the seed, making it contribute more H+ production (Figure 2A,B).
Since corn biomass is much larger than that of soybean (Figure 1), the Ca2+ and Mg2+ removal of corn should consequently also be higher than that of soybean. However, the present study discovers that the sum of Ca2+ and Mg2+ removal in soybean is 1.26–2.07 higher than that in corn (Table 1). This indicates a greater accumulation of Ca2+ and Mg2+ in soybean. It has been reported that cereal crops without biological nitrogen fixation showed a greater preference for ammonium over base cations [36]. Thus, the removal of large amounts of exchangeable Ca2+ and Mg2+ in soybean may also contribute to the reduction in pHBC and pH under continuous soybean compared to the rotation treatment.
Atmospheric acid deposition, including N and sulfur (S) deposition, is another reason for soil acidification [37,38]. Nevertheless, increased NOx or SO2 is implicated in severe and extensive soil acidification in natural grasslands and forests, but not farmlands [39,40]. Actually, for a given area in agricultural land, the atmospheric acid deposition is almost the same and thus can be neglected when examining the effects of agronomic practices on soil acidification. In fact, in agroecosystems where crops are removed, the net H+ produced is the result of the unbalanced removal of anions and cations by crops [19]. In this study, the cations removed by corn and soybean are 3.41–4.16 and 2.86–3.06 times higher than the anions removed. Based on the calculation of the consumption of 2 mol H+ for 1 mol CaCO3, it will require 353–510 and 220–289 kg ha−1 of CaCO3 to neutralize this amount of net H+. In addition, the potential ability of crop anion and cation removal to contribute to soil acidification could be directly determined by biomass [41]. Pearson’s correlation analysis in the present study shows that the more productive the crop, the greater the net H+ production (Figure 5 and Figure 6). Corn, as a C4 plant, is more productive than soybean, and it produces 1.53–1.94 times more net H+ production than soybean in our study. However, compared to soybean planting, corn planting does not result in a significant decrease in soil pH. Similar results confirm that the leguminous crop has higher total acidification than gramineous species [12,42]. This might be in part due to the differences in physiological metabolism of crops.
Farm management practice and N fertilizer application accelerate soil acidification. Soil pH reduction resulting from a continuous cropping system has been identified [43,44]. The present study also finds a greater soil pH decline in continuous corn and soybean than in the rotational corn–soybean system (Figure 4). However, this might not be fully related to crop removal. It is generally recognized that crop biomass under continuous cropping systems is lower than that under rotational cropping systems [45,46,47]. Consequently, biomass and net H+ in a rotational cropping system will be greater than in continuous cropping systems. However, there is no difference in biomass for continuous corn and corn in rotation with normal fertilizer in this study, while net H+ production is lower in rotational corn. This might be due to less total H+ production and more total OH production in corn rotation (Figure 1). Additionally, H+ produced by corn removal in continuous corn only contributes 0.067 year−1 pH to soil acidification (Figure 4). Therefore, we propose that the main reason for soil acidification for continuous corn is the application rate of N fertilizer rather than corn removal, and rotational practice is beneficial for alleviating soil acidification.
The degree of acidity caused by N fertilizer application is related to its forms, such as amide N, ammonium N, and nitrate N fertilizer, and their transformation process in soil, especially the nitrification process [48,49]. The N fertilizer applied in our study is urea and diammonium phosphate, which is amide and ammonium N. After entering the soil, amide N hydrolyzes NH4+−N. When 1 mol NH4+−N is produced, 1 mol H+ is consumed, but the resulting NH4+−N will continue to oxidize to NO3−N under nitrifying microorganisms, and 2 mol H+ is released for 1 mol NO3−N generated. Therefore, the total process will decrease soil pH [3,50]. Additionally, for diammonium phosphate, when NH4+−N is absorbed by a crop or volatilized in the form of ammonia, equivalent H+ also will be released [51]. Thus, the release of H+ from a series of chemical reactions following N fertilizer application is one of the main reasons for soil acidification in continuous corn. On the other hand, soil pH in continuous soybean is 0.25 pH units lower than in corn–soybean rotation, even though biomass and net H+ production in continuous soybean is lower than in corn–soybean rotation. Due to ammonophilic characteristics and N2 fixation, legumes release H+, thereby exacerbating soil acidification [52,53].
Straw return is thought to replenish the assimilated base cations (BCs), and therefore, BC-rich straw return is frequently recommended for mitigating soil acidification [9,20]. However, a meta-analysis of 145 investigated field experiments indicates that straw return exacerbates soil acidification in major Chinese croplands, while straw decomposition also increases the levels of CO2 (i.e., H2CO3) and organic acid in the soil [54]. In this study, there is no difference in soil pH between corn or soybean straw return and normal fertilizer application. Thus, the effect of straw return on soil pH change might be dependent on the alkalinity and N content of the plant materials, straw decomposition rate, and initial soil pH [54,55,56,57]. Another possible cause of the pH increase by manure application is the addition of basic cations (e.g., Ca2+, Mg2+, K+, and Na+) through the application of manure [58]. The addition of organic material could mitigate soil acidification by compensating for the loss of soil alkalinity due to the removal of agricultural products [59]. In this study, soil pH in manure application is higher than in normal fertilizer application (Figure 4). It has been confirmed that during the decomposition of manure, the ammonification of labile organic N and decarboxylation are the mechanisms that result in H+ consumption that can mitigate acidification [60]. The addition of a N source at a rate of 300 kg N ha−1 to the red soil with 70% N from manure fully prevents the decline in soil pH, and the H+ produced during acidification is equivalent to adding 13.8 kmol OH ha−1 to the red soil [9]. Thus, the alkalinizing effect of the organic fertilizer could mitigate the acidification process, and manure application is an effective approach for alleviating soil acidification.

5. Conclusions

After 9- and 10-year treatment, the total removal of cations in corn and soybean is several times higher than anions, which leads to the production of 7.06–10.2 kmol ha−1 H+ for corn and 4.43–5.77 kmol ha−1 H+ for soybean. Among the four cations (K+, Ca2+, Na+, and Mg2+) in different tissues of crops, K+ in corn stem and soybean seed contributes more to the total H+ production. The sum of Ca2+ and Mg2+ removal for soybean is 1.26–2.07 times higher than for corn. Continuous soybean and the combination of chemical fertilizer for corn but no chemical fertilizer for soybean reduce the soil pH buffering capacity (pHBC), while other treatments increase the soil pHBC, except that there is no effect for continuous corn. The greater the corn or soybean biomass, the higher the net H+ production. Net H+ might not be fully related to pH reduction; corn and soybean removal potentially lead to a soil acidification of 0.053–0.074 and 0.032–0.045 year−1 units, respectively. Continuous corn and soybean reduce soil pH, especially soybean, while chemical fertilizer for corn and dairy manure for soybean increase soil pH. Manure application with crop rotation is an effective approach for alleviating soil acidification.

Author Contributions

Funding acquisition, conceptualization, and writing—review and editing, X.L.; conceptualization and data curation, J.J., X.Z. and G.W.; data collection, data curation, and methodology, Z.Y. and Y.L.; writing—original draft preparation, Y.X. All authors have read and agreed to the published version of the manuscript.

Funding

This research is funded by Mechanism of the World Mollisols Degradation and Control (131323KYSB20210004), Chinese Academy of Sciences.

Data Availability Statement

The data presented in this study are available on request from the corresponding author.

Acknowledgments

We thank the anonymous reviewers and editors for their constructive comments on this manuscript.

Conflicts of Interest

The authors declare no conflicts of interest.

References

  1. Van Breemen, N.; Driscoll, C.T.; Mulder, J. Acidic deposition and internal proton sources in acidification of soils and waters. Nature 1984, 307, 599–604. [Google Scholar] [CrossRef]
  2. Dong, Y.; Yang, J.; Zhao, X.; Yang, S.; Zhang, G. Contribution of different proton sources to the acidification of red soil with maize cropping in subtropical China. Geoderma 2021, 392, 114995. [Google Scholar] [CrossRef]
  3. De Vries, W.; Breeuwsma, A. The relation between soil acidification and element cycling. Water Air Soil Pollut. 1987, 35, 293–310. [Google Scholar] [CrossRef]
  4. Berner, R.A. Weathering, plants, and the long-term carbon cycle. Geochim. Cosmochim. Acta 1992, 56, 3225–3231. [Google Scholar] [CrossRef]
  5. Guo, J.; Liu, X.; Zhang, Y.; Shen, J.; Han, W.; Zhang, W.; Christie, P.; Goulding, K.W.T.; Vitousek, P.M.; Zhang, F. Significant acidification in major Chinese croplands. Science 2010, 327, 1008–1009. [Google Scholar] [CrossRef] [PubMed]
  6. Wu, Z.; Sun, X.; Sun, Y.; Yan, J.; Zhao, Y.; Chen, J. Soil acidification and factors controlling topsoil pH shift of cropland in central China from 2008 to 2018. Geoderma 2021, 408, 115586. [Google Scholar] [CrossRef]
  7. Zhu, Q.; Liu, X.; Hao, T.; Zeng, M.; Shen, J.; Zhang, F.; De Vries, W. Modeling soil acidification in typical Chinese cropping systems. Sci. Total Environ. 2018, 613, 1339–1348. [Google Scholar] [CrossRef]
  8. Zhang, Y.; Ye, C.; Su, Y.; Peng, W.; Lu, R.; Liu, Y.; Huang, H.; He, X.; Yang, M.; Zhu, S. Soil Acidification caused by excessive application of nitrogen fertilizer aggravates soil-borne diseases: Evidence from literature review and field trials. Agric. Ecosyst. Environ. 2022, 340, 108176. [Google Scholar] [CrossRef]
  9. Cai, Z.; Wang, B.; Xu, M.; Zhang, H.; He, X.; Zhang, L.; Gao, S. Intensified soil acidification from chemical N fertilization and prevention by manure in an 18-year field experiment in the red soil of southern China. J. Soils Sediments 2015, 15, 260–270. [Google Scholar] [CrossRef]
  10. Cai, Z.; Wang, B.; Xu, M.; Zhang, H.; Zhang, L.; Gao, S. Nitrification and acidification from urea application in red soil (Ferralic Cambisol) after different long-term fertilization treatments. J. Soils Sediments 2014, 14, 1526–1536. [Google Scholar] [CrossRef]
  11. Schroder, J.L.; Zhang, H.; Girma, K.; Raun, W.R.; Penn, C.J.; Payton, M.E. Soil acidification from long-term use of nitrogen fertilizers on winter wheat. Soil Sci. Soc. Am. J. 2011, 75, 957–964. [Google Scholar] [CrossRef]
  12. Vieira, F.C.B.; Bayer, C.; Mielniczuk, J.; Zanatta, J.; Bissani, C.A. Long-term acidification of a Brazilian Acrisol as affected by no till cropping systems and nitrogen fertiliser. Soil Res. 2008, 46, 17–26. [Google Scholar] [CrossRef]
  13. Barak, P.; Jobe, B.O.; Krueger, A.R.; Peterson, L.A.; Laird, D.A. Effects of long-term soil acidification due to nitrogen fertilizer inputs in Wisconsin. Plant Soil 1997, 197, 61–69. [Google Scholar] [CrossRef]
  14. Tarkalson, D.D.; Payero, J.O.; Hergert, G.W.; Cassman, K.G. Acidification of soil in a dry land winter wheat-sorghum/corn-fallow rotation in the semiarid US Great Plains. Plant Soil 2006, 283, 367–379. [Google Scholar] [CrossRef]
  15. Zhang, F.; Cui, Z.; Fan, M.; Zhang, W.; Chen, X.; Jiang, R. Integrated soil-crop system management, reducing environmental risk while increasing crop productivity and improving nutrient use efficiency in China. J. Environ. Qual. 2011, 40, 1051–1057. [Google Scholar] [CrossRef] [PubMed]
  16. Zhang, X. A plan for efficient use of nitrogen fertilizers. Nature 2017, 543, 322–323. [Google Scholar] [CrossRef]
  17. Hassan, F.; Ali, E.F.; Mahfouz, S. Comparison between different fertilization sources, irrigation frequency and their combinations on the growth and yield of coriander plant. Aust. J. Basic Appl. Sci. 2012, 6, 600–615. [Google Scholar]
  18. Xu, R.; Zhao, A.; Yuan, J.; Jiang, J. pH buffering capacity of acid soils from tropical and subtropical regions of China as influenced by incorporation of crop straw biochars. J. Soils Sediments 2012, 12, 494–502. [Google Scholar] [CrossRef]
  19. Hinsinger, P.; Plassard, C.; Tang, C.; Jaillard, B. Origins of root-mediated pH changes in the rhizosphere and their responses to environmental constraints, A review. Plant Soil 2003, 248, 43–59. [Google Scholar] [CrossRef]
  20. Dong, Y.; Yang, J.; Zhao, X.; Yang, S.; Mulder, J.; Dorsch, P.; Peng, X.; Zhang, G. Soil acidification and loss of base cations in a subtropical agricultural watershed. Sci. Total Environ. 2022, 827, 154338. [Google Scholar] [CrossRef] [PubMed]
  21. Hao, T.X.; Zhu, Q.; Zeng, M.; Shen, J.; Shi, X.; Liu, X.; Zhang, F.; de Vries, W. Quantification of the contribution of nitrogen fertilization and crop harvesting to soil acidification in a wheat-maize double cropping system. Plant Soil 2018, 434, 167–184. [Google Scholar] [CrossRef]
  22. Hao, T.; Liu, X.; Zhu, Q.; Zeng, M.; Chen, X.; Yang, L.; Shen, J.; Shi, X.; Zhang, F.; de Vries, W. Quantifying drivers of soil acidification in three Chinese cropping systems. Soil Tillage Res. 2022, 215, 105230. [Google Scholar] [CrossRef]
  23. Liu, X.; Burras, C.L.; Kravchenko, Y.S.; Duran, A.; Huffman, T.; Morras, H.; Studdert, G.; Zhang, X.; Cruse, R.; Yuan, X. Overview of Mollisols in the world: Distribution, land use and management. Can. J. Soil Sci. 2012, 92, 383–402. [Google Scholar] [CrossRef]
  24. Ding, J.; Ma, M.; Jiang, X.; Liu, Y.; Zhang, J.; Suo, L.; Wang, L.; Wei, D.; Li, J. Effects of applying inorganic fertilizer and organic manure for 35 years on the structure and diversity of ammonia-oxidizing archaea communities in a Chinese Mollisols field. Microbiol. Open 2020, 9, 1–11. [Google Scholar] [CrossRef]
  25. Ma, M.; Jiang, X.; Wang, Q.; Ongena, M.; Wei, D.; Ding, J.; Guan, D.; Cao, F.; Zhao, B.; Li, J. Responses of fungal community composition to long-term chemical and organic fertilization strategies in Chinese Mollisols. Microbiol. Open 2018, 7, e597. [Google Scholar] [CrossRef] [PubMed]
  26. Zhao, Y.; Xu, X.; Huang, B.; Zheng, H.; Deng, W. Uncertainty assessment for mapping changes in soil organic matter using sparse legacy soil data and dense new-measured data in a typical black soil region of China. Environ. Earth Sci. 2015, 73, 197–207. [Google Scholar] [CrossRef]
  27. Zhou, J.; Guan, D.; Zhou, B.; Zhao, B.; Ma, M.; Qin, J.; Jiang, X.; Chen, S.; Cao, F.; Shen, D.; et al. Influence of 34-years of fertilization on bacterial communities in an intensively cultivated black soil in northeast China. Soil Biol. Biochem. 2015, 90, 42–51. [Google Scholar] [CrossRef]
  28. Zhou, J.; Jiang, X.; Zhou, B.; Zhao, B.; Ma, M.; Guan, D.; Li, J.; Chen, S.; Cao, F.; Shen, D.; et al. Thirty-four years of nitrogen fertilization decreases fungal diversity and alters fungal community composition in black soil in northeast China. Soil Biol. Biochem. 2016, 95, 135–143. [Google Scholar] [CrossRef]
  29. Dabessa, A.; Debala, C. Long-term soybean-maize rotation experiments in cereal-based farming systems at Bako, Western Ethiopia. Food Energy Secur. 2023, 12, 1–13. [Google Scholar] [CrossRef]
  30. Posch, M.; Reinds, G.J. A very simple dynamic soil acidification model for scenario analyses and target load calculations. Environ. Model. Softw. 2009, 24, 329–340. [Google Scholar] [CrossRef]
  31. Verstraten, J.M.; Dopheide, J.C.R.; Duysings, J.J.H.M.; Tietema, A.; Bouten, W. The proton cycle of a deciduous forest ecosystem in the Netherlands and its implications for soil acidification. Plant Soil 1990, 127, 61–69. [Google Scholar] [CrossRef]
  32. Lesturgez, G.; Poss, R.; Noble, A.; Grünberger, O.; Chintachao, W.; Tessier, D. Soil acidification without pH drop under intensive cropping systems in Northeast Thailand. Agric. Ecosyst. Environ. 2006, 114, 239–248. [Google Scholar] [CrossRef]
  33. Houx, J.H.; Wiebold, W.J.; Fritschi, F.B. Rotation and tillage affect soybean grain composition, yield, and nutrient removal. Field Crop. Res. 2014, 164, 12–21. [Google Scholar] [CrossRef]
  34. Osaki, M.; Morikawa, K.; Shinano, T.; Urayama, M.; Tadano, T. Productivity of high-yielding crops. II. Comparison of N, P, K, Ca, and Mg accumulation and distribution among high-yielding crops. Soil Sci. Plant Nutr. 1991, 37, 445–454. [Google Scholar] [CrossRef]
  35. Xu, Z.; Lai, T.; Li, S.; Si, D.; Zhang, C.; Cui, Z.; Chen, X. Promoting potassium allocation to stalk enhances stalk bending resistance of maize (Zea mays L.). Field Crop. Res. 2018, 215, 200–206. [Google Scholar] [CrossRef]
  36. Noble, A.D.; Suzuki, S.; Soda, W.; Ruaysoongnern, S.; Berthelsen, S. Soil acidification and carbon storage in fertilized pastures of Northeast Thailand. Geoderma 2008, 144, 248–255. [Google Scholar] [CrossRef]
  37. Zhang, Q.; Zhu, J.; Wang, Q.; Mulder, J.; Liu, C.; He, N. Transformation from NHx to NOy deposition aggravated China’s forest soil acidification. Glob. Biogeochem. Cycle 2023, 37, 1–10. [Google Scholar] [CrossRef]
  38. Duan, L.; Chen, X.; Ma, X.; Zhao, B.; Larssen, T.; Wang, S.; Ye, Z. Atmospheric S and N deposition relates to increasing riverine transport of S and N in southwest China, Implications for soil acidification. Environ. Pollut. 2016, 218, 1191–1199. [Google Scholar] [CrossRef]
  39. Yang, Y.; Ji, C.; Ma, W.; Wang, S.; Wang, S.; Han, W.; Mohammat, A.; Robinson, D.; Smith, P. Significant soil acidification across northern China’s grasslands during 1980s–2000s. Glob. Chang. Biol. 2012, 18, 2292–2300. [Google Scholar] [CrossRef]
  40. Zhang, Q.; Wang, Q.; Zhu, J.; Xu, L.; Li, M.; Rengel, Z.; Xiao, J.; Hobbie, E.A.; Piao, S.; Luo, W.; et al. Higher soil acidification risk in southeastern Tibetan Plateau. Sci. Total Environ. 2021, 755, 143372. [Google Scholar] [CrossRef]
  41. Randall, P.J.; Abaidoo, R.C.; Hocking, P.J.; Sanginga, N. Mineral nutrient uptake and removal by cowpea, soybean and maize cultivars in West Africa, and implications for carbon cycle effects on soil acidification. Exp. Agric. 2006, 42, 475–494. [Google Scholar] [CrossRef]
  42. Slattery, W.J.; Ridley, A.M.; Windsor, S.M. Ash alkalinity of animal and plant products. Aust. J. Exp. Agric. 1991, 31, 321–324. [Google Scholar] [CrossRef]
  43. Hickman, M.V. Long-term tillage and crop rotation effects on soil chemical and mineral properties. J. Plant Nutr. 2002, 25, 1457–1470. [Google Scholar] [CrossRef]
  44. White, A.; Darby, H.; Ruhl, L.; Sands, B. Long-term influence of alternative corn cropping practices and corn-hay rotations on soil health, yields and forage quality. Front. Environ. Sci. 2023, 11, 1–19. [Google Scholar] [CrossRef]
  45. Behnke, G.D.; Zuber, S.M.; Pittelkow, C.M.; Nafziger, E.D.; Villamil, M.B. Long-term crop rotation and tillage effects on soil greenhouse gas emissions and crop production in Illinois, USA. Agric. Ecosyst. Environ. 2018, 261, 62–70. [Google Scholar] [CrossRef]
  46. Kazula, M.J.; Lauer, J.G. The influence of crop rotation on corn total biomass production. J. Soil Water Conserv. 2018, 73, 541–548. [Google Scholar] [CrossRef]
  47. Sainju, U.M.; Lenssen, A.W.; Allen, B.L.; Jabro, J.D.; Stevens, W.B. Crop water and nitrogen productivity in response to long-term diversified crop rotations and management systems. Agric. Water Manag. 2021, 257, 107149. [Google Scholar] [CrossRef]
  48. Dal Molin, S.J.; Ernani, P.R.; Gerber, J.M. Soil acidification and nitrogen release following application of nitrogen fertilizers. Commun. Soil Sci. Plant Anal. 2020, 51, 2551–2558. [Google Scholar] [CrossRef]
  49. Fujii, K.; Toma, T.; Sukartiningsih. Comparison of soil acidification rates under different land uses in Indonesia. Plant Soil 2021, 465, 1–17. [Google Scholar] [CrossRef]
  50. Wang, Z.; Tao, T.; Wang, H.; Chen, J.; Small, G.E.; Johnson, D.; Chen, J.; Zhang, Y.; Zhu, Q.; Zhang, S.; et al. Forms of nitrogen inputs regulate the intensity of soil acidification. Glob. Chang. Biol. 2023, 29, 4044–4055. [Google Scholar] [CrossRef]
  51. Wang, H.; Zhang, H.; Zhao, Y.; Xu, R. Soil acidification of alfisols influenced by nitrate and ammonium nitrogen level in tea plantation. Int. J. Agric. Biol. Eng. 2018, 11, 168–172. [Google Scholar] [CrossRef]
  52. Bolan, N.S.; Hedley, M.J.; White, R.E. Processes of soil acidification during nitrogen cycling with emphasis on legume-based pastures. Plant Soil 1991, 134, 53–63. [Google Scholar] [CrossRef]
  53. Vieira, F.C.B.; Bayer, C.; Zanatta, J.; Ernani, P.R. Organic matter kept Al toxicity low in a subtropical no-tillage soil under long-term (21-year) legume-based crop systems and N fertilisation. Soil Res. 2009, 47, 707–714. [Google Scholar] [CrossRef]
  54. Liang, F.; Li, B.; Vogt, R.D.; Mulder, J.; Song, H.; Chen, J.; Guo, J. Straw return exacerbates soil acidification in major Chinese croplands. Resour. Conserv. Recycl. 2023, 198, 107176. [Google Scholar] [CrossRef]
  55. Wang, N.; Xu, R.; Li, J. Amelioration of an acid Ultisol by agricultural by-products. Land Degrad. Dev. 2011, 22, 513–518. [Google Scholar] [CrossRef]
  56. Noble, A.D.; Randall, P.J. Alkalinity effects of different tree litters incubated in an acid soil of NSW, Australia. Agrofor. Syst. 1999, 46, 147–160. [Google Scholar] [CrossRef]
  57. Tang, C.; Sparling, G.P.; McLay, C.D.A.; Raphael, C. Effect of short-term legume residue decomposition on soil acidity. Aust. J. Soil Res. 1999, 37, 561–573. [Google Scholar]
  58. Naramabuye, F.X.; Haynes, R.J. Effect of organic amendments on soil pH and Al solubility and use of laboratory indices to predict their liming effect. Soil Sci. 2006, 171, 754–763. [Google Scholar] [CrossRef]
  59. Hue, N.V. Alleviating soil acidity with crop residues. Soil Sci. 2011, 176, 543–549. [Google Scholar] [CrossRef]
  60. Ano, A.O.; Ubochi, C.I. Neutralization of soil acidity by animal manures, mechanism of reaction. Afr. J. Biotechnol. 2007, 6, 364–368. [Google Scholar]
Figure 1. Effect of long-term management on crop biomass, seed yield, total H+, OH, and net H+ production after 9- and 10-year treatment. (A,C,E,G,I) indicate biomass, seed yield, total H+, OH, and net H+ production in corn per hectare after 9-year treatment (2021), respectively. (B,D,F,H,J) indicate biomass, seed yield, total H+, OH, and net H+ production in soybean per hectare after 10-year treatment (2022), respectively. Error bars represent standard deviation (SD). Different letters above columns indicate significant differences in different treatments (p < 0.05).
Agronomy 14 00191 g001
Figure 2. Percentage of total H+ in different tissues of corn (seed, stem, leaf, husk, and cob) and soybean (seed, stem, and pod wall) after 9- and 10-year treatment among different treatments (A,B). The total H+ production in corn stem and soybean seed (C,D). The percentage of H+ produced by corresponding cations (K+, Ca2+, Na+, and Mg2+) in corn stem (E) and in soybean seed (F) after 9- and 10-year treatment among different treatments. Error bars represent standard deviation (SD). Different letters indicate significant differences in different treatments (p < 0.05).
Agronomy 14 00191 g002
Figure 3. Percentage of total OH in various tissues of corn (seed, stem, leaf, husk, and cob) and soybean (seed, stem, and pod wall) after 9- and 10-year treatments (A,B). The total OH production in corn soybean seed (C,D). The percentage of OH produced by corresponding anions (SO42−, Cl, and H2PO4) in the seed of corn (E) and soybean (F) after 9- and 10-year treatment among different treatments. Error bars represent standard deviation (SD). Different letters indicate significant differences in different treatments (p < 0.05).
Agronomy 14 00191 g003
Figure 4. The pH, pH buffer capacity (pHBC), and potential pH reduction with crop removal in Mollisols after 9-year (A,C,E) and 10-year (B,D,F) treatment among different treatments. Error bars represent standard deviation (SD). Different lowercase letters above columns indicate significant differences between different treatments (p < 0.05). Asterisks indicate significant differences between years (p < 0.05).
Agronomy 14 00191 g004
Figure 5. Correlation between net H+ produced by the total above-ground biomass (A), seed (B), stem (C), leaf (D), husk (E), and cob (F) of corn and the corresponding dry weight.
Agronomy 14 00191 g005
Figure 6. Correlation between net H+ produced by the total above-ground biomass (A), seed (B), stem (C), and pod wall (D) of soybean and the corresponding dry weight.
Agronomy 14 00191 g006
Figure 7. Correlation between the production of total H+, total OH, and net H+ and ion removal in the crop in different treatments. Asterisks indicate significant differences (* p < 0.05 and ** p < 0.01).
Agronomy 14 00191 g007
Table 1. Total content of cations/anions for corn in 2021 and for soybean in 2022.
TreatmentK+Na+Ca2+Mg2+SO42−ClH2PO4
kg ha−1
Corn (2021)CC368 c1.59 c16.1 b24.4 b20.5 b16.4 c70.2 b
CCFSCF381 b2.16 a7.69 d21.9 c20.4 b22.3 b72.3 b
CCFS1/2CF329 e1.34 d18.9 a21.2 c19.2 bc13.6 d65.2 c
CCFSNOF337 d1.65 c18.7 a26.5 a18.2 c15.7 c58.5 d
CCRSNOR342 d1.83 b9.70 c21.6 c20.7 b23.6 a66.0 c
CCFSDM463 a2.26 a19.8 a22.2 c22.4 a22.4 b80.2 a
Soybean (2022)CS128 d0.22 b30.4 e25.2 d16.3 c6.87 e38.9 e
CCFSCF149 b0.30 a31.8 d29.4 b20.4 a7.42 cd42.4 c
CCFS1/2CF133 c0.24 b34.8 c30.1 a18.2 b7.79 bc43.3 b
CCFSNOF109 e0.17 c28.9 f28.1 c14.0 d7.26 de34.3 f
CCRSNOR134 c0.22 b35.8 b22.9 e15.9 c7.97 b40.4 d
CCFSDM183 a0.17 c38.8 a28.1 c20.4 a9.70 a51.8 a
Note: Different letters indicate significant differences in different treatments (p < 0.05).
Disclaimer/Publisher’s Note: The statements, opinions and data contained in all publications are solely those of the individual author(s) and contributor(s) and not of MDPI and/or the editor(s). MDPI and/or the editor(s) disclaim responsibility for any injury to people or property resulting from any ideas, methods, instructions or products referred to in the content.

