Article

Analysis of Crop Irrigation Water Requirements and Water Scarcity Footprint in the Beijing–Tianjin–Hebei Region Based on the GeoSim–AquaCrop Model

1
Information Technology Research Center, Beijing Academy of Agriculture and Forestry Sciences, Beijing 100097, China
2
National Engineering Research Center for Information Technology in Agriculture, Beijing 100097, China
3
Institute of Plant Nutrition, Resources and Environment, Beijing Academy of Agriculture and Forestry Sciences, Beijing 100097, China
*
Author to whom correspondence should be addressed.
Agronomy 2024, 14(1), 192; https://doi.org/10.3390/agronomy14010192
Submission received: 6 December 2023 / Revised: 8 January 2024 / Accepted: 12 January 2024 / Published: 15 January 2024
(This article belongs to the Section Water Use and Irrigation)

Abstract

:
To reduce crop-related water consumption and enhance agricultural water resource efficiency in the Beijing–Tianjin–Hebei region, this study employed the AquaCrop model to simulate crop yield and irrigation water requirements and calculated the water scarcity footprint (WSF). The results were as follows: (1) The AquaCrop model exhibited strong applicability, with R2, RMSE (Root Mean Square Error), EF (Nash–Sutcliffe model efficiency coefficient) and d values of 0.9611, 6.6%, 0.91, and 0.98 (winter wheat), and 0.9571, 5.5%, 0.95, and 0.99 (summer maize) for canopy cover simulation. Similarly, aboveground biomass simulation yielded values of 0.9661, 0.8 t/ha, 0.93, and 0.98 (winter wheat), and 0.9087, 1.3 t/ha, 0.90, and 0.98 (summer maize). Winter wheat soil moisture content simulation showed an R2 of 0.9706, RMSE of 3.7 mm, EF of 0.93, and d of 0.98. (2) The AquaCrop model simulated the winter wheat and summer maize yields and irrigation water requirements for the years 2009, 2014, and 2019, validating the scalability and spatial visualization capabilities of GeoSim in extending AquaCrop simulations. (3) Integrating the water footprint and the water resources system, this study assessed the WSFs of winter wheat and summer maize. From 2009 to 2019, winter wheat production in the region increased by 25.08%, and summer maize production increased by 37.39%. The WSF of winter wheat decreased, whereas the WSF of summer maize increased. It is recommended to reduce crop cultivation areas in regions such as Daming County, Ningjin County, and Dingzhou City while further improving irrigation water efficiency, which would facilitate the sustainable utilization of water resources in the area.

1. Introduction

Water resources are vital for the survival and development of humans and all living organisms. However, with the progress of economic and social development, the contradiction between water supply and demand has become increasingly acute. This has led to the unsustainable utilization and scarcity of water resources, which have become crucial factors affecting the environment, ecosystems, and their functioning, as well as the sustainable development of countries and regions. According to statistics, agriculture accounts for 70 percent of global freshwater withdrawals [1]. With a significant proportion of water resources being allocated to agriculture, water is the primary driving force behind agricultural production in China. The Beijing–Tianjin–Hebei region, situated in the Haihe River Basin, stands out as a high-profile area both in China and globally, grappling with severe water scarcity, with per capita water resources well below the internationally accepted threshold of 1700 m3 per person [2]. At the same time, the Beijing–Tianjin–Hebei region is also a typical agricultural production area in China. Most agricultural production factors are concentrated in the plains of the Beijing–Tianjin–Hebei region, which is characterized by deep and fertile soil and abundant solar radiation, both of which are favorable for crop production. The cultivated area for grain crops is approximately over 7 million hectares, and there is a rich variety of grain crops, with wheat and maize being the primary crops [3]. However, due to the agricultural sector being a major consumer of water resources in the region, water scarcity remains a pressing issue. Groundwater serves as the primary source for crop irrigation, and agricultural water consumption is unevenly distributed. Moreover, it varies spatially due to factors such as irrigation techniques, soil types, crop varieties, and water availability [4]. These factors contribute to an even more imbalanced water supply in the Beijing–Tianjin–Hebei region. In recent years, the issue of excessive groundwater exploitation has transformed into the depletion of static groundwater reserves due to agricultural water consumption [3]. The depletion of static water reserves has worsened with the rapid development of agricultural activities, to the extent that the static water reserves are nearly depleted, creating a gap between the water supply and demand. Therefore, in the context of Beijing–Tianjin–Hebei integration, given this critical situation, optimizing the agricultural structure, conserving agricultural water, and rationalizing water resource allocation have become urgent tasks that cannot be delayed.
The concept of a water footprint was introduced by Dutch scholar Hoekstra [5]. It is a comprehensive evaluation indicator that measures the volume of water resources used in production and consumption. It enables the quantification of the impact of agricultural production activities on water resources and provides a new perspective for addressing regional water scarcity issues. Integrating the concept of a water footprint with the water resources system allows for the revelation of the regional water carrying capacity or crisis status [6]. Existing research has already conducted macro-scale water footprint assessments for crops such as wheat, onions, bananas, cotton, maize, and others [7,8,9,10,11,12]. However, at present, due to limitations in data availability, there is limited research on water footprint assessments at the field scale. Crop production models, as important research tools for agricultural science development, have been extensively studied. In 2009, the Food and Agriculture Organization (FAO) developed a new user-oriented crop growth model called AquaCrop [13]. The AquaCrop model focuses on water and is a water-driven growth model. It primarily aims to simulate the crop biomass and yield that can be obtained under different irrigation conditions in response to available water resources. Stricevic et al. selected the AquaCrop model to simulate the yield and irrigation water use efficiency of three major field crops (maize, sunflower, and sugar beet) in northern Serbia under different scenarios [14]. Mkhabela and Bullock adjusted and tested the AquaCrop model for simulating the spring wheat yield and soil moisture content in Canada [15], and they found that the model is effective in simulating wheat yield and soil moisture content in Canada, particularly considering that the model requires relatively less data, which can be easily collected. Due to its water-driven nature, the AquaCrop model has been widely used in water footprint research. Khan et al. utilized the AquaCrop model to investigate the water footprint, blue water scarcity, and economic water productivity of major crops in Pakistan, including maize, rice, tobacco, wheat, barley, sugarcane, and sugar beet [16]. The findings of their study can provide valuable references for the development of water-saving strategies and water resource planning and management.
Most crop growth models are designed for environmental simulations at specific geographic points or homogeneous regions. To overcome the limitations of point-based designs in crop growth models, Geographic Information Systems (GISs) can provide spatial simulation capabilities for crop models. Thorp and Bronson developed a GIS-based modeling system called Geospatial Simulation (GeoSim) that simplifies the management and manipulation of geospatial data, facilitating the implementation and evaluation of spatial simulations [17,18]. Building upon this, the present study utilizes the GeoSim tool to drive a localized AquaCrop model for simulating the yield and irrigation water usage of winter wheat and summer maize in the Beijing–Tianjin–Hebei region. Additionally, it assesses the spatiotemporal variations in crop water scarcity footprints at the county level. This research aims to provide a theoretical basis for optimizing cropping structures and adjusting agricultural water resource policies in the Beijing–Tianjin–Hebei region.

2. Materials and Methods

2.1. Study Area

The Beijing–Tianjin–Hebei region is located in the northern part of the North China Plain (36°01′–42°37′ N 113°04′–119°53′ E). It is bordered by the Yanshan Mountains to the north, the Taihang Mountains to the west, and the Bohai Sea to the east. The total area of the region is 214,900 km2, accounting for 2.3% of the national territory. It includes 2 directly governed municipalities, Beijing and Tianjin, and 11 prefecture-level cities in Hebei Province. The plains occupy 44% of the total area of the Beijing–Tianjin–Hebei region. The region belongs to a warm temperate climate with a semi-arid to semi-humid monsoon pattern. It experiences distinct seasons, with an average annual temperature ranging from 4 to 13 degrees Celsius and an average annual precipitation of approximately 300–800 mm. It is one of the major wheat and maize production areas in China. However, the area faces significant challenges in terms of water resources. It is one of the most water-scarce agricultural regions in China, with surface water showing a declining trend over the past 20 years [19]. There is low-productive water resource utilization, water scarcity, and low efficiency in water resource allocation.

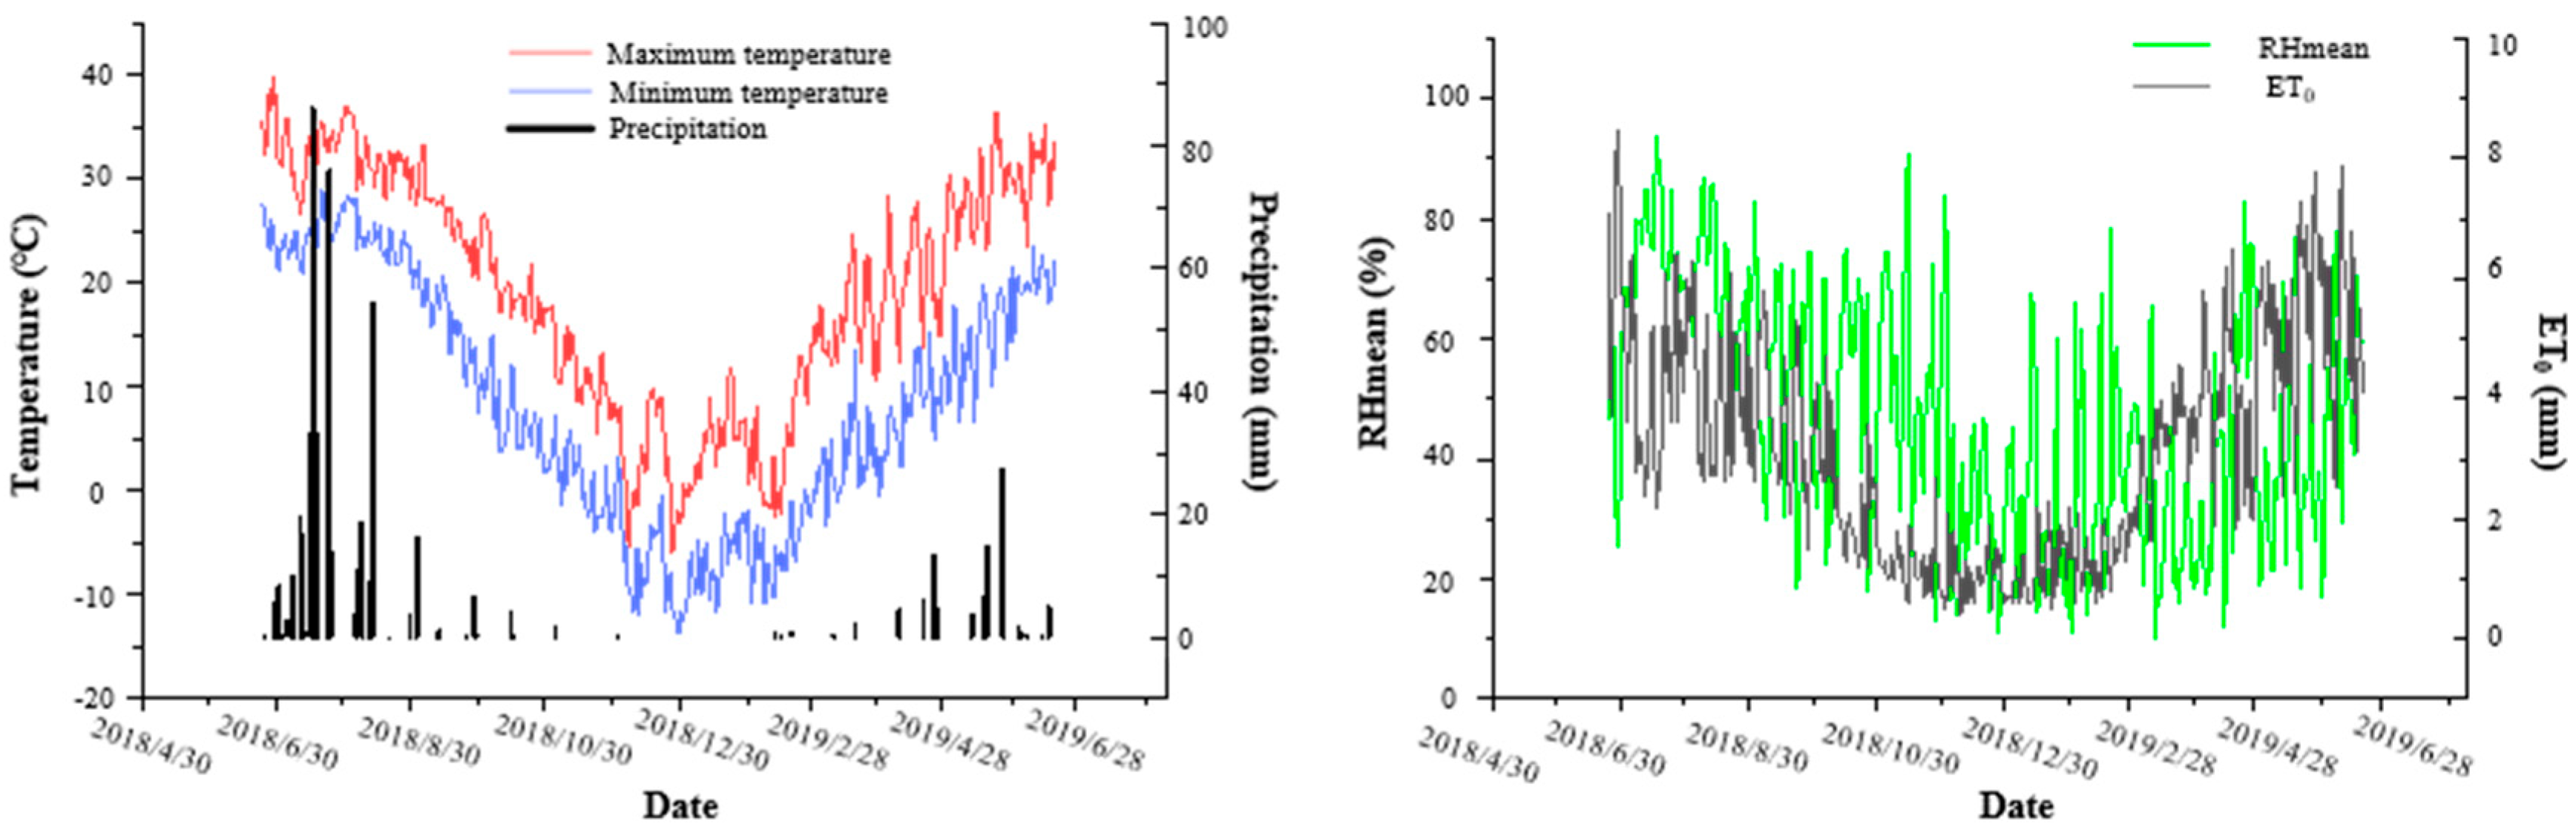
2.2. Data Acquisition

Soil data primarily include information on soil types, layers, textures, field capacity, permanent wilting points, bulk density, and the soil moisture content in each layer. These data are mainly sourced from institutions such as the Beijing Academy of Agriculture and Forestry Sciences, the Nanjing Institute of Soil Science (Chinese Academy of Sciences), and the HWSD (Harmonized World Soil Database), which provides derived chemical and physical soil properties for topsoil (0–30 cm) and subsoil (30–100 cm). The agricultural statistical data for winter wheat and summer maize in 2009, 2014, and 2019 were obtained from the statistical yearbooks published on the official websites of the county-level governments in the Beijing–Tianjin–Hebei region. By synthesizing these data, a set of crop yield and planting area data for the county-level administrative units in the Beijing–Tianjin–Hebei region was compiled. The water resource data mainly came from the Water Resources Bulletin. The administrative division data primarily used the county-level administrative division of the Beijing–Tianjin–Hebei region in 2019. The daily meteorological data during the growing seasons of winter wheat and summer maize in 2009, 2014, and 2019 were obtained from 35 meteorological stations in the Beijing–Tianjin–Hebei region via the China Meteorological Data Sharing Service System. This includes data on maximum and minimum temperatures, wind speed, sunshine duration, precipitation, relative humidity, and relative sunshine duration, as well as the latitude, longitude, and elevation data of the experimental stations. These data were used to calculate the reference crop evapotranspiration (ET0) using the Penman–Monteith equation [20]. Some of the meteorological variables during the growing seasons of winter wheat and summer maize in 2018–2019, which were used for calibration and validation, are shown in Figure 1. The crop data were collected from the experiment of the Xiaotangshan Base of the Beijing Academy of Agriculture and Forestry Sciences (40°00′–40°21′ N, 116°34′–117°00′ E). They primarily included the growing seasons, planting densities, crop canopy coverages (CCs), yields, and aboveground biomass of winter wheat and summer maize. The soil parameters of the experimental site are shown in Table 1. The experiment followed local field management practices, including weed control, disease and pest management, and fertilizer application. The irrigation details are presented in Table 2. Crops in the field did not exhibit noticeable water stress. The canopy coverage was calculated using the leaf area index (LAI) [21], which was obtained from field measurements using the LAI-2200C plant canopy analyzer. The calculation formula for crop canopy coverage is shown in Formulas (1) and (2), where ρ represents the planting density of the crop, m denotes the number of plants measured, and n represents the leaf number of the j-th plant [21].
LAI = 0.75 ρ j 1 m i = 1 n L ij × B ij m
CC = 1 exp 0.65 × LAI

2.3. Model Accuracy Assessment

The AquaCrop model’s simulation accuracy was evaluated using the coefficient of determination (R2), root-mean-square error (RMSE), the Nash–Sutcliffe model efficiency coefficient (EF), and Willmott’s index of agreement (d) as accuracy assessment indicators [22]. The calculation formulas are as follows:
R 2 = i = 1 n M i = 1 M ¯ i = 1 n S i S ¯
RMSE = i = 1 n S i M i 2 n
EF = i = 1 n M i M ¯ 2 i = 1 n M i S i 2 i = 1 n M i M ¯ 2
d = 1 i = 1 n S i M i 2 i = 1 n S i M ¯ + M i M ¯ 2
where n represents the sample size, Mi and Si represent the observed values and simulated values, respectively, and M ¯ denotes the average of the observed values. R2 indicates the degree of fit between the observed and simulated values, ranging between 0 and 1. A value closer to 1 indicates a better prediction accuracy. The RMSE represents the level of deviation between the observed and simulated values, with a smaller value indicating more reliable simulation results. The closer EF and d are to 1, the higher the consistency between the simulated and observed values, indicating more accurate simulation results.

2.4. Calculation of Water Scarcity Footprint

The water scarcity footprint (WSF) per kilogram of grain in each county unit is expressed in water equivalents and calculated using the Water Stress Index (WSI) as a weighting factor. The WSI represents the level of water scarcity within a specific regional scope [23]. The minimum water stress level for the WSI is 0.01, and a higher value indicates a greater level of water scarcity in the region, representing a higher loss of freshwater resources due to productive water consumption activities [24]. The magnitude of the water footprint WSF (H2Oe) based on LCA (life cycle assessment) is determined via both the crop irrigation water usage and the WSI value [25], where the WSI values for wheat and maize are provided by Stephan Pfister and Peter Bayer’s research [26]. The calculation formula for the water scarcity footprint is as follows [27]:
WSF = I / P × WSI
I = I requ × A g × F irri
P = Y irri × A × F irri + Y rain × A × 1 F irri
where I represents the irrigation water usage for crops in cubic meters (m3), P denotes the crop yield in kilograms (kg), Irequ indicates the net irrigation water requirement obtained from the AquaCrop model in cubic meters per hectare (m3 ha−1), Yirri represents the crop yield under irrigation conditions based on the AquaCrop model in kilograms per hectare (kg ha−1), and Yrain represents the crop yield under rain-fed conditions according to the AquaCrop model in kilograms per hectare (kg ha−1). It is important to note that winter wheat and summer maize generally require irrigation. A refers to the planting area of winter wheat and summer maize in hectares (ha), and Firri represents the proportion of irrigated agricultural land area calculated using county-level statistics data provided by the National Bureau of Statistics.
Based on the actual yield of winter wheat and summer maize, the total water scarcity footprint (WSFtota) of crops in each county-level unit can be calculated, where Pactu represents the actual crop yield in kilograms (kg).
WSF tota = WSF × P actu

3. Results

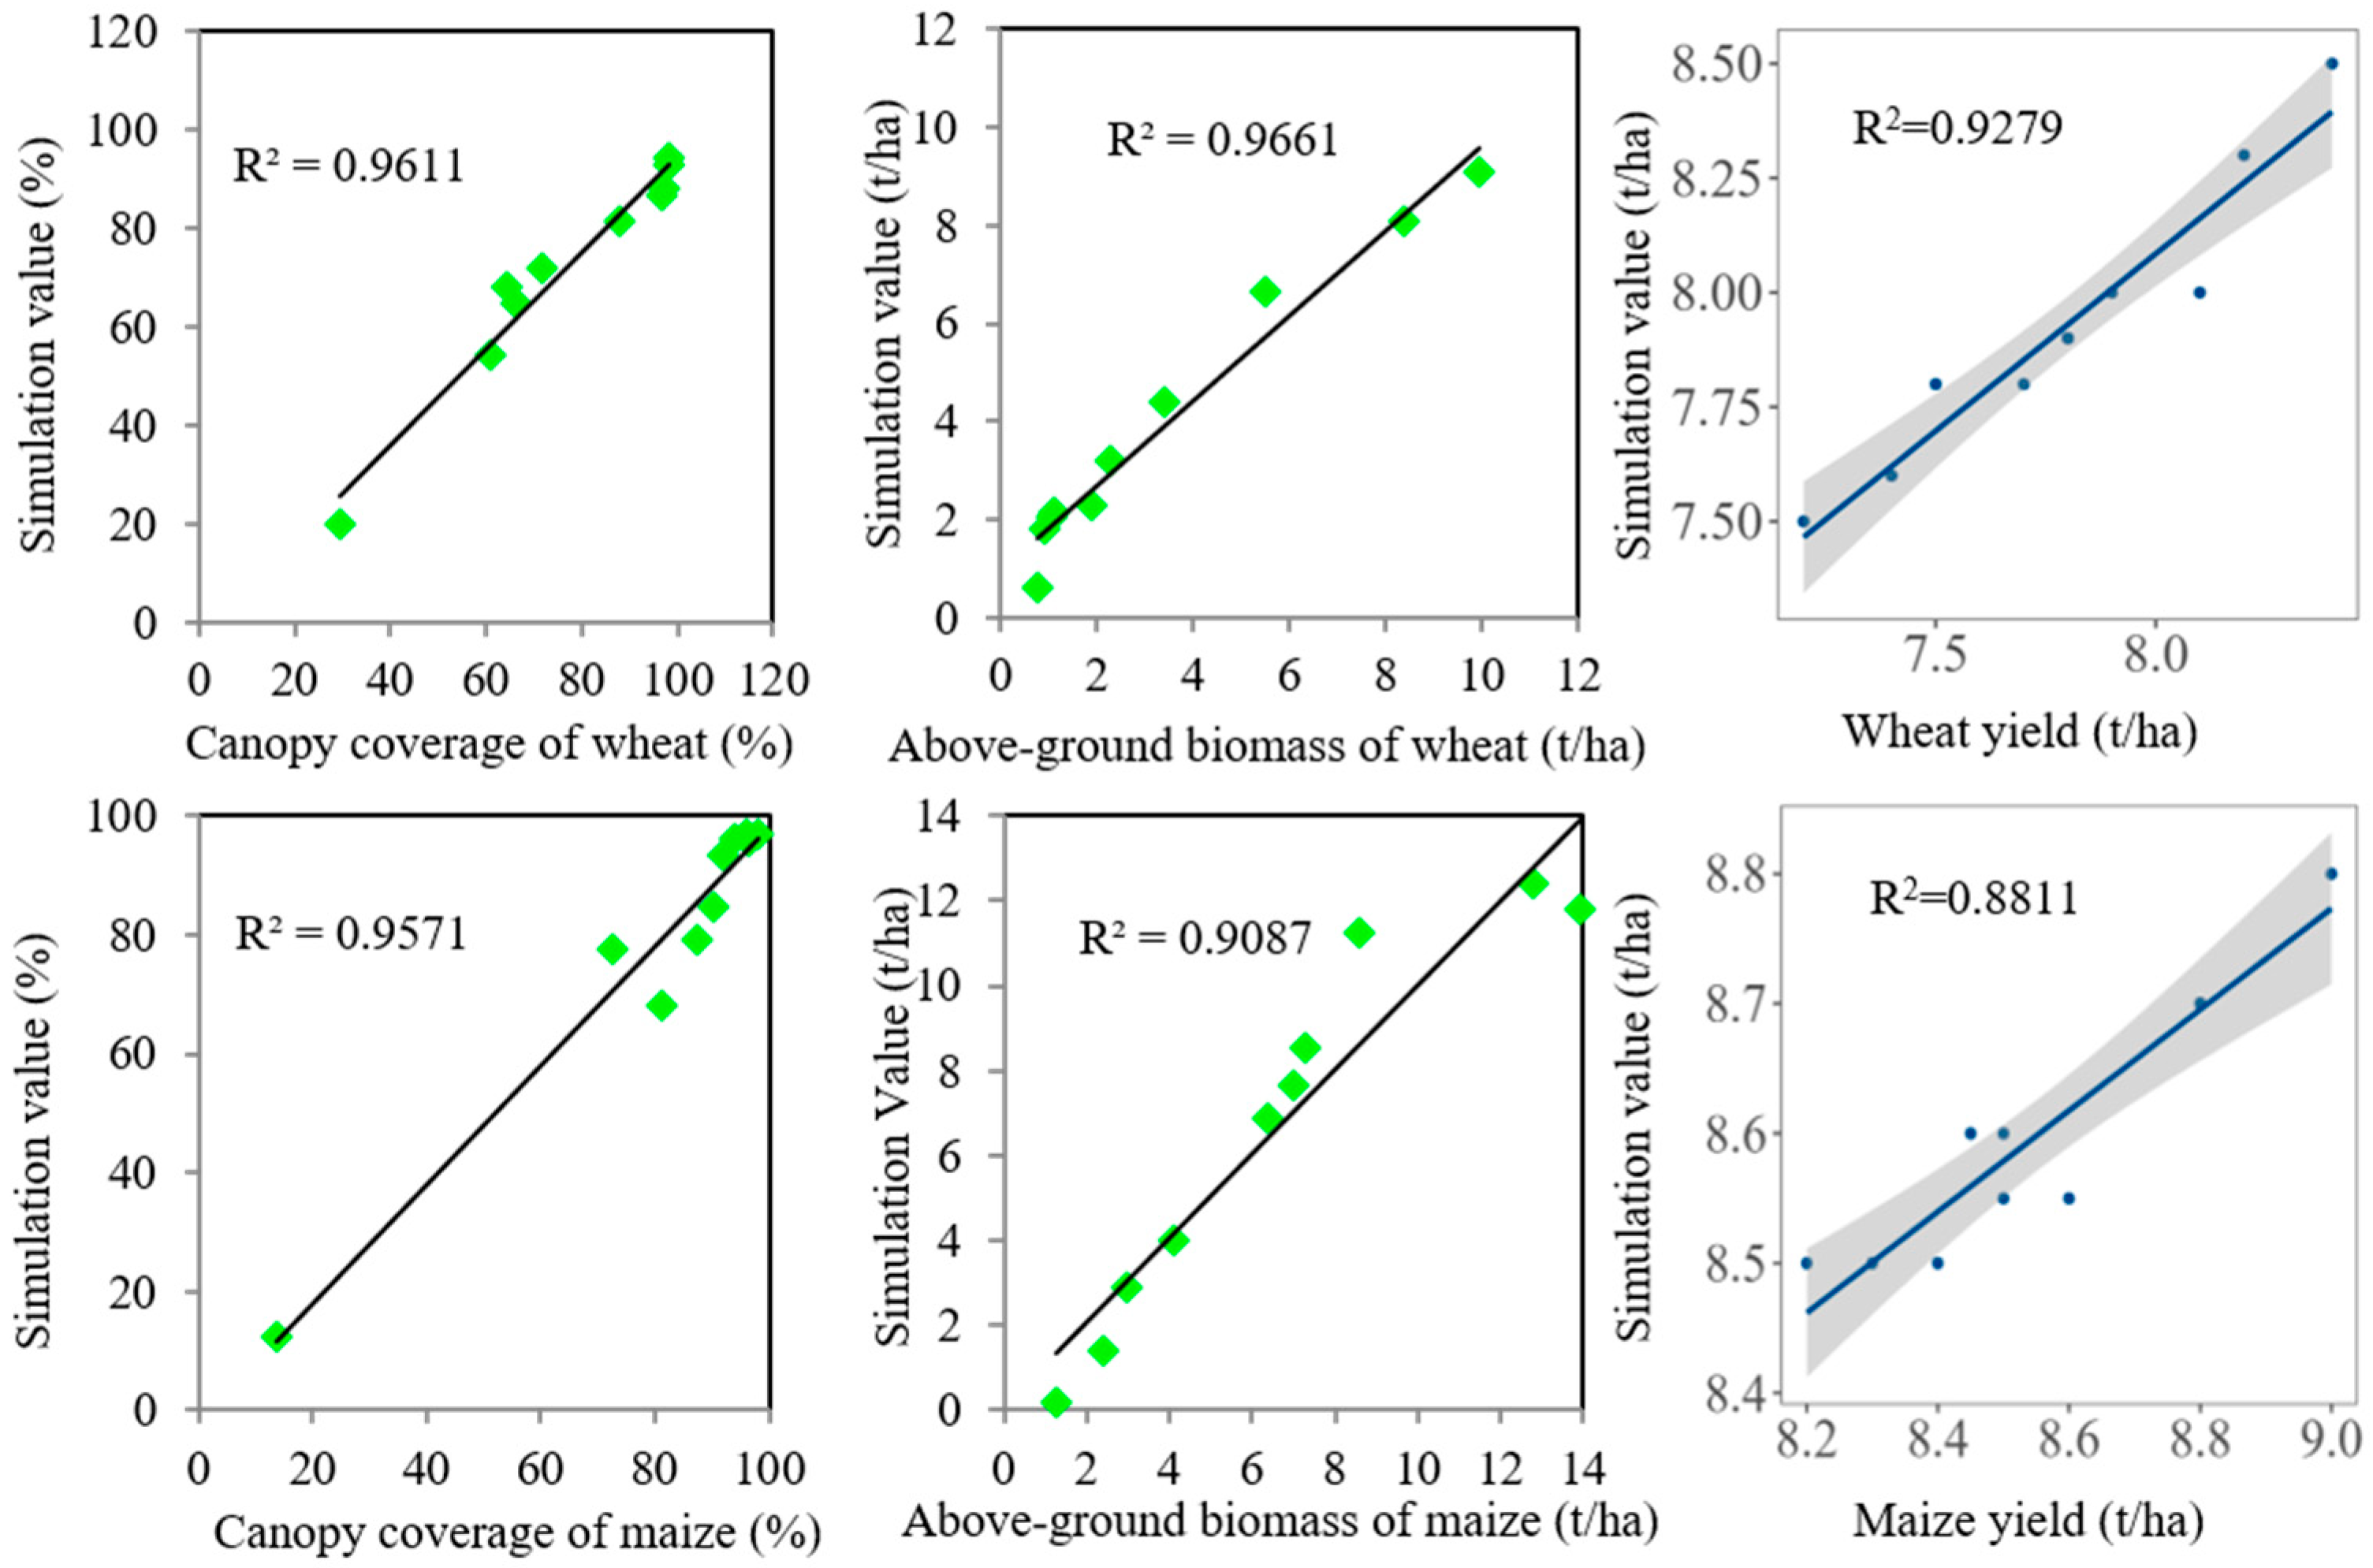
3.1. Parameter Tuning and Validation of the AquaCrop Model

Field measurement data in the growth periods of the Xiaotangshan Base in Beijing in 2018 and 2019 were used to calibrate and verify the parameters of winter wheat and summer corn by using the trial-and-error method (the Optimal Transport Assignment method, where the parameter adjustment range was controlled within ± 5%) (as shown in Figure 2). The AquaCrop model utilized the canopy cover to represent the biomass and yield formation processes of winter wheat and summer maize. The relationship between the measured and simulated values of the canopy cover for winter wheat and summer maize is shown in Figure 3. The simulation accuracy of the winter wheat canopy cover is reflected in an R2 value of 0.9611, RMSE of 6.6%, EF of 0.91, and d value of 0.98. Similarly, for summer maize, the R2 value is 0.9571, the RMSE is 5.5%, the EF is 0.95, and the d is 0.99, indicating a high canopy cover simulation accuracy. Aboveground biomass is an important factor in determining crop yield. The simulation results of the aboveground dry biomass for winter wheat show an R2 value of 0.9661, RMSE of 0.8 t/ha, EF of 0.93, and d value of 0.98, while for summer maize, the R2 value is 0.9087, RMSE is 1.3 t/ha, EF is 0.90, and d is 0.98. These values indicate a strong correlation between the measured and simulated values of aboveground dry biomass during the growth stages of winter wheat and summer maize. Therefore, the AquaCrop model demonstrates good capability in simulating the dynamic changes in aboveground biomass. Based on the comprehensive results, it can be concluded that the AquaCrop model demonstrates high accuracy in simulating the growth, development, and yield formation of winter wheat and summer maize. The AquaCrop model provides a set of physiological parameters for typical crops. Table 3 presents the localized crop parameters adjusted based on the parameter validation results, which align with the actual growth conditions of winter wheat and summer maize in the region. The model utilizes a relatively small number of parameters and intuitive input variables to predict and preliminarily assess crop productivity and irrigation water requirements. This provides a valuable reference for agricultural management decisions.

3.2. Regional Yield and Irrigation Water Simulation using the GeoSim–AquaCrop Model

This study developed a Geographic Information System (GIS)-based geospatial simulation tool called GeoSim to simulate the yields of winter wheat and summer maize as well as their irrigation water requirements in the Beijing–Tianjin–Hebei region. The integration of GeoSim with the AquaCrop model not only enhances the simulation efficiency but also extends the application of the AquaCrop model to the spatiotemporal analysis scale, significantly improving its suitability as a strategic planning and decision support tool. In this study, the allowable depletion of water in the root zone was set at 50% of the available soil water. The average yields and irrigation water requirements of winter wheat and summer maize in 2009, 2014, and 2019 are shown in Figure 3. The simulation results indicate significant variations in yields and irrigation water requirements in different regions due to factors such as regional climates and soil differences. Except for the areas where winter wheat and summer maize were not planted, the yield of winter wheat ranges from 0.98 to 8.51 t/ha, and the yield of summer maize ranges from 1.38 to 8.2 t/ha. The irrigation water requirement for winter wheat ranges from 125.65 to 339.4 mm, while for summer maize, it ranges from 0 to 48.45 mm.

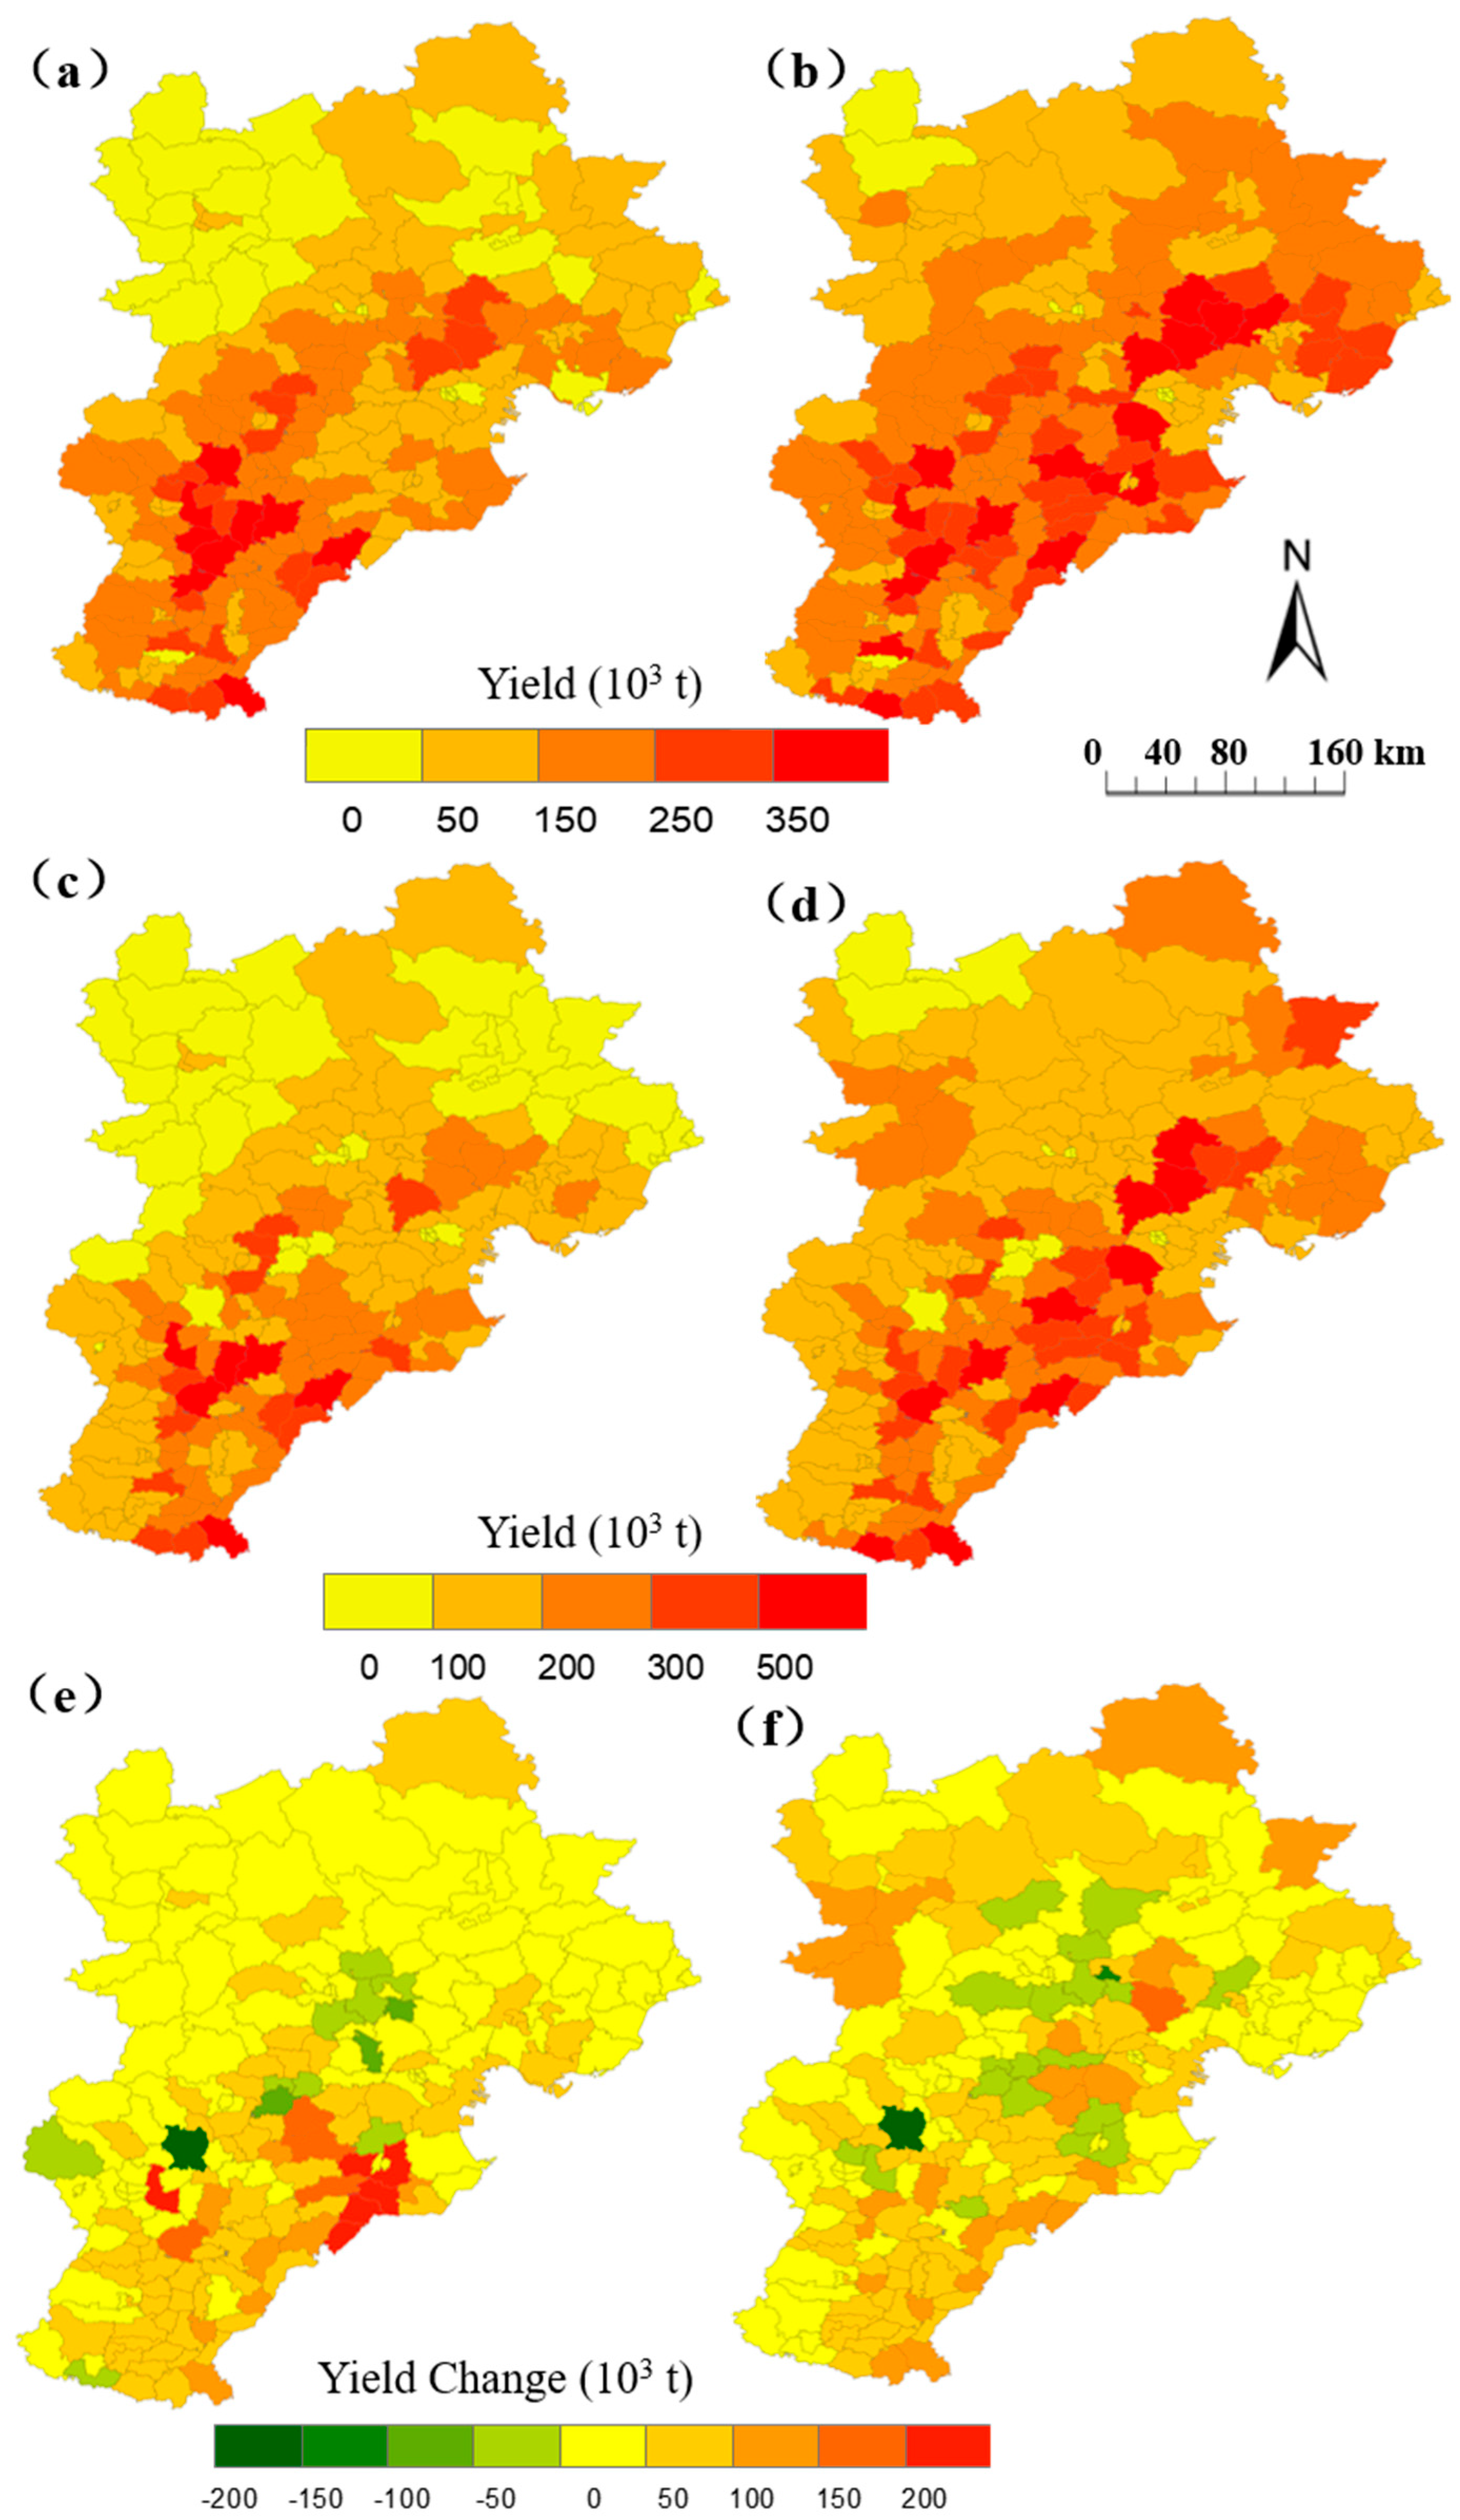
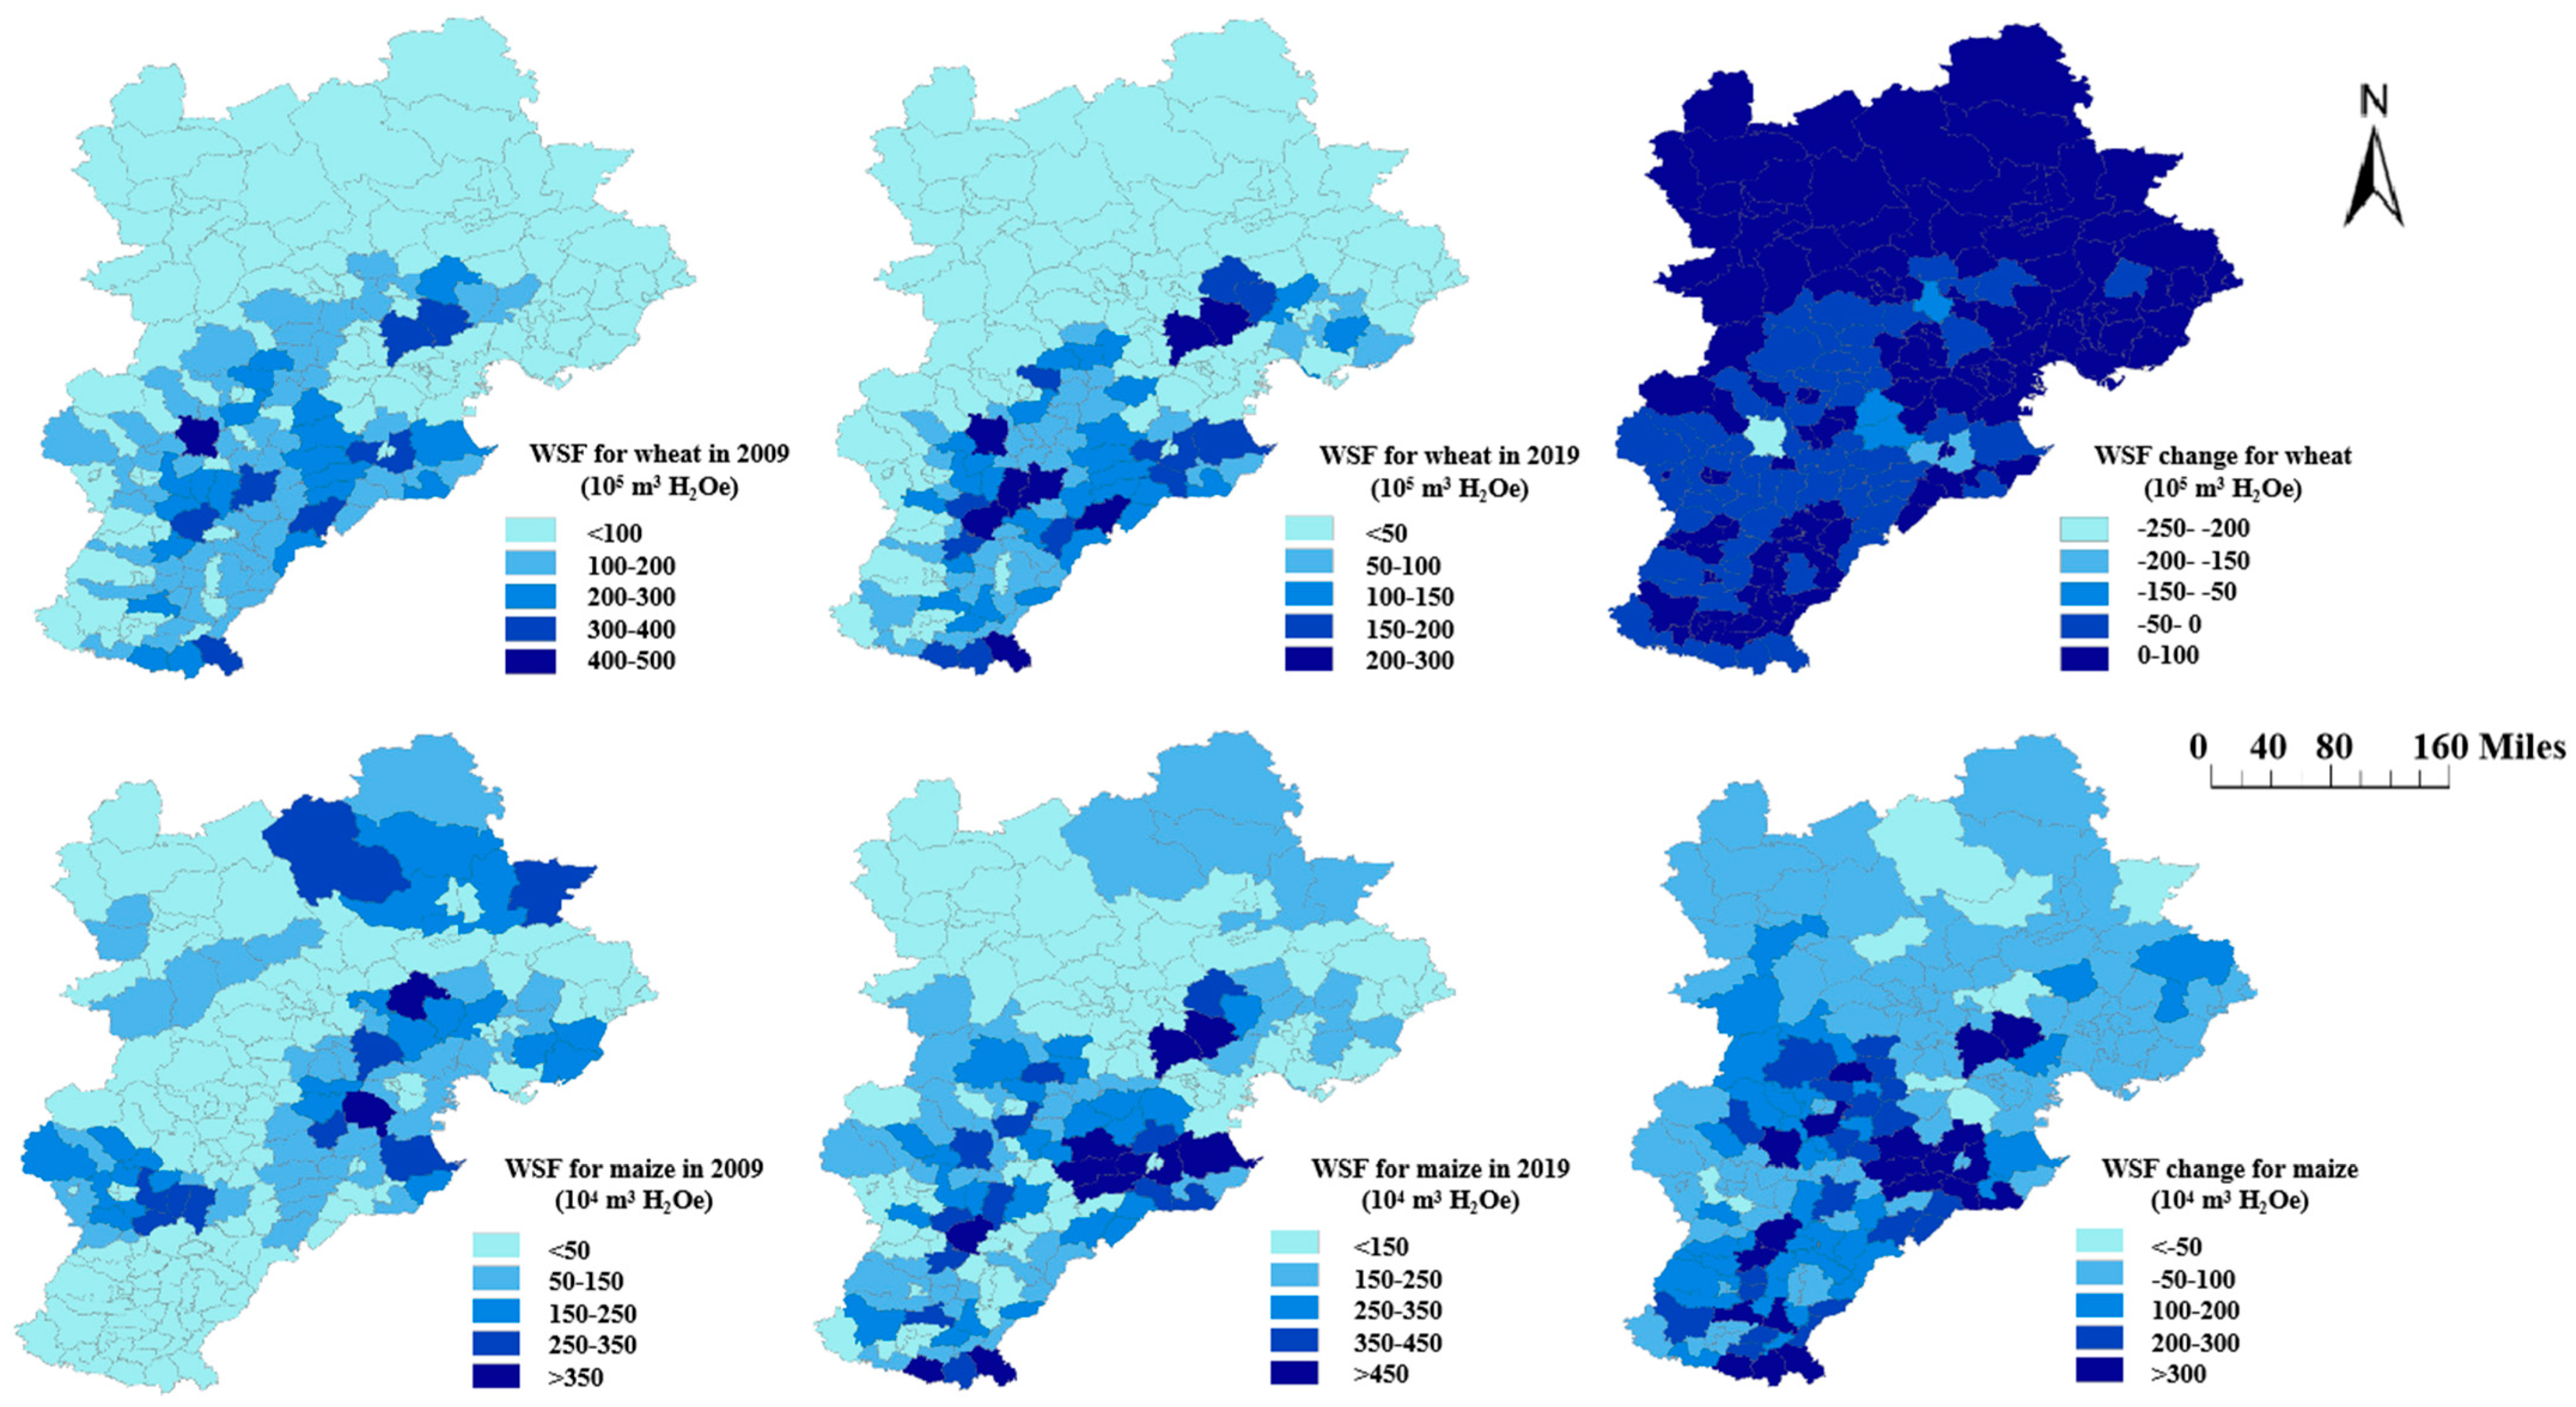
3.3. Distribution of Crop Yield and Water Scarcity Footprint in the Beijing–Tianjin–Hebei Region

From 2009 to 2019, there was an increase in the yield of winter wheat and summer maize in the Beijing–Tianjin–Hebei region (Figure 4). The total yield of winter wheat in the region increased from 13.1424 million tons to 16.4383 million tons, with a growth rate of approximately 25.08%. The total yield of summer maize increased from 15.1643 million tons to 20.8347 million tons, with a growth rate of approximately 37.39%. The growth rate of the total summer maize yield was higher than that of winter wheat. The southern region of the Beijing–Tianjin–Hebei area was the main area of yield growth for winter wheat. In summer maize production, there was a slight decrease in yield in the central region, while the southern and northwestern regions experienced a significant increase in yield.
From 2009 to 2019, there was a decreasing trend in the water scarcity footprint (WSF) of winter wheat and an increasing trend in the WSF of summer maize in the Beijing–Tianjin–Hebei region (Figure 5). In 2009, the total WSF of winter wheat was 189.93 × 10⁷ H2Oe, while in 2019, it decreased to 112.2 × 10⁷ H2Oe, representing a decrease of approximately 40.63%. The total WSF of summer maize in the Beijing–Tianjin–Hebei region in 2019 was 329.33 × 10⁶ H2Oe, which was approximately 1.5 times the value in 2009. The spatial distributions of the WSFs for winter wheat and summer maize followed a similar pattern to the changes in crop yields.

4. Discussion and Recommendations

Water resources are the primary driving force behind agricultural production [28]. The Beijing–Tianjin–Hebei region is a typical agricultural production area in China and an important agricultural output region. The increasingly severe water scarcity problem has become a key factor limiting agricultural production in the Beijing–Tianjin–Hebei region. With the enhancement of the agricultural production capacity in the region, agricultural water is mainly sourced from irrigation, leading to a more imbalanced water supply in the Beijing–Tianjin–Hebei region. In the face of this grim situation, it is imperative to address issues such as alleviating groundwater over-exploitation, rational development, optimizing industrial structure, conserving agricultural water use, and rationalizing water resource allocation [29]. These actions have a significant impact on promoting the sustainable utilization of water resources and improving the water resource situation.
This article quantified the WSFs of winter wheat and summer maize in the Beijing–Tianjin–Hebei region. The results indicate that the regions where winter wheat and summer maize exhibit an increase in WSF align with spatial variations in crop yield. The changes in the WSF for both winter wheat and summer maize are primarily attributed to variations in crop yield and regional water scarcity. In terms of water consumption in the Beijing–Tianjin–Hebei region, a significant proportion is attributed to irrigation water extracted from natural water bodies [30]. Therefore, improving irrigation efficiency is a key direction for alleviating water scarcity [31]. Technological improvements can alleviate some water scarcity issues, such as increasing the area of effective irrigation and enhancing irrigation water use efficiency [32]. These efforts need to be complemented with sustainable regulations and policies regarding water resource utilization [33]. Regional optimization and crop selection offer significant potential and represent two possible approaches to reducing the human water footprint. Considering that there are not enough water resources to meet all our demands, this study underscores the necessity of optimizing water consumption at a regional level. Empirical evidence has shown that optimizing the regional crop production layout is particularly important [34]. Further reductions in the crop planting areas in Damxian County, Hejian City, Ningjin County, Wei County, and Xinji City, coupled with the widespread adoption of low-water-consuming crop varieties or the moderate increase in low-water-consuming crops such as potatoes and coarse grains, can help maintain the water–soil balance and food security in the Beijing–Tianjin–Hebei region. Additionally, it is crucial to strengthen farmers’ awareness of water conservation and improve soil productivity and crop production techniques, particularly in areas such as Damxian County, Ningjin County, and Dingzhou City, while increasing the sources of water supply. The spatial distribution information on water scarcity provided in this study can help identify the regions that are most in need of sustainable agricultural measures. The conducted analysis can identify the potential for improving crop production, but it must also consider other environmental factors such as climate change to provide a more comprehensive assessment of the water-saving potential in agricultural production [35].

5. Conclusions

This study utilized field measurements to validate and calibrate the AquaCrop model. The GeoSim tool was employed to drive the AquaCrop model and simulate the crop yield and irrigation water requirements of summer maize and winter wheat in the Beijing–Tianjin–Hebei region for the years 2009, 2014, and 2019. Additionally, the water footprints of these crops were calculated. The main conclusions drawn from this study are as follows: The AquaCrop model demonstrated high accuracy in simulating the winter wheat and summer maize canopy cover, aboveground biomass, and soil moisture. It exhibited strong applicability in simulating crop yield and irrigation water use in this research. From 2009 to 2019, both winter wheat and summer maize yields showed an increase in the Beijing–Tianjin–Hebei region. The total winter wheat yield in the region increased by approximately 25.08%, while the total summer maize yield increased by approximately 37.39%. The water footprint (WSF) of winter wheat exhibited a decreasing trend, while the WSF of summer maize showed an increasing trend. The spatial distribution of the rising WSF in both winter wheat and summer maize aligns with the changes in crop yield. It is recommended that the Beijing–Tianjin–Hebei region further optimizes the cultivation of winter wheat and summer maize crops, increases the sources of water resources, and strives to enhance irrigation water use efficiency by expanding the area of effectively irrigated crops.

Author Contributions

Methodology, Q.Z. and X.T.; software, L.L.; validation, Z.L.; investigation, Q.Z. and Z.L.; data curation, H.H. and X.T.; writing—original draft, H.H. and X.T.; writing—review and editing, H.H. and L.L. All authors have read and agreed to the published version of the manuscript.

Funding

This research was funded by the Youth Fund of the Bejing Academy of Agriculture and Forestry Science (QNJJ202126), the Bejing Industrial Economy and Policy Innovation Team (BAIC 11-2023), and the National Key R&D Program of China (2022YFC3802805).

Data Availability Statement

Dataset available on request from the authors.

Conflicts of Interest

The authors declare no conflicts of interest.

References

  1. Zhang, J.; Campana, P.E.; Yao, T.; Zhang, Y.; Lundblad, A.; Melton, F.; Yan, J. The water-food-energy nexus optimization approach to combat agricultural drought: A case study in the United States. Appl. Energy 2018, 227, 449–464. [Google Scholar] [CrossRef]
  2. Liu, J.G.; Yang, H.; Gosling, S.N.; Kummu, M.; Flörke, M.; Pfister, S.; Hanasaki, N.; Wada, Y.; Zhang, X.X.; Zheng, C.M.; et al. Water scarcity assessments in the past, present, and future. Earth’s Future 2017, 5, 545–559. [Google Scholar] [CrossRef] [PubMed]
  3. Luo, J.M.; Zhang, H.M.; Qi, Y.Q.; Pei, H.W.; Shen, Y.J. Balancing water and food by optimizing the planting structure in the Beijing-Tianjin-Hebei region, China. Agric. Water Manag. 2022, 262, 107326. [Google Scholar] [CrossRef]
  4. Tsakmakis, I.D.; Zoidou, M.; Gikas, G.D.; Sylaios, G.K. Impact of irrigation technologies and strategies on cotton water footprint using AquaCrop and CropWat models. Environ. Process. 2018, 5, 181–199. [Google Scholar] [CrossRef]
  5. Hoekstra, A.Y. Virtual water trade. In Proceedings of the International Expert Meeting on Virtual Water Trade, Delft, The Netherlands, 12–13 December 2002; Value of Water Research Report Series No. 12. UNESCOIHE: Delft, The Netherlands, 2003. Available online: www.waterfootprint.org/Reports/Report12.pdf (accessed on 15 October 2023).
  6. Wang, H.; Huang, J.J.; Zhou, H.; Deng, C.B.; Fang, C.L. Analysis of sustainable utilization of water resources based on the improved water resources ecological footprint model: A case study of Hubei Province, China. J. Environ. Manag. 2020, 262, 110331. [Google Scholar] [CrossRef]
  7. Mekonnen, M.M.; Hoekstra, A.Y. A global and high-resolution assessment of the green, blue and grey water footprint of wheat. Hydrol. Earth Syst. Sci. 2010, 14, 1259–1276. [Google Scholar] [CrossRef]
  8. Muratoglu, A. Assessment of wheat’s water footprint and virtual water trade: A case study for Turkey. Ecol. Process. 2020, 9, 13. [Google Scholar] [CrossRef]
  9. Adeoti, O.; Oyedele, O.A.; Yusuf, A. The water footprint of dry onion production in Nigeria. Water Resour. Ind. 2021, 25, 100147. [Google Scholar] [CrossRef]
  10. Clercx, L.; Zarate Torres, E.; Kuiper, J.D. Water footprint assessment of bananas produced by small banana farmers in Peru and Ecuador. Acta Hortic. 2016, 1112, 21–28. [Google Scholar] [CrossRef]
  11. Zhang, T.Z.; Zhai, Y.J.; Ma, X.T.; Shen, X.X.; Bai, Y.Y.; Zhang, R.R.; Ji, C.X.; Hong, J.L. Towards environmental sustainability: Life cycle assessment-based water footprint analysis on China’s cotton production. J. Clean. Prod. 2021, 313, 127925. [Google Scholar] [CrossRef]
  12. Han, Y.P.; Jia, D.D.; Zhuo, L.; Sauvage, S.; Sánchez-Pérez, J.M.; Huang, H.P.; Wang, C.Y. Assessing the water footprint of wheat and maize in Haihe river basin, Northern China (1956–2015). Water 2018, 10, 867. [Google Scholar] [CrossRef]
  13. Steduto, P.; Hsiao, T.C.; Raes, D.; Fereres, E. AquaCrop-the FAO crop model to simulate yield response to water: I. Concepts and underlying principles. Agron. J. 2009, 101, 426–437. [Google Scholar] [CrossRef]
  14. Stricevic, R.; Cosic, M.; Djurovic, N.; Pejic, B.; Maksimovic, L. Assessment of the FAO AquaCrop model in the simulation of rainfed and supplementally irrigated maize, sugar beet and sunflower. Agric. Water Manag. 2011, 98, 1615–1621. [Google Scholar] [CrossRef]
  15. Mkhabela, M.S.; Bullock, P.R. Performance of the FAO AquaCrop model for wheat grain yield and soil moisture simulation in Western Canada. Agric. Water Manag. 2012, 110, 16–24. [Google Scholar] [CrossRef]
  16. Khan, T.; Nouri, H.; Booij, M.J.; Hoekstra, A.Y.; Khan, H.; Ullah, I. Water footprint, blue water scarcity, and economic water productivity of irrigated crops in Peshawar basin, Pakistan. Water 2021, 13, 1249. [Google Scholar] [CrossRef]
  17. Thorp, K.R.; Bronson, K.F. A model-independent open-source geospatial tool for managing point-based environmental model simulations at multiple spatial locations. Environ. Model. Softw. 2013, 50, 25–36. [Google Scholar] [CrossRef]
  18. Huang, J.; Scherer, L.; Lan, K.; Chen, F.; Thorp, K.R. Advancing the application of a model-independent open-source geospatial tool for national-scale spatiotemporal simulations. Environ. Model. Softw. 2019, 119, 374–378. [Google Scholar] [CrossRef]
  19. Qi, X.X.; Feng, K.S.; Sun, L.X.; Zhao, D.D.; Huang, X.J.; Zhang, D.X.; Liu, Z.M.; Baiocchi, G. Rising agricultural water scarcity in China is driven by expansion of irrigated cropland in water scarce regions. One Earth 2022, 5, 1139–1152. [Google Scholar] [CrossRef]
  20. Allen, R.G. Crop evapotranspiration-guidelines for computing crop water requirements. In FAO Irrigation and Drainage Paper (FAO); FAO: Rome, Italy, 1998; p. 56. [Google Scholar]
  21. Lu, J.S.; Cheng, D.L.; Geng, C.M.; Zhang, Z.T.; Xiang, Y.Z.; Hu, T.T. Combining plant height, canopy coverage and vegetation index from UAV-based RGB images to estimate leaf nitrogen concentration of summer maize. Biosyst. Eng. 2021, 202, 42–54. [Google Scholar] [CrossRef]
  22. Shirazi, S.Z.; Mei, X.; Liu, B.; Liu, Y. Assessment of the AquaCrop model under different irrigation scenarios in the North China Plain. Agric. Water Manag. 2021, 257, 107120. [Google Scholar] [CrossRef]
  23. Wang, D.; Hubacek, K.; Shan, Y.L.; Gerbens-Leenes, W.; Liu, J.G. A review of water stress and water footprint accounting. Water 2021, 13, 201. [Google Scholar] [CrossRef]
  24. Scherer, L.; Pfister, S. Dealing with uncertainty in water scarcity footprints. Environ. Res. Lett. 2016, 11, 54008. [Google Scholar] [CrossRef]
  25. Pfister, S.; Koehler, A.; Hellweg, S. Assessing the environmental impacts of freshwater consumption in LCA. Environ. Sci. Technol. 2009, 43, 4098–4104. [Google Scholar] [CrossRef] [PubMed]
  26. Pfister, S.; Bayer, P. Monthly water stress: Spatially and temporally explicit consumptive water footprint of global crop production. J. Clean. Prod. 2014, 73, 52–62. [Google Scholar] [CrossRef]
  27. Huai, H.J.; Chen, X.; Huang, J.; Chen, F. Water-scarcity footprint associated with crop expansion in Northeast China: A case study based on AquaCrop modeling. Water 2020, 12, 125. [Google Scholar] [CrossRef]
  28. Cai, J.P.; Xie, R.; Wang, S.J.; Deng, Y.P.; Sun, D.Q. Patterns and driving forces of the agricultural water footprint of Chinese cities. Sci. Total Environ. 2022, 843, 156725. [Google Scholar] [CrossRef] [PubMed]
  29. Wei, D.; Wang, X.L.; Luo, N.; Zhu, Y.P.; Wang, P.; Meng, Q.F. Alleviating groundwater depletion while realizing food security for sustainable development. J. Clean. Prod. 2023, 393, 136351. [Google Scholar] [CrossRef]
  30. Sun, S. Water footprints in Beijing, Tianjin and Hebei: A perspective from comparisons between urban and rural consumptions in different regions. Sci. Total Environ. 2019, 647, 507–515. [Google Scholar] [CrossRef]
  31. Pereira, L.S.; Oweis, T.; Zairi, A. Irrigation management under water scarcity. Agric. Water Manag. 2002, 57, 175–206. [Google Scholar] [CrossRef]
  32. Levidow, L.; Zaccaria, D.; Maia, R.; Vivas, E.; Todorovic, M.; Scardigno, A. Improving water-efficient irrigation: Prospects and difficulties of innovative practices. Agric. Water Manag. 2014, 146, 84–94. [Google Scholar] [CrossRef]
  33. Pahl-Wostl, C.; Knieper, C.; Lukat, E.; Meergans, F.; Schoderer, M.; Schütze, N.; Schweigatz, D.; Dombrowsky, I.; Lenschow, A.; Stein, U.; et al. Enhancing the capacity of water governance to deal with complex management challenges: A framework of analysis. Environ. Sci. Policy 2020, 107, 23–35. [Google Scholar] [CrossRef]
  34. Xie, W.; Zhu, A.F.; Ali, T.; Zhang, Z.T.; Chen, X.G.; Wu, F.; Huang, J.K.; Davis, K.F. Publisher correction: Crop switching can enhance environmental sustainability and farmer incomes in China. Nature 2023, 618, E26. [Google Scholar] [CrossRef]
  35. van Oel, P.R.; Mekonnen, M.M.; Hoekstra, A.Y. The external water footprint of the Netherlands: Geographically-explicit quantification and impact assessment. Ecol. Econ. 2009, 69, 82–92. [Google Scholar] [CrossRef]
Figure 1. The maximum and minimum temperatures, precipitation, average relative humidity, and ET0 during the growing seasons of winter wheat and summer maize in 2018–2019.
Agronomy 14 00192 g001
Figure 2. Comparison between simulated results of the AquaCrop model and measured values.
Agronomy 14 00192 g002
Figure 3. The simulation results of crop yield and irrigation water requirements based on the G–oSim–AquaCrop model.
Agronomy 14 00192 g003
Figure 4. Crop yields and changes in winter wheat and summer maize production in the Beijing–Tianjin–Hebei region. Note: (a) Winter wheat yield in 2009; (b) winter wheat yield in 2019; (c) summer maize yield in 2009; (d) summer maize yield in 2019; (e) change in winter wheat yield from 2009 to 2019; and (f) change in summer maize yield from 2009 to 2019.
Agronomy 14 00192 g004
Figure 5. Water scarcity footprints (WSFs) and changes in winter wheat and summer maize in the Beijing–Tianjin–Hebei region.
Agronomy 14 00192 g005
Table 1. The soil parameter data of the experiment site.
Soil TextureDepth
(cm)
Moisture Content (vol%)Soil Organic Carbon (%)Clay
(%)
Silt
(%)
pHTotal N (%)
PWPFCSat
Silt loam0–208.80 27.30 51.10 1.04 23.50 53.90 8.00 0.11
Silt loam 20–408.70 27.30 51.30 1.01 23.40 54.10 8.08 0.10
Silt loam 40–6012.30 34.80 54.70 0.68 37.30 47.80 7.94 0.08
Silt loam 60–8012.30 34.80 54.70 0.66 37.30 47.80 7.98 0.08
Mixed soil 80–10012.30 34.80 54.70 0.59 40.30 43.00 8.03 0.07
Note: PWP, permanent wilting point; FC, field capacity; Sat, saturation.
Table 2. Filed management data.
YearSowing DateHarvest DateIrrigation (mm)
Over-WiningRegreenStem ElongationFlag LeafGrain Filing
2017–201828 September 201720 June 201825.0036.0036.0045.0045.00
2018–2019October 201817 June 201925.0025.0025.0036.0060.00
Note: Both the sowing and harvest dates are for winter wheat. Summer maize is planted after the winter wheat harvest and harvested before the winter wheat is sown, thereby achieving two harvests in one year.
Table 3. Adjusted parameter values for winter wheat and summer maize.
IndicatorDescriptionUnitRange of FluctuationValues for Winter WheatValues for Summer Maize
matDuration from sowing to maturityGDD1750–325024791478
emeDuration from sowing to emergenceGDD105–195168138
CC0Initial canopy cover%0.10–10.006.511.5
CCxMaximum canopy cover%11–10010097
numNumber of plants per hectare-2,450,000–4,550,0004,342,695300,000
senDuration from sowing to the onset of senescenceGDD1313–243813431099
hilenDuration for establishing the harvest index during the reproductive phaseGDD603–1121908539
floDuration from sowing to floweringGDD1142–21111266932
flolenDuration of flowering periodGDD192–356270228
rootdepDuration from sowing to maximum root depthGDD1118–20761228744
remdMaximum effective root depthM0.10–4.001.21.2
wpNormalized water productivitygm−210.5–19.51517
hiReference harvest index%35–658154
Disclaimer/Publisher’s Note: The statements, opinions and data contained in all publications are solely those of the individual author(s) and contributor(s) and not of MDPI and/or the editor(s). MDPI and/or the editor(s) disclaim responsibility for any injury to people or property resulting from any ideas, methods, instructions or products referred to in the content.

