Article

Siberian Wildrye (Elymus sibiricus) Seed Vigor Estimation for the Prediction of Emergence Performance under Diverse Environmental Conditions

1
College of Grassland Science, Qingdao Agricultural University, Qingdao 266109, China
2
Key Laboratory of National Forestry and Grassland Administration on Grassland Resources and Ecology in the Yellow River Delta, Qingdao 266109, China
3
Qingdao Key Laboratory of Specialty Plant Germplasm Innovation and Utilization in Saline Soils of Coastal Beach, Qingdao 266109, China
*
Author to whom correspondence should be addressed.
These authors contributed equally to this work.
Agronomy 2024, 14(1), 173; https://doi.org/10.3390/agronomy14010173
Submission received: 6 December 2023 / Revised: 10 January 2024 / Accepted: 11 January 2024 / Published: 12 January 2024
(This article belongs to the Section Grassland and Pasture Science)

Abstract

:
Seed vigor is an important aspect of seed quality. It is critical to predict seed vigor and plant seedling emergence under diverse environmental conditions using the laboratory vigor test. Accordingly, laboratory experiments were conducted to determine the standard germination (SG), early individual counts of radicle emergence (RE), mean germination time (MGT), and vigor index (VI) for 16 commercially available seed lots of Siberian wildrye (Elymus sibiricus), an economically and ecological important grass species. The field emergence (FE) for seed lots was explored using a three-year field trial from 2021 to 2023. Meanwhile, pot experiments were carried out to determine the seedling emergence performance under different environmental conditions, including control, drought, and salinity stress. The correlation and regression analysis were done to investigate the links between laboratory vigor test with emergence performance under both field and pot conditions. The results showed that the SG of 16 seed lots were high, similar, and did not differ significantly between seed lots. However, the seedling emergence performance (emergence percentage, seedling dry weight, and simplified vigor index) differed significantly between seed lots under both field and pot conditions. The SG was not significantly correlated with seedling emergence performance under either the field or pot conditions. The counts of RE at selected timing, MGT, and VI showed a significant relationship with seed vigor as reflected by seedling emergence performance under diverse environmental conditions, and we found that RE at 108 h was highly predictive of seed vigor and seedling emergence. The RE at 108 h and VI were positively related to seed vigor, while MGT was negatively related. The seed lots with low vigor had lower RE at 108 h and VI but longer MGT. Overall, both RE at 108 h, MGT, and VI can be used to estimate seed vigor and predict seedling emergence under different environmental conditions, and we highly recommend RE at 108 h as a quick, precise, and convenient vigor test and early warning sign for seed storage of E. sibiricus. These results will enable seed researchers, plant breeders, farmers, and government program directors to target higher seed vigor more effectively for E. sibiricus and similar grass species.

1. Introduction

Siberian wildrye (Elymus sibiricus L.) (SWR), which belongs to the family of Poaceae, is a globally important perennial, predominantly self-pollinating, and cool-season bunchgrass [1]. It is indigenous to alpine areas of China, especially on the Qinghai-Tibetan Plateau, and also widespread in Asia, Europe, and North America [2]. Due to its excellent drought and cold tolerance, high yield and nutrition potential, and good palatability, SWR has been widely cultivated in artificial and natural grassland and commonly used as animal feed worldwide and thus play an important role in developing animal husbandry and grass-livestock industry [3,4]. Other than its feeding value, SWR has also attracted more and more ecological attention due to its good adaptability to diverse environmental conditions, and good performance in degraded grassland and saline–alkali soil restoration [5,6]. Despite SWR’s valuable agricultural and ecological uses and economical importance, its low seed yield and quality have become one of the major constraints encountered by farmers, herders, and agricultural companies. Previous research suggested that poor establishment of small-seeded forage species is common, and weak seedlings produced by forage seeds also reduce the possibility of survival [7,8], especially under adverse environmental conditions, such as drought, salinity, and alkalinity stresses [9]. Thus, improving stand establishment in unfavorable environmental conditions is a critical determinant of SWR cultivation and utilization.
The screening of good-quality seeds is an effective method to enhance seedling emergence and stand establishment, and thus, achieving a better productivity and environment [10]. Seed vigor is an important aspect of seed quality [11], which is defined as the sum of the properties of the seed that determine the level of activity and the performance of a seed or seed lot during germination and seedling emergence [12]. Previously, many researchers the presence of a positive linear relationship between seed vigor and seedling emergence under different conditions [13,14,15,16]. High-vigor seeds show rapid and uniform germination and emergence performance, especially under stressful environmental conditions [9,10]. In contrast, low-vigor seeds generally caused poor seedling emergence and resulted in serious yield and economic losses, as previously found for alfalfa (Medicago sativa L.) [17], white clover (Trifolium repens L.) [18], Festuca sinensis [19], and many other plant species [20,21,22]. Therefore, more attention should be paid to seed vigor and its testing for grass and forage species.
Seed vigor testing is an important component of quality assurance in crop and forage seed production [23,24]. The traditional standard germination (SG) test, conducted according to the International Seed Testing Association, is generally used to evaluate seed quality [25]. However, seed vigor describes the comprehensive characteristics of the seeds beyond SG, and seeds from different commercially available sources may have similarly high levels of SG in the laboratory. Nevertheless, under more unpredictable conditions experienced in the field, these seeds may have strikingly contrasting abilities to establish normal plants due to differences in their vigor [9,12]. Accordingly, there is an imperative need to develop more feasible and precise approaches to test SWR seed vigor.
There are many methods to test seed vigor, such as germination characteristics [26], electrical conductivity [27], controlled deterioration [28], accelerated aging [29], flow cytometry [18,20,30], and seed physical properties [31,32,33]. Previous reports proposed that an early individual count of radicle emergence (RE) can be used as a precise and rapid method to test seed vigor for grain crops [34,35] and horticulture crops [36,37]. The RE test also estimates seed vigor, as reflected by field emergence (FE), for many grass and forage species. For example, Khajeh-Hosseini and Cheshmi found that a single count of RE carried out at 24 h for alfalfa could be used as a vigor test and was highly predictive of FE [17]. Likewise, a single count of RE at 32 h also effectively ranks the seed vigor level of seed lots for forage grass pearl millet (Pennisetum glaucum) [38].
Recently, the mean germination time (MGT) of pant seed lots determined during RE test in the laboratory was found to be related to FE [39,40]. In low-vigor seeds, the RE is delayed, and evidence has indicated that the vigor level determines the length of this delay, which has been referred to as the lag period and described by the MGT [24]. Thus, the test based on the measurement of MGT also has great potential as an efficient way to test seed vigor [15]. High-vigor seeds usually have a higher ability for metabolic repair and hence a shorter lag period (MGT) during RE, and thus seed lots with longer MGT are lots with slow and lower RE and germination and hence lower seed vigor, and vice versa [41]. Increasing evidence has suggested that MGT was highly indicative of seed vigor as expressed as seedling emergence under different environmental conditions in commercial seed lots of many grass and forage species, including Italian ryegrass (Lolium multiflorum Lam.) [42], alfalfa [43], and Chinese milk vetch (Astragalus sinicus) [24].
Though the relationship between RE and germination characteristics, including MGT with seed vigor and seedling emergence performance, has been widely reported, until now, little reference is available regarding the seed vigor-testing of SWR. Considering the importance of selection of high-vigor grass seeds for sowing, we aimed to explore whether RE at certain timing and germination characteristics, such as MGT, can predict seedling emergence under diverse environmental conditions and thus estimate seed vigor for SWR and develop a feasible and efficient vigor test for SWR based on the above-mentioned methods. The results of this research will provide important parameters for seed vigor testing and prediction of emergence performance for SWR and similar grasses.

2. Materials and Methods

2.1. Seed Materials

Samples of 16 seed lots of SWR were collected from various commercial sources in China. The seeds were certificated for their species and quality during seed production and before selling. The seed lots were labeled randomly. For each seed lot, sufficient seeds were collected (in excess of 500 g) to ensure the implementation of subsequent trials. These seed lots had been produced over several years (Table 1) from different areas in China and stored dry at 4 °C before they were used in the current experiment. The basic information of seed lots, including the initial seed moisture content (on the basis of seed wet weight) and thousand-grain weight, are also reported in Table 1. The research described here was carried out from 2021 to 2023.

2.2. Standard Germination Experiment

The SG experiments were conducted according to the “Rules of Seed Testing for Forage, Turfgrass and Other Herbaceous Plant” (GB/T 2930.4) of the National Standards of the People’s Republic of China [44]. Four replications of 50 seeds of each seed lot were used, and seeds were sown in 120 × 120 mm Petri dishes on the top of two layers of filter paper moistened with distilled water. Seeds were incubated at 25 °C with 8 h light/16 h dark photoperiod (under white fluorescent tubes with a mean photon irradiance at seed level of 60 μmol m−2 s−1, 400–700 nm). Distilled water was added to the dishes when necessary to keep the filter paper moist during the germination period. The position of dishes in the incubator was rotated daily. The SG was determined and expressed as the percentage of normal seedlings (intact seedlings with complete and healthy radicles and plumules, the seedlings with slight defects were also categorized into normal seedlings) after 12 days.

2.3. Early Individual Count of Radicle Emergence

Four replications of 50 seeds of each seed lot were set to germinate in temperature and light conditions as stated above for the SG experiment. The RE counts were recorded every four hours for up to seven days. The number of seeds that displayed RE (2 mm-long radicle) was determined and converted into a percentage for each replication. At each emergence count, the average RE for each seed lot was calculated and reported. Seedling length (SLL) measurements were done for each seed lot after RE test. To this purpose, 10 seedlings were randomly selected from each Petri dish, and seedlings (root + shoot) were measured for length.
The MGT was calculated according to the following equation [45]:
MGT (hours) = Σ Hnn
where n is the number of newly germinated seeds on hour H, and H is the number of hours counted from the beginning of the experiment.
The germination index (GI) was calculated as previously described by Hu et al. [46] and Maguire [47]:
GI = Σ (Gt/Dt)
where Gt represents the number of emerged seeds on the t hour and Dt represents germination hours.
The vigor index (VI) was calculated according to Zeng et al. [48]:
VI = GI × SLL

2.4. Field Emergence Experiment

Three-year field experiments were carried out at Jiaozhou Experimental Station of Qingdao Agricultural University in Shandong Province, China (latitude: 36°27′ N, longitude: 120°05′ E, elevation: 20 m) from 2021 to 2023. The field station is in the warm temperate monsoon climate, with mean annual temperature and mean annual precipitation of 13.8 °C and 686.0 mm, respectively. The soil of the study site is a clay loam with an average soil dry bulk density of 1.3 g cm−3 and soil pH of 7.3. Before the present experiment, the maize (Zea mays L.)/wheat (Triticum aestivum L.) rotation was grown in this plot for three consecutive years. In June, from 2021 to 2023, seeds from each seed lot were sown, and no presowing seed treatment was used. During each sowing, a randomized complete block design (RCBD) with four replications was used, and each replication contained 50 seeds. The seeds from each seed lot and each replication were hand-sown in a 100 cm row, with 50 cm spaces between adjacent rows (seed lots). The seeds were sown at a depth of approximately 20 mm.
The daily mean temperature and daily precipitation data during FE period from 2021 to 2023 were collected from local meteorological stations (Figure 1). The mean temperature during field emergence periods from 2021 to 2023 were 23.6, 25.8, and 24.8 °C, respectively. Meanwhile, the total rainfall during experimental periods from 2021 to 2023 was 67.8, 327.9, and 215.2 mm, respectively. No irrigation, fertilization, or herbicide was added to the plots during the three-year FE experiments. After 30 days of sowing each year, the emerged seedlings were counted, and the emergence percentage was calculated.
After the FE experiment each year, all emerged seedlings from each block and each seed lot were cut at the soil level and amalgamated before being dried at 80 °C for 24 h and then weighed, and the mean field seedling dry weight (FSDW) was then calculated. The field simplified vigor index (FSVI) was derived arithmetically by multiplying the emergence percentage with the FSDW [49].

2.5. Pot Emergence under Different Environmental Conditions

Cylindrical plastic pots (inner diameter, 14 cm; height, 12 cm) were used in this part of the research. The soil used in pot experiments was collected from the Jiaozhou Experimental Station of Qingdao Agricultural University, as described above. The soil was sieved through a 2 mm sieve to remove debris. The soil was dried at 120 °C for 24 h and then spread out for drying, followed by heating and homogenization. The SWR seeds from 16 seed lots were sown under diverse environmental conditions, including control (irrigated with distilled water every four days), drought stress (irrigated with distilled water every seven days), and salinity stress (irrigated with 200 mM NaCl solution every four days) conditions. The abiotic treatments for the control, drought stress, and salinity stress were conducted in a greenhouse (20 °C, 60% relative humidity) on the campus of Qingdao Agricultural University (latitude: 36°19′ N, longitude: 120°23′ E, elevation: 39 m), Shandong Province, China. For each seed lot and treatment, four replications of 30 seeds were sown at a depth of approximately 20 mm in pots that contained 950 g of dry soil, which had been treated as stated above. After sowing, 200 mL of distilled water or NaCl solution was used to irrigate each pot immediately, and every four days for control and salinity stress treatments, and every seven days for drought stress treatment. The pots containing soil and seeds were placed in a random arrangement on a table in the greenhouse, and the locations of the pots were changed daily to avoid edge effects.
To monitor the soil moisture content (SMC) for the control and drought stress treatments during pot emergence experiment, two extra pots without seeds were irrigated under the same conditions as those in each irrigation regime of the experiment. These two pots were weighed daily using an electronic balance (on days with irrigation, the pot was weighed immediately after the irrigation was added), and the SMC was calculated according to the following equation [50]:
SMC (%) = (Ww − 950)/Ww × 100
where SMC is the soil moisture content (%), and Ww is the weight (g) of wet soil weighed every day.
The pot trials lasted for 30 days. At the end of the experiment, the number of the emerged seedlings was determined in each pot, and the pot emergence percentage (PEP) was calculated. All emerged seedlings in each pot were harvested at the soil level and combined before being dried at 80 °C for 24 h and then weighed. The mean pot seedling dry weight (PSDW) was then calculated. The pot simplified vigor index (PSVI) was also calculated as described above in the field trial.

2.6. Data Analyses

All data analyses were performed using GenStat for Windows 18.0th Edition (VSN International Ltd., Hemel Hempstead, UK). Proportional data were arcsine-transformed before statistical analysis, and nontransformed data are shown in all tables and figures. All measurements presented are the means of four replications. Data for seedling emergence performance in field or pot trials in response to the seed lot and year or environmental conditions were subjected to analysis of variance (ANOVA). Significant differences between seed lots were compared using Duncan’s multiple range test at the p < 0.05 probability level. Pearson correlation and regression analysis were conducted to detect the relationships between SG, RE, MGT, and VI with seedling emergence performance in field and pot experiments under diverse environmental conditions.

3. Results

3.1. Standard Germination

For 16 seed lots of SWR, the SG was high and ranged from 89.5 (lot 13) to 96.5% (lot 15). The SG for seed lot 15 was significantly higher than that for lots 1, 2, 7, 9, 12, and 13; the SG for seed lot 13 was significantly lower than that for lots 4, 5, 6, 8, 10, 11, 14, 15, and 16. Moreover, no significant difference was observed between seed lots for SG. In addition, we found that the year of seed production had no influence on SG. For example, the short-stored (one year storage) seed lot 15 had high SG of 96.5%, while a relatively low SG of 91.0% was also observed for seed lot 7 with the same storage period; in contrast, for long-stored seed lots 5 and 13 (five years storage), significant differences in SG were also obtained (94.5% for lot 5 and 89.5% for lot 13) (Table 1).

3.2. Radicle Emergence, Mean Germination Time, and Vigor Index

In contrast with SG, the progress curves of RE showed obvious differences in the rate of germination among 16 seed lots of SWR (Figure 2). We found the RE time courses for seed lots of SWR revealed different vigor levels among them. The counts of RE showed that seed lots 6, 10, and 11 germinated the most rapidly and seed lots 8 and 13 were slowest (Figure 2). For example, at 84 h after germination, the RE had reached 60.5 and 68.5% for seed lots 6 and 10, respectively, however, for seed lot 13, it was still very low (2.5%). The mean RE of 16 seed lots of SWR ranged from 4.8% at 60 h to 91.7% at 168 h. At the final count (168 h), the RE for 16 seed lots varied between 84.5% (seed lot 13) and 95.5% (lots 6 and 16). During the RE time course, the largest variation for RE between seed lots occurred at 108 h (Figure 2) and ranged from 23.0 (lot 8) to 91.5% (lots 6 and 10) (Table 1).
The results from the progress curves of RE were consistent with the SLL and calculated MGT, GI, and VI (Table 1). The SLL was significantly different between 16 seed lots (p < 0.05) of SWR and ranged from 2.6 (seed lots 1 and 8) to 4.1 cm (seed lot 3) (Table 1). The MGT was also significantly influenced by seed lot and ranged from 75.8 to 123.2 h for 16 seed lots. The germination of seed lot 10 was significantly faster (lowest MGT) than all of the other seed lots, while seed lot 13 was significantly slower (largest MGT) than other seed lots except for seed lot 8 (p < 0.05) (Table 1).
Similarly, the GI and VI also showed significant differences between seed lots of SWR (p < 0.05). The GI and VI for seed lots ranged from 0.35 (seed lot 13) to 0.67 (seed lot 10) and 1.01 (seed lots 8 and 13) to 2.33 (seed lot 10), respectively (Table 1). The GI of seed lot 10 was significantly higher than all of the other seed lots, and the VI of seed lot 10 was significantly higher than other seed lots except for seed lots 3, 11, and 16. The GI of seed lot 13 was significantly lower than all of the other seed lots, and the VI of seed lots 8 and 13 were significantly lower than other seed lots except for seed lot 1 (p < 0.05) (Table 1).
Overall, we also found that the seed vigor, as reflected by RE, MGT, and VI, is associated with the year of seed production (Table 1). The high-vigor seed lots, as expressed by higher RE, VI, and lower MGT, such as seed lots 6, 10, and 11, are also newly produced seeds (stored for one or two years); in contrast, the low-vigor seed lots are generally long-stored seed lots, such as lots 8 and 13 (stored five years).
The count of RE at 108 h was highly and negatively correlated with MGT for 16 seed lots of SWR, with a determination coefficient of regression analysis (r2) of 0.948 (p < 0.001) (Figure 3). Likewise, the count of RE at 108 h was significantly and positively related with VI for 16 seed lots, with a determination coefficient of regression analysis of 0.878 (p < 0.001) (Figure 3).

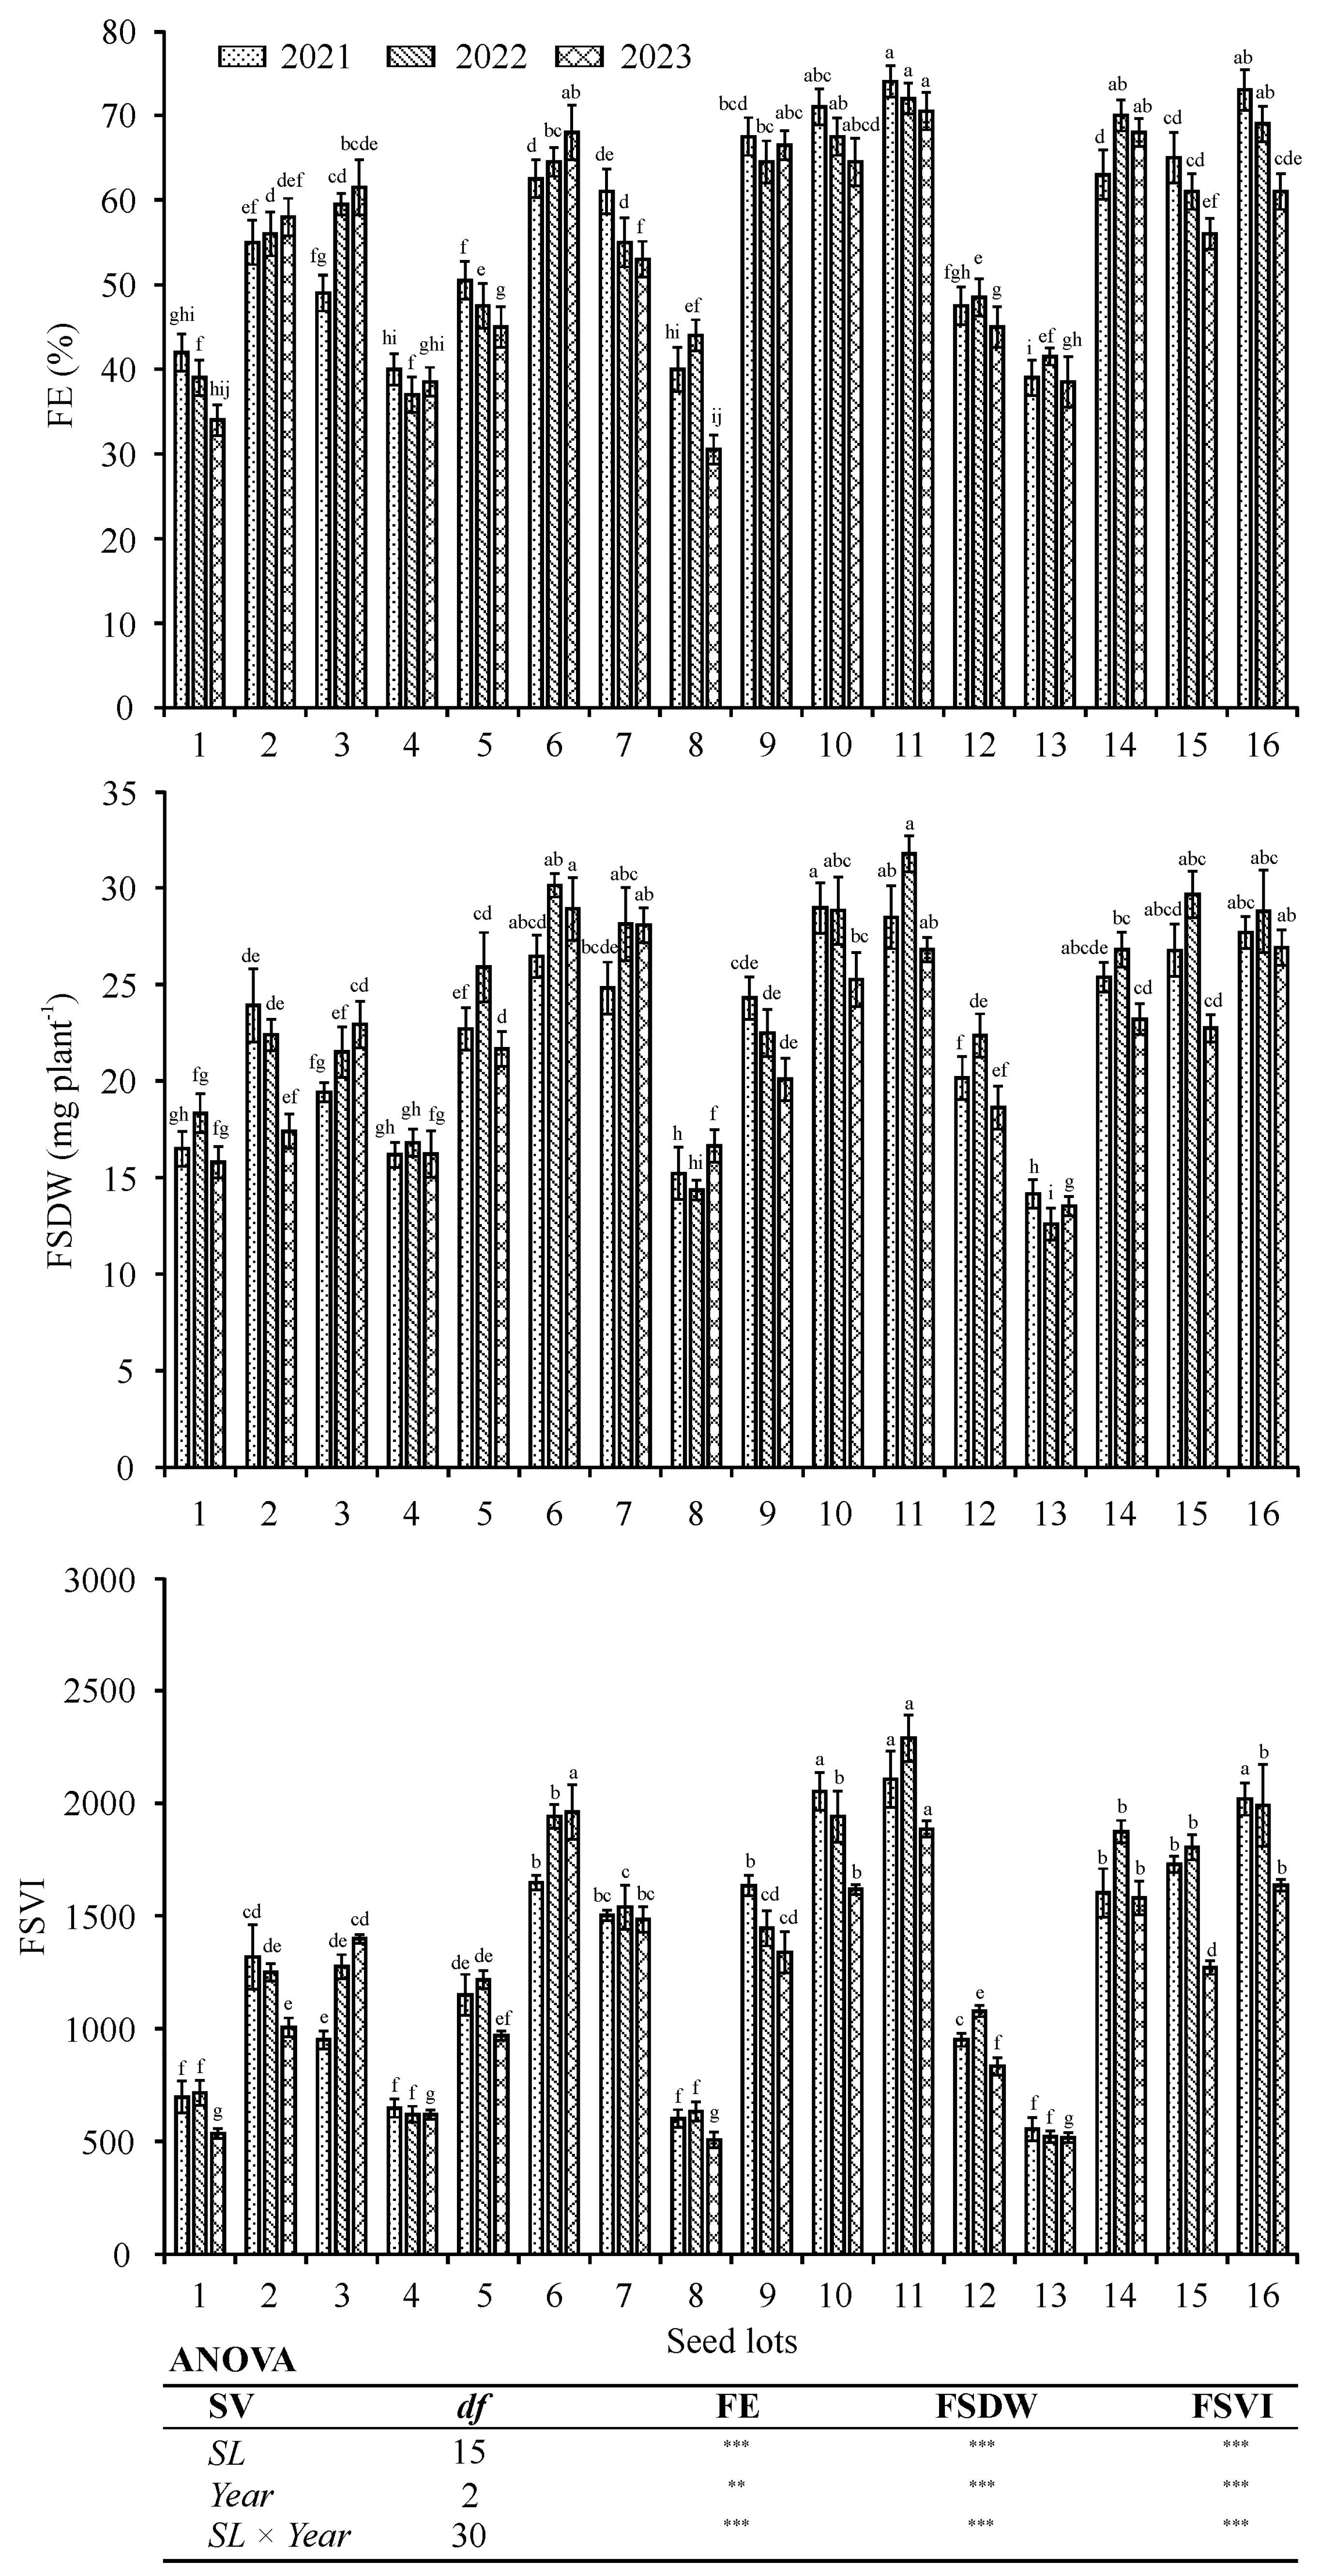
3.3. Three-Year Field Experiments

The total precipitation during the field experiment was quite variable from 2021 to 2023. The total precipitation in 2022 and 2023 were 327.9 and 215.2 mm, respectively. However, much less precipitation during the field trial was observed in 2021 (67.8 mm). The mean temperature during the field trial of three years was also variable but was within normal fluctuations of the local climate (Figure 1).
The results from ANOVA revealed that seed lot and year had very significant effects on FE, FSDW, and FSVI of SWR (p < 0.01 or 0.001). In addition, the above-mentioned parameters were also significantly influenced by the interaction of seed lot and year (p < 0.001) (Figure 4).
There were evident differences for FE, FSDW, and FSVI in three years between the 16 SWR seed lots with similar SG (Figure 4). In 2021, the FE, FSDW, and FSVI for the 16 SWR seed lots ranged from 39.0 (seed lot 13) to 74.0% (seed lot 11), 14.1 (seed lot 13) to 29.0 mg plant−1 (seed lot 10), and 553.9 (seed lot 13) to 2106.5 (seed lot 11), respectively, whereas the corresponding FE, FSDW, and FSVI for 16 seed lots in 2022 ranged from 37.0 (seed lot 4) to 72.0% (seed lot 11), 12.6 (seed lot 13) to 31.8 mg plant−1 (seed lot 11), and 520.5 (seed lot 13) to 2288.3 (seed lot 11), respectively. And in 2023, the FE, FSDW, and FSVI for 16 seed lots ranged from 30.5 (seed lot 8) to 70.5% (seed lot 11), 13.5 (seed lot 13) to 28.9 mg plant−1 (seed lot 6), and 506.4 (seed lot 8) to 1961.3 (seed lot 6), respectively (Figure 4).
Except for seed lot, yearly variations of FE, FSDW, and FSVI were also significant across all seed lots. The average FE from 2021 to 2023 was 56.3, 56.0, and 53.7%, respectively. The average FSDW from 2021 to 2023 was 22.6, 23.8, and 21.5 mg plant−1, respectively, and for FSVI, the average values from 2021 to 2023 were 1322.6, 1383.2, and 1197.3, respectively (Figure 4).

3.4. Pot Experiments

The influences of diverse soil conditions on the PEP, PSDW, and PSVI of 16 SWR seed lots in pot studies are presented in Table 2. The results from ANOVA showed that seed lot, environmental conditions, and their interaction effects had very significant impacts on PEP, PSDW, and PSVI (p < 0.001), except for seed lot × environmental condition interaction effect, which had no significant influence on PEP (Table 2).
The dynamics of SMC for drought stress and control conditions during the pot study period are reported in Figure 5. The SMC in the control conditions was obviously higher than that in the drought stress condition. In the control condition, the SMC in pot varied between 8.32 to 24.22%, with an average value of 17.06% during the pot study; nevertheless, in the drought stress condition, the SMC in pot ranged from 4.77 to 20.52%, with an average value of 11.18% during pot study (Figure 5).
Overall, the PEP, PSDW, and PSVI decreased significantly with drought stress and salinity stress treatments as compared to control conditions and differed significantly between the 16 SWR seed lots under each environmental condition (p < 0.05) (Table 2). For example, the mean PEP, PSDW, and PSVI across 16 seed lots under control conditions were 76.4%, 26.9 mg plant−1, and 2060.6, respectively (Table 2). However, under drought stress condition treatment, the average PEP, PSDW, and PSVI across 16 seed lots were 46.6%, 18.4 mg plant−1, and 868.6, respectively, and the corresponding average values for the above parameters in salinity stress treatment were 46.7%, 18.3 mg plant−1, and 863.4, respectively, which were much lower than that in control treatment (Table 2).
Among 16 SWR seed lots, the average PEP, PSDW, and PSVI across three environmental conditions ranged from 46.4 (seed lot 13) to 66.4% (seed lot 10), 15.0 (seed lot 8) to 26.8 mg plant−1 (seed lot 10), and 738.0 (seed lot 8) to 1834.1 (seed lot 10), respectively (Table 2). Generally, in both environmental conditions, seed lot 10 had the highest pot emergence variables, while seed lots 8 and 13 had the lowest (Table 2).

3.5. Relationships between Standard Germination, Radicle Emergence, Mean Germination Time, and Vigor Index with Seedling Emergence Performance under Diverse Environmental Conditions

The SG was not significantly correlated with emergence performance under either field or pot conditions, with low correlation coefficients (Table 3 and Table 4). The regression analysis also revealed a low determination coefficient of regression analysis between SG and emergence performance under either field and pot conditions.
On the contrary, the correlation analysis indicated that early individual counts of RE from 64 to 168 h were highly predictive of emergence performance under both field and pot conditions (Table 3 and Table 4). We found for FE, FSDW, and FSVI in most years and PEP, PSDW, and PSVI under most environmental conditions, the most significant correlations were obtained for the individual count of RE at 108 h (p < 0.001), with correlation coefficients between RE at 108 h with emergence performance of 0.867 to 0.965 in field conditions, and 0.768 to 0.977 under diverse environmental conditions in pot (Table 3 and Table 4). The regression analysis also revealed significant positive relationships between RE at 108 h with emergence performance under both field and pot conditions, with a highly or very highly significant determination coefficient of regression analysis. It is evident that seed lots with higher RE at 108 h have higher emergence percentage, seedling dry weight, and simplified vigor index in both field and pot conditions (Figure 6). Thus, a large proportion of the variance in FE (81%, 2021; 82%, 2022; and 84%, 2023), FSDW (85%, 2021; 79%, 2022; and 75%, 2023), FSVI (83%, 2021; 88%, 2022; and 90%, 2023), PEP (80%, control; 90%, drought stress; and 85%, salinity stress), PSDW (79%, control; 92%, drought stress; and 59%, salinity stress), and PSVI (88%, control; 95%, drought stress; and 78%, salinity stress) could be accounted for by regression on RE at 108 h (Figure 6).
In addition, the MGT, calculated from time courses of RE dynamics, were also significantly, and in this case negatively, correlated with emergence performance under both field and pot conditions (Table 3 and Table 4), with a determination coefficient of regression analysis ranging from 0.664 to 0.822 in field conditions, and 0.579 to 0.931 under pot conditions (Figure 7). That is, seed lots having lower FE, FSDW, FSVI, PEP, PSDW, and PSVI had higher MGT, whereas the more vigorous seed lot, with higher emergence variables, had lower MGT (Figure 7).
Similarly to RE, the VI is also positively related with emergence performance under both field and pot conditions. The determination coefficient of regression analysis between VI and emergence variables in field conditions ranged from 0.602 to 0.779 and varied between 0.608 and 0.931 under pot conditions. It is evident that seed lots with higher VI during RE time courses have higher emergence variables under a wide range of environmental conditions in both field and pot (Table 3 and Table 4; Figure 8).

4. Discussion

Seed germination, seedling emergence, and early growth periods are important stages in the seedling establishment and recruitment of plant species and the most sensitive ones in the plant’s life cycle under diverse environmental conditions [51,52]. The successful stand establishment also determines the subsequent growth and ultimate yield and productivity for crops and forages [53,54]. Under the circumstance of global climate change, increasing CO2 atmospheric levels and the greenhouse effect are closely associated with the extreme climatic events we are witnessing all over the world [55]. The ongoing global warming and erratic precipitation patterns have intensified the incidences of abiotic stressful conditions for agricultural production [56]. Drought and salinity stress are among the main environmental stresses that negatively influence seed germination, seedling emergence, as well as subsequent productivity of crop and forage, challenging the world’s ecological and food security [57,58]. In the present experiment, as compared with the control treatment, drought and salinity stress significantly decreased the seedling emergence performance, including pot emergence percentage and seedling weight in the pot experiment (Table 2). Moreover, the three-year field trials also clearly revealed that FE was largely lower than the SG in the laboratory (Figure 4), which suggested that adverse environmental conditions experienced in the field are the major deterrents for achieving optimum seed germination and emergence. The reduced emergence under stressful and field conditions is in line with previous research in other grass species and is not unusual, including alfalfa [43] and F. sinensis [19]. Moreover, the reduced germination in pot and field conditions as compared with SG could also be due to lower soil-to-seed contact and water availability on the soil surface than on the filter papers [59]. On the other hand, the results from the present study clearly showed that the extent of the adverse influence of negative environmental conditions on seed germination and emergence is seed-lot-dependent, which indicates that the screening of high-vigor seeds is an ideal way by which to alleviate the unfavorable environmental conditions. Previously, Hall and Wiesner [60] also reported that the use of high vigor is beneficial for seedling emergence in the field for forage grass Meadow Bromegrass (Bromus biebersteinii), which is consistent with our results.
Seed vigor determines the economic viability of seed growers and producers, thus seed vigor testing is a critical aspect of quality control during seed production [8]. However, the vigor testing for grass species has not been extensively explored and discussed, especially for important forage and ecological grass SWR. In the present experiment, we compared SG, RE, MGT, and VI in the laboratory with results from three-year FE and pot emergence under three environmental conditions for 16 seed lots of SWR. Generally, the variables of field and pot emergence performance (emergence percentage and seedling growth) were significantly different between 16 seed lots, which effectively ranked seed lots according to their actual vigor level. Nevertheless, the high and similar SG for 16 commercially available seed lots of SWR was, overall, not correlated significantly to field and pot emergence performance. These findings are consistent with experiments of Matthews et al. [61], Ilbi et al. [62], and Wang et al. [27], who indicated that seed lots with commercially acceptable SG may show disparate emergence performance under extensive environmental conditions due to their actual vigor level. The seed vigor is a complex comprehensive characteristic that describes the properties of seeds to adapt a wide range of environmental conditions [13], while the SG test is carried out under optimum laboratory conditions, which may not reflect the actual vigor level of seed lots [43]. Thus, more precise evaluation methods of seed vigor and quality beyond SG is an important task for seed researchers [24].
In contrast with SG, we found that early individual counts of RE at certain timings are well related with field and pot emergence performance, and thus seed vigor for 16 SWR seed lots, and according to the correlation coefficients, we selected RE at 108 h as the optimal timing to provide a quick and accurate vigor test for SWR (Table 3 and Table 4). The very significant determination coefficient of regression analysis between RE at 108 h between emergence percentage, seedling dry weight, and simplified vigor index both in field and pot conditions shows that a large proportion of the variance in vigor can be explained by RE at 108 h (Figure 6). In the SG experiment, different seed lots generally reached an acceptable level of final the germination at the end of germination period, as in the present experiment, the RE test would allow the early selection of lots with the highest levels of germination and the most rapid germination [36]. It has been reported that one of the basic physiological reasons for low-vigor seeds is deterioration and aging, and low-vigor seeds need a longer time between the start of imbibition and RE (protrusion of the radicle) [63]. In the seed lots with high vigor and physiologically high quality, the RE occurred earlier since there is less time needed to complete the damage repair. On the contrary, low-vigor seed lots need a longer period between imbibition to RE, which is necessary to allow for metabolic repair [19]. The RE test provides a chance to frequently detect the early radicle protrusion situation and thus provide valuable information regarding the time needed for damage repair and the vigor level of seeds. The high RE at selected timing associated with better emergence performance was also associated with a shorter MGT, which has been reported for wheat [64], maize [39], rice (Oryza sativa L.) [34], and many other plant species and is not unusual [65,66,67]. Evidence to support the use of RE test as a suitable vigor estimation has also been widely reported for grass and forage species, for example, Lv et al. [68] indicated that a single count of RE at 52 and 76 h provides a precise and quick test for seed vigor of important grass species oat (Avena sativa L.) and Elymus nutans, respectively. In addition, Venuste et al. [19] reported that RE count at 88 h was significantly correlated with FE and thus successfully estimated seed vigor for F. sinensis. Moreover, in Poa crymophila and Elymus dahuricus, an individual count of RE at 144 and 108 h, respectively, was significantly correlated with FE and thus seed vigor [69]. Similarly, in our results, the SWR from genus Elymus also showed a significant relationship between RE at 108 h with seedling emergence performance both under field and pot conditions. The RE count, therefore, provided a precise and rapid test of the ability of a seed lot to emerge under diverse environmental conditions than dose SG, which the International Seed Testing Association Rules and the National Standards of People’s Republic of China [44] state should be after 12 days.
In the present experiment, the MGT, calculated from the time courses of RE, also effectively estimated seedling emergence performance under both field and pot conditions for seed lots of SWR (Figure 7). The longer this MGT period for seed lots, the lower emergence and smaller seedlings produced in diverse environmental conditions in pots and three-year field conditions. The MGT represents the mean lag period or the delay from the start of imbibition to RE (visible germination took place), which is the time proposed to allow for the metabolic repair resulting from seed aging or deterioration [70]. For example, membranes and DNA damage repair occurred during the lag period and is a necessary step for the subsequent events resulting in germination [71]. Therefore, seed lots with low vigor would germinate more slowly due to a longer need for damage repair, leading to a longer MGT and longer delay to RE [42]. Moreover, all SWR seed lots used in the present study belonged to a single cultivar. Thus, any differences in their germination and emergence patterns and stress resistance were not due to their genotype. Therefore, the differences in the lag period of delay to germination are most likely due to their actual vigor level caused by seed aging or deterioration [9]. We noticed that in our study, among all seed lots, as expressed by seedling emergence under field and pot conditions, seed lots 6, 10, and 11 had relatively high vigor and were also the youngest of all seed lots (stored one or two years before the experiment); on the other hand, seed lots 8 and 13, had the lowest vigor level (longer MGT or lower seedling emergence under different conditions) and was also the oldest of all seed lots (stored five years before the experiment). This finding supported the previously stated aging-repair hypothesis, according to which older seeds (such as lots 8 and 13) need a longer time to complete damage repair and then germination, thus showing a longer lag period or MGT [72]. Accordingly, our results also supported previous reports that MGT was highly indicative of seed vigor, as expressed in seedling emergence of many grass and forage species such as alfalfa [43], oat and E. nutans [68], and Chinese milk vetch [24].

5. Conclusions

Overall, the present research clearly shows that the 16 SWR seed lots differed significantly in their seedling emergence and seedling growth performance under diverse environmental conditions in field and pot experiments. The significant influences of year and its interaction with seed lot on field emergence performance were detected. In addition, different environmental conditions also had a significant influence on seedling emergence for each SWR seed lot. The drought and salinity stresses significantly decreased the seedling emergence for SWR seed lots. The high-vigor seed lots that performed well in field and pot conditions were also the lots that experienced shorter storage periods. The SG failed in estimating seed vigor for SWR seed lot. However, both RE, MGT, and VI were highly predictive of seed vigor, as reflected by emergence performance both under field and pot conditions. An individual count of RE at 108 h provides an ideal vigor test for SWR. Considering the very frequent counts needed to determine the MGT and VI is difficult, we recommend an individual count of RE at 108 h as a quick, convenient, and precise vigor test. It can also predict seedling emergence under various environmental conditions for important grass species SWR. These results provide important parameters for SWR seed vigor testing and prediction of emergence performance. The evaluation of the correlation between seedling emergence with RE, MGT, and VI might also reveal similar obvious associations in other plants. Our results also provide a valuable scientific basis for further research on physiological and molecular mechanisms underlying the aging and deterioration of SWR seeds. In the future, more challenging is the automation of RE counts and the standardization of vigor tests for SWR, and more attention should be paid to this aspect.

Author Contributions

Conceptualization, Q.T., J.S. and Y.Z. (Yanhua Zhao); methodology, Q.T., J.X., F.M., Y.Z. (Yaqi Zhang), X.L. and S.G.; software, Q.T., Y.S. and S.Z.; validation, Q.T. and Y.Z. (Yanhua Zhao); formal analysis, Q.T., S.Z. and Y.Z. (Yanhua Zhao); investigation, Q.T., J.X., F.M., Y.Z. (Yaqi Zhang), X.L., S.G., Y.S. and Y.Z. (Yanhua Zhao); resources, Q.T., J.S. and Y.Z. (Yanhua Zhao); data curation, Q.T., S.Z. and Y.Z. (Yanhua Zhao); writing-original draft preparation, Q.T.; writing-review and editing, Q.T., J.X., F.M., J.S. and Y.Z. (Yanhua Zhao); visualization, Q.T. and S.Z.; project administration, Q.T., J.S. and Y.Z. (Yanhua Zhao); funding acquisition, Q.T., J.S. and Y.Z. (Yanhua Zhao). All authors have read and agreed to the published version of the manuscript.

Funding

This study was funded by the China Agricultural Research System (CARS-34), the Natural Science Foundation of Shandong Province (ZR2022QC151), the Qingdao Agricultural University Doctoral Start-up Fund (663-1121038) and the Development Project of Intelligent Weed Identification Technology (20230257).

Data Availability Statement

All relevant data for this study were reported in this article.

Acknowledgments

We would like to thank Jipeng Sun for lots of assistance during field experiments. The authors appreciate the anonymous reviewers for their critical comments and suggestions which substantially improve the quality of earlier version of manuscript.

Conflicts of Interest

The authors declare no conflicts of interest.

References

  1. Ntakirutimana, F.; Xiao, B.W.; Xie, W.G.; Zhang, J.C.; Zhang, Z.Y.; Wang, N.; Yan, J.J. Potential effects of awn length variation on seed yield and components, seed dispersal and germination performance in Siberian wildrye (Elymus sibiricus L.). Plants 2019, 8, 561. [Google Scholar] [CrossRef] [PubMed]
  2. Wang, M.Y.; Hou, L.Y.; Zhang, Q.; Yu, X.N.; Zhao, L.; Lu, J.X.; Mao, P.S.; Hannaway, D.B. Influence of row spacing and P and N applications on seed yield components and seed yield of Siberian wildrye (Elymus sibiricus L.). Crop Sci. 2017, 57, 2205–2212. [Google Scholar] [CrossRef]
  3. Zheng, Y.Y.; Zhang, Z.Y.; Wan, Y.Y.; Tian, J.Y.; Xie, W.G. Development of EST-SSR markers linked to flowering candidate genes in Elymus sibiricus L. based on RNA sequencing. Plants 2020, 9, 1371. [Google Scholar] [CrossRef] [PubMed]
  4. Zhang, J.C.; Xie, W.G.; Yu, X.X.; Zhang, Z.Y.; Zhao, Y.Q.; Wang, N.; Wang, Y.R. Selection of suitable reference genes for RT-qPCR gene expression analysis in Siberian Wild Rye (Elymus sibiricus) under different experimental conditions. Genes 2019, 10, 451. [Google Scholar] [CrossRef]
  5. Shang, Z.H.; Cao, J.J.; Guo, R.Y.; Long, R.J.; Deng, B. The response of soil organic carbon and nitrogen 10 years after returning cultivated alpine steppe to grassland by abandonment or reseeding. Catena 2014, 119, 28–35. [Google Scholar] [CrossRef]
  6. Zhang, Z.Y.; Xie, W.G.; Zhang, J.C.; Wang, N.; Zhao, Y.Q.; Wang, Y.R.; Bai, S.Q. Construction of the first high-density genetic linkage map and identification of seed yield-related QTLs and candidate genes in Elymus sibiricus, an important forage grass in Qinghai-Tibet Plateau. BMC Genom. 2019, 20, 861. [Google Scholar] [CrossRef]
  7. Wang, Y.R.; Yu, L.; Nan, Z.B.; Liu, Y.L. Vigor tests used to rank seed lot quality and predict field emergence in four forage species. Crop Sci. 2004, 44, 535–541. [Google Scholar] [CrossRef]
  8. Zhang, Y.Q.; Tao, Q.B.; Zhang, R.Z.; Ma, Y.L.; Xing, J.Y.; Zhou, S.H.; Liu, Y.H.; Meng, F.S.; Sun, J. A seed vigour test based on radicle emergence during germination at 5 ℃ for four forage species. Seed Sci. Technol. 2023, 51, 361–369. [Google Scholar] [CrossRef]
  9. Tao, Q.B.; Chen, D.L.; Bai, M.J.; Zhang, Y.Q.; Zhang, R.Z.; Chen, X.F.; Sun, X.T.; Niu, T.X.; Nie, Y.T.; Zhong, S.Z.; et al. Hydrotime model parameters estimate seed vigor and predict seedling emergence performance of Astragalus sinicus under various environmental conditions. Plants 2023, 12, 1876. [Google Scholar] [CrossRef]
  10. Chen, X.L.; Wei, Z.C.; Chen, D.L.; Hu, X.W. Base water potential but not hydrotime predicts seedling emergence of Medicago sativa under water stress conditions. PeerJ 2022, 10, e13206. [Google Scholar] [CrossRef]
  11. Stanisavljević, R.; Velijević, N.; Štrbanović, R.; Postić, D.; Aleksić, G.; Trkulja, N.; Knežević, J.; Dodig, D. Seed quality of vetch (Vicia sativa L.) affected by different seed colors and sizes after various storage periods. Int. J. Agric. Biol. 2018, 20, 2655–2660. [Google Scholar]
  12. Finch-Savage, W.E.; Bassel, G.W. Seed vigour and crop establishment: Extending performance beyond adaptation. J. Exp. Bot. 2016, 67, 567–591. [Google Scholar] [CrossRef] [PubMed]
  13. Soltani, E.; Adeli, R.; Akbari, G.A.; Ramshini, H. Application of hydrotime model to predict early vigour of rapeseed (Brassica napus L.) under abiotic stresses. Acta Physiol. Plant. 2017, 39, 252. [Google Scholar] [CrossRef]
  14. Mavi, K.; Demir, I. Controlled deterioration for vigour assessment and predicting seedling growth of winter squash (Cucurbita maxima) seed lots under salt stress. N. Z. J. Crop Hortic. Sci. 2005, 33, 193–197. [Google Scholar] [CrossRef]
  15. Mavi, K.; Demir, I.; Matthews, S. Mean germination time estimates the relative emergence of seed lots of three cucurbit crops under stress conditions. Seed Sci. Technol. 2010, 38, 14–25. [Google Scholar] [CrossRef]
  16. Araújo, J.E.O.; Dias, D.C.F.S.; de Miranda, R.M.; Nascimento, W.M. Adjustment of the electrical conductivity test to evaluate the seed vigor of chickpea (Cicer arietinum L.). J. Seed Sci. 2022, 44, e202244003. [Google Scholar] [CrossRef]
  17. Cheshmi, M.; Khajeh-Hosseini, M. Single count of radicle emergence, DNA replication during seed germination and vigour in alfalfa seed lots. Seed Sci. Technol. 2020, 48, 367–380. [Google Scholar] [CrossRef]
  18. Lv, Y.Y.; Mo, Q.; Powell, A.A.; Wang, Y.R. DNA replication during seed germination, deterioration, and its relation to vigor in alfalfa and white clover. Crop Sci. 2018, 58, 1393–1401. [Google Scholar] [CrossRef]
  19. Venuste, M.; Chen, D.L.; Hu, X.W. Detection of seed vigour differences in Festuca sinensis seed lots. Seed Sci. Technol. 2022, 50, 61–75. [Google Scholar]
  20. Forti, V.A.; de Carvalho, C.; Sliwinska, E.; Cicero, S.M. Flow cytometry as a tool for analyses of soya bean seed vigour. Seed Sci. Technol. 2018, 46, 217–224. [Google Scholar] [CrossRef]
  21. Ermis, S.; Ozden, E.; Demir, I. Early radicle emergence count after controlled deterioration (CD) predicts emergence potential better than final standard germination after CD in tomato varieties. Seed Sci. Technol. 2015, 43, 278–283. [Google Scholar] [CrossRef]
  22. Wang, X.M.; Wu, B.K.; Zhang, Q.X.; Jia, L.Q.; Qi, H.N.; Zhao, G.W. Evidence for seed vigor associated with fatty acids and its composition in rice. Agron. J. 2021, 113, 2618–2628. [Google Scholar] [CrossRef]
  23. Alahakoon, A.A.C.B.; Abeysiriwardena, D.S.Z.; Damunupola, J.W.; Hay, F.R.; Gama-Arachchige, N.S. Accelerated aging test of seed vigour for predicting field emergence of wet direct-seeded rice. Crop Pasture Sci. 2021, 72, 773–781. [Google Scholar] [CrossRef]
  24. Tao, Q.B.; Sun, J.P.; Zhang, Y.Q.; Sun, X.T.; Li, Z.Y.; Zhong, S.Z.; Sun, J. Single count of radicle emergence and mean germination time estimate seed vigour of Chinese milk vetch (Astragalus sinicus). Seed Sci. Technol. 2022, 50, 47–59. [Google Scholar] [CrossRef]
  25. TeKrony, D.M.; Egli, D.B. Relationship between laboratory indices of soybean seed vigor and field emergence. Crop Sci. 1977, 17, 573–577. [Google Scholar] [CrossRef]
  26. Matthews, S.; Hosseini, M.K. Mean germination time as an indicator of emergence performance in soil of seed lots of maize (Zea mays). Seed Sci. Technol. 2006, 34, 339–347. [Google Scholar] [CrossRef]
  27. Wang, Y.R.; Yu, L.; Nan, Z.B. Use of seed vigour tests to predict field emergence of lucerne (Medicago sativa). N. Z. J. Agric. Res. 1996, 39, 255–262. [Google Scholar] [CrossRef]
  28. Leão-Araújo, E.F.; dos Santos, J.F.; da Silva, C.B.; Filho, J.M.; Vieira, R.D. Controlled deterioration test and use of the Seed Vigor Imaging System (SVIS®) to evaluate the physiological potential of crambe seeds. J. Seed Sci. 2017, 39, 393–400. [Google Scholar] [CrossRef]
  29. Sanches, M.F.G.; dos Santos, J.F.; Martins, C.C.; Vieira, R.D.; de Souza, F.H.D. Accelerated ageing test for vigour assessment of pigeon pea ‘Cajanus cajan’ (L.) Millsp. seeds. Aust. J. Crop Sci. 2014, 8, 1298–1303. [Google Scholar]
  30. Sliwinska, E. Nuclear DNA replication and seed quality. Seed Sci. Res. 2009, 19, 15–25. [Google Scholar] [CrossRef]
  31. Xie, J.; Li, Y.; Jiang, G.Q.; Sun, H.Y.; Liu, X.J.; Han, L.P. Seed color represents salt resistance of alfalfa seeds (Medicago sativa L.): Based on the analysis of germination characteristics, seedling growth and seed traits. Front. Plant Sci. 2023, 14, 1104948. [Google Scholar] [CrossRef] [PubMed]
  32. Ambika, S.; Manonmani, V.; Somasundaram, G. Review on effects of seed size on seedling vigour and seed yield. Res. J. Seed Sci. 2014, 7, 31–38. [Google Scholar] [CrossRef]
  33. Atak, M.; Kaya, M.D.; Kaya, G.; Kaya, M.; Khawar, K.M. Dark green colored seeds increase the seed vigor and germination ability in dry green pea (Pisum sativum L.). Pak. J. Bot. 2008, 40, 2345–2354. [Google Scholar]
  34. Luo, Y.; Lin, C.; Fu, Y.Y.; Huang, Y.T.; He, F.; Guan, Y.J.; Hu, J. Single counts of radicle emergence can be used as a fast method to test seed vigour of indica rice. Seed Sci. Technol. 2017, 45, 222–229. [Google Scholar] [CrossRef]
  35. Luo, Y.; Guan, Y.J.; Huang, Y.T.; Li, J.; Li, Z.; Hu, J. Single counts of radicle emergence provides an alternative method to test seed vigour in sweet corn. Seed Sci. Technol. 2015, 43, 519–525. [Google Scholar] [CrossRef]
  36. Shinohara, T.; Ducournau, S.; Matthews, S.; Wagner, M.; Powell, A.A. Early counts of radicle emergence, counted manually and by image analysis, can reveal differences in the production of normal seedlings and the vigour of seed lots of cauliflower. Seed Sci. Technol. 2021, 49, 219–235. [Google Scholar] [CrossRef]
  37. Demir, I.; Ermis, S.; Mavi, K.; Matthews, S. Mean germination time of pepper seed lots (Capsicum annuum L.) predicts size and uniformity of seedlings in germination tests and transplant modules. Seed Sci. Technol. 2008, 36, 21–30. [Google Scholar] [CrossRef]
  38. Bhuker, A.; Pandey, V.; Singh, S.; Dalal, P.K.; Raj, P. Radicle emergence test-A quick germination test in different field crops. Seed Res. 2020, 48, 80–82. [Google Scholar]
  39. Khajeh-Hosseini, M.; Lomholt, A.; Matthews, S. Mean germination time in the laboratory estimates the relative vigour and field performance of commercial seed lots of maize (Zea mays L.). Seed Sci. Technol. 2009, 37, 446–456. [Google Scholar] [CrossRef]
  40. Amirmoradi, S.; Feizi, H. Can mean germination time predict seed vigor of canola (Brassica napus L.) seed lots? Acta Agrobot. 2017, 70, 1729. [Google Scholar] [CrossRef]
  41. Matthews, S.; Khajeh-Hosseini, M. Length of the lag period of germination and metabolic repair explain vigour differences in seed lots of maize (Zea mays). Seed Sci. Technol. 2007, 35, 200–212. [Google Scholar] [CrossRef]
  42. Yan, H.F.; Yu, X.D.; Jia, W.; Mao, P.S. Length of the lag period of germination predicts the vigour differences and field emergence potential in Italian ryegrass (Lolium multiflorum) seed lots. Seed Sci. Technol. 2017, 45, 238–242. [Google Scholar] [CrossRef]
  43. Cheshmi, M.; Khajeh-Hosseini, M. Effect of temperature on length of the lag period and its relationship with field performance of alfalfa (Medicago sativa) seeds. Seed Sci. Technol. 2018, 46, 317–326. [Google Scholar] [CrossRef]
  44. GB/T 2930.4; Rules of Seed Testing for Forage, Turfgrass and Other Herbaceous Plant—The Germination Test. Ministry of Agriculture and Rural Affairs of the People’s Republic of China: Beijing, China, 2017. Available online: https://main.spc.net.cn/bwonline/9a1bb00a4a3e07c8dd60ac169f359862.html (accessed on 1 November 2017).
  45. Tao, Q.B.; Lv, Y.Y.; Mo, Q.; Bai, M.J.; Han, Y.H.; Wang, Y.R. Impacts of priming on seed germination and seedling emergence of Cleistogenes songorica under drought stress. Seed Sci. Technol. 2018, 46, 239–258. [Google Scholar] [CrossRef]
  46. Hu, X.W.; Huang, X.H.; Wang, Y.R. Hormonal and temperature regulation of seed dormancy and germination in Leymus chinensis. Plant Growth Regul. 2012, 67, 199–207. [Google Scholar] [CrossRef]
  47. Maguire, J.D. Speed of germination—Aid in selection and evaluation for seedling emergence and vigor. Crop Sci. 1962, 2, 176–177. [Google Scholar] [CrossRef]
  48. Zeng, Z.K.; Guo, C.; Yan, X.F.; Song, J.J.; Wang, C.P.; Xu, X.T.; Hao, Y.F. QTL mapping and KASP marker development for seed vigor related traits in common wheat. Front. Plant Sci. 2022, 13, 994973. [Google Scholar] [CrossRef]
  49. Zhao, H.J.; Liu, Q.L.; Fu, H.W.; Hu, X.H.; Wu, D.X.; Shu, Q.Y. Effect of non-lethal low phytic acid mutations on grain yield and seed viability in rice. Field Crops Res. 2008, 108, 206–211. [Google Scholar] [CrossRef]
  50. Yang, X.J.; Baskin, C.C.; Baskin, J.M.; Liu, G.Z.; Huang, Z.Y. Seed mucilage improves seedling emergence of a sand desert shrub. PLoS ONE 2012, 7, e34597. [Google Scholar] [CrossRef]
  51. Zhu, Y.J.; Yang, X.J.; Baskin, C.C.; Baskin, J.M.; Dong, M.; Huang, Z.Y. Effects of amount and frequency of precipitation and sand burial on seed germination, seedling emergence and survival of the dune grass Leymus secalinus in semiarid China. Plant Soil 2014, 374, 399–409. [Google Scholar] [CrossRef]
  52. Vandelook, F.; Assche, J.A.V. Temperature requirements for seed germination and seedling development determine timing of seedling emergence of three monocotyledonous temperature forest spring geophytes. Ann. Bot. 2008, 102, 865–875. [Google Scholar] [CrossRef] [PubMed]
  53. Ashraf, M.; Foolad, M.R. Pre-sowing seed treatment—A shotgun approach to improve germination, plant growth, and crop yield under saline and non-saline conditions. Adv. Agron. 2005, 88, 223–271. [Google Scholar]
  54. Mitchell, R.; Vogel, K.P.; Sarath, G. Managing and enhancing switchgrass as a bioenergy feedstock. Biofuels Bioprod. Biorefin. 2008, 2, 487–606. [Google Scholar] [CrossRef]
  55. Giordano, M.; Petropoulos, S.A.; Rouphael, Y. Response and defence mechanisms of vegetable crops against drought, heat, and salinity stress. Agriculture 2021, 11, 463. [Google Scholar] [CrossRef]
  56. Raza, A.; Razzaq, A.; Mehmood, S.S.; Zou, X.L.; Zhang, X.K.; Lv, Y.; Xu, J.S. Impact of climate change on crops adaptation and strategies to tackle its outcome: A review. Plants 2019, 8, 34. [Google Scholar] [CrossRef]
  57. Zheng, M.M.; Tao, Y.; Hussain, S.; Jiang, Q.W.; Peng, S.B.; Huang, J.L.; Cui, K.H.; Nie, L.X. Seed priming in dry direct-seeded rice: Consequences for emergence, seedling growth and associated metabolic events under drought stress. Plant Growth Regul. 2016, 78, 167–178. [Google Scholar] [CrossRef]
  58. Bartels, D.; Sunkar, R. Drought and salt tolerance in plants. Crit. Rev. Plant Sci. 2005, 24, 23–58. [Google Scholar] [CrossRef]
  59. Ghorbani, R.; Seel, W.; Leifert, C. Effect of environmental factors on germination and emergence of Amaranthus retroflexus. Weed Sci. 1999, 47, 505–510. [Google Scholar] [CrossRef]
  60. Hall, R.D.; Wiesner, L.E. Relationship between seed vigor tests and field performance of ‘Regar’ Meadow Bromegrass. Crop Sci. 1990, 30, 967–970. [Google Scholar] [CrossRef]
  61. Matthews, S.; Demir, I.; Celikkol, T.; Kenanoglu, B.B.; Mavi, K. Vigour tests for cabbage seeds using electrical conductivity and controlled deterioration to estimate relative emergence in transplant modules. Seed Sci. Technol. 2009, 37, 736–746. [Google Scholar] [CrossRef]
  62. Ilbi, H.; Kavak, S.; Eser, B. Cool germination test can be an alternative vigour test for maize. Seed Sci. Technol. 2009, 37, 516–519. [Google Scholar] [CrossRef]
  63. Matthews, S.; Noli, E.; Demir, I.; Khajeh-Hosseini, M.; Wagner, M.H. Evaluation of seed quality: From physiology to international standardization. Seed Sci. Res. 2012, 22, S69–S73. [Google Scholar] [CrossRef]
  64. Guan, Y.J.; Yin, M.Q.; Jia, X.W.; An, J.Y.; Wang, C.; Pan, R.H.; Song, W.J.; Hu, J. Single counts of radicle emergence can be used as a vigour test to predict seedling emergence potential of wheat. Seed Sci. Technol. 2018, 46, 349–357. [Google Scholar] [CrossRef]
  65. Ilbi, H.; Powell, A.A.; Alan, O. Single radicle emergence count for predicting vigour of marigold (Tagetes spp.) seed lots. Seed Sci. Technol. 2020, 48, 381–389. [Google Scholar] [CrossRef]
  66. Ermis, S.; Oktem, G.; Mavi, K.; Hay, F.R.; Demir, I. The radicle emergence test and storage longevity of cucurbit rootstock seed lots. Seed Sci. Technol. 2022, 50, 1–10. [Google Scholar] [CrossRef]
  67. Marin, M.; Laverack, G.; Powell, A.A.; Matthews, S. Potential of the electrical conductivity of seed soak water and early counts of radicle emergence to assess seed quality in some native species. Seed Sci. Technol. 2018, 46, 71–86. [Google Scholar] [CrossRef]
  68. Lv, Y.Y.; Wang, Y.R.; Powell, A.A. Frequent individual counts of radicle emergence and mean just germination time predict seed vigour of Avena sativa and Elymus nutans. Seed Sci. Technol. 2016, 44, 189–198. [Google Scholar]
  69. Munyaneza, V.; Li, D.M.; Jia, P.; Hu, X.W. Various vigour test methods to rank seed lot quality and predict field emergence in two forage grasses. Seed Sci. Technol. 2022, 50, 345–356. [Google Scholar] [CrossRef]
  70. Cheah, K.S.; Osborne, D.J. DNA lesions occur with loss of viability in embryos of ageing rye seed. Nature 1978, 272, 593–599. [Google Scholar] [CrossRef]
  71. Osborne, D.J. Biochemical control systems operating in the early hours of germination. Can. J. Bot. 1983, 61, 3568–3577. [Google Scholar] [CrossRef]
  72. Powell, A.A.; Matthews, S. Seed ageing/repair hypothesis leads to new testing methods. Seed Technol. 2012, 34, 15–25. [Google Scholar]
Figure 1. Daily precipitation and mean temperature at Jiaozhou Experimental Station of Qingdao Agricultural University during field emergence experiments from 2021 to 2023.
Agronomy 14 00173 g001
Figure 2. Radicle emergence progress curves of 16 seed lots of Siberian wildrye (Elymus sibiricus L.).
Agronomy 14 00173 g002
Figure 3. Regression analysis of radicle emergence at 108 h with mean germination time and vigor index of 16 seed lots of Siberian wildrye (Elymus sibiricus L.). *** indicates significance at p < 0.001 probability level. Four replications were performed for each seed lot, and the regression analysis was performed using the average value of four replications. RE: radicle emergence; MGT: mean germination time; VI: vigor index.
Agronomy 14 00173 g003
Figure 4. Field emergence, field seedling dry weight, and field simplified vigor index of 16 seed lots of Siberian wildrye (Elymus sibiricus L.) from 2021 to 2023. Field emergence data were arcsine-transformed before statistical analysis, and nontransformed data are reported in the figure. Four replications were performed for each seed lot, and each point is the average value of four replications. FE: field emergence; FSDW: field seedling dry weight; FSVI: field simplified vigor index. ANOVA: analysis of variance; SV: source of variance; df: degree of freedom; SL: seed lot. ** and *** indicate significance at p < 0.01 and 0.001 probability level, respectively. Different lowercase letters within a year indicate significant differences among different seed lots at the p < 0.05 probability level according to Duncan’s multiple range test.
Agronomy 14 00173 g004
Figure 5. Dynamics of soil moisture content in control and drought stress treatments in pot experiment.
Agronomy 14 00173 g005
Figure 6. Regression analysis of radicle emergence at 108 h with emergence percentage, seedling dry weight, and simplified vigor index under field (from 2021 to 2023) and pot (control, drought, and salinity) conditions. ** and *** indicate significance at p < 0.01 and 0.001 probability level, respectively. Four replications were performed for each seed lot, and the regression analysis was performed using the average value of four replications. FE: field emergence; FSDW: field seedling dry weight; FSVI: field simplified vigor index; PEP: pot emergence percentage; PSDW: pot seedling dry weight; PSVI: pot simplified vigor index: RE: radicle emergence.
Agronomy 14 00173 g006
Figure 7. Regression analysis of mean germination time with emergence percentage, seedling dry weight, and simplified vigor index under field (from 2021 to 2023) and pot (control, drought, and salinity) conditions. ** and *** indicate significance at p < 0.01 and 0.001 probability level, respectively. Four replications were performed for each seed lot, and the regression analysis was performed using the average value of four replications. FE: field emergence; FSDW: field seedling dry weight; FSVI: field simplified vigor index; PEP: pot emergence percentage; PSDW: pot seedling dry weight; PSVI: pot simplified vigor index: MGT: mean germination time.
Agronomy 14 00173 g007
Figure 8. Regression analysis of vigor index with emergence percentage, seedling dry weight, and simplified vigor index under field (from 2021 to 2023) and pot (control, drought, and salinity) conditions. *** indicates significance at p < 0.001 probability level. Four replications were performed for each seed lot, and the regression analysis was performed using the average value of four replications. FE: field emergence; FSDW: field seedling dry weight; FSVI: field simplified vigor index; PEP: pot emergence percentage; PSDW: pot seedling dry weight; PSVI: pot simplified vigor index: VI: vigor index.
Agronomy 14 00173 g008
Table 1. Production year, storage period, initial seed moisture content, thousand-grain weight, standard germination, mean germination time, germination index, seedling length, and vigor index of 16 seed lots of Siberian wildrye (Elymus sibiricus L.).
Seed LotProduction YearStorage Period (Years)Seed Moisture Content (%)TGW (g)SG (%)RE at 108 h (%)MGT (Hours)GISLL (cm)VI
1201748.43.6291.5 cd41.0 f107.3 c0.43 i2.6 g1.11 hi
2201748.93.8992.5 bcd67.0 d100.2 e0.46 gh3.8 ab1.77 d
3201838.43.5093.0 abcd69.0 cd91.8 g0.53 e4.1 a2.20 ab
4201748.73.6794.0 abc33.5 f114.4 b0.40 j3.5 bcd1.41 fg
5201659.03.5694.5 abc56.0 e102.0 de0.48 g3.2 cde1.54 ef
6201928.53.5895.5 ab91.5 a81.3 i0.61 b3.4 bcd2.08 bc
7202018.43.2491.0 cd64.5 d103.3 d0.45 hi3.3 cd1.52 f
8201658.63.7395.5 ab23.0 g122.0 a0.38 j2.6 g1.01 i
9201838.53.4492.5 bcd65.0 d97.1 f0.50 f3.1 def1.56 ef
10202018.83.5896.0 ab91.5 a75.8 j0.67 a3.5 bcd2.33 a
11202018.83.5595.0 abc87.5 ab85.9 h0.57 c3.8 ab2.15 ab
12201929.23.8193.0 bcd39.0 f109.3 c0.44 hi2.8 fg1.25 gh
13201658.43.6789.5 d23.5 g123.2 a0.35 k2.9 efg1.01 i
14201838.63.3594.5 abc74.5 d92.0 g0.54 de3.6 bc1.94 cd
15202018.73.4896.5 a64.5 d96.8 f0.51 f3.4 bcd1.74 de
16201928.93.7696.0 ab87.0 b88.4 h0.56 cd3.8 ab2.12 abc
Different lowercase letters within a column indicate significant difference at p < 0.05 probability level according to Duncan’s multiple range test. Standard germination and radicle emergence at 108 h data were arcsine-transformed before statistical analysis, and nontransformed data are reported in the table. Four replications were performed for each seed lot, and each point is the average value of four replications. TGW: thousand-grain weight; SG: standard germination; RE: radicle emergence; MGT: mean germination time; GI: germination index; SLL: seedling length; VI: vigor index.
Table 2. Effects of different environmental conditions (control, drought stress, and salinity stress) on pot emergence percentage, pot seedling dry weight, and pot simplified vigor index of 16 seeds lot of Siberian wildrye (Elymus sibiricus L.).
Seed LotControl ConditionDrought StressSalinity Stress
PEP (%)PSDW (mg Plant−1)PSVIPEP (%)PSDW (mg Plant−1)PSVIPEP (%)PSDW (mg Plant−1)PSVI
175.0 abcd23.5 fg1762.0 de44.2 bcde14.4 gh638.8 gh39.2 def17.8 cdef691.4 fg
280.8 abc21.4 gh1720.1 def51.7 ab18.9 cde973.1 d47.5 bcd19.2 abcde909.1 cd
379.2 abcd29.2 cd2295.2 b48.3 abc19.7 cd945.0 de50.8 abc20.8 abc1050.6 b
470.8 bcd20.5 gh1415.1 gh40.0 cde15.4 fg611.1 ghi45.0 bcde16.7 efg747.8 efg
579.2 abcd23.8 efg1862.3 cd45.0 bcde16.3 efg724.8 fg44.2 cdef15.9 fg695.6 fg
678.3 abcd35.4 a2766.3 a51.7 ab24.3 a1242.4 ab53.3 ab20.1 abcd1065.1 b
776.7 abcd31.5 bc2415.8 b48.3 abc18.4 cde883.5 de45.0 bcde19.5 abcde875.5 cd
868.3 cd18.7 h1268.3 h36.7 de11.8 h425.8 j35.8 f14.6 g519.9 h
975.8 abcd27.4 de2072.7 c47.5 abcd20.3 bcd962.2 d44.2 cdef18.5 bcdef812.9 def
1084.2 a33.9 ab2853.1 a56.7 a24.1 a1354.7 a58.3 a22.3 a1294.5 a
1178.3 abcd31.3 bc2434.4 b50.0 abc22.9 ab1139.7 bc56.7 a21.5 ab1208.8 a
1270.8 cd21.8 gh1543.8 efg42.5 bcde13.5 gh568.6 hi37.5 ef14.6 g546.7 h
1366.7 d22.5 gh1495.9 fgh34.2 e14.4 gh489.4 ij38.3 ef17.8 cdef679.9 g
1479.2 abcd29.9 cd2359.6 b49.2 abc20.8 bc1006.6 cd50.8 abc18.8 bcdef945.2 bc
1575.8 abcd26.8 def2022.2 c46.7 abcd17.5 def814.8 ef48.3 bc17.0 defg822.5 cde
1683.3 ab32.4 abc2682.8 a53.3 ab21.1 bc1117.8 bc51.7 abc18.4 bcdef948.9 bc
Means of 16 seed lots76.426.92060.646.618.4868.646.718.3863.4
ANOVA
SVdf PEP PSDW PSVI
SL15 *** *** ***
EC2 *** *** ***
SL × EC30 ns *** ***
*** indicates significance at p < 0.001 probability level; ns indicates not significant at p < 0.05 probability level. Different lowercase letters within a column indicate significant difference at p < 0.05 probability level according to Duncan’s multiple range test. Pot emergence percentage data were arcsine-transformed before statistical analysis, and nontransformed data are reported in the table. Four replications were performed for each treatment and each seed lot, and each point is the average value of four replications. PEP: pot emergence percentage; PSDW: pot seedling dry weight; PSVI: pot simplified vigor index; ANOVA: analysis of variance; SV: source of variance; df: degree of freedom; SL: seed lot; EC: environmental condition.
Table 3. Correlation coefficients ® between standard germination, mean germination time, vigor index, radicle emergence at different times with field emergence, field seedling dry weight, and field simplified vigor index from 2021 to 2023 of 16 seed lots of Siberian wildrye (Elymus sibiricus L.).
FEFSDWFSVI
202120222023202120222023202120222023
SG0.499 *0.4970.3540.550 *0.554 *0.4890.541 *0.572 *0.458
MGT−0.843 ***−0.866 ***−0.881 ***−0.877 ***−0.853 ***−0.815 ***−0.863 ***−0.897 ***−0.907 ***
VI0.779 ***0.855 ***0.878 ***0.808 ***0.776 ***0.780 ***0.799 ***0.853 ***0.883 ***
RE at 64 h0.672 **0.716 **0.693 **0.700 **0.652 **0.622 *0.709 **0.730 **0.721 **
RE at 68 h0.698 **0.745 **0.730 **0.720 **0.668 **0.623 *0.729 **0.751 **0.738 **
RE at 72 h0.737 **0.763 **0.751 **0.766 **0.724 **0.655 **0.768 **0.788 ***0.760 **
RE at 76 h0.730 **0.772 ***0.788 ***0.755 **0.728 **0.693 **0.755 **0.793 ***0.802 ***
RE at 80 h0.717 **0.771 ***0.779 ***0.748 **0.732 **0.714 **0.743 **0.793 ***0.811 ***
RE at 84 h0.729 **0.780 ***0.789 ***0.754 **0.735 **0.722 **0.753 **0.800 ***0.823 ***
RE at 88 h0.773 ***0.827 ***0.832 ***0.797 ***0.762 **0.753 **0.796 ***0.836 ***0.859 ***
RE at 92 h0.804 ***0.849 ***0.860 ***0.826 ***0.801 ***0.791 ***0.826 ***0.871 ***0.897 ***
RE at 96 h0.849 ***0.874 ***0.883 ***0.868 ***0.843 ***0.837 ***0.867 ***0.905 ***0.929 ***
RE at 100 h0.874 ***0.887 ***0.893 ***0.899 ***0.872 ***0.859 ***0.893 ***0.925 ***0.941 ***
RE at 104 h0.884 ***0.896 ***0.908 ***0.913 ***0.878 ***0.865 ***0.902 ***0.929 ***0.948 ***
RE at 108 h0.898 ***0.907 ***0.916 ***0.924 ***0.891 ***0.867 ***0.912 ***0.939 ***0.950 ***
RE at 112 h0.886 ***0.904 ***0.909 ***0.910 ***0.886 ***0.861 ***0.897 ***0.932 ***0.942 ***
RE at 116 h0.874 ***0.896 ***0.899 ***0.893 ***0.875 ***0.857 ***0.879 ***0.919 ***0.933 ***
RE at 120 h0.866 ***0.875 ***0.884 ***0.898 ***0.894 ***0.856 ***0.875 ***0.915 ***0.919 ***
RE at 124 h0.839 ***0.843 ***0.859 ***0.880 ***0.891 ***0.838 ***0.850 ***0.895 ***0.893 ***
RE at 128 h0.820 ***0.830 ***0.847 ***0.853 ***0.867 ***0.811 ***0.829 ***0.877 ***0.857 ***
RE at 132 h0.824 ***0.837 ***0.838 ***0.862 ***0.872 ***0.806 ***0.833 ***0.880 ***0.865 ***
RE at 136 h0.810 ***0.822 ***0.824 ***0.859 ***0.874 ***0.804 ***0.821 ***0.871 ***0.854 ***
RE at 140 h0.818 ***0.832 ***0.817 ***0.868 ***0.883 ***0.808 ***0.829 ***0.880 ***0.852 ***
RE at 144 h0.827 ***0.842 ***0.801 ***0.871 ***0.892 ***0.843 ***0.836 ***0.890 ***0.863 ***
RE at 148 h0.839 ***0.858 ***0.809 ***0.880 ***0.886 ***0.845 ***0.846 ***0.895 ***0.869 ***
RE at 152 h0.826 ***0.854 ***0.783 ***0.864 ***0.870 ***0.858 ***0.835 ***0.889 ***0.865 ***
RE at 156 h0.792 ***0.828 ***0.744 **0.831 ***0.841 ***0.840 ***0.803 ***0.862 ***0.836 ***
RE at 160 h0.805 ***0.850 ***0.755 **0.831 ***0.834 ***0.851 ***0.816 ***0.877 ***0.855 ***
RE at 164 h0.802 ***0.845 ***0.748 **0.828 ***0.834 ***0.848 ***0.813 ***0.874 ***0.851 ***
RE at 168 h0.802 ***0.845 ***0.748 **0.828 ***0.834 ***0.848 ***0.813 ***0.874 ***0.851 ***
*, **, and *** indicate significance at p < 0.05, 0.01 and 0.001 probability level, respectively. FE: field emergence; FSDW: field seedling dry weight; FSVI: field simplified vigor index; SG: standard germination; MGT: mean germination time; VI: vigor index; RE: radicle emergence.
Table 4. Correlation coefficien® (r) between standard germination, mean germination time, vigor index, radicle emergence at different times with pot emergence percentage, pot seedling dry weight, and pot simplified vigor index under control, drought, and salinity conditions of 16 seed lots of Siberian wildrye (Elymus sibiricus L.).
PEPPSDWPSVI
ControlDroughtSalinityControlDroughtSalinityControlDroughtSalinity
SG0.4370.4410.539 *0.3410.3960.0540.3940.4400.356
MGT−0.881 ***−0.936 ***−0.920 ***−0.874 ***−0.938 ***−0.761 **−0.923 ***−0.965 ***−0.887 ***
VI0.860 ***0.881 ***0.965 ***0.810 ***0.916 ***0.779 ***0.865 ***0.927 ***0.919 ***
RE at 64 h0.689 **0.746 **0.824 ***0.755 **0.808 ***0.673 **0.796 ***0.834 ***0.813 ***
RE at 68 h0.729 **0.781 ***0.843 ***0.748 **0.824 ***0.666 **0.798 ***0.852 ***0.818 ***
RE at 72 h0.724 **0.788 ***0.863 ***0.761 **0.824 ***0.653 **0.805 ***0.850 ***0.819 ***
RE at 76 h0.736 **0.810 ***0.874 ***0.794 ***0.862 ***0.674 **0.832 ***0.880 ***0.832 ***
RE at 80 h0.717 **0.790 ***0.856 ***0.802 ***0.855 ***0.649 **0.834 ***0.869 ***0.813 ***
RE at 84 h0.716 **0.788 ***0.858 ***0.811 ***0.869 ***0.666 **0.840 ***0.878 ***0.822 ***
RE at 88 h0.780 ***0.844 ***0.889 ***0.837 ***0.908 ***0.703 **0.876 ***0.922 ***0.852 ***
RE at 92 h0.787 ***0.860 ***0.905 ***0.858 ***0.933 ***0.728 **0.891 ***0.942 ***0.871 ***
RE at 96 h0.824 ***0.898 ***0.920 ***0.899 ***0.955 ***0.762 **0.932 ***0.967 ***0.891 ***
RE at 100 h0.864 ***0.932 ***0.927 ***0.900 ***0.958 ***0.769 ***0.941 ***0.978 ***0.894 ***
RE at 104 h0.885 ***0.945 ***0.930 ***0.894 ***0.963 ***0.786 ***0.939 ***0.983 ***0.901 ***
RE at 108 h0.893 ***0.947 ***0.921 ***0.891 ***0.957 ***0.768 **0.937 ***0.977 ***0.884 ***
RE at 112 h0.903 ***0.956 ***0.904 ***0.886 ***0.939 ***0.763 **0.835 ***0.965 ***0.871 ***
RE at 116 h0.899 ***0.955 ***0.877 ***0.887 ***0.920 ***0.756 **0.935 ***0.951 ***0.851 ***
RE at 120 h0.917 ***0.951 ***0.879 ***0.870 ***0.904 ***0.723 **0.923 ***0.935 ***0.833 ***
RE at 124 h0.917 ***0.942 ***0.857 ***0.848 ***0.875 ***0.694 **0.903 ***0.910 ***0.805 ***
RE at 128 h0.909 ***0.919 ***0.854 ***0.847 ***0.868 ***0.702 **0.900 ***0.896 ***0.804 ***
RE at 132 h0.913 ***0.925 ***0.838 ***0.814 ***0.846 ***0.663 **0.874 ***0.884 ***0.778 ***
RE at 136 h0.917 ***0.923 ***0.829 ***0.790 ***0.831 ***0.630 **0.855 ***0.872 ***0.759 **
RE at 140 h0.887 ***0.899 ***0.805 ***0.771 ***0.806 ***0.562 *0.834 ***0.848 ***0.716 **
RE at 144 h0.865 ***0.882 ***0.774 ***0.793 ***0.790 ***0.537 *0.849 ***0.834 ***0.691 **
RE at 148 h0.857 ***0.887 ***0.772 ***0.780 ***0.793 ***0.521 *0.838 ***0.840 ***0.685 **
RE at 152 h0.811 ***0.843 ***0.761 **0.768 **0.771 ***0.4690.821 ***0.814 ***0.660 **
RE at 156 h0.752 **0.797 **0.727 **0.728 **0.727 **0.4000.777 ***0.771 ***0.615 *
RE at 160 h0.738 **0.780 ***0.746 **0.763 **0.751 **0.4230.804 ***0.784 ***0.638 **
RE at 164 h0.744 **0.785 ***0.743 **0.766 **0.748 **0.4260.808 ***0.784 ***0.637 **
RE at 168 h0.744 **0.785 ***0.743 **0.766 **0.748 **0.4260.808 ***0.784 ***0.637 **
*, **, and *** indicate significance at p < 0.05, 0.01 and 0.001 probability level, respectively. PEP: pot emergence percentage; PSDW: pot seedling dry weight; PSVI: pot simplified vigor index; SG: standard germination; MGT: mean germination time; VI: vigor index; RE: radicle emergence.
Disclaimer/Publisher’s Note: The statements, opinions and data contained in all publications are solely those of the individual author(s) and contributor(s) and not of MDPI and/or the editor(s). MDPI and/or the editor(s) disclaim responsibility for any injury to people or property resulting from any ideas, methods, instructions or products referred to in the content.

