Article

Effects of Combined Long-Term Straw Return and Nitrogen Fertilization on Wheat Productivity and Soil Properties in the Wheat-Maize-Soybean Rotation System in the Pannonian Plain

by
Goran Jaćimović
1,*,
Vladimir Aćin
2,*,
Milan Mirosavljević
2,
Ljiljana Brbaklić
2,
Svetlana Vujić
1,
Dušan Dunđerski
2 and
Srđan Šeremešić
1
1
Faculty of Agriculture, University of Novi Sad, Dositej Obradović Square 8, 21000 Novi Sad, Serbia
2
Institute of Field and Vegetable Crops, Maksima Gorkog 30, 21000 Novi Sad, Serbia
*
Authors to whom correspondence should be addressed.
Agronomy 2023, 13(6), 1529; https://doi.org/10.3390/agronomy13061529
Submission received: 14 April 2023 / Revised: 26 May 2023 / Accepted: 28 May 2023 / Published: 31 May 2023

Abstract

:
The study, conducted to evaluate the effects of long-term straw management combined with the application of increasing nitrogen rates on the yield of twenty winter wheat varieties, as well as on soil properties, was carried out in a long-term field trial established in 1971. The trial was monitored for twenty growing seasons under rainfed conditions in a typical chernozem zone of the southern part of the Pannonian Plain. The cropping system was a winter wheat-maize-soybean rotation. The ten SN-treatments (combinations of straw management (S) and N-fertilization) were as follows: In the plot (treatment) with straw return (S1), seven variants of nitrogen fertilization (0–180 kg N ha−1) were included, while on the plot without straw return (S0) the variants of N-fertilization were 0, 90 and 150 kg N ha−l. Based on the high relative share in the total sum of squares, variance analysis showed that wheat grain yield (GY) was significantly affected by years, SN-treatments, and their interaction, and they can explain the largest part of the total variance of GY. The results showed that straw return integrated with N fertilization could increase wheat yield to varying degrees over 20 years. On average, for all years, the highest GYs were obtained in the treatment S1 and fertilization with 180 and 150 kg N ha−1. The overall results showed that long-term straw returning significantly increased GY by an average of 8.4 ± 4.5%, with a considerable simultaneous increase in yield stability compared to straw removal. In addition, straw incorporation (SI) significantly increased soil humus, total nitrogen (TN), and soil organic carbon (SOC) contents at a soil depth of 0–30 cm by an average of 4.2, 3.8, and 11.3%, respectively. The results of our study have demonstrated that the long-term practice of straw return, in combination with the application of mineral fertilizers, has the potential to serve as a sustainable soil management strategy that is economically viable and environmentally acceptable. However, additional research is required to investigate its interactive effects on both grain yield and soil productivity.

1. Introduction

Winter wheat, maize, and soybean cropping system is one of the main and largest grain production systems in the Republic of Serbia. For a long period, with increasing demand for food, intensive agricultural practices have been adopted in this system, which is of great importance for ensuring national food security. However, conventional agriculture often refers to high-external-input agriculture systems that include the frequent applications of synthetic chemical fertilizers, pesticides, heavy machinery, intensive tillage and irrigation, high-yielding cultivars, and monoculture [1,2]. Consequently, such systems are frequently linked to issues, such as degradation of soil structure, soil health impairment, nitrate leaching, and groundwater pollution, as well as decreased levels of total soil nitrogen and carbon [3].
In the period from 2018 to 2020, the production of wheat, maize, and soybean in Serbia took place on an average annual area of 1,774,892 ha [4], i.e., on 68.6% of the total arable land, whereby the largest part (40.9%) of these crops was grown in the Province of Vojvodina, the southern part of the Pannonian Plain. At average yields of 4.64 t ha−1 (winter wheat), 7.75 t ha−1 (maize), and 3.17 t ha−1 (soybean), it was estimated that the annual production of harvest residues of these three crops in Serbia amounted to about 11 million tons. That is, with slightly higher average yields in Vojvodina—about 7 million t of straw per year.
For years, during the production process, farmers burned large amounts of crop straw directly in the fields in order to reduce material investments, to save manpower and other resources [5,6], or due to the lack of adequate mechanization, high costs for its disposal [7] and biodegradation difficulties [8]. Straw burning not only represents a significant loss of extremely valuable natural resources and exerts great pressure on the soil ecosystem [9,10] but also directly threatens people’s health through serious environmental pollution [2,11]. Continuous destruction of crop residues by burning or removing them from the fields without regular application of organic fertilizers can be very harmful in the long term from the aspect of preserving soil fertility [5,12].
The problem of plowing crop residues in Serbia has been particularly pronounced in recent decades due to the reduction of livestock and insufficient production and use of manure and other types of organic fertilizers. Even at the end of the last century, there was an overall trend of organic matter (OM) content loss in the soils of Vojvodina. For example, comparing the results of two studies covering the periods 1970–1975 and 1990–1991, respectively, Bogdanović et al. [13] reported a loss of soil OM content of 0.20 to 0.81%. According to Sekulić et al. [14], based on the analysis of over 77,000 soil samples under the arable land of Vojvodina, it was determined that 39% of the samples belong to the class of weakly humus soil, with OM content of 1 to 3%. Moreover, on the example of chernozem in Vojvodina, where soil analyses were carried out in the 90s of the 20th century, followed by research from 2002 to 2004 on the same locations, it was determined that there was a trend of a decline in the soil OM content of about 0.05–0.20% [15]. Šeremešić et al. [16] found that the productive capacity of fertile chernozem soil gradually declined as a result of soil organic carbon (SOC) loss and deterioration in soil structure. Therefore, if the farms do not have livestock, and crop residues cannot be used for animal feed or bedding materials and returned to the soil through manure, plowing of crop residues has an advantage over other ways of use [12], and can mitigate resource wastage [17,18].
In recent years, with the implementation of the straw burning ban, as well as the increase in awareness of environmental protection, more and more farmers in Serbia have accepted direct return of harvest residues to the fields. According to our estimation, at present, about 40% of crop residues are returned to the soil every year in Serbia. Straw return, as a sustainable agricultural practice, is widely applied to improve crop yields and soil quality [19,20,21,22], while it can also contribute to increased yield stability [23,24,25]. In the conditions of the Vojvodina chernozem, [12,26,27] reported the positive effects of plowing crop residues with the application of appropriate amounts of nitrogen on wheat and maize yields. However, straw return without fertilizer application can have a potential negative impact on crop yields [11,28,29].
Crop residues represent biomass rich in carbon, as well as macro- and microelements necessary for crop growth [30,31,32], and therefore, they can significantly supplement nutrient deficiencies in agricultural soils. Application of fertilizers, especially N, stimulates microbial activity and improves straw decomposition, which favors crop growth and increases yields [33,34,35]. Incorporation of straw increases crop yield more than straw mulching due to greater decomposition of straw in the deeper soil layer, improvement of water retention and nutrient absorption, and influence on root growth [36]. Several meta-analyses have been published on the effect of residue management on crop yields and soil properties [11,21,37,38,39,40,41]. However, the effects of crop residue return on crop production, SOC and N stocks, etc., are quite inconsistent and largely uncertain and differ significantly depending on the type and amount of residues applied, return methods, type and intensity of tillage, fertilization, climatic conditions, initial physico-chemical soil properties, etc. [2,6,16,42,43,44,45].
Straw return is generally considered beneficial for maintaining and/or improving physico-chemical soil properties [21,46]. The increase in crop yield under straw return is closely related to the improvement of SOC content, soil structure, and nutrient content and availability [11,24,34]. In the long-term, variation in wheat yield in Vojvodina could be explained by SOC stock change [47]. According to the results of Manojlović et al. [48] from several long-term field trials in the chernozem soil of Vojvodina Province, SOC concentrations and stocks can be preserved and/or increased by conservation tillage, application of manure, and plowing of crop residues in combination with mineral fertilizers. Straw returning can significantly increase total SOC content in the topsoil [19,49,50,51]. The SOC regulates physical, chemical, and biological properties of the soil [52,53], and therefore, its content is closely related to the soil quality and productivity [54,55]. Straw return can promote root growth, reduce evaporation, increase soil water storage capacity, and create appropriate soil moisture conditions for crop growth, thereby increasing yield [11,22,56,57,58]. However, if the amount of returned straw is too high, the relatively high C/N ratio can stimulate N absorption by microorganisms and reduce the amount of mineral N available for plant growth and development [59].
As could be seen, considerable research efforts have been made to examine the effect of straw returning on crop yields and soil properties, however, no consistent conclusions have been reached so far, and, to our knowledge, particularly not in Vojvodina, in the system of growing wheat, maize, and soybean in rotation. To address this gap, the objectives of the present study were to examine the effects of long-term straw return combined with the application of increasing N-rates on: (a) Winter wheat yields and yield stability, (b) changes in soil fertility status, and (c) the possibility of mitigating or completely substituting the insufficient application of organic fertilizers, by finding the optimal combination of straw return management and the amount of N fertilizer in order to maintain and/or improve the soil properties.
Winter wheat was selected for this study because it is widespread and the most important staple crop, but also a “strategic crop” for Serbia with significant export potential, which is of great significance for ensuring national food security.
The outcome of the research will be of theoretical and practical importance for the optimization of wheat cultivation technology through the sustainable use of resources and with preservation or increase of soil fertility and environmental protection. We expect that this study will contribute to the theoretical foundations for the improvement of healthy and sustainable winter wheat production in the southern part of the Pannonian Plain.

2. Materials and Methods

The study, conducted to assess the effects of long-term return of crop residues (hereinafter referred to as “straw return”) in combination with increasing amounts of nitrogen on wheat yield and soil properties, was performed on a long-term, fixed-site field trial called “ISDV” (Internationale Stickstoff Dauer Versuche). The trial was established in 1971 in a typical Pannonian environment and lasts until today. The experiment was analyzed over 20 growing seasons (monitored during the period from 1995/96 to 2019/20). The cropping system was a winter wheat-maize-soybean rotation. The experiment, conducted in a rain-fed agricultural regime, was arranged in a randomized complete block design with four replicates.

2.1. Description of the Study Site

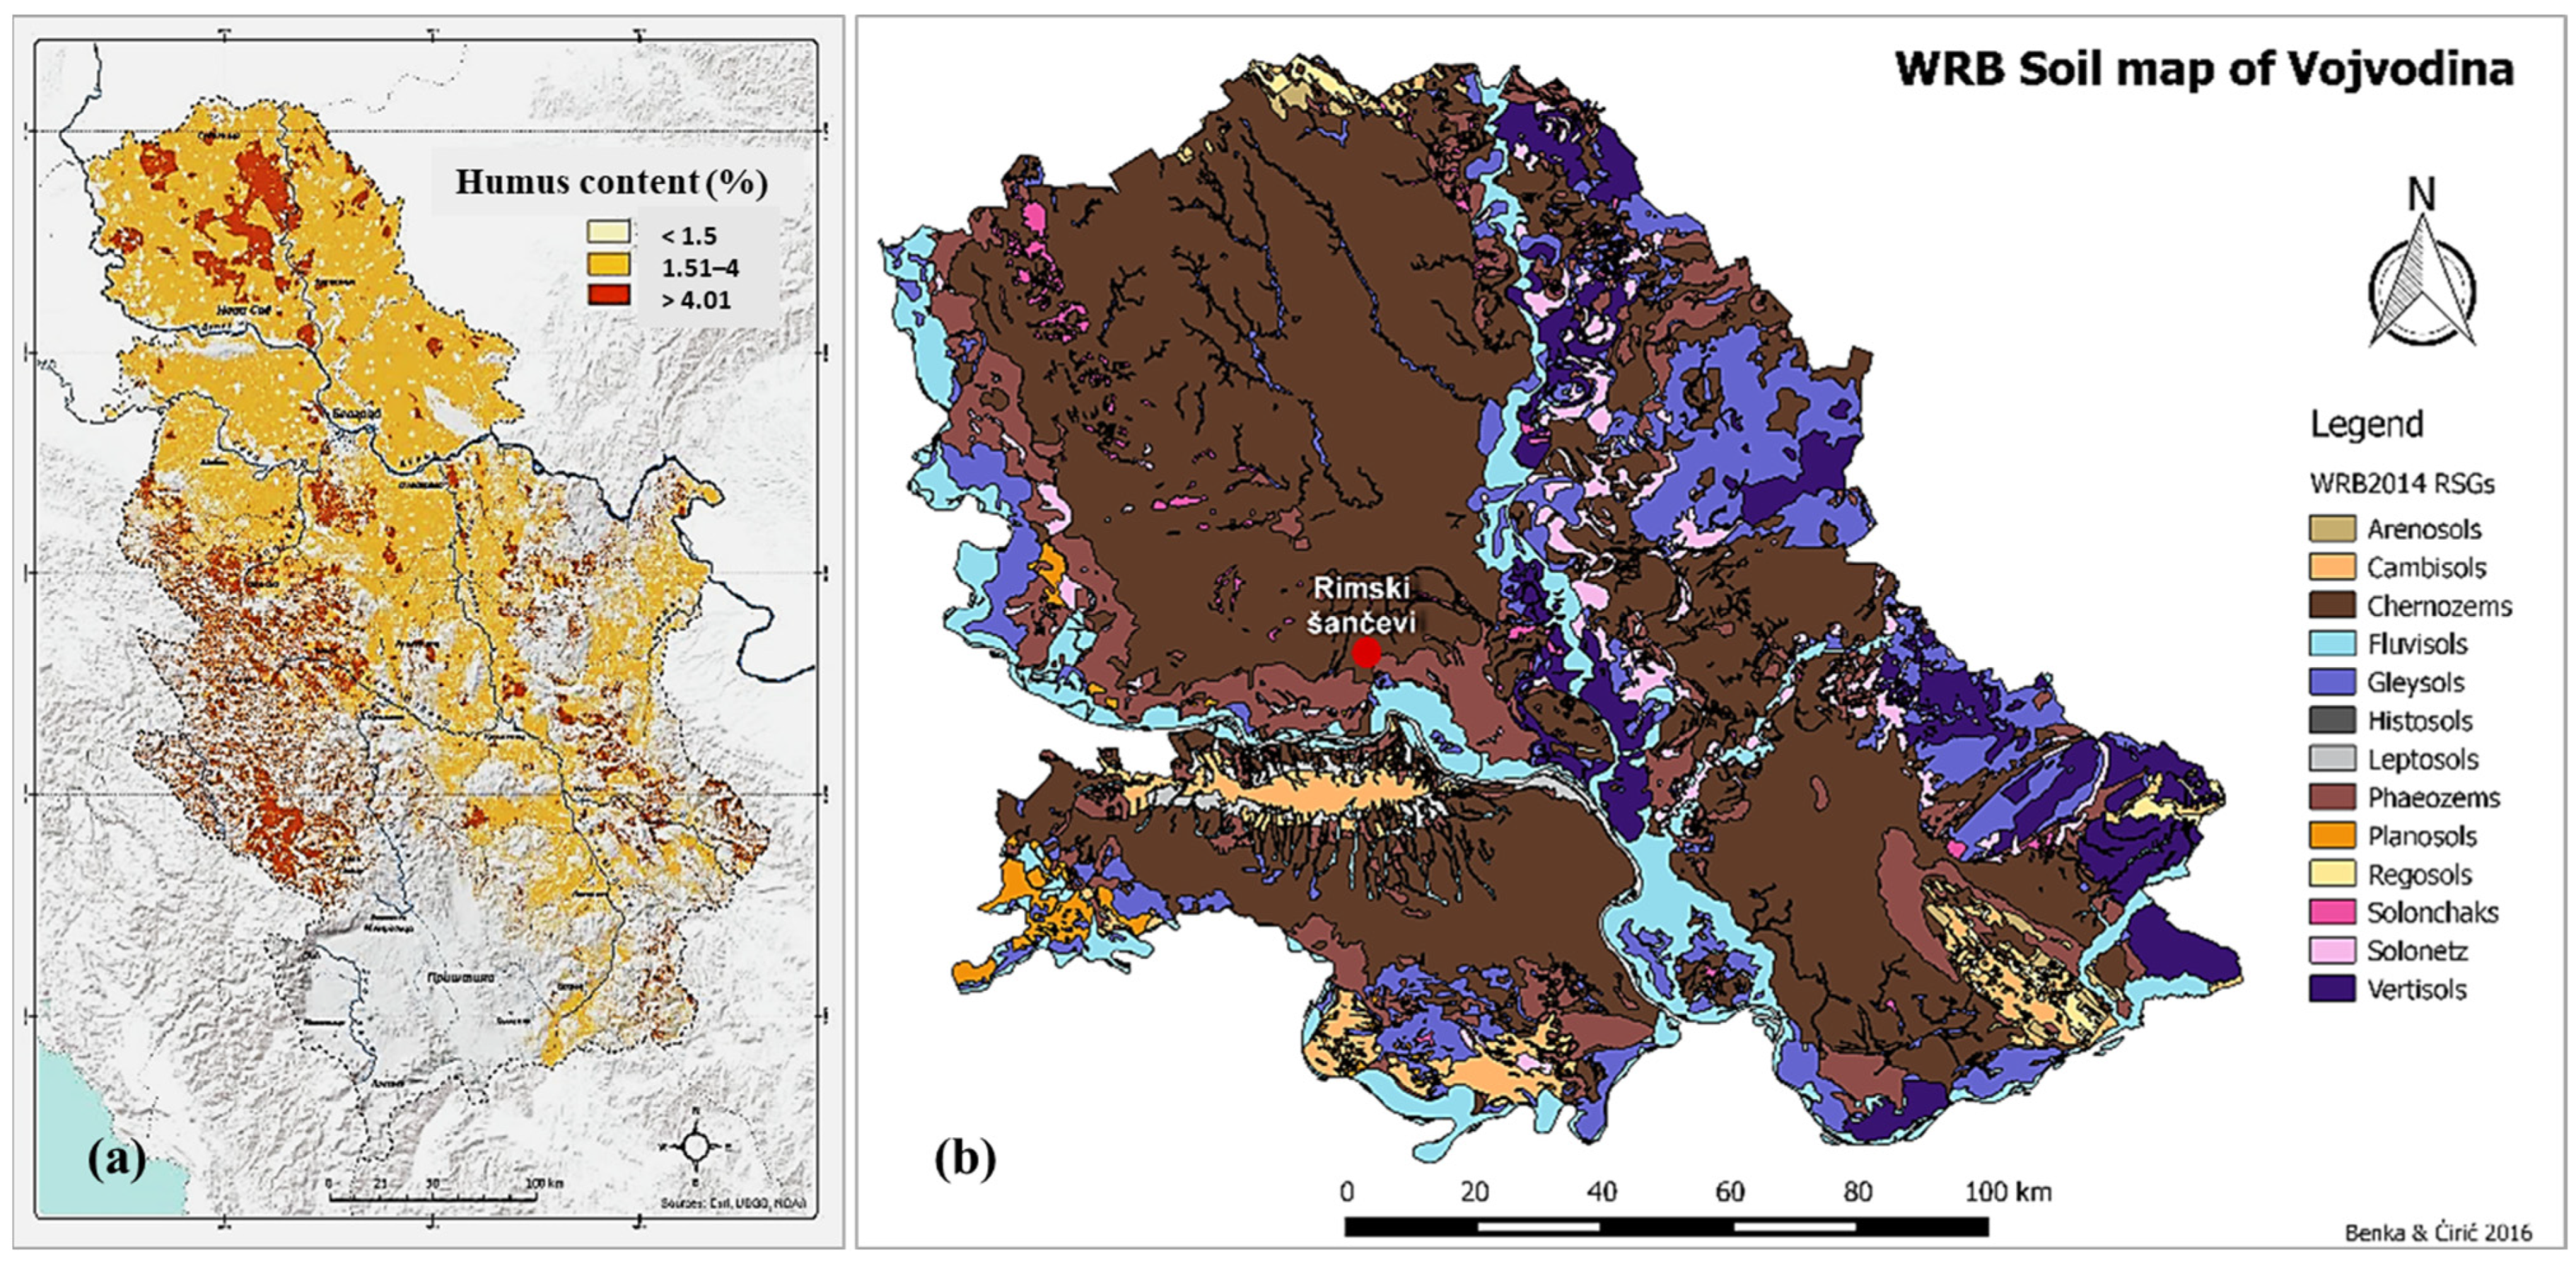
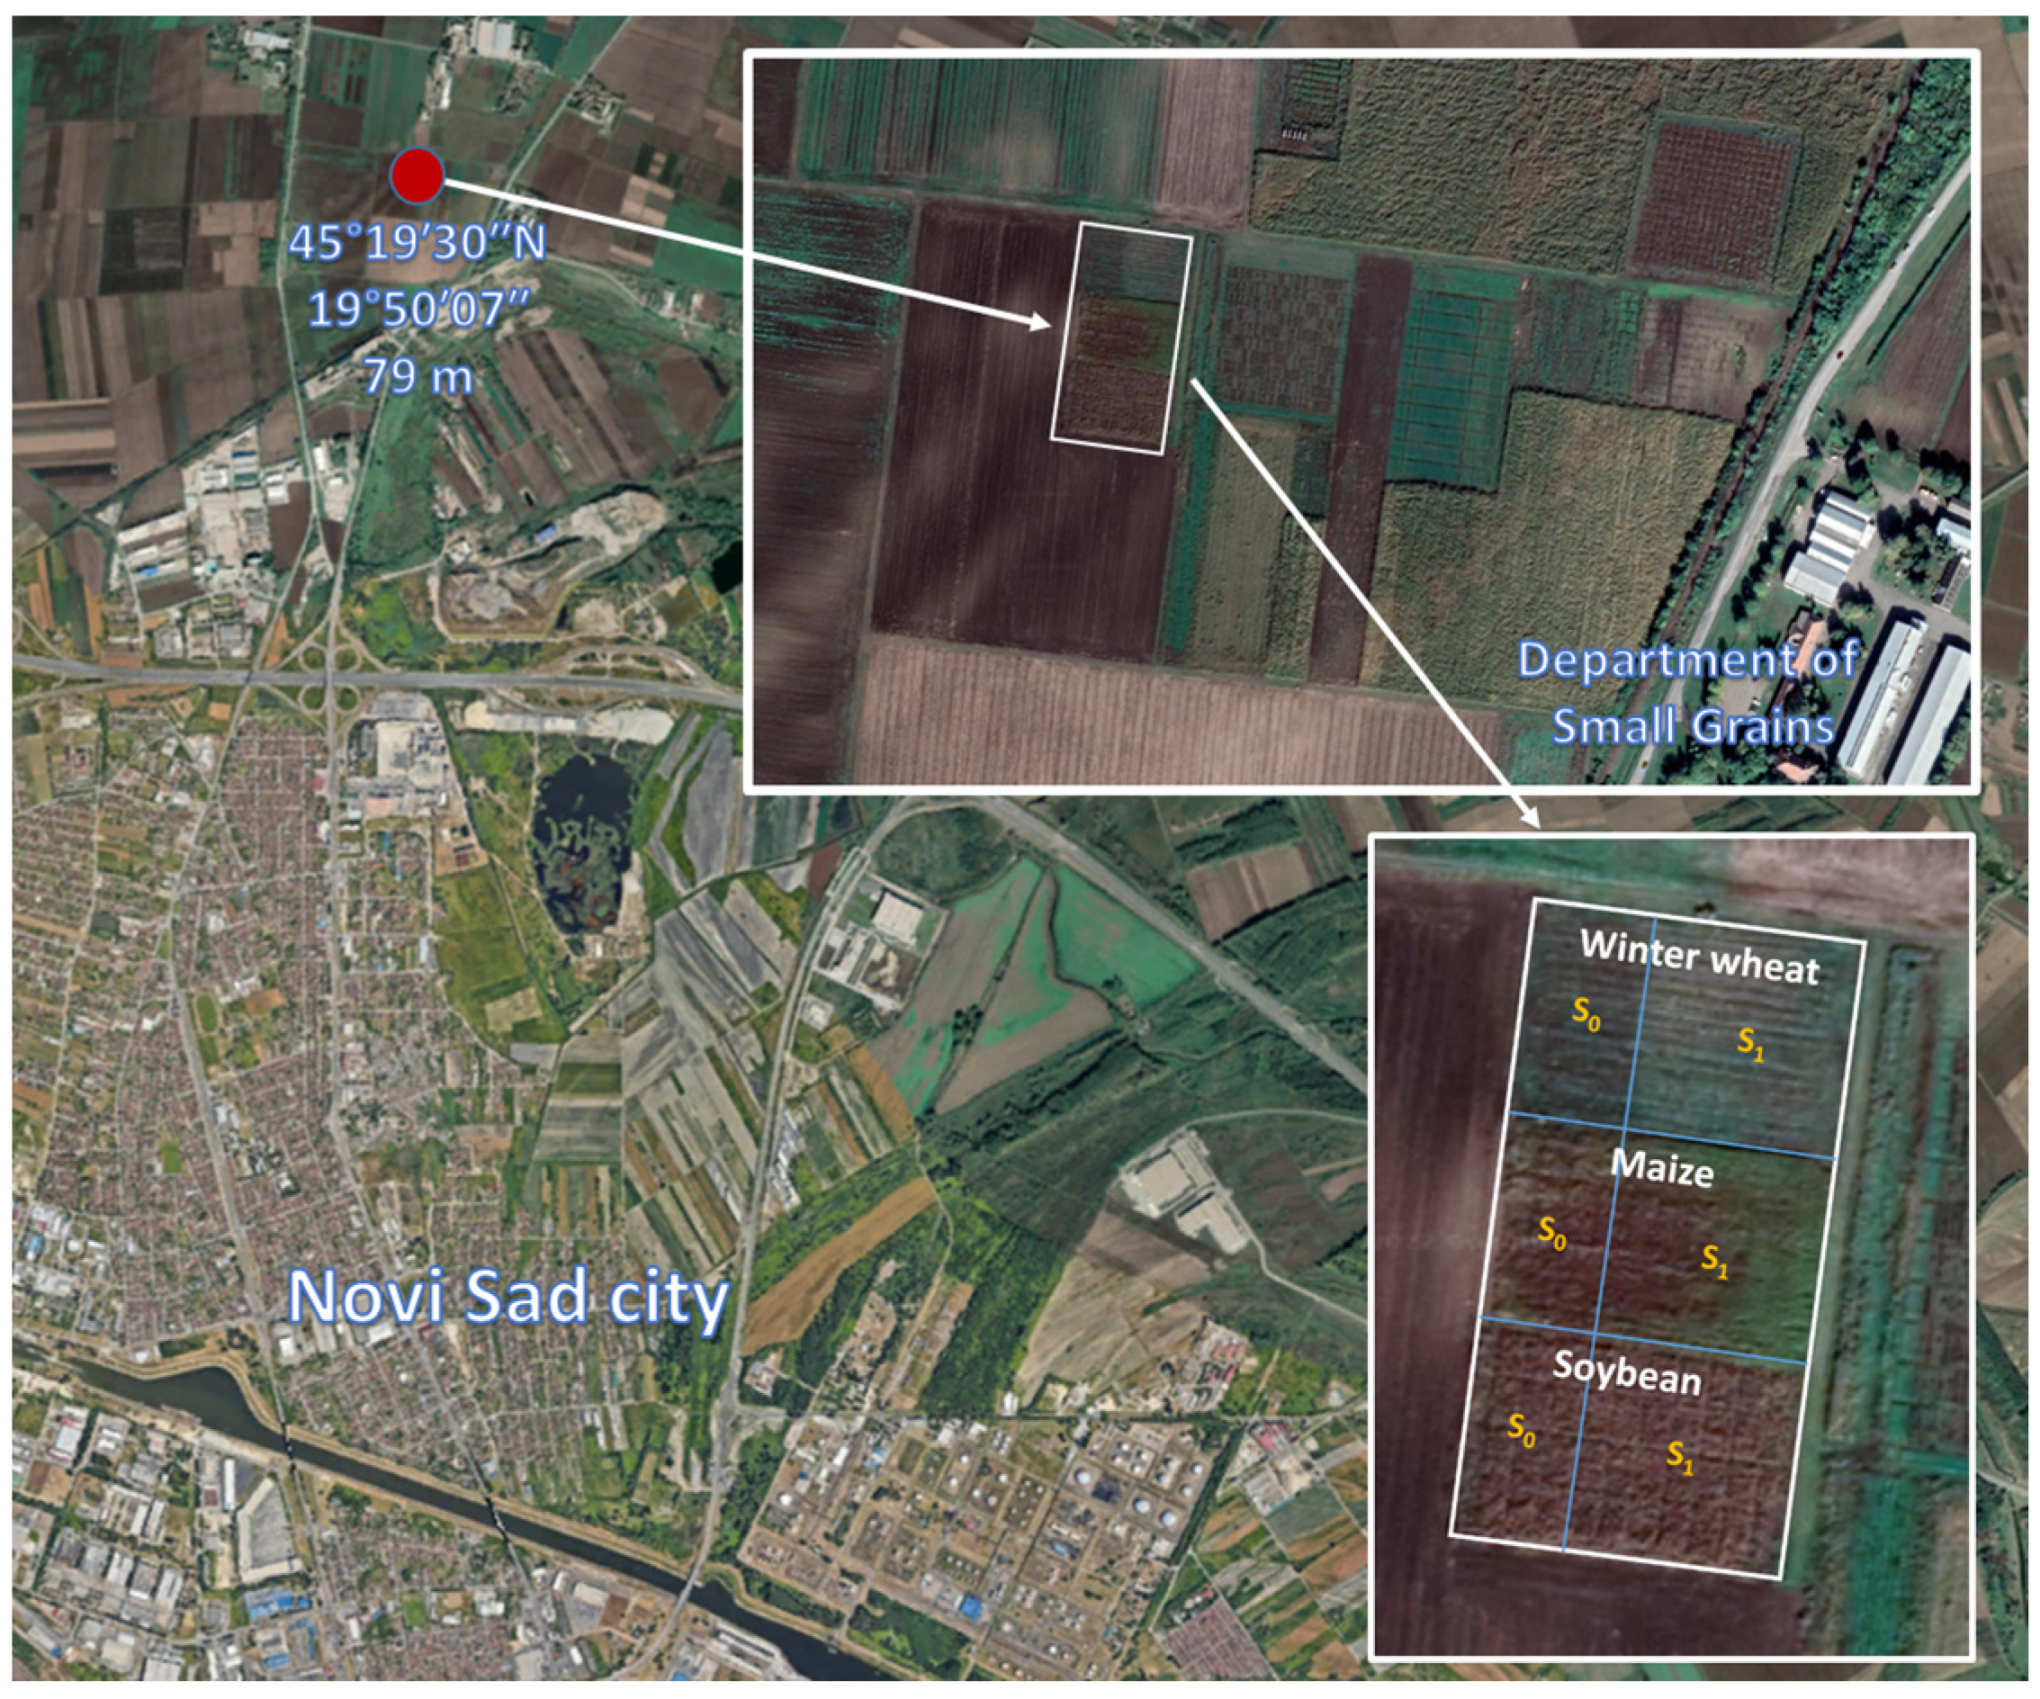
2.1.1. Location and Soil Characteristics

The long-term field trial is located on the experimental field of the Institute of Field and Vegetable Crops in Novi Sad, the National Institute of the Republic of Serbia (in Vojvodina, northern Province of Serbia). The experimental site “Rimski šančevi” (45°19′30″ N, 19°50′07″ E, 79 m a.s.l.) is located in the typical chernozem zone of the southern part of the Pannonian Basin. The location map of the experimental site and design of the field trial are shown in Figure 1 and Figure 2.
The soil type on the site is chernozem, class A–C (humus-accumulative soil), subtype—chernozem on loess and loess-like sediments, variety—calcareous, and moderately deep form (40–80 cm, according to A horizon depth) [62]. It is loamy clay textured, and slightly alkaline chernozem formed on a loess terrace, with a thick black surface humic horizon rich in organic matter. It has a convenient textural composition, with nearly equivalent proportions of fine sand and silt. According to the WRB-FAO classification system [63], the soil at the experimental site was classified as calcareous chernozem (aric, loamic, pachic), abbreviated as CH-cc-ai.lo.ph. (Figure 1b). Chernozem in Serbia occupies approximately 1,200,000 ha (or 12% of the land area), and the main chernozem zone is situated in Vojvodina (about 46% of the territory), where it accounts for approximately 1,000,000 ha, with only 200,000 ha in other parts of Serbia. Chernozem has a moderate adsorption capacity due to the humus content and the dominance of illitic clay minerals. In the first half of the growing season, its biological activity is intense, while in the second half (mostly in summer), it is usually significantly reduced due to lack of moisture [62]. It is the most fertile soil in Serbia, with high agricultural productivity.

2.1.2. Soil Properties before Establishing the Experiment

Before setting up the experiment (1971), according to Malešević [64], maize and winter wheat were grown for two consecutive years in rainy conditions, using mineral fertilizers uniformly applied at the locally recommended amounts, with conventional plow tillage and with straw return. This resulted in low spatial variability of soil properties in the plowing zone over the entire field. Before the trial establishment, the main chemical and physical soil properties were determined. Soil samples were taken after wheat harvest and before fertilizer application and plowing to define the initial state of soil fertility. The results of the soil analysis are shown in Table 1.
The initial soil analysis from 1971 (Table 1) showed that soil properties at a depth of 0–35 cm were as follows: pH in KCl was 7.00 and in H2O 7.35, the CaCO3 content was 2.1%, humus content (Tyurin method) was 3.14%, the total nitrogen (TN) content was 0.184%, and the content of available phosphorus and potassium (P2O5 and K2O; AL-method) was 13.2 and 19.5 mg 100 g−1 of soil, respectively [64]. Based on these results, it can be concluded that the soil was neutral to slightly alkaline, slightly carbonated, and moderately supplied with humus and TN. The content of humus and TN decreased with the depth of the profile. The upper soil layer was poorly to moderately provided with available phosphorus, while the potassium content was at the level of good supply. According to the textural composition, the soil at the site belonged to the loamy clay group.

2.1.3. Climate Conditions

According to its agroecological characteristics, the Rimski šančevi site largely represents the area of the wider region in which it is located (Province of Vojvodina, Figure 1b). The entire region, and thus the analyzed site, is categorized as a semiarid area with a temperate-continental climate [62]. Based on multi-year data (25 years), i.e., for the period of analysis of the long-term field experiment (1995/96–2019/20), the average annual air temperature was 12.1 °C, with an effective accumulated temperature of 3028 °C, while the average annual precipitation was 690 mm [65]. In the same 25-year period, for the winter wheat growing season (October from the previous to June of the following year), the average annual temperature was 9.2 °C, and the amount of precipitation was 495 mm (Table S1). The average annual effective accumulated temperature was 1579 °C.

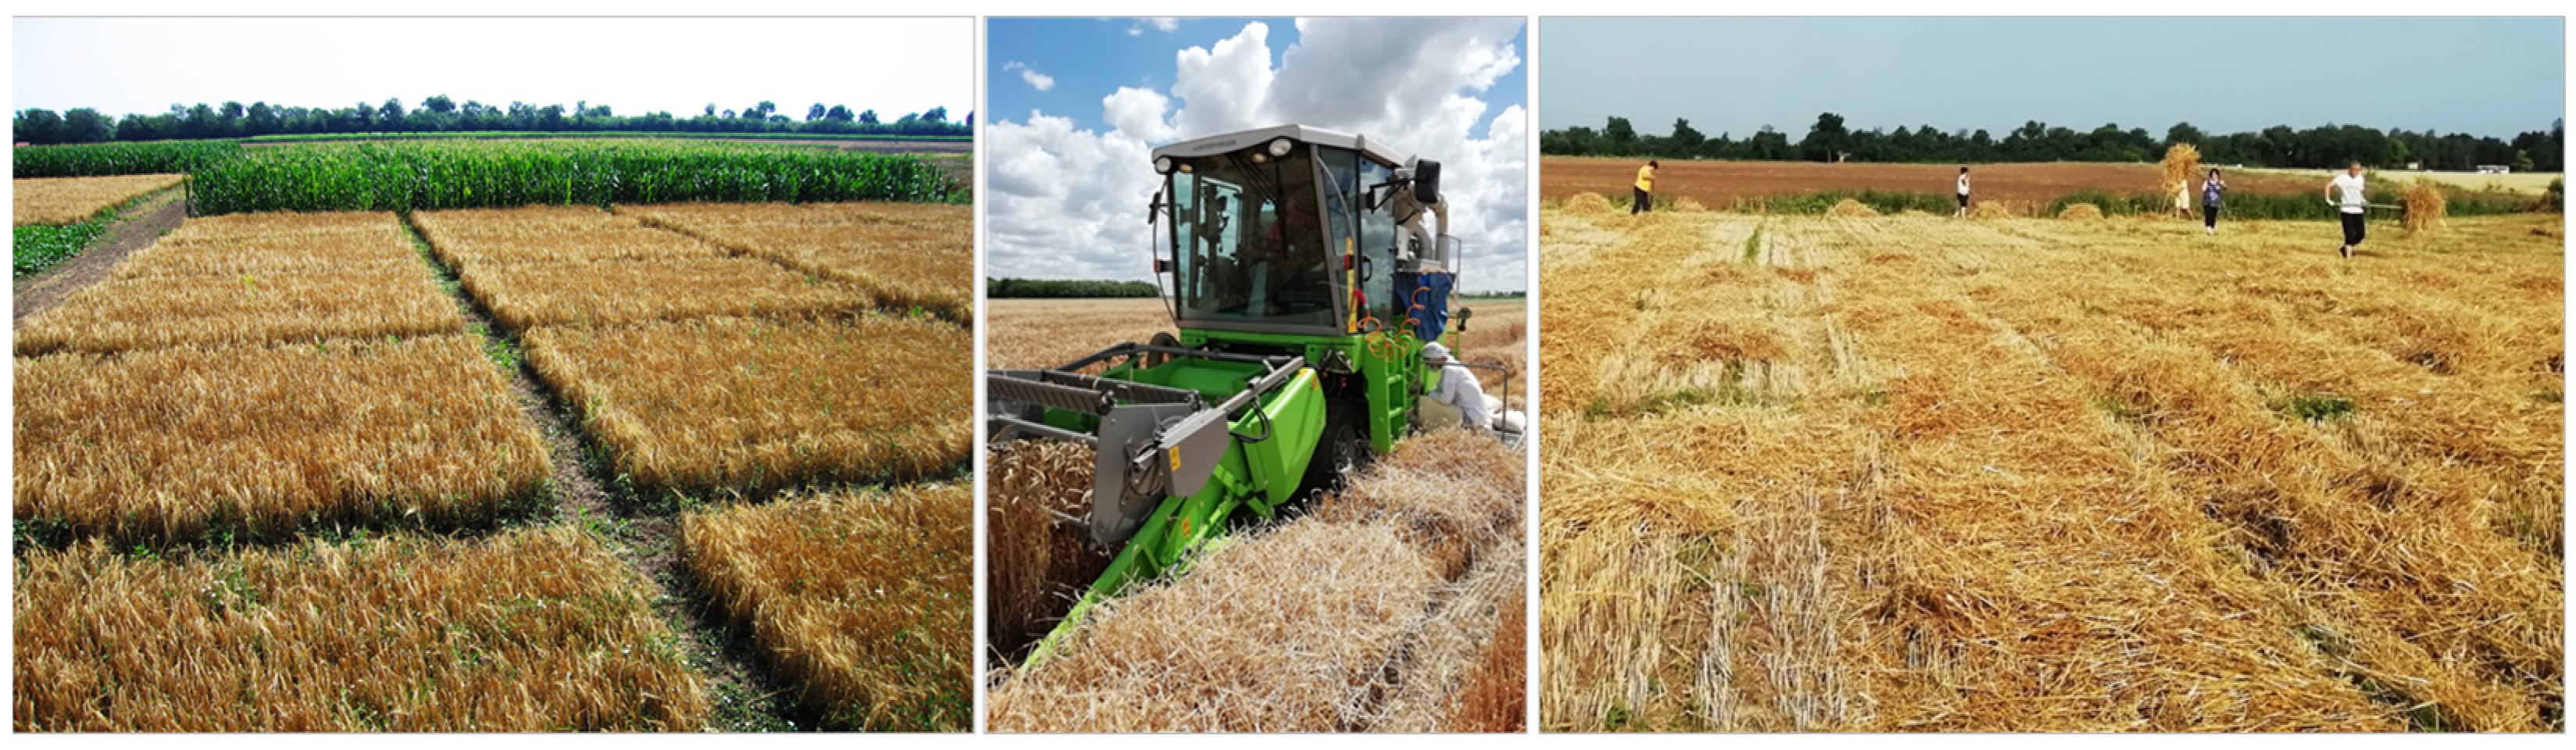
2.2. Establishment and Management of the Field Trial

2.2.1. A Brief Overview of the History and Significance of the Long-Term ISDV Trial

The “ISDV” trial was established in 1971 as part of a series of experiments by the International Working Committee on Soil Fertility under the auspices of the International Society of Soil Science. The Committee was established in 1956 at the International Soil Science Congress in Paris [66], and was considering the possibilities for expansion of soil fertility research towards the use of experimental schemes and treatment models, the results of which can be applied in international cooperation. The basis of the research was “International permanent field trials”. The ISDV (Internationale Stickstoff Dauer Versuche) project is defined as “The study of the soil productivity as to yield and quality in relation to soil conditions, to the climate of the habitat, to the nitrogen supply and to the crops” [67]. The choice of crops in the rotation was mostly predefined: (a) Spring barley as a test (unfertilized) crop (one variety), (b) crop with the highest expected dry matter yield (e.g., sugar beet, maize, medium early potatoes, etc.), and (c) one winter wheat variety adapted to the local habitat. All experiments included six levels of nitrogen (N0–N5) with straw return and three levels (N0, N2, and N4) without straw return, with sufficient fertilization with other basic nutrients. Barley straw (as an organic fertilizer) was timely incorporated before the crop with the highest productivity. The choice of locality was not limited to a certain soil type. The total number of performed experiments was 24, spread in 23 research centers over 13 countries (in the former Yugoslavia: Novi Sad (Serbia) and Ljubljana (Slovenia)).
The experiment in Novi Sad was originally (in the period from 1971/72 to 1994/95) conceived as a winter wheat-maize-spring barley rotation system, with basic plots divided into treatments with and without crop residue incorporation. In winter wheat, in the treatment with straw incorporation (SI), N fertilization variants were: 0 (control), 60, 90, 120, 150, and 180 kg N ha−1, while in the treatment without SI (crop residues, i.e., all above-ground biomass were removed from the plots after harvest) N-variants were 0, 90, and 150 kg N ha−l. After the second rotation, variant N00 (so-called “absolute control”) was introduced into the treatment with SI. This was a new variant with straw return but without the addition of N for decomposition of crop residues. Namely, in the first six variants, in addition to applying dry wheat straw (before maize), 10 kg of N from mineral fertilizer was added per 1 t of straw for more efficient decomposition, i.e., to avoid competition for nitrogen between microorganisms and crop. The straw was first mixed from all variants of N fertilization, and then it was evenly distributed and plowed. N-rates defined by the experimental scheme (CAN, 27% N) were divided into four applications: l/4 before plowing, 1/4 prior to sowing, 1/4 as the first top-dressing in late February–early March, at tillering stage, and 1/4 as the second top-dress application (second half of March, before the stem elongation phase). The same amount of phosphorus and potassium was applied every year to all variants −80 kg P2O5 (Superphosphate, 18% P2O5) and K2O (Potassium salt, 40% K2O) per hectare, 1/2 before plowing and 1/2 prior to sowing. In the first rotation of the experiment, only one variety of wheat (old Italian cultivar “Libellula”) was grown, while in the following rotations two at that time attractive domestic newly created varieties of the Institute of Field and Vegetable Crops Novi Sad were included. Based on the proposed ISDV scheme, as a crop with the highest dry matter yield, maize was selected at the Novi Sad site as the crop that dominates in Vojvodina. Sowing of maize in all years was performed in the optimal time (April), with a distance between rows of 75 cm and a distance between plants of 25 cm. In all variants, the same amount of P2O5 and K2O (80 kg ha−1) was applied before the basic tillage in autumn, while the application of N was performed two times: 1/2 before the basic tillage and 1/2 prior to sowing.

2.2.2. Changes in the Methodology of a Field Experiment

In the later period, starting from 1995/96, the methodology of the ISDV trial was partially changed. Namely, due to the increased interest of farmers in soybean cultivation and a significant increase in the area under this crop, there was a need to examine its production characteristics. Therefore, in the crop rotation, barley was replaced by soybean, and the previous crop rotation was replaced by winter wheat-maize-soybean (as a test crop) rotation (Figure 2). The basic idea of this shift was to perceive how soybean reacts to fertilization of maize (as a preceding crop) and to incorporation of its remains. According to the new methodology, soybean was not fertilized with mineral fertilizers. Sowing in all years was done in April, with a distance between rows of 50 cm and between plants of 3.0–3.5 cm. In addition, since 1996 the Department of Small Grains of the Institute of Field and Vegetable Crops has continued to intensify work on the selection of new varieties. Therefore, especially in the case of wheat, there was a need to test a larger number of varieties (e.g., 7–8 per year) with different yield potential and grain quality. In general, each variety/hybrid of crops in the rotation has been grown for at least three consecutive years. Due to the lack of economy of four manual applications of N, another change was made in the methodology of wheat fertilization. Starting from 1995/96, predefined N-rates were applied in two split applications: 1/2 in autumn, before the basic tillage, and the other half as one top-dress application at the soil surface before the stem elongation phase.
In the study, wheat yields in the period from the production years 1995/96 to 2019/20 were analyzed. However, in this 25-year period, some years were excluded from further analysis because of: (a) In 1998/99, wheat was not adequately treated due to the NATO bombing of the FR Yugoslavia, (b) in a three-year period (2009–2011) there was a need to examine the facultative variety “Nataša”, which was sown on the entire experiment as spring wheat, and these years are not included in analyze, and (c) in 2013/14 there was a strong occurrence of yellow rust (Puccinia striiformis f. sp. tritici (Pst)) on the wheat in almost entire territory of Serbia, as well as in a significant part of Europe. The infection intensities ranged from 40 to 80% in some fields, wheat yields were significantly reduced, and this year was also excluded from the analysis. In this way, the period of 25 years of performing the experiment according to the new methodology was reduced to a total of 20 years (Table S2).

2.3. Experimental Design

The study began with the sowing of winter wheat in October 1995 and ended with the harvest of soybean and maize (in late September and in October 2020, respectively; Table S3). All three crops in the rotation were grown under rain-fed conditions. The experiment was designed in a randomized complete block design (RCBD) with a split-plot arrangement in four replicates. Combinations of straw management and N-fertilization (hereinafter “SN-treatments”) were considered as main plots (ten treatments), and wheat varieties (V) as sub-plots. The area of each main plot for fertilizer application was 57 m2 (6 m wide, 9.5 m long), while for harvest (only the central part of the plot is harvested), it was 32 m2 so a sufficiently large isolation belt is provided between the plots. In total, 40 experimental plots (ten treatments × four replicates) occupy an area of 0.228 ha.
In winter wheat, the ten SN-treatments were as follows: On the plot (treatment) with straw return (S1), seven variants of N fertilization (0–180 kg N ha−1) were included, while on the plot without straw return (S0—straw was removed from the plots after harvest) variants of N fertilization were 0, 90 and 150 kg N ha−l. In straw return treatments, before the incorporation of dry wheat straw, 10 kg of N from mineral fertilizer per 1 t of straw was added for its more efficient decomposition (i.e., in order to prevent N depression). In addition, a straw return variant is included, but without the addition of N to decompose crop residues (“absolute control”). Predefined rates of N, as well as amounts of P and K (80 kg P2O5 ha−1 and 80 kg K2O ha−1, respectively), were applied in two splitted applications. The experimental design with straw management treatments and application of mineral fertilizers in winter wheat in a trial over 20 years of the study are described in Table 2. N-fertilization amounts for maize were similar but slightly increased (adapted to crop requirements) compared to wheat, while soybean was not fertilized with mineral fertilizers.
Annual biomass of above-ground wheat residues (i.e., straw yield) was calculated based on plant samples taken from all treatments in four replicates. Each year before harvest (at the maturity stage), thirty wheat plants were randomly cut by hand about 3–5 cm above the soil surface to calculate the harvest index (HI). After air-drying, the grain and straw were separated and oven-dried at 65 °C to constant weight. After recording the dry weight, the harvest index was calculated according to the formula:
HI (%) = GW/(GW + SW) × 100
GW and SW represent the weight of grain and straw (g), respectively.
All experimental plots were harvested mechanically, with a small plot combine harvester “Wintersteiger Delta” (Wintersteiger AG, Austria) in the grain ripening stage (end of June–beginning of July, depending on weather conditions). The measured grain yields (GYs; expressed in t ha−1) were adjusted to a moisture content of 13%. Total above-ground biomass yield (BY) and straw yield (SY) were calculated as follows:
BY (t ha−2) = (GY (t ha−2)/HI (%)) × 100
SY (t ha−2) = BY − GY
After harvest, in the treatment with straw return, straw was first mixed from all variants of N-fertilization and uniformly distributed over all plots (Figure 3). The straw was then mechanically chopped into approximately 10 cm long pieces and incorporated into the topsoil together with basal fertilizers by plowing. In the other treatments, straw was removed from the plots after harvest. The conventional plow tillage was carried out to a depth of 25 cm (from the end of September to the beginning of October).
During the observed period, the research covered a total of 20 winter wheat varieties (V1–V20) released between 1965 and 2016 (Table S2). The selected varieties represent the main historical, as well as currently widespread varieties of winter wheat in Serbia. Except for the old Italian variety “Libellula,” the other 19 high-yielding varieties were released by the Institute of Field and Vegetable Crops in Novi Sad. In all analyzed years, winter wheat was sown in the optimal sowing time for the conditions of Vojvodina (5–25 October). The plots were sown mechanically with a self-propelled row seeder (“Hege 76/80”, Wintersteiger AG, Ried im Innkreis, Austria) at a distance between rows of 10 cm. The recommended seeding rate of 550 viable seeds per m2 (i.e., approximately 230–250 kg of seeds ha−1) was applied. During the growing seasons, other field management practices and disease, pest, and weed control followed local conventional methods.

2.4. Soil Sampling

Soil samples from the wheat field were taken in the early spring of 2021 before top dressing. The soil was sampled from a depth of 0–30 cm using a soil auger with a diameter of 50 mm (Eijkelkamp, Zevenaar, The Netherlands). Three sample points were diagonally selected on each experimental plot, and samples were mixed to obtain one composite sample (of about 1 kg). Plant residue pieces and residual roots were eliminated during the sampling process. In this way, a total of 40 soil samples were formed (10 SN-treatments × 4 replicates) to determine the chemical properties of the soil. The samples taken represent the state of soil fertility after 50 years of continuous duration of the field trial with the combined application of different straw management and N fertilization.

Laboratory Analysis

All laboratory analyses were performed at the Laboratory for Testing of Soil, Fertilizers, and Plant Material of the Faculty of Agriculture in Novi Sad—Department of Agrochemistry, accredited according to the standard ISO/IEC 17025:2017 [68]. The collected soil samples were first naturally air-dried, ground, and passed through a 2.0 mm sieve. Soil reaction (pH) was determined by the potentiometric method using a 1:5 suspension of soil in water and 1 M KCl, by a glass electrode pH meter (Mettler Toledo, LLC, Columbus, OH, USA). The content of CaCO3 was determined volumetrically using a Scheibler-calcimeter (HedaS, Vršac, Serbia). The content of humus was determined according to the method of Tyurin using a wet oxidation procedure with potassium dichromate, spectrophotometrically (Shimadzu, UV-2600, Kyoto, Japan). Total nitrogen (TN) content was determined by using a semi-micro Kjeldahl method (Bremner modification). Readily available phosphorus (P2O5) and potassium (K2O) were extracted with a solution of 0.1 M ammonium-lactate (AL-method, Egner-Riehm). Available P2O5 content was determined spectrophotometrically (Shimadzu, UV-2600, Japan), and K2O content by flame photometry (Jenway 6105, Jenway LTD Felsted, England ). Soil organic carbon (SOC) content was determined by CHNOS Element Analyzer (GmbH, Langenselbold, Germany).

2.5. Statistical Analysis

The analysis of variance (ANOVA) procedure was performed according to a completely randomized design with four replications. Before analysis, all data sets were tested according to the basic assumptions of ANOVA at a 95% confidence interval. When testing wheat grain yield (GY) and soil properties for normality of distribution, the Shapiro-Wilk test confirmed that all data sets were normally distributed. The assumption of constant variance was checked using a plot of residuals vs. fitted value. A factorial ANOVA procedure was performed considering years (Y), combinations of straw management and N-fertilization (SN), and varieties (V) as fixed-effect factors, with a 95% confidence interval. Variance components were calculated to explain the share (i.e., relative contribution) of the main factors and their interactions in the total variation of GY, proportionally to the sum of squares. Two-way and one-way ANOVA were also used to examine the effects of year and SN treatment on GY and soil properties, respectively. The statistical significance of the difference among the means of GY and parameters of soil chemical properties was determined using Fisher’s protected Least Significant Difference (LSD) test at the 5% probability level. Most statistical analyses were performed using the Statistica software package, version 13.3.0 (TIBCO Software Inc., Palo Alto, CA, USA) and GenStat for Windows 12th Ed. (VSN International, Hemel Hempstead, UK). Correlation analysis among soil chemical characteristics and GY was calculated using Pearson’s correlation at the significance level α = 0.05.

3. Results and Discussion

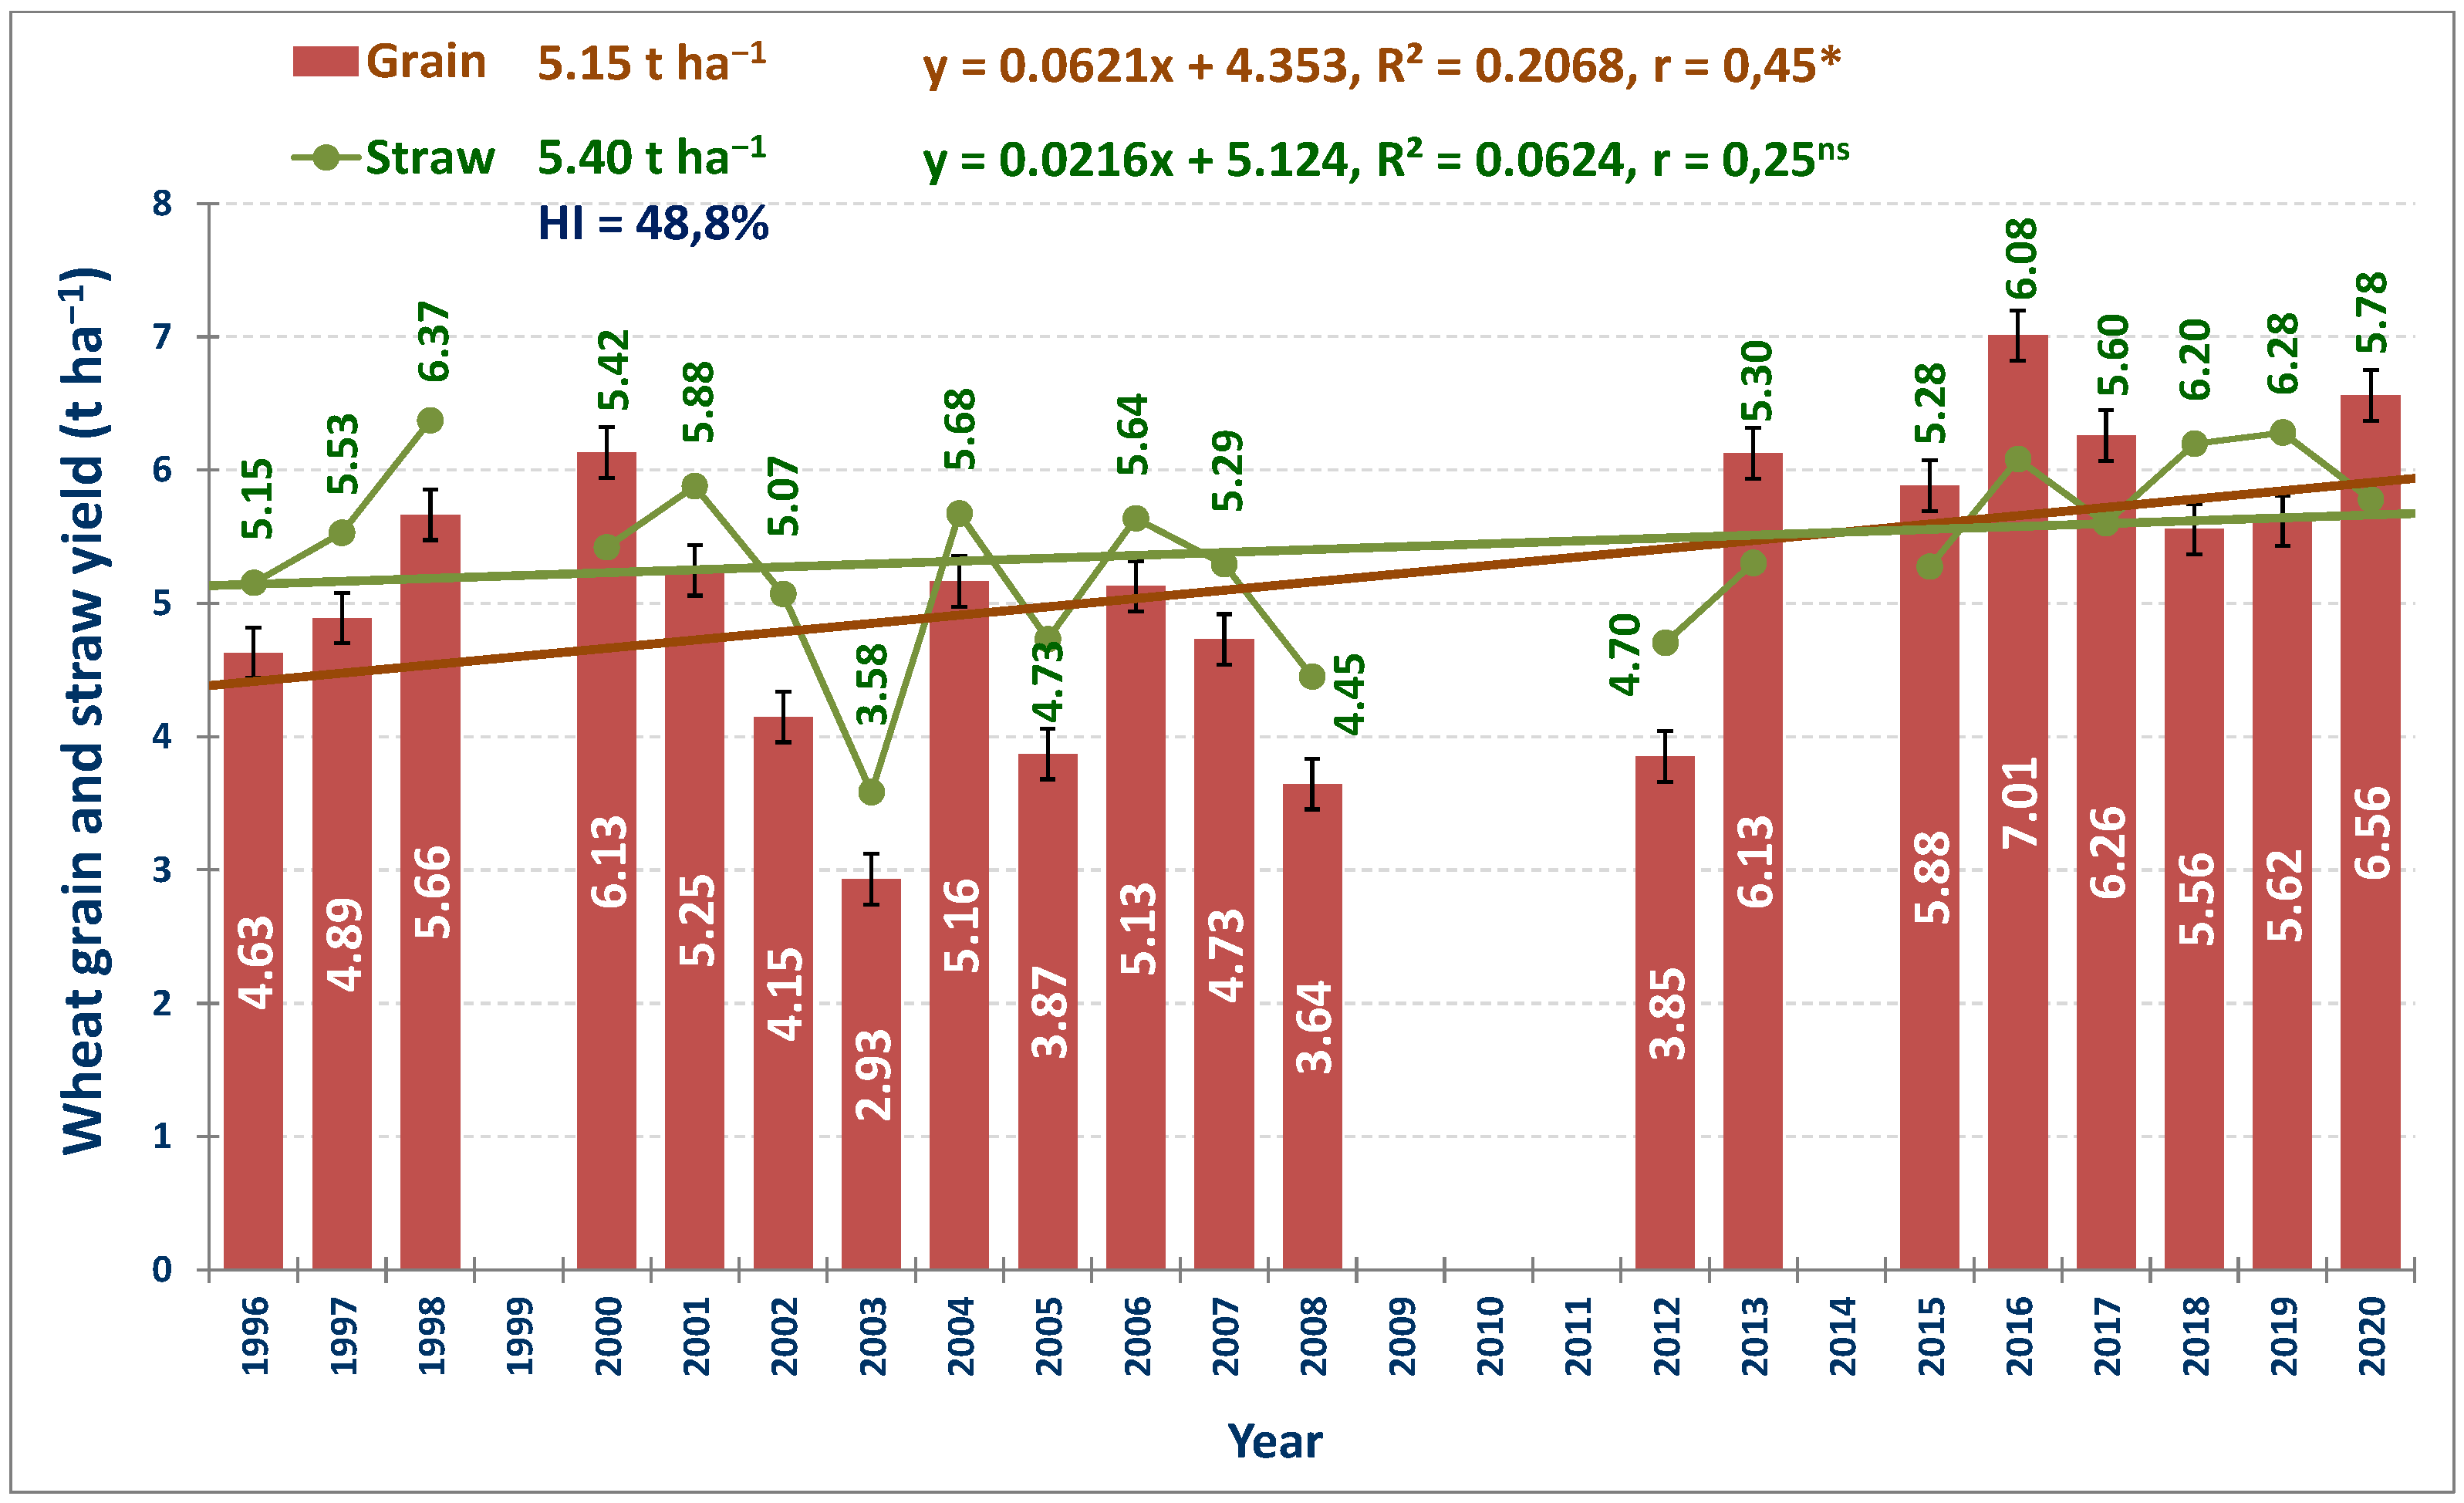
3.1. Grain, Straw, and Total Above–Ground Biomass Yield of Wheat

Wheat grain yield (GY) over the study period varied considerably from year to year, and the overall average GY in the trial was 5.15 t ha−1 (Figure 4). On average, for ten SN treatments and twenty wheat varieties, the lowest annual GY was achieved in the 2002/03 growing season (2.93 t ha−1), and the highest in 2015/16 (7.01 t ha−1). The standard deviation (SD) of the yields in the trial was 1.07 t ha−1, i.e., the coefficient of variation (CV) was relatively high (20.8%). Linear regression, i.e., yield trend during the analyzed period showed that GYs significantly (p ≤ 0.05) increased linearly (r = 0.45) with an average annual rate of 62.1 kg ha−1 (Figure 4), which indicates that the genetic progress in terms of yield increase did not reach a plateau under the conditions of chernozem zone of the southern Pannonian Plain. Since 20 wheat varieties from different selection periods were analyzed in the trial (Table S2), it can be assumed that this is probably a consequence of the fact that wheat breeding in the past decades was mainly directed at the GY improvement. Therefore, it can be considered that the stated yield trend shows progress related to the year of variety release. Analyzing 25 winter wheat cultivars released in the southern Pannonian Plain between 1930 and 2015, Mirosavljević et al. [69] reported that GY increased linearly at an average rate of 45.5 kg ha−1 yr−1, also indicating, as in the present study, that progress in grain yield has not reached a plateau.
Unlike GY, annual straw yield (SY) varied in a smaller range (3.58–6.37 t ha−1). The average SY in the trial was 5.40 t ha−1, with considerably lower SD and CV compared to GY. Based on the linear regression equation, an average annual increase in SY of 21.6 kg ha−1 can be observed, which was not statistically significant. In general, it can be noted that until the first decade of the XXI century, SY was higher than GY (harvest index (HI) was 47.2% on average). While in the second decade, the average HI was 50.7%, that is, GY outperformed SY (Figure 4). The trend of increasing HI was positive and significant (r = 0.46). The average HI in the trial was 48.8%, with a range of 45.0 to 53.6% and a CV of 6.7%. The total above-ground biomass yield (BY) was, on average, 10.55 t ha−1, with SD of 1.66 t ha−1 and CV of 15.7%. Although it was not statistically significant, the BY trend was positive, i.e., BY increased linearly with an average annual rate of 83.7 kg ha−1.
Descriptive statistics for wheat GY, on average, for all SN treatments and varieties (Figure 5a), also showed that GY varied significantly over the years. Moreover, there was considerable variability in GY in each individual year. Thus, the highest SD and standard error (SE) of the mean (1.84 and 0.58 t ha−1, respectively) were obtained in 1997/98. However, high values were obtained in all the first five years of the trial. The lowest SD and SE (0.23 and 0.07 t ha−1) were obtained in the year with the lowest GY (2002/03), as well as in other low-yielding years, however at the same time, in years with GYs above the overall average of the experiment (e.g., 2015/16–2018/19), i.e., in the last few years.
Smaller variations in low-yielding years are probably a consequence of unfavorable weather conditions in those years and low GYs in certain SN treatments. However, the different variability of GYs in the initial and last few years of the experiment, in addition to varying weather conditions, can also be attributed to breeding progress in terms of creating varieties with increased stability, i.e., tolerance to stressful weather conditions.
On average, for all years and varieties, significant differences can be observed depending on long-term straw management integrated with application of increasing N-rates (Figure 5b). In general, significantly higher yields were obtained in the treatment with continuous straw return (S1) relative to straw removal (S0). The highest GYs were obtained in the treatments with straw incorporation (SI) and application of N-doses of 180 and 150 kg ha−1, and as expected, the lowest in the variants without N fertilization, i.e., in all three controls of the trial (S0N0, S1N00, and S1N0). In contrast to significant variations in wheat GY by years, no significant variability was observed within individual SN treatments. The SD of the yield by separate treatments ranged from 1.09 to 1.26 t ha−1, and SE from 0.24 to 0.28 t ha−1. This is a consequence of averaging a large number of observations (20 years × 20 varieties, in four replicates), which, however, has no influence on the interrelationships of the SN treatments shown in Figure 5b.

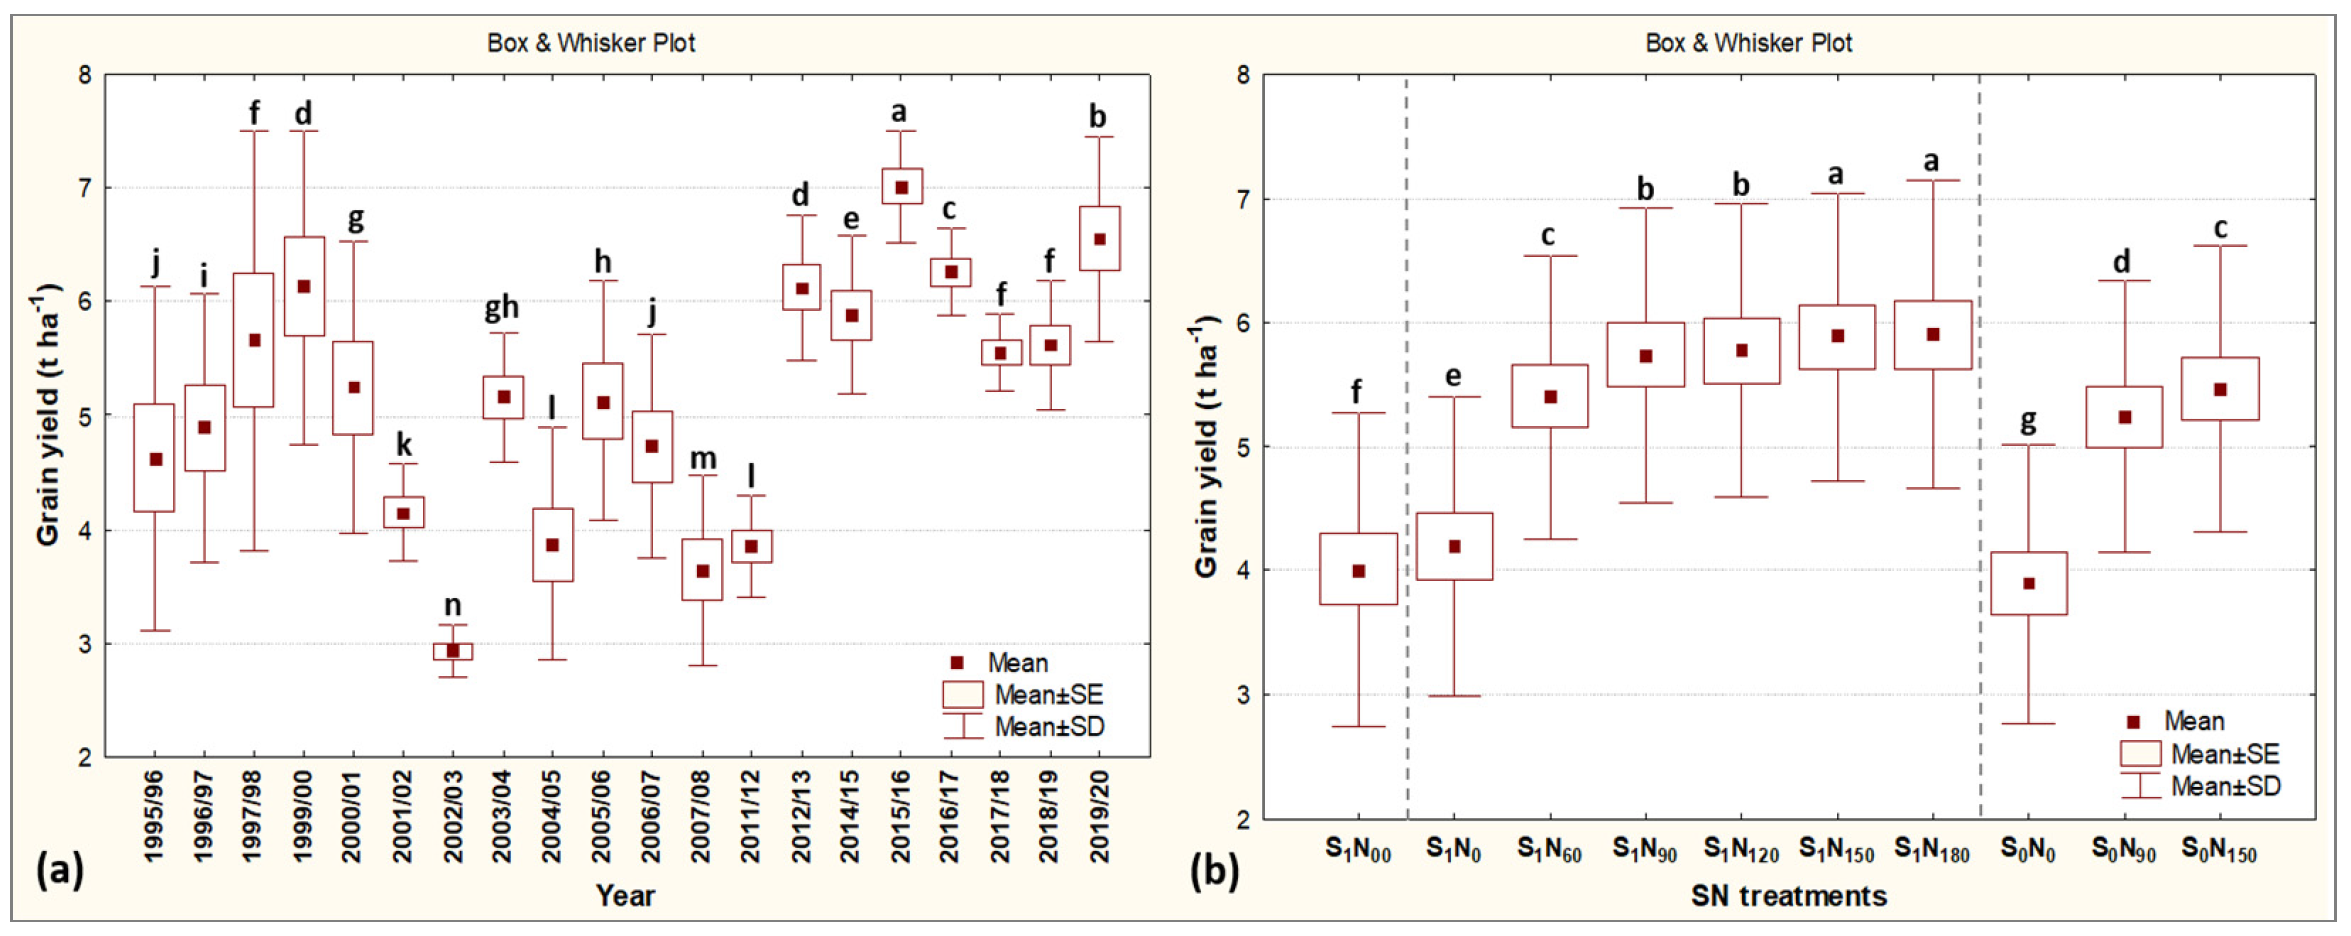
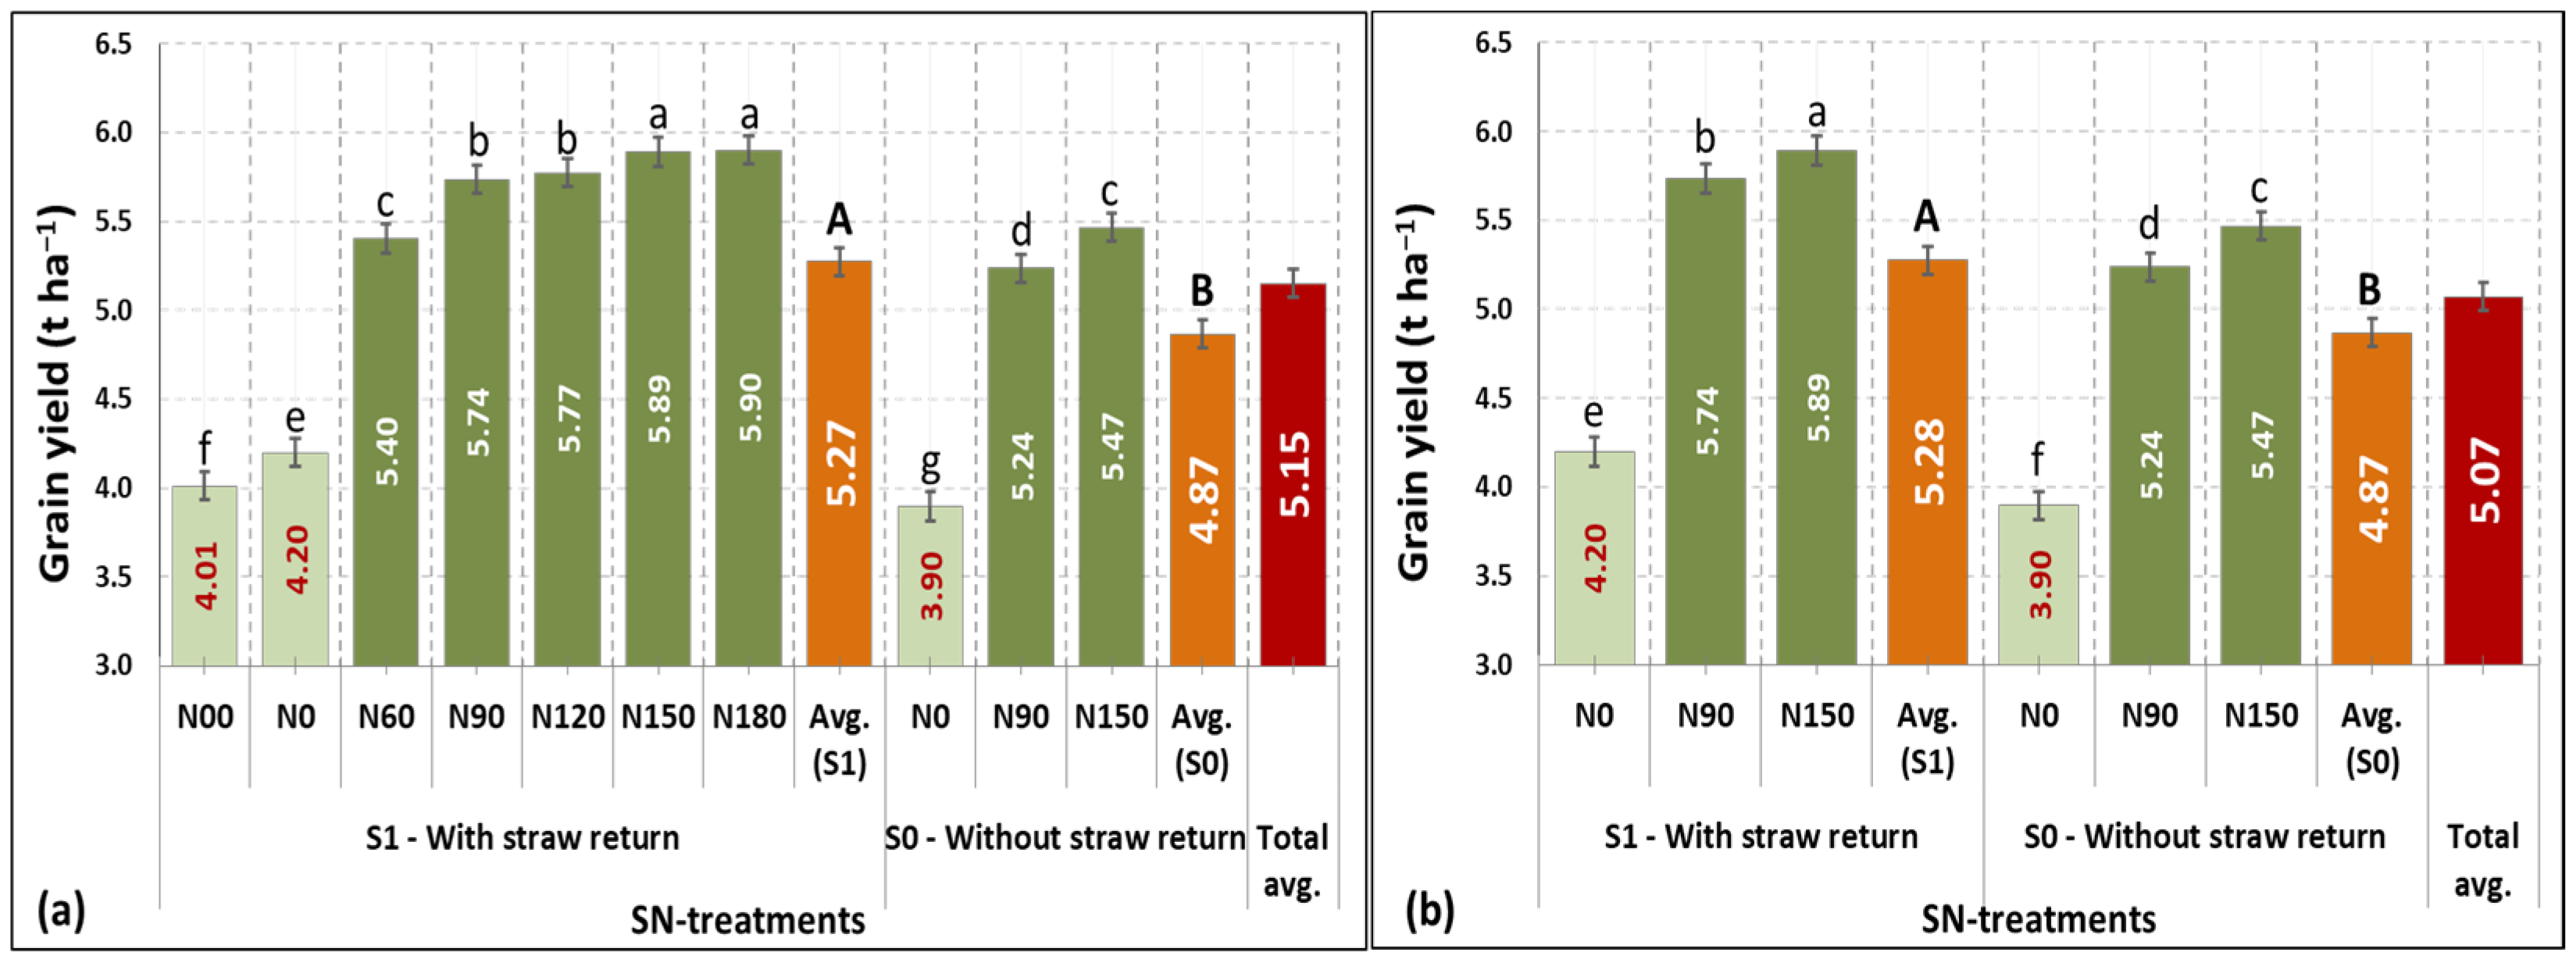
3.2. Effect of Years, Straw Management Combined with N-Fertilization, and Varieties on Wheat GY

Analysis of variance generally showed highly significant effects (p < 0.001) of year (Y), SN treatment, and variety (V) and their interactions on the total variability of wheat yield (Table S4). Only the three-way interaction (Y×SN×V) was not significant. A statistically significant Y×SN interaction effect indicates a different response of SN-treatments in terms of GY to years (i.e., to varying weather conditions over the years), while significant Y×V and SN×V interactions indicate a different response of varieties to years and SN-treatments. Based on the high relative share in the total sum of squares (SS in %; Table S4), variance analysis indicated that GY was significantly affected by year, SN-treatment, and their interaction (49.5, 28.9, and 11.5%, respectively), and they can explain most of the total variance of the GY (89.9%). Consistent with our findings, analyzing straw return strategies to improve crop productivity and soil properties, Cui et al. [7] found that variance analysis showed that maize and wheat yields were significantly affected by year, straw return, and their interaction. In a comprehensive meta-analysis based on 177 peer-reviewed publications to evaluate the combined effects of straw return and magnitude on crop yield, Islam et al. [11] found that in the wheat-maize cropping system, climate conditions in the mono- and double-cropping system accounted for 46.7% and 40.1% of the variance on GYs during straw return, respectively. Tillage, fertilizer, N-rate application, and methods of straw return were particularly important in explaining crop yield variation, accounting for 13.5, 9.3, 8.1, and 7.2%, respectively.
In the present study, it was found that the relative contribution of varieties and their interaction with Y, and particularly with SN, on the variance of GY was quite small (3.0%, 3.8%, and 0.7%, respectively; Table S4). Therefore, the SN×V interaction will not be considered separately.

Effect of Long-Term Straw Management Combined with N-fertilization on Wheat Yield over 20 Years

Wheat yield responses to different SN treatments in individual years are shown in Table 3. On average, for all SN treatments, the CV of 20.8% indicates considerable variability of wheat GY by years (i.e., interannual yield variability), ranging from 2.93 to 7.01 t ha−1. The highest GY was achieved in the 2015/16 growing season and was significantly (p ≤ 0.05) higher compared to all other years. High yields, over 6 t ha−1, were achieved in 2019/20, 2016/17, 1999/00, and 2012/13, respectively. The absolute lowest annual yield was achieved in 2002/03 growing season, however, low yields were also obtained in the 2007/08, 2011/12, and 2004/05. Except for a few individual cases, significant differences in GYs were found in almost all years.
The influence of climate conditions on crop yield responses has been extensively studied. Based on an analysis of the relative importance of influential variables in the wheat-maize cropping system, [11,19] found that climate conditions had a significant influence on crop yields during straw return. In a long-term field trial with different fertilization rates and straw management, Zhang et al. [19] reported that temperature and precipitation significantly affected crop yields and SOC content. Using the SPACSYS model to quantify the effects of various fertilization strategies and climate change scenarios on crop yields by the end of this century, [44] concluded that the application of NPK and manure or straw can enhance wheat and maize yields.
The results of our study showed that the long-term straw return integrated with N fertilization increased GY to varying degrees over a 20-year period (Table 3). Additionally, the response of GYs to straw management exhibited great variability during each individual year. In all separate years, GYs were higher in the straw return treatment compared to straw removal. Thus, the GYs in the S1 treatment (averaged across all variants of N fertilization) ranged from 3.06 t ha−1 (in 2002/03) to 7.10 t ha−1 (in 2015/16), while those in the S0 treatment were in the range of 2.63 to 6.79 t ha−1 during the same years. The differences between annual GYs in the S1 and S0 treatments ranged from only 0.09 t ha−1 (or 2.4%) in 2004/05 to 0.77 t ha−1 (13.9%) in 2012/13. However, if the differences are considered only at the percentage level (regardless of the difference in yields expressed in t ha−1), the largest difference (16.6%) in GY between S1 and S0 treatments was in the 2002/03 growing season, i.e., in the year with the absolute lowest average yield in the trial, due to the most unfavorable weather conditions in the analyzed period (Table S1). This indicates the assumption that, particularly during markedly unfavorable years, straw incorporation can provide significant benefits in terms of mitigating stressful weather conditions. This can largely be attributed to the impact of straw returning on soil moisture content. For instance, straw that is returned to the soil can reduce the evaporation rate of soil water, reduce surface runoff, improve soil water-holding properties (i.e., water storage capacity) and water use efficiency [2,6,11,22], and create suitable soil moisture conditions for crop growth, thereby increasing both yields and yield stability [23,24]. Analyzing data collected from 45 long-term trials involving corn, wheat, and rice, Wang et al. [50] indicate that, under arid and semiarid conditions, long-term straw returning can mitigate the negative impacts of stressful conditions on crop productivity by improving soil water retention, and thus enhancing soil moisture conservation.
On average, for twenty years, straw incorporation (SI) had a significantly greater impact on wheat yield. Moreover, in both main treatments (S1 and S0), the application of increasing N-rates led to a significant increase in GYs. However, the yield increases caused by N application were significantly more pronounced in the S1 treatment compared to S0 (Table 3, Figure 6).
In a meta-analysis by Islam et al. [11], the authors found that without fertilizer application, straw return did not improve yields in the wheat-maize cropping system and in some cases, even led to a decrease in yields. Additionally, according to a study by Zhang et al. [19], average crop yields increased with increasing levels of fertilizer application at a certain amount of straw input. The authors also found that at low levels of fertilizer, the effect of straw returning on yield improvement was relatively more significant than at high fertilizer rates, which is consistent with our findings.
In the present study, the highest GYs were obtained in the treatment S1 and application of 180 and 150 kg N ha−1 (5.90 and 5.89 t ha−1, respectively). In both treatments (S1N180 and S1N150), GY was significantly (p ≤ 0.05) higher compared to all other SN treatments (Table 3, Figure 6a). They are followed by two treatments with also statistically uniform average yields: S1N120 and S1N90 (5.77 and 5.74 t ha−1, respectively), and as well significantly higher than the remaining treatments. In relation to the overall average GY in the trial (5.15 t ha−1), the GYs in the above-mentioned four treatments were higher by 0.75, 0.74, 0.62, and 0.58 t ha−1, i.e., by 14.6, 14.4, 12.1, and 11.3%, respectively. However, compared to the absolute control (S1N00), all values were considerably higher, e.g., by 1.89, 1.88, 1.76, and 1.72 t ha−1 (i.e., by 47.1, 46.8, 43.9, and 43.0%, respectively). According to the achieved GY, the treatment without straw return and with 150 kg N ha−1 (S0N150; 5.47 t ha−1) follows, which, however, was not significantly different from the treatment S1N60 (5.40 t ha−1) (Figure 6a). Based on this finding, statistical equalization of GYs in the treatments without (S0) and with straw return (S1) occurred only after significantly higher nitrogen input in the S0 treatment. Specifically, for a statistically identical yield, even 90 kg N ha−1 more was needed in this treatment than in S1. This comparison indicates a great advantage of SI, as well as the possibility of significant N fertilizer savings during long-term straw return. This is of great significance both economically and environmentally. According to [19], farmers tend to use large amounts of fertilizer to obtain higher yields, even if there is no clear increase in yield. Although N-fertilization is essential and one of the main limiting factors that affect crop production, its excessive use can lead to N loss and cause serious environmental problems [11,29]. Excess nitrogen can enter the atmosphere or water bodies through processes such as volatilization, leaching, nitrification, and denitrification [19], causing issues such as eutrophication and greenhouse gas emissions [28,37,70]. Therefore, the authors suggest that N fertilizer application rates and straw return should be optimized through various scenario analyses.
All of the aforementioned SN treatments with N application achieved significantly higher GYs compared to the three control treatments (Table 3, Figure 6a). Namely, the lowest average GY (3.90 t ha−1) was obtained on the variant without N fertilization in the treatment without straw return (S0N0), and it was by 1.25 t ha−1 (24.4%) lower than the average GY of the trial, and by 0.11 t ha−1 (2.9%) lower than the GY of the S1N00 treatment. The average yield of the control of treatment with straw return (S1N0) was 4.20 t ha−1, which was lower by 0.95 t ha−1 (18.5%) compared to the trial average, and higher by 0.19 t ha−1 (4.6%) compared to absolute control (S1N00). It is worth noting that the addition of 10 kg of N from mineral fertilizer per 1 t of straw in the control S1N0 resulted in a significantly higher yield compared to the absolute control, i.e., in the same treatment (with straw return and without N-fertilization), but without the additional N for decomposition of crop residues (Table 2). It is evident that, in the case of the absolute control, there was a long-term competition for nitrogen between the microorganisms and crops in the process of straw decomposition, which hindered wheat growth. Therefore, an appropriate amount of N fertilizer should be applied during the early stage of straw return [6]. Generally, microbial decomposition of returned straw requires additional nitrogen in the soil [6,11]. The application of fertilizers, especially N, stimulates microbiological activity and enhances straw decomposition, favoring crop growth and increasing grain yield [34].
The results of our study showed that the average yield of all variants of the treatment with straw return was 5.27 t ha−1 (Figure 6a), which was higher by 0.12 t ha−1 (i.e., by 2.4%) compared to the overall average GY of the trial. At the same time, in the treatment without straw return, the average yield of all three variants was 4.87 t ha−1 and was lower by 0.28 t ha−1 (5.5%) compared to the average of the trial. By comparing the average GY of the S1 and S0 treatments, a significant difference of 0.40 t ha−1 (i.e., 8.21%) was obtained in favor of straw returning. Nevertheless, if the absolute control is excluded from this analysis (since it is redundant due to the existence of the S1N0 control treatment), the overall results show that long-term straw return significantly increased grain yield by an average of 0.62 ± 0.23 t ha−1, i.e., by 12.7 ± 4.4%, with simultaneously higher yield stability compared to straw removal.
However, since the treatment S1, in addition to the absolute control also contains a larger number of N-variants, a more objective consideration of the relationship between treatments with and without straw return can be made by observing only comparable N-variants (N0, N90, and N150) from both treatments. Observed by individual years and averaged across all three N-variants, the GYs in the S1 treatment ranged from 3.11 to 7.06 t ha−1 (in 2002/03 and 2015/16, respectively) (results derived from Table 3), and in all years they were higher compared to the yields in the S0 treatment. Yield differences ranged from 0.11 to 0.76 t ha−1 (in 1996/97 and 2014/15, respectively), or expressed as a percentage, from 2.3 to 18.4% (in 1996/97, i.e., 2002/03). In a 20-year average, significantly higher (p ≤ 0.05) GYs were obtained in the S1 treatment compared to S0, regardless of applied N-doses (Figure 6b). On the control treatment S1N0, the GY was higher by 0.30 t ha−1 (i.e., by 7.7%) compared to the S0N0 control. When fertilizing with 90 kg N ha−1, the S1N90 treatment achieved a higher GY by 0.50 t ha−1 (i.e., by 9.5%) compared to S0N90, while at the highest N-dose (150 kg ha−1), the GY in the S1N150 treatment was higher by 0.42 t ha−1 (7.8%) compared to S0N150. On average, across all three N-variants, the GY in the S1 treatment was 5.28 ± 1.09 t ha−1, which was significantly higher than the average yield obtained in the S0 treatment (4.87 ± 1.03 t ha−1) (Figure 6b). The overall results showed that, when observing only comparable N-variants of both treatments and averaging across all analyzed years, long-term straw return significantly increased the GY by an average of 0.41 ± 0.21 t ha−1, i.e., by 8.4 ± 4.5% compared to straw removal.
Other previous studies have also shown that long-term straw returning, combined with mineral fertilizers, can achieve higher yields than treatments with fertilizers only or without fertilizer application. For example, in a meta-analysis by Islam et al. [11], the overall results showed that in the winter wheat-maize cropping system, straw return significantly increased crop yields by an average of 5.5% compared to straw removal. Analyzing a 30-year long-term field experiment, Zhang et al. [19] found that in treatments that combined straw return and the application of inorganic fertilizers, the yields of winter wheat and maize increased by 1.9–5.4% and 5.2–8.4%, respectively, compared to treatments with only fertilizer application. Moreover, in a meta-analysis based on observations from 45 long-term experiments under wheat, maize, and/or rice cropping systems in China, Wang et al. [50] found that continuous straw return significantly increased crop yields by 7.0 ± 0.7% (mean ± SE) relative to straw removal. Based on the analysis of 50 long-term experiments in 15 European countries, Lehtinen et al. [70] found that crop residue incorporation resulted in an average yield increase of 6% (for wheat, barley, and maize) compared to crop residue removal. Summarizing the response of cereal yield to straw incorporation (SI) management, Zhao et al. [71] performed a meta-analysis consisting of 142 paired cereal yield data drawn from field experiments (142 comparisons) and showed that crop yields increased under SI in 92% of these comparisons, and reduced in only 8% of locations. Overall, the authors found that SI significantly increased cereal (maize, wheat, and rice) yields by 7% compared to straw removal. In addition, Yang et al. [72] found that after 22 years of a long-term winter wheat-maize field experiment, the combined application of inorganic fertilizers and crop residues substantially increased crop yields. In the conditions of Vojvodina, in a two-year study conducted on the same trial, Jaćimović et al. [12] reported that, on average, for all N fertilization variants, wheat GY obtained in the SI treatment was 540 kg ha−1 higher compared to straw removal. Depending on the analyzed varieties and the amount of applied N, the increase in wheat yield in the treatment with SI amounted to 370–930 kg ha−1, which is, on average, for four years, about 11% [26], while [27] report an increase in maize yield by 12.5% in the treatment of plowing crop residues in crop rotation compared to their removal.
The rate of yield increment induced by straw return observed in the present study (8.4%) is similar to the overall increase reported in the previous meta-analysis by Qi et al. [38] (8.3%), and Wang et al. [50] and Zhao et al. [71] (both 7%). It is higher than the increases reported by [11] (5.5%), [19] (1.9–5.4%), and [70] (6%), but considerably lower than the increase reported in the meta-analysis by Liu et al. [37] (12.3%). Wang et al. [50] note that straw return may increase, reduce, or have no significant effect on crop yields. These differences depend on climate conditions, cropping system, tillage, soil type, and its physical, chemical, and biological properties, as well as nutrient levels, straw amount, and management practices, among other factors. This is consistent with the findings of other studies [11,19,71,72]. Moreover, Zhao et al. [71] noted that SI might not always increase cereal yield, particularly in soils with higher nutrient and SOC levels and in areas without significant water deficits.
As mentioned earlier, the average coefficient of variation (CV) for all SN treatments was 20.8%, indicating considerable variability of GY among years. However, the CVs of GY over the years varied significantly among individual SN treatments (Table 3). The highest value of CV (31.5%) was obtained in the absolute control, followed by the control treatments S1N0 and S0N0 (both 28.8%). Compared to them, the CVs in all treatments with nitrogen application were notably lower, ranging from 19.6 to 21.1%. This indicates that N application in both basic treatments (S1 and S0) caused a considerable increase in yield stability over the years. The average value of the CV (without taking control treatments into account) was 20.6% in the S1 and 20.9% in the S0 treatment. Although these values are almost identical, considering the significantly higher GYs in the S1 treatment, it is obvious that SI also contributed to more stable yields compared to straw removal.
Analyzing three tillage methods and two straw treatments over an eight-year period in a wheat-maize rotation system, Shi et al. [23] found that straw return increased crop yield stability, with the highest sustainable yield index in no-tillage and straw return for both crops. In a long-term field experiment, [24] found that incorporating ammoniated straw significantly increased wheat yield stability by 19.5% compared to conventional SI and by 38.7% compared to the treatment without SI. In the long-term Broadbalk Wheat Experiment, Macholdt et al. [25] analyzed the effects of cropping sequence, fertilization, and straw management on the yield stability of winter wheat. Their results showed that crop rotation combined with sufficient mineral N fertilizer ensured stable wheat yields while reducing yield risk. On the other hand, higher yield risks and interannual yield variability were found in continuous wheat with less N fertilizer or with organic manure only. In conclusion, they stated that when straw was incorporated, and wheat received inputs of manure, the interannual yield variability was lower, and yield risk was higher than when straw was removed. Finally, Zhang et al. [19] emphasized that high and stable crop yields, as well as enhanced soil fertility, can be achieved by optimizing the ratio of fertilization rate to the amount of incorporated straw.

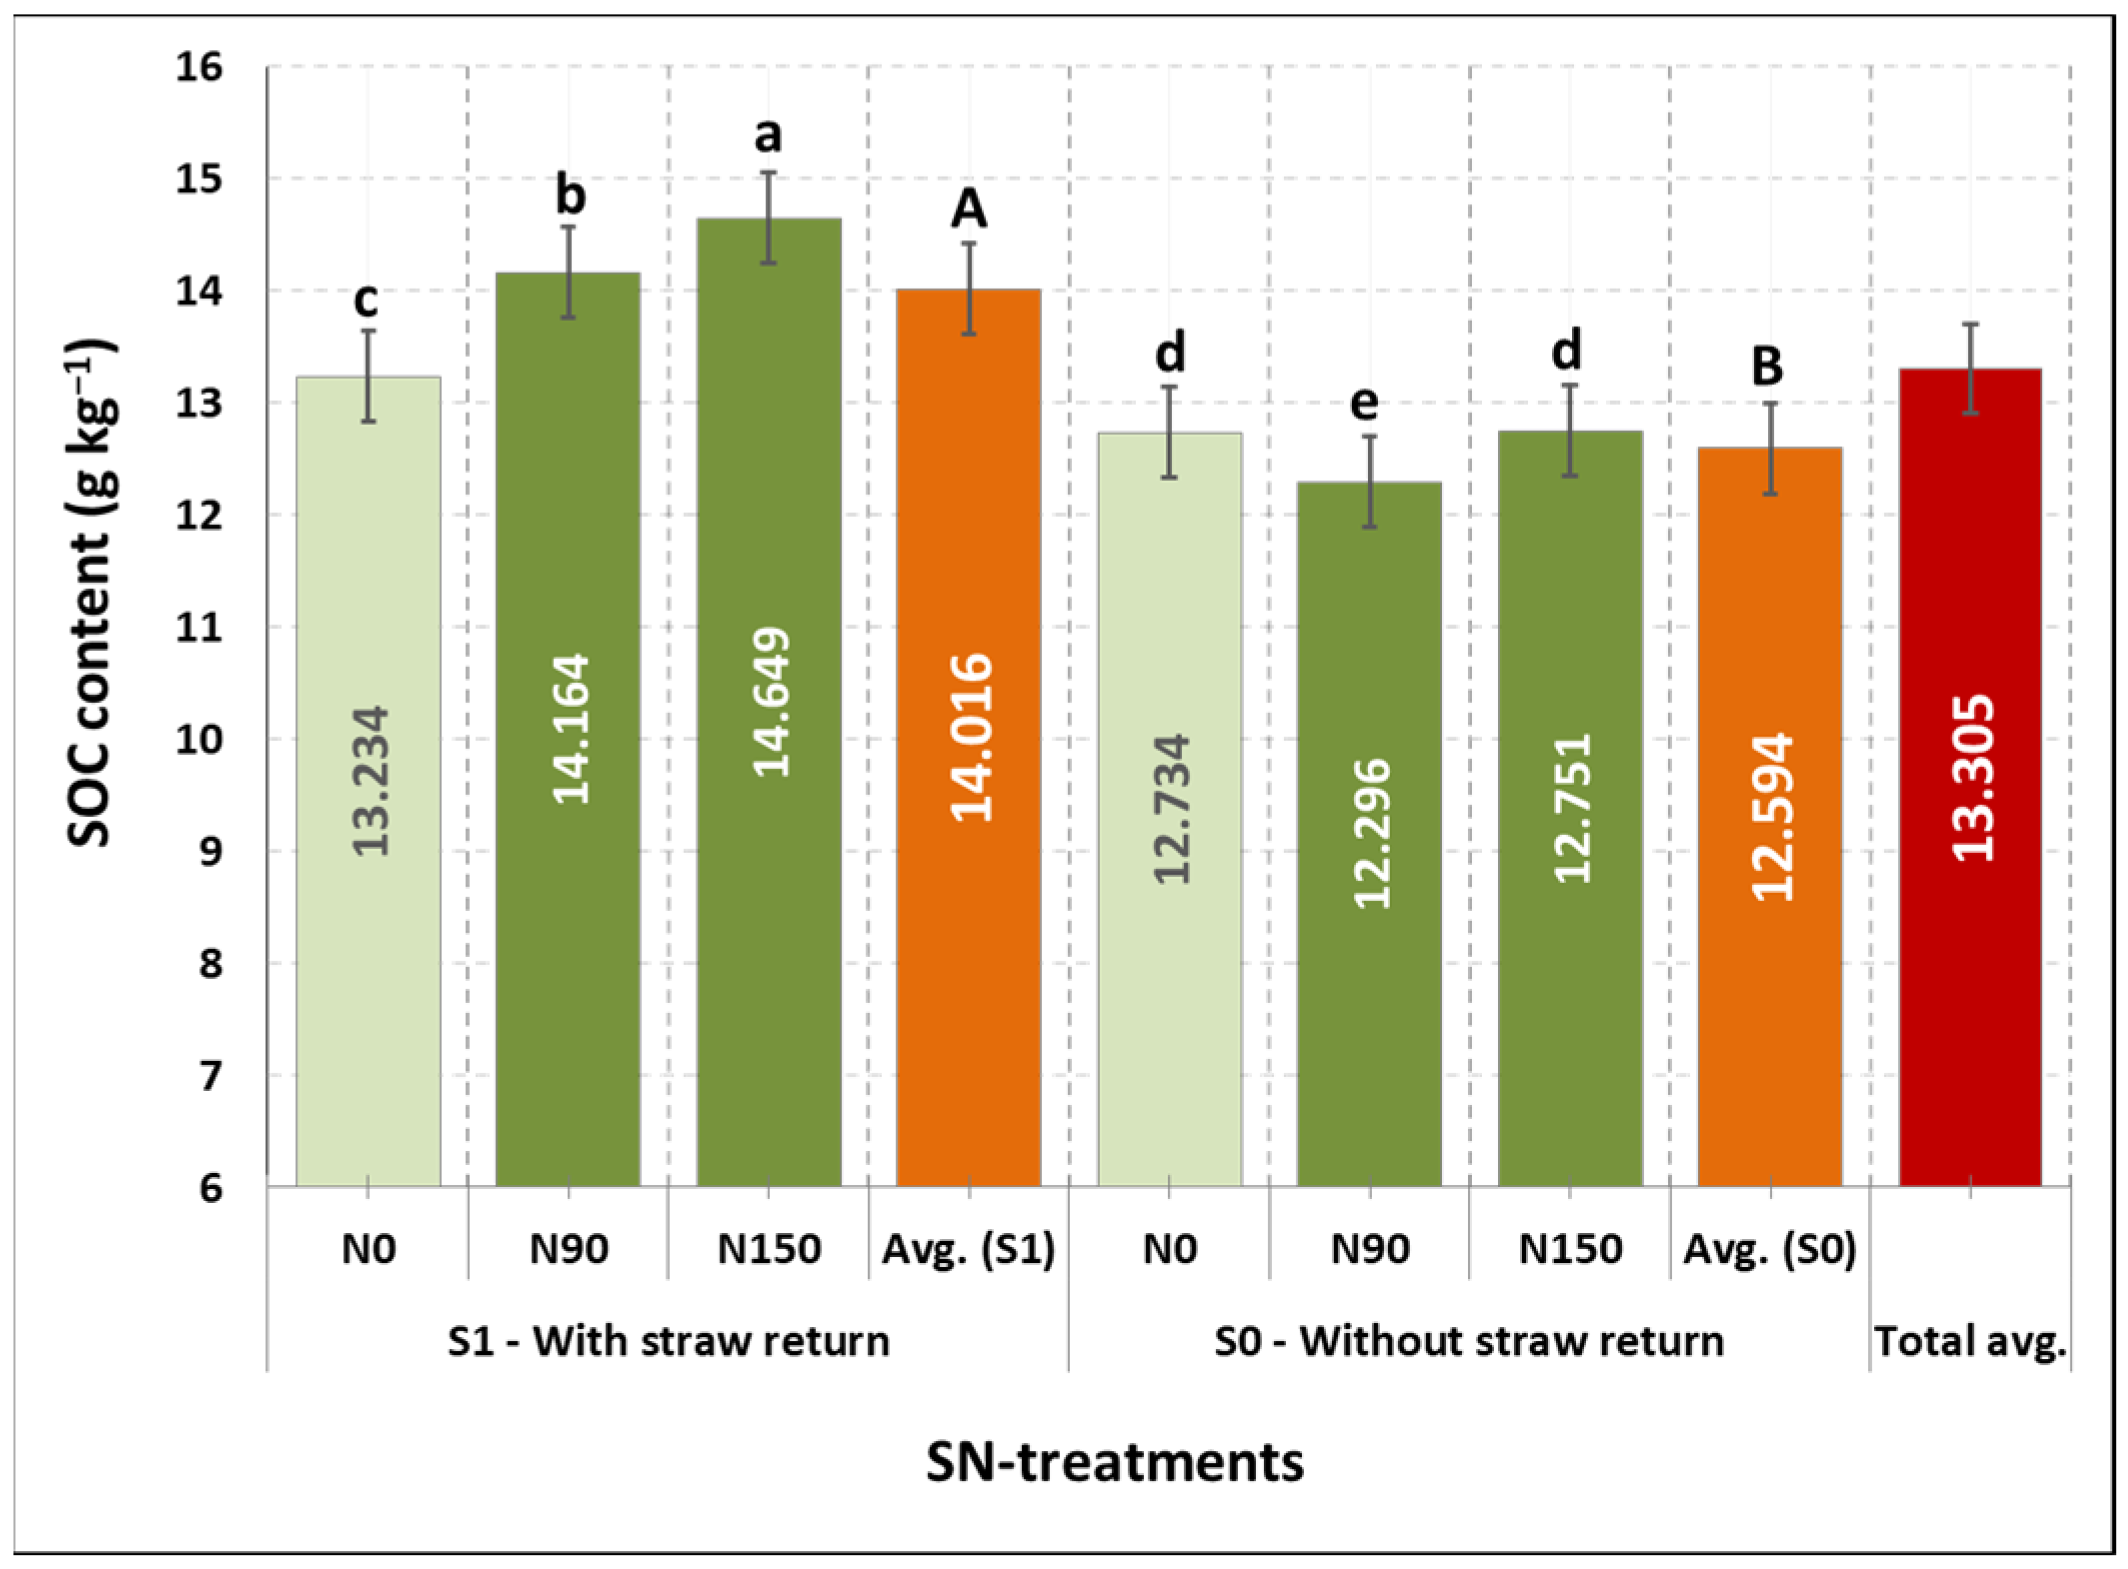
3.3. Effect of Long-Term Straw Management Combined with N-fertilization on Soil Properties

The results of the soil analysis (Table 4) show the state of soil fertility after 50 years of continuous trial duration. Comparing the soil characteristics of the surface layer (0–30 cm) between treatments with and without straw return, all SN treatments exhibited similar soil pH levels and CaCO3 content, indicating that the differences in pH and CaCO3 values were not significant. However, the other measured soil parameters showed statistically significant (p < 0.001) variations among the different SN treatments. Furthermore, considerable changes were observed in certain analyzed parameters in relation to the initial state of soil fertility—before the experiment was established in 1971 (Table 1).
Based on the pH value determined in KCl, the soil in all SN treatments can be classified as neutral, while based on pH in H2O, it is slightly alkaline (Table 4). There were no significant differences between treatments S1 and S0. A slight increase in both pH values can be observed compared to the initial soil analysis (Table 1), but the soil still remained in the category of neutral to slightly alkaline in all SN treatments. Similar to our findings, Liu et al. [37] found that soil pH showed only a minor change in response to straw return. Although the content of calcium carbonate (CaCO3) was slightly higher in treatment S0 than in S1 (5.34% and 4.88%, respectively), the variance analysis showed no significant differences between SN treatments. Nevertheless, compared to the initial state of soil fertility, the CaCO3 content after 50 years increased by more than twice, i.e., by 2.78% in the S1, and by 3.24% in the S0 treatment. However, the soil can still be classified as slight to medium carbonate. The absence of significant differences between experimental treatments can be attributed to the fact that the soil pH and the content of CaCO3 are most often natural properties of the soil type, originating from the pH reaction of the parent substrate from which the soil was formed [73].
Based on the results presented in Table 4, the content of humus, as the main component of soil organic matter (SOM), and total nitrogen (TN) at a soil depth of 0–30 cm showed similar relationships among the SN-treatments. The highest humus content (3.33%) was obtained in the S1N120 treatment, but no statistically significant differences were observed in relation to the S1N90 and S1N150 treatments. The lowest values were obtained in the absolute control (S1N00; 2.95%) and in the control S0N0, followed by S1N0 and the treatment S0N90. On average, for all N-variants (without absolute control), the treatment with straw return achieved a significantly higher humus content (3.24%) compared to the treatment without straw return (3.09%). By observing only comparable N-variants (N0, N90, and N150) of both main treatments, the long-term straw incorporation (SI) also significantly increased humus content by an average of 0.13% (or relatively by 4.16%) compared to straw removal. The results of the soil analysis conducted prior to establishing the trial (Table 1) showed that the humus content in the surface layer of the soil was 3.14%. After 50 years since the trial was established, straw return resulted in a considerable increase in the humus content by an average of 0.10% (or relatively by 3.29%), while in the straw removal treatment, it decreased by 0.05% (−1.48%). The highest increase in humus content compared to the initial state was observed in the following order: S1N120 > S1N90 > S1N150 (relatively by 6.15, 5.29, and 3.34%, respectively). In the treatment without SI, an insignificant increase of 0.04% was obtained only in the S0N150, in the control S0N0, humus content decreased significantly by 0.17%, while in the treatment S0N90, and in control S1N0, it remained at the initial level.
The total nitrogen (TN) content was also highest in the S1N120 treatment (0.201%) and was significantly higher compared to all other treatments (Table 4). It was followed by the S1N90 treatment (0.194%), from which, however, treatments S1N150, S1N180, and S1N60 did not differ significantly. The lowest values of TN were in the absolute control (0.173%) and in the S0N90 treatment, followed by control treatments S0N0 and S1N0. In the S1 treatment, a significantly higher TN content (0.191%) was obtained compared to S0 (0.183%). By observing comparable N-variants of the S1 and S0 treatments, straw return resulted in an average increase in TN content of 0.007% (relatively 3.82%) compared to straw removal, but this difference was not statistically significant. Before establishing the trial, the TN content was 0.184%, and compared to this value, SI increased TN by an average of 0.007% (i.e., relatively by 4.02%), while in the S0 treatment, TN content was slightly reduced. In the S0N90 treatment, there was an inconsiderable decrease in TN content, while there were no significant changes in the S1N0, S0N0, and S0N150 treatments.
Compared to the initial soil analysis, according to the content of humus and TN, after 50 years, the soil still remained in the category of moderately supplied with humus and medium provided with total N.
In general, the highest values of humus and TN content were achieved in the treatment with continuous straw return integrated with the application of 90 to 120 kg of N ha−1, while the lowest values were obtained on the control variants (without N application). Compared to the results of the soil analysis conducted before the start of the experiment, in the control variant of the straw return treatment (S1N0), there were no significant changes in the content of humus and TN. It can be concluded that long-term SI, even without N application, can preserve both fertility indicators of the analyzed soil type. In any case, this is a positive finding considering the significant reduction of SOM and humus content in Serbia, as noted by numerous authors [13,14,15,16]. In contrast, in the treatment without straw return, only with more intensive N-fertilization (90 and 150 kg N ha−1 in the case of humus and 150 kg N ha−1 in the case of TN content), no significant differences were found compared to the state before the trial establishment. This indicates the possibility of preserving these soil fertility parameters even without crop residue incorporation but at a considerably higher level of investment in nitrogen input. This can be explained by positive feedback between increased GYs resulting from higher N-application rates and below-ground crop residues. Specifically, larger crop yields lead to higher underground residue production, which in turn leads to a greater accumulation of organic matter (humus) and TN in the soil.
The contents of available phosphorus (AP) and potassium (AK) in the soil were highest in treatment S1N90 (34.57 and 29.99 mg 100 g−1 of soil, respectively). However, no significant differences were found compared to treatments S1N60, S1N120, S1N150, and S1N180. The lowest P2O5 and K2O values were obtained in the S0N150 treatment and in the control S0N0, followed by the absolute control (Table 4). On average, for all N-variants, the S1 treatment achieved significantly higher AP and AK contents compared to S0. With straw incorporation, significantly higher contents of AP (by 15.0%) and AK (by 11.1%) were obtained compared to straw removal. When observing only comparable N-variants, the S1 treatment significantly increased the AP content by an average of 4.28 mg 100 g−1 (i.e., by 14.9%), and AK content by 3.23 mg 100 g−1 (12.3%) compared to S0. Compared to the initial soil analysis (Table 1), the AP content increased by 19.86 mg 100 g−1 (i.e., by 150.4%) in the S1 and by 15.54 mg 100 g−1 (117.7%) in the S0 treatment. Simultaneously, the AK content increased by 9.62 mg 100 g−1 (49.3%) in the S1 and by 6.71 mg 100 g−1 (34.4%) in the S0 treatment. Based on the previous interpretations, the most significant improvement compared to the initial state of soil fertility was recorded regarding the level of soil provision with available phosphorus and potassium.
Crop straw contains abundant organic and inorganic components and can be widely applied in fields to promote soil organic matter (SOM) and humus content, as well as provide essential nutrients for crop growth. Wang et al. [50] strongly recommend that farmers return straw to the soil to prevent the decline of SOM and enhance soil structure. Li et al. [17] reported that after 10 years of long-term crop straw returning combined with K-fertilizer application, soil chemical properties such as SOM, SOC, and available and slowly available K content were significantly improved compared to the control (NP) treatment. The authors emphasized that, among all treatments, the NPK + straw incorporation (SI) resulted in the best effect compared to the treatment without SI. Nutrients released by straw decomposition improve soil fertility, promote crop growth, and increase yields. Although straw contains only a small proportion of nutrients, it can still be a beneficial complement to the soil, providing a long-term supply of nutrients for crop growth [37]. Consistent with our findings, the authors observed that the increase in total nitrogen (TN) was greater in the SI treatment compared to the control. Additionally, both total and available phosphorus (AP) increased due to SI. Fu et al. [2] reported that the decomposition of crop residues increases the content of organic C, AP, and AK in the soil, providing nutrients for microorganisms and crops. Islam et al. [11] also found that returning straw to the soil enhanced total and available N, P, and K. Similar to our study, their results showed that soil AK was particularly significantly affected by SI. Over a three-year experimental period, Cui et al. [7] found that straw return significantly increased SOC, mineral N, and AP contents compared to straw removal, also indicating that straw return is beneficial for nutrient accumulation in soil and for improving soil fertility.
The combined application of long-term straw management with increasing N-rates showed a significant effect on the content of soil organic carbon (SOC) (Table 4). The SOC content in the treatment with straw return ranged from 14.737 g kg−1 (in the S1N120 treatment) to 12.864 g kg−1 (in the absolute control), while in the S0 treatment, it ranged from 12.751 (S0N150) to 12.296 g kg−1 (S0N90). The highest SOC content in the trial was obtained in the S1 treatment with fertilization of 120 kg N ha−1, however, no significant difference was found compared to treatments S1N180 and S1N150. The SOC content in these treatments was significantly higher compared to all other SN treatments. Compared to the overall average of the trial (13.529 g kg−1), the SOC in the aforementioned treatments was higher by 8.93, 8.59, and 8.28%, respectively. However, compared to the absolute control, all values were considerably higher, e.g., by 14.56, 14.20, and 13.88%. Significantly higher SOC values were obtained in all treatments with straw return (except the absolute control) compared to treatments with straw removal. The absolute lowest SOC content (12.296 g kg−1) was recorded in the S0N90 treatment, and it was lower by 9.11% than the average SOC content of the trial. In the control S0N0 and in the S0N150 treatment, SOC content was at the level of absolute control and was lower by 5.87% and 5.75%, respectively, compared to the average value of the trial. The average SOC content of all N-fertilization variants in the S1 treatment was 13.930 g kg−1, which was higher by 2.96% compared to the trial average. In contrast, the SOC content of all three N-variants in the S0 treatment was 12.594 g kg−1 and was lower by 6.91% compared to the trial average (Table 4). Comparing the average SOC content of the S1 and S0 treatments, a significant difference of 1.336 g kg−1 (10.61%) was obtained in favor of SI. However, if absolute control is excluded from the analysis (due to the existence of S1N0 control), the overall results show that long-term straw return significantly increased the SOC content by an average of 1.513 g kg−1, i.e., by 12.02% compared to straw removal.
A more realistic consideration of the relationship between treatments with and without straw return is possible by observing comparable N-variants of the S1 and S0 treatments, as shown in Figure 7. The SOC content was significantly higher (p ≤ 0.05) in the treatment with straw return compared to straw removal, regardless of the applied N-doses. Thus, in the control treatment S1N0, the SOC content was higher by 0.500 g kg−1 (i.e., by 3.93%) compared to the S0N0 control. The S1N90 treatment achieved a higher SOC value by 1.868 g kg−1 (15.19%) compared to S0N90, while at the highest N-dose, the SOC content in the treatment S1N150 was higher by 1.898 g kg−1 (i.e., by 14.89%) compared to S0N150. On average, for all three N-variants, the SOC content in the S1 treatment was 14.016 g kg−1, and was significantly higher than the SOC content of the S0 treatment (12.594 g kg−1). Consequently, by observing only comparable N-variants of both main treatments, long-term straw return significantly increased SOC content at a soil depth of 0–30 cm by an average of 1.422 g kg−1, i.e., by 11.29% relative to straw removal.
Straw return is widely recognized as a practice that largely increases C input and contributes to SOC sequestration, improving soil fertility and crop productivity in the long term. Our results showed that straw return combined with N-fertilization significantly enhanced SOC content in the trial by an average of 11.29%. Previous studies have also shown that a long-term combination of straw return and inorganic fertilizers can promote the accumulation of SOC and its higher contents compared to fertilizer-only or no-fertilization treatments [19,71,72]. According to Zhang et al. [19], increases in SOC content were directly influenced by straw incorporation (SI). Based on a long-term (30 years) field experiment with different fertilization rates and straw management, the authors reported that SOC content in treatments combining straw return and inorganic fertilizers was higher than those with the same level of fertilizers without SI.
Several previous studies have reported an increase in SOC similar to that found in this study. In a meta-analysis conducted by Wang et al. [50] across 45 long-term trials, the effects of straw return on SOC and TN were not significantly affected by land use type or cropping system but positively and linearly related to the inputs of straw-C and -N. The authors found that continuous straw return significantly increased SOC and TN stocks by an average of 10.1% and 11.0%, respectively, relative to straw removal. Comparing their results with several previous meta-analyses of global data and observations from Australia, China, Europe, and North America, the authors reported that the overall increase in SOC and TN following straw return was within narrow ranges of 7.0–13.3% and 8.8–14.8%, respectively. Analyzing the effects of straw return on soil properties and their relationships with crop yield in the wheat-maize cropping system, [11] found that straw return increased the SOC content by 11.4% (in the mono-) and 12.5% (in the double-cropping system) relative to straw removal. In a meta-analysis by Liu et al. [37], straw return significantly increased SOC concentration by an average of 12.8%. Wang et al. [41] found that straw returning significantly increased the SOC content by an average of about 14% and that increased effects were more pronounced in areas with loamy or sandy soils and in soils with initial SOC content less than 10 g kg−1.
In certain studies, significantly higher rates of SOC content increase were observed compared to our findings. For example, Li et al. [24] reported that, compared to the control (without SI) and conventional SI treatments, ammoniated straw incorporation significantly increased SOC content by an average of 17.2% and 14.2%, and TN content by 27.3% and 18.3% in 0–10 cm depth, and it significantly increased SOC by 19.2% and 12.4%, and TN content by 27.8% and 19.4% in 10–20 cm depth, respectively. In an eight-year experiment conducted by Shi et al. [23] in a wheat-maize rotation, the SOC stock was found to be increased the most (by 34.1%) in the no-tillage and straw return combination compared to the initial soil. However, some studies have reported lower increases in SOC content. For instance, a study by [18] in a maize-soybean rotation system showed that by combining consecutive returning of crop residues and chemical fertilizers in alternate years, the bulk SOC at a depth of 0–20 cm increased by 6.23%. Additionally, Lehtinen et al. [70] reported that the incorporation of crop residue increased the SOC concentration on average by 7% in European agricultural soils. The results of multi-year field experiments conducted on the chernozem of Vojvodina showed that the long-term application of mineral fertilizers did not affect the increase in SOC stocks compared to the unfertilized plot [48]. However, a combination of fertilizers with harvest residues increased the content and sequestered more SOC in the 0–30 cm soil layer than in the control plot.
A correlation analysis was performed using Pearson’s correlation to examine the relationship between the measured soil chemical parameters in different SN treatments and the corresponding grain yields (Table 5). Correlations between all parameters of soil fertility and GY were positive, although not statistically significant in all cases. The humus content had the highest positive correlation with GY (r = 0.82, n = 40). Additionally, high correlation coefficients were determined between TN and SOC content, and yield (r = 0.64 and 0.63, respectively), while smaller but still significant correlations were obtained between the contents of AP and AK, and GY (r = 0.43 and 0.33, respectively). The soil pH and CaCO3 content had no significant correlative dependencies with the GY.
Correlations between soil chemical parameters were positive in most cases. The highest positive correlations were obtained between humus and TN content (r = 0.79), as well as between humus and SOC, and TN and SOC contents (r = 0.62 and 0.69, respectively). Additionally, there were positive correlations between the contents of AP and AK on one hand and SOC, humus, and TN contents on the other. Only one significant negative correlation (r = −0.51) was observed between CaCO3 and AP content.
Generally, the increase in wheat GY observed under straw return in the trial was closely related to the improvement of humus, TN, and SOC, followed by nutrient contents (AP and AK). These findings are consistent with those of Islam et al. [11], as well as studies by [34,37,50], which reported that increases in crop yields after straw return are directly associated with enhancements in SOC content, additional nutrient inputs, and improvements in soil physico-chemical properties. The SOC, an essential indicator of soil fertility and function, is closely related to crop yield and land productivity [19]. The findings of Li et al. [24] suggest that it is possible to achieve a higher wheat GY and greater stability with an increase in SOC and TN contents by optimizing straw management strategies. In a meta-analysis by [11], linear regression analysis showed a significantly positive correlation between the enhancement of crop yield and the SOC content. The authors hypothesize that this is because higher SOC improves soil structure, water-holding properties, and the contents of essential macro and micronutrients, resulting in improved crop growth and yield. Furthermore, in their study, GY was positively correlated with both soil available (AN, AP, AK) and total (TN, TP, and TK) nutrients. The input of straw-N was significantly related to net yield increases [50]. Moreover, the net difference in SOC was positively correlated with yield increases and explained 8.7% of their variability. Based on the results of a long-term (22-year) field experiment in a continuous cropping system of winter wheat and maize, Yang et al. [72] found that SOC increased significantly with the combined application of inorganic fertilizers and crop residues. Their results showed that winter wheat yield had a significant correlation with SOC (r = 0.55, n = 240). Lehtinen et al. [70] did not find significant correlations between the SOC content and crop yields over 10 environmental zones in Europe. However, they concluded that incorporation of crop residues can be a sustainable management practice to maintain SOC levels and increase soil fertility.
In the present study, we found that long-term straw returning significantly increased the humus, TN, and SOC contents and that the increase in wheat GY was mostly related to the improvement of these variables. The most optimal values of humus, TN, and SOC contents were achieved in the treatment with continuous straw return combined with the application of 90 to 120 kg of N ha−1. Additionally, compared to the initial state of soil fertility, after 50 years since the trial was established, straw return resulted in a considerable increase in humus up to the S1N90 and TN content up to the S1N120 treatment. Therefore, it can be observed that long-term straw return, to some extent, led to stagnation in the increase of these soil quality indicators. This may be due to the potential saturation of the fertility of the analyzed soil type, which probably occurred in the much earlier period, i.e., during the first 10–20 years [37,42,50]. This suggests that the capacity of chernozem has reached its limit and that the soil is sufficiently saturated by the organic matter input, providing a basis for future research regarding the quantification of the amount of crop residues. Therefore, the next focus of our research should be based on determining the appropriate ratio of the amount and quality of crop residues to fertilization rates for balanced soil productivity and high and stable crop yields through the sustainable use of resources. Any unused straw can be used for other purposes, which may improve the utilization efficiency of straw resources. Additionally, a limitation of this study is that we did not analyze the complex interactions between the incorporated straw and fertilization and various soil physical properties (bulk density, total porosity, water-holding capacity, etc.), as well as diverse farming management practices, which would greatly benefit the development of proper straw management strategies. Our future research will be directed towards this aspect.

4. Conclusions

Continuous straw return combined with adequate application of nitrogen fertilizer proved to be an effective strategy for increasing wheat grain yield (GY) and improving soil chemical properties in the winter wheat-maize-soybean crop rotation system on chernozem. Overall results showed that long-term straw returning (S1) significantly increased GY and resulted in greater yield stability compared to straw removal (S0) during a 20-year study period. The S1N150 treatment proved to be the most optimal, while straw return without N fertilization significantly reduced yield. Long-term return of crop residues significantly increased the humus and total nitrogen (TN) content in the 0–30 cm soil layer, while they slightly decreased in the straw removal treatment. Additionally, all S1 treatments showed a significantly higher soil organic carbon (SOC) content compared to S0. In general, straw returning combined with the application of mineral fertilizers could be a sustainable soil management strategy that is economically viable and environmentally acceptable. This practice has the potential to promote sustainable wheat production under conditions similar to those in the present study. However, further research is needed to determine its interactive effects on both grain yield and soil productivity.

Supplementary Materials

The following supporting information can be downloaded at: https://www.mdpi.com/article/10.3390/agronomy13061529/s1, Table S1: Annual values of meteorological parameters in the vegetation period of winter wheat (October–June) during the long-term field experiment (1995/96–2019/20). Meteorological station Rimski šančevi (φ 45°20′ N, λ 19°51′ E, altitude 84 m); Table S2: Analyzed varieties, year of release, representation of wheat varieties in the trial, and number of tested varieties by year (1995/96–2019/20); Table S3: The sequence of crop changes in crop rotation at the “ISDV” trial by years, during the research period (1995/96–2019/20); Table S4: Analysis of variance for wheat grain yield under different years (Y), straw management and N-fertilization treatments (SN), and varieties (V).

Author Contributions

Conceptualization, G.J. and V.A.; methodology, G.J., V.A. and L.B.; software, G.J. and D.D.; validation, G.J., V.A. and M.M.; formal analysis, G.J., L.B. and D.D.; investigation, G.J., V.A., M.M. and L.B.; resources, V.A. and M.M.; data curation, V.A. and G.J.; writing—original draft preparation, G.J. and V.A.; writing—review and editing, V.A., S.Š. and S.V.; visualization, G.J. and D.D.; supervision, M.M., S.Š. and S.V.; project administration, M.M. and G.J. All authors have read and agreed to the published version of the manuscript.

Funding

This research was funded by the Ministry of Education, Science and Technological Development of the Republic of Serbia, grant numbers 451-03-47/2023-01/200117 (G.J., S.V. and S.Š.) and 451-03-47/2023-01/200032 (V.A., M.M., Lj.B. and D.D.); and Provincial Secretariat for Higher Education and Scientific Research of the Autonomous Province of Vojvodina, Republic of Serbia, grant number 142-451-3152/2022-01/2 (M.M., V.A. and G.J.).

Data Availability Statement

Not applicable.

Acknowledgments

Authors want to thank Institute of Field and Vegetable Crops in Novi Sad—the National Institute of the Republic of Serbia, and Faculty of Agriculture, University of Novi Sad, for providing laboratory and field trial support.

Conflicts of Interest

The authors declare no conflict of interest.

References

  1. Le Campion, A.; Oury, F.X.; Heumez, E.; Rolland, B. Conventional versus organic farming systems: Dissecting comparisons to improve cereal organic breeding strategies. Org. Agric. 2020, 10, 63–74. [Google Scholar] [CrossRef]
  2. Fu, B.; Chen, L.; Huang, H.; Qu, P.; Wei, Z. Impacts of crop residues on soil health: A review. Environ. Pollut. Bioavailab. 2021, 33, 164–173. [Google Scholar] [CrossRef]
  3. Poudel, D.D.; Horwath, W.R.; Lanini, W.T.; Temple, S.R.; van Bruggen, A.H.C. Comparison of soil N availability and leaching potential, crop yields and weeds in organic, low-input and conventional farming systems in northern California. Agric. Ecosyst. Environ. 2002, 90, 125–137. [Google Scholar] [CrossRef]
  4. STAT.YEARB.SERB. Statistical Yearbook of the Republic of Serbia; Statistical Office of the Republic of Serbia: Belgrade, Serbia, 2021. Available online: www.stat.gov.rs (accessed on 12 March 2022).
  5. Kastori, R.; Maksimović, I.; Putnik, D.M. Environmental aspects of burning field residues for use as an alternative fuel. Field Veg. Crop Res. 2012, 49, 313–319. [Google Scholar] [CrossRef]
  6. Jin, Z.; Shah, T.; Zhang, L.; Liu, H.; Peng, S.; Nie, L. Effect of straw returning on soil organic carbon in rice–wheat rotation system: A review. Food Energy Secur. 2020, 9, e200. [Google Scholar] [CrossRef]
  7. Cui, H.; Luo, Y.; Chen, J.; Jin, M.; Li, Y.; Wang, Z. Straw return strategies to improve soil properties and crop productivity in a winter wheat-summer maize cropping system. Eur. J. Agron. 2022, 133, 126436. [Google Scholar] [CrossRef]
  8. Li, H.; Dai, M.; Dai, S.; Dong, X. Current status and environment impact of direct straw return in China’s cropland—A review. Ecotoxicol. Environ. Saf. 2018, 159, 293–300. [Google Scholar] [CrossRef]
  9. Bellamy, P.H.; Loveland, P.J.; Bradley, R.I.; Lark, R.M.; Kirk, G.J.D. Carbon losses from all soils across England and Wales 1978–2003. Nature 2005, 437, 245–248. [Google Scholar] [CrossRef]
  10. Lal, R. Soil carbon dynamics in cropland and rangeland. Environ. Pollut. 2002, 116, 353–362. [Google Scholar] [CrossRef]
  11. Islam, M.U.I.; Guo, Z.; Jiang, F.; Peng, X. Does straw return increase crop yield in the wheat-maize cropping system in China? A meta-analysis. Field Crop. Res. 2022, 279, 108447. [Google Scholar] [CrossRef]
  12. Jaćimović, G.; Aćin, V.; Mirosavljević, M.; Crnobarac, J.; Marinković, B.; Latković, D. Long-term effects of straw incorporation and increasing doses of nitrogen on the wheat yield. In Proceedings of the VII International Scientific Agricultural Symposium “Agrosym 2016”, Jahorina, Bosnia and Herzegovina, 6–9 October 2016; pp. 644–649. Available online: http://agrosym.ues.rs.ba/archive (accessed on 20 September 2021).
  13. Bogdanović, D.; Ubavić, M.; Dozet, D. Chemical properties of Vojvodina soils and the supply of essential macro nutrients. In Heavy Metals and Pesticides in Soils; Kastori, R., Ed.; University of Novi Sad, Faculty of Agriculture and Institute of Field and Vegetable Crops: Novi Sad, Serbia, 1993; pp. 197–215. (In Serbian) [Google Scholar]
  14. Sekulić, P.; Ninkov, J.; Hristov, N.; Vasin, J.; Šeremešić, S.; Zeremski-Škorić, T. Organic Matter Content in Vojvodina Soils and the Possibility of Using Harvest Residues as Renewable Source of Energy. Field Veg. Crop Res. 2010, 47, 591–598, (Serbian article with English abstract). Available online: https://fiver.ifvcns.rs/handle/123456789/876 (accessed on 25 March 2022).
  15. Ličina, V.; Nešić, L.J.; Belić, M.; Hadžić, V.; Sekulić, P.; Vasin, J.; Ninkov, J. The Soils of Serbia and Their Degradation. Field Veg. Crop Res. 2011, 48, 285–290. [Google Scholar] [CrossRef]
  16. Šeremešić, S.; Ćirić, V.; Djalović, I.; Vasin, J.; Zeremski, T.; Siddique, K.H.; Farooq, M. Long-term winter wheat cropping influenced soil organic carbon pools in different aggregate fractions of Chernozem soil. Arch. Agron. Soil Sci. 2020, 66, 2055–2066. [Google Scholar] [CrossRef]
  17. Li, J.; Gan, G.; Chen, X.; Zou, J. Effects of Long-Term Straw Management and Potassium Fertilization on Crop Yield, Soil Properties, and Microbial Community in a Rice–Oilseed Rape Rotation. Agriculture 2021, 11, 1233. [Google Scholar] [CrossRef]
  18. Xiao, Y.; Zhou, M.; Li, Y.; Zhang, X.; Wang, G.; Jin, J.; Ding, G.; Zeng, X.; Liu, X. Crop Residue Return Rather Than Organic Manure Increases Soil Aggregate Stability under Corn–Soybean Rotation in Surface Mollisols. Agriculture 2022, 12, 265. [Google Scholar] [CrossRef]
  19. Zhang, J.; Hu, K.; Li, K.; Zheng, C.; Li, B. Simulating the effects of long-term discontinuous and continuous fertilization with straw return on crop yields and soil organic carbon dynamics using the DNDC model. Soil Tillage Res. 2017, 165, 302–314. [Google Scholar] [CrossRef]
  20. Wang, X.; Jia, Z.; Liang, L.; Zhao, Y.; Yang, B.; Ding, R.; Wang, J.; Nie, J. Changes in soil characteristics and maize yield under straw returning system in dryland farming. Field Crop. Res. 2018, 218, 11–17. [Google Scholar] [CrossRef]
  21. Zhao, X.; Liu, B.; Liu, S.; Qi, J.; Wang, X.; Pu, C.; Li, S.; Zhang, X.; Yang, X.; Lal, R.; et al. Sustaining crop production in China’s cropland by crop residue retention: A meta-analysis. Land Degrad. Dev. 2020, 31, 694–709. [Google Scholar] [CrossRef]
  22. Sui, P.; Tian, P.; Lian, H.; Wang, Z.; Ma, Z.; Qi, H.; Mei, N.; Sun, Y.; Wang, Y.; Su, Y.; et al. Straw Incorporation Management Affects Maize Grain Yield through Regulating Nitrogen Uptake, Water Use Efficiency, and Root Distribution. Agronomy 2020, 10, 324. [Google Scholar] [CrossRef]
  23. Shi, J.; Wang, S.; Li, S.; Tian, X. Increasing soil organic carbon sequestration and yield stability by no-tillage and straw-returning in wheat–maize rotation. Agron. J. 2022, 114, 1534–1545. [Google Scholar] [CrossRef]
  24. Li, Y.; Feng, H.; Dong, Q.; Xia, L.; Li, J.; Li, C.; Zang, H.; Andersen, M.N.; Olesen, J.E.; Jørgensen, U.; et al. Ammoniated straw incorporation increases wheat yield, yield stability, soil organic carbon and soil total nitrogen content. Field Crop. Res. 2022, 284, 108558. [Google Scholar] [CrossRef]
  25. Macholdt, J.; Piepho, H.P.; Honermeier, B.; Perryman, S.; Macdonald, A.; Poulton, P. The effects of cropping sequence, fertilization and straw management on the yield stability of winter wheat (1986–2017) in the Broadbalk Wheat Experiment, Rothamsted, UK. J. Agric. Sci. 2020, 158, 65–79. [Google Scholar] [CrossRef]
  26. Jaćimović, G.; Aćin, V.; Crnobarac, J.; Latković, D.; Manojlović, M. Effects of crop residue incorporation on the wheat yield in a long-term experiment. Ann. Agron. 2017, 41, 1–8, (Serbian article with English abstract). [Google Scholar]
  27. Latković, D.; Crnobarac, J.; Jaćimović, G.; Visković, J.; Dunđerski, D. The importance of harvest residues in corn production. Zemlj. I Biljka/Soil Plant 2019, 68, 33–43. [Google Scholar] [CrossRef]
  28. Htun, Y.M.; Tong, Y.; Gao, P.; Xiaotang, J. Coupled Effects of Straw and Nitrogen Management on N2O and CH4 Emissions of Rainfed Agriculture in Northwest China. Atmos. Environ. 2017, 157, 156–166. [Google Scholar] [CrossRef]
  29. Gao, L.; Li, W.; Ashraf, U.; Lu, W.; Li, Y.; Li, C.; Li, G.; Li, G.; Hu, J. Nitrogen Fertilizer Management and Maize Straw Return Modulate Yield and Nitrogen Balance in Sweet Corn. Agronomy 2020, 10, 362. [Google Scholar] [CrossRef]
  30. Bentsen, N.S.; Felby, C.; Thorsen, B.J. Agricultural residue production and potentials for energy and materials services. Prog. Energy Combust. Sci. 2014, 40, 59–73. [Google Scholar] [CrossRef]
  31. Wang, X.; Yang, Z.; Liu, X.; Huang, G.; Xiao, W.; Han, L. The composition characteristics of different crop straw types and their multivariate analysis and comparison. Waste Manag. 2020, 110, 87–97. [Google Scholar] [CrossRef]
  32. Zhao, Y.; Chen, Y.; Dai, H.; Cui, J.; Wang, L.; Sui, P. Effects of Organic Amendments on the Improvement of Soil Nutrients and Crop Yield in Sandy Soils during a 4-Year Field Experiment in Huang-Huai-Hai Plain, Northern China. Agronomy 2021, 11, 157. [Google Scholar] [CrossRef]
  33. Zhao, S.; Li, K.; Zhou, W.; Qiu, S.; Huang, S.; He, P. Changes in soil microbial community, enzyme activities and organic matter fractions under long-term straw return in north-central China. Agric. Ecosyst. Environ. 2016, 216, 82–88. [Google Scholar] [CrossRef]
  34. Guan, X.K.; Wei, L.; Turner, N.C.; Ma, S.C.; Yang, M.D.; Wang, T.C. Improved straw management practices promote in situ straw decomposition and nutrient release, and increase crop production. J. Clean. Prod. 2020, 250, 119514. [Google Scholar] [CrossRef]
  35. Srour, A.Y.; Ammar, H.A.; Subedi, A.; Pimentel, M.; Cook, R.L.; Bond, J.; Fakhoury, A.M. Microbial Communities Associated with Long-Term Tillage and Fertility Treatments in a Corn-Soybean Cropping System. Front. Microbiol. 2020, 11, 18. [Google Scholar] [CrossRef]
  36. Liu, N.; Li, Y.; Cong, P.; Wang, J.; Guo, W.; Pang, H.; Zhang, L. Depth of straw incorporation significantly alters crop yield, soil organic carbon and total nitrogen in the North China Plain. Soil Tillage Res. 2021, 205, 104772. [Google Scholar] [CrossRef]
  37. Liu, C.; Lu, M.; Cui, J.; Li, B.; Fang, C. Effects of straw carbon input on carbon dynamics in agricultural soils: A meta-analysis. Glob. Chang. Biol. 2014, 20, 1366–1381. [Google Scholar] [CrossRef]
  38. Qi, G.; Kang, Y.; Yin, M.; Ma, Y.; Bai, Y.; Wang, J. Yield Responses of Wheat to Crop Residue Returning in China: A Meta-Analysis. Crop Sci. 2019, 59, 2185–2200. [Google Scholar] [CrossRef]
  39. Liu, P.; He, J.; Li, H.; Wang, Q.; Lu, C.; Zheng, K.; Liu, W.; Zhao, H.; Lou, S. Effect of Straw Retention on Crop Yield, Soil Properties, Water Use Efficiency and Greenhouse Gas Emission in China: A Meta-Analysis. Int. J. Plant Prod. 2019, 13, 347–367. [Google Scholar] [CrossRef]
  40. Lu, X. A meta-analysis of the effects of crop residue return on crop yields and water use efficiency. PLoS ONE 2020, 15, e0231740. [Google Scholar] [CrossRef]
  41. Wang, Y.; Wu, P.; Mei, F.; Ling, Y.; Qiao, Y.; Liu, C.; Leghari, S.J.; Guan, X.; Wang, T. Does continuous straw returning keep China farmland soil organic carbon continued increase? A meta-analysis. J. Environ. Manag. 2021, 288, 112391. [Google Scholar] [CrossRef]
  42. Lou, Y.; Xu, M.; Wang, W.; Sun, X.; Zhao, K. Return rate of straw residue affects soil organic C sequestration by chemical fertilization. Soil Tillage Res. 2011, 113, 70–73. [Google Scholar] [CrossRef]
  43. Wang, X.; Wu, H.; Dai, K.; Zhang, D.; Feng, Z.; Zhao, Q.; Wu, X.; Jin, K.; Cai, D.; Oenema, O.; et al. Tillage and crop residue effects on rainfed wheat and maize production in northern China. Field Crop. Res. 2012, 132, 106–116. [Google Scholar] [CrossRef]
  44. Zhang, X.; Xu, M.; Sun, N.; Xiong, W.; Huang, S.; Wu, L. Modelling and predicting crop yield, soil carbon and nitrogen stocks under climate change scenarios with fertiliser management in the North China Plain. Geoderma 2016, 265, 176–186. [Google Scholar] [CrossRef]
  45. Hijbeek, R.; Pronk, A.A.; van Ittersum, M.K.; Verhagen, A.; Ruysschaert, G.; Bijttebier, J.; Zavattaro, L.; Bechini, L.; Schlatter, N.; ten Berge, H.F.M. Use of organic inputs by arable farmers in six agro-ecological zones across Europe: Drivers and barriers. Agric. Ecosyst. Environ. 2019, 275, 42–53. [Google Scholar] [CrossRef]
  46. Zhao, X.; Yuan, G.; Wang, H.; Lu, D.; Chen, X.; Zhou, J. Effects of Full Straw Incorporation on Soil Fertility and Crop Yield in Rice-Wheat Rotation for Silty Clay Loamy Cropland. Agronomy 2019, 9, 133. [Google Scholar] [CrossRef]
  47. Seremesic, S.; Ćirić, V.; Milošev, D.; Vasin, J.; Djalovic, I. Changes in soil carbon stock under the wheat-based cropping systems at Vojvodina province of Serbia. Arch. Agron. Soil Sci. 2016, 63, 388–402. [Google Scholar] [CrossRef]
  48. Manojlović, M.; Aćin, V.; Šeremešić, S. Long-term effects of agronomic practices on the soil organic carbon sequestration in Chernozem. Arch. Agron. Soil Sci. 2008, 54, 353–367. [Google Scholar] [CrossRef]
  49. Lian, H.; Wang, Z.; Li, Y.; Xu, H.; Zhang, H.; Gong, X.; Qi, H.; Jiang, Y. Straw Strip Return Increases Soil Organic Carbon Sequestration by Optimizing Organic and Humus Carbon in Aggregates of Mollisols in Northeast China. Agronomy 2022, 12, 784. [Google Scholar] [CrossRef]
  50. Wang, J.; Wang, X.; Xu, M.; Feng, G.; Zhang, W.; Lu, C. Crop yield and soil organic matter after long-term straw return to soil in China. Nutr. Cycl. Agroecosyst. 2015, 102, 371–381. [Google Scholar] [CrossRef]
  51. Dolan, M.S.; Clapp, C.E.; Allmaras, R.R.; Baker, J.M.; Molina, J.A.E. Soil organic carbon and nitrogen in a Minnesota soil as related to tillage, residue and nitrogen management. Soil Tillage Res. 2006, 89, 221–231. [Google Scholar] [CrossRef]
  52. Lal, R. Soil health and carbon management. Food Energy Secur. 2016, 5, 212–222. [Google Scholar] [CrossRef]
  53. Yuan, G.; Huan, W.; Song, H.; Lu, D.; Chen, X.; Wang, H.; Zhou, J. Effects of straw incorporation and potassium fertilizer on crop yields, soil organic carbon, and active carbon in the rice–wheat system. Soil Tillage Res. 2021, 209, 104958. [Google Scholar] [CrossRef]
  54. Powlson, D.S.; Glendining, M.J.; Coleman, K.; Whitmore, A.P. Implications for Soil Properties of Removing Cereal Straw: Results from Long-Term Studies. Agron. J. 2011, 103, 279–287. [Google Scholar] [CrossRef]
  55. Tian, P.; Sui, P.; Lian, H.; Wang, Z.; Meng, G.; Sun, Y.; Wang, Y.; Su, Y.; Ma, Z.; Qi, H.; et al. Maize Straw Returning Approaches Affected Straw Decomposition and Soil Carbon and Nitrogen Storage in Northeast China. Agronomy 2019, 9, 818. [Google Scholar] [CrossRef]
  56. Suriyagoda, L.; De Costa, W.A.J.M.; Lambers, H. Growth and phosphorus nutrition of rice when inorganic fertiliser application is partly replaced by straw under varying moisture availability in sandy and clay soils. Plant Soil 2014, 384, 53–68. [Google Scholar] [CrossRef]
  57. Akhtar, K.; Wang, W.; Ren, G.; Khan, A.; Feng, Y.; Yang, G.; Wang, H. Integrated use of straw mulch with nitrogen fertilizer improves soil functionality and soybean production. Environ. Int. 2019, 132, 105092. [Google Scholar] [CrossRef]
  58. Yang, C.; Yang, L.; Yang, Y.; Ouyang, Z. Rice root growth and nutrient uptake as influenced by organic manure in continuously and alternately flooded paddy soils. Agric. Water Manag. 2004, 70, 67–81. [Google Scholar] [CrossRef]
  59. Yu, C.; Xie, X.; Yang, H.; Yang, L.; Li, W.; Wu, K.; Zhang, W.; Feng, C.; Li, D.; Wu, Z.; et al. Effect of straw and inhibitors on the fate of nitrogen applied to paddy soil. Sci. Rep. 2020, 10, 21582. [Google Scholar] [CrossRef]
  60. Vidojević, D. (Ed.) The State of Soil in the Republic of Serbia 2018–2019; Ministry of Agriculture and Environmental Protection—Environmental Protection Agency: Belgrade, Republic of Serbia, 2020; ISSN 2466–2968.
  61. Benka, P.; Ćirić, V. Conversion Legend of Soil Map of Vojvodina (Serbia) to WRB Classification, Abstract book. In Proceedings of the International Conference “Global Soil Map 2017”, Moscow, Russia, 4–6 July 2017. [Google Scholar]
  62. Pavlović, P.; Kostić, N.; Karadžić, B.; Mitrović, M. The Soils of Serbia. In International Union of Soil Sciences; World Soils Book Series; Hartemink, A.E., Ed.; Springer: Dordrecht, The Netherlands, 2017. [Google Scholar] [CrossRef]
  63. IUSS Working Group WRB. World Reference Base for Soil Resources 2014, update 2015. In International Soil Classification System for Naming Soils and Creating Legends for Soil Maps; World Soil Resources Reports No. 106; FAO: Rome, Italy, 2015. [Google Scholar]
  64. Malešević, M. Importance of Temperature and Precipitations for Determining the Optimal Amount of Nitrogen and Their Influence on the Yield of Winter Wheat (Triticum aestivum L.). Ph.D. Thesis, University of Novi Sad, Novi Sad, Serbia, 1989. (In Serbian, with English abstract). [Google Scholar]
  65. Republic Hydrometeorolgical Service of Serbia (RHSS). Available online: https://www.hidmet.gov.rs/index_eng.php (accessed on 25 March 2022).
  66. Bruin, P. The Expansion of Soil Fertility Research in Relation to Its Importance for the Improvement of Farming Practice; Institute of Soil Fertility: Haren/Groningen, The Netherlands, 1974; pp. 1–20.
  67. Kanwar, J.S. Bulletin of the International Society of Soil Science; No. 56, 1979/2; International Society of Soil Science, Duivendaal: Wageningen, The Netherlands, 1979; pp. 1–68. [Google Scholar]
  68. ISO/IEC 17025:2017; General Requirements for the Competence of Testing and Calibration Laboratories. Institute for Standardization of Serbia: Belgrade, Serbia, 2017.
  69. Mirosavljević, M.; Momčilović, V.; Živančev, D.; Aćin, V.; Jocković, B.; Mikić, S.; Takač, V.; Denčić, S. Genetic improvement of grain yield and bread-making quality of winter wheat over the past 90 years under the Pannonian Plain conditions. Euphytica 2020, 216, 184. [Google Scholar] [CrossRef]
  70. Lehtinen, T.; Schlatter, N.; Baumgarten, A.; Bechini, L.; Krüger, J.; Grignani, C.; Zavattaro, L.; Costamagna, C.; Spiegel, H. Effect of crop residue incorporation on soil organic carbon and greenhouse gas emissions in European agricultural soils. Soil Use Manag. 2014, 30, 524–538. [Google Scholar] [CrossRef]
  71. Zhao, H.; Sun, B.; Lu, F.; Zhang, G.; Wang, X.; Ouyang, Z. Straw Incorporation Strategy on Cereal Crop Yield in China. Crop Sci. 2015, 55, 1773–1781. [Google Scholar] [CrossRef]
  72. Yang, Z.C.; Zhao, N.; Huang, F.; Lv, Y.Z. Long-term effects of different organic and inorganic fertilizer treatments on soil organic carbon sequestration and crop yields on the North China Plain. Soil Tillage Res. 2015, 146, 47–52. [Google Scholar] [CrossRef]
  73. Jakšić, S.; Ninkov, J.; Milić, S.; Vasin, J.; Banjac, D.; Jakšić, D.; Živanov, M. The State of Soil Organic Carbon in Vineyards as Affected by Soil Types and Fertilization Strategies (Tri Morave Region, Serbia). Agronomy 2021, 11, 9. [Google Scholar] [CrossRef]
Figure 1. (a) Map of Serbia and Vojvodina (northern Province, southern part of the Pannonian Basin) showing the humus content in the soil, (b) WRB Map of the soil of Vojvodina with visible dominance of chernozem (Sources: (a) [60], (b) [61]).
Agronomy 13 01529 g001
Figure 2. Location of the long-term “ISDV” field trial and its design.
Agronomy 13 01529 g002
Figure 3. Experimental plots, harvesting, and straw distribution in treatment with straw return.
Agronomy 13 01529 g003
Figure 4. Wheat grain and straw yield in the trial during the analyzed period (on average, for 10 SN treatments and 20 varieties). Vertical bars on columns represent LSD values (Fisher’s LSD test, p ≤ 0.05) and indicate significant differences between years. * Indicates a significant yield trend (α = 0.05, n = 20), ns Indicates a non-significant trend.
Agronomy 13 01529 g004
Figure 5. Average wheat yields in the trial by: (a) Years, (b) SN-treatments. Different letters indicate significant differences in mean GY between years (a) and SN-treatments (b), respectively (p ≤ 0.05).
Agronomy 13 01529 g005
Figure 6. Average wheat yields by SN-treatments—comparison of: (a) All treatments, (b) only comparable treatments of the trial. Vertical bars on columns represent LSD values. Different letters indicate significant differences between treatments (Fisher’s LSD test, p ≤ 0.05).
Agronomy 13 01529 g006
Figure 7. SOC content in comparable SN treatments of the trial. Vertical bars on columns represent LSD values. Different letters indicate significant differences between treatments (LSD test, p ≤ 0.05).
Agronomy 13 01529 g007
Table 1. Basic properties of chernozem before conducting ISDV experiment [64].
Soil Chemical Properties
Depth
(cm)
pHCaCO3
(vol. %)
Humus
(mas. %)
Total N
(mas. %)
AL-P2O5AL-K2O
in KClin H2O(mg 100 g−1 of soil)
0–357.007.352.13.140.18413.219.5
35–707.207.404.52.900.1799.720.0
70–957.407.808.51.880.1083.813.5
>957.407.9127.91.060.0803.89.0
Soil Texture
0–35Rough sand (%)
(2–0.2 mm)
Fine sand (%)
(0.2–0.02 mm)
Silt (%)
(0.02–0.002 mm)
Clay (%)
(<0.002 mm)
Texture class
0.8736.1532.0730.91Loamy clay
Table 2. Description of straw management treatments and mineral fertilizer application in winter wheat during the analyzed period.
SN-TreatmentsApplication of:
Straw
(S)
Nitrogen
(N)
SNDefinitionN 1P2O5,
K2O 2
S1
With
straw
return
N00S1N00Absolute control—plot with straw return, without N-fertilization, and without the addition of N for decomposition of crop residues.80 + 80
kg ha−1

l/2
before
plowing
in autumn
+
1/2
prior to
sowing
N0S1N0Control plot—with straw return, without N-fertilization + additional 10 kg of N from mineral fertilizer per 1 t of straw to prevent N-depression.
N60S1N6060 kg N ha−1 applied in combination with straw return
+ additional 10 kg of N from mineral fertilizer per 1 t of straw.
1/2
before
plowing
in autumn
+
1/2
as one
top-dress
application
in spring
N90S1N9090 kg N ha−1 applied in combination with straw return
+ additional 10 kg of N from mineral fertilizer per 1 t of straw.
N120S1N120120 kg N ha−1 applied in combination with straw return
+ additional 10 kg of N from mineral fertilizer per 1 t of straw.
N150S1N150150 kg N ha−1 applied in combination with straw return
+ additional 10 kg of N from mineral fertilizer per 1 t of straw.
N180S1N180180 kg N ha−1 applied in combination with straw return
+ additional 10 kg of N from mineral fertilizer per 1 t of straw.
S0
Without
straw
return
N0S0N0Control plot—without straw return and N-fertilization.
N90S0N9090 kg N ha−1 without straw return.Same as
in S1
N150S0N150150 kg N ha−1 without straw return.
1 CAN (27% N), 2 Superphosphate (18% P2O5) and Potassium salt (40% K2O).
Table 3. Wheat yields (t ha−1) and variability indicators in the combined application of straw management and N fertilization (SN) over 20 years.
Year
(Y)
SN-Treatments *Average
(Y) **
S1—With Straw ReturnS0—Without Straw Return
S1N00S1N0S1N60S1N90S1N120S1N150S1N180S0N0S0N90S0N150
1995/962.08 ± 0.05 g2.89 ± 0.31 e5.07 ± 0.37 d5.59 ± 0.15 bc5.79 ± 0.12 ab5.84 ± 0.13 ab6.06 ± 0.09 a2.56 ± 0.15 f4.95 ± 0.13 d5.44 ± 0.16 c4.63 ± 1.51 J
1996/973.15 ± 0.16 f3.43 ± 0.12 f4.82 ± 0.20 e5.24 ± 0.18 d5.66 ± 0.14 c5.97 ± 0.20 b6.32 ± 0.26 a3.29 ± 0.26 f5.18 ± 0.22 d5.84 ± 0.20 bc4.89 ± 1.19 I
1997/982.74 ± 0.09 e3.34 ± 0.39 d5.90 ± 0.24 c6.61 ± 0.29 b6.97 ± 0.21 b7.42 ± 0.31 a7.46 ± 0.29 a3.25 ± 0.58 d6.01 ± 0.32 c6.95 ± 0.27 b5.66 ± 1.84 F
1999/004.05 ± 0.50 d4.40 ± 0.16 d6.52 ± 0.13 c6.84 ± 0.24 bc7.11 ± 0.23 b7.24 ± 0.46 ab7.62 ± 0.41 a4.15 ± 0.33 d6.47 ± 0.31 c6.89 ± 0.22 bc6.13 ± 1.37 D
2000/013.42 ± 0.32 c3.55 ± 0.57 c6.00 ± 0.17 a6.32 ± 010 a6.30 ± 0.17 a6.35 ± 0.07 a6.28 ± 0.18 a3.34 ± 0.27 c5.33 ± 0.25 b5.61 ± 0.24 b5.25 ± 1.29 G
2001/023.35 ± 0.11 d3.75 ± 0.22 c4.49 ± 0.12 a4.51 ± 0.18 a4.44 ± 0.18 a4.34 ± 0.11 ab4.51 ± 0.22 a3.64 ± 0.18 c4.30 ± 0.10 ab4.16 ± 0.09 b4.15 ± 0.42 K
2002/033.00 ± 0.17 ab3.04 ± 0.17 ab3.22 ± 0.09 a3.14 ± 0.19 ab2.96 ± 0.27 ab3.15 ± 0.33 ab2.93 ± 0.15 bc2.58 ± 0.27 d2.69 ± 0.06 cd2.62 ± 0.18 d2.93 ± 0.23 N
2003/044.55 ± 0.15 e4.69 ± 0.24 de5.50 ± 0.22 ab5.50 ± 0.13 ab5.54 ± 0.38 ab5.63 ± 0.44 a5.86 ± 0.27 a4.05 ± 0.39 f5.05 ± 0.16 cd5.26 ± 0.35 bc5.16 ± 0.57 GH
2004/052.23 ± 0.14 c2.61 ± 0.45 c3.96 ± 0.33 b4.55 ± 0.15 a4.57 ± 0.15 a4.77 ± 0.11 a4.60 ± 0.25 a2.44 ± 0.13 c4.41 ± 0.22 a4.57 ± 0.37 a3.87 ± 1.02 L
2005/063.89 ± 0.34 d3.66 ± 0.42 d5.16 ± 0.52 c5.55 ± 0.11 bc5.90 ± 0.17 ab6.14 ± 0.26 a6.08 ± 0.49 a3.50 ± 0.14 d5.36 ± 0.17 c6.02 ± 0.21 a5.13 ± 1.05 H
2006/073.66 ± 0.16 f3.56 ± 0.49 fg4.52 ± 0.28 e5.21 ± 0.41 cd5.43 ± 0.36 bc5.84 ± 0.50 ab5.91 ± 0.27 a3.13 ± 0.40 g4.83 ± 0.25 de5.21 ± 0.36 cd4.73 ± 0.98 J
2007/082.56 ± 0.11 e2.32 ± 0.11 e3.69 ± 0.37 d4.16 ± 0.34 a–c4.25 ± 0.15 a–c4.41 ± 0.38 ab4.56 ± 0.27 a2.58 ± 0.27 e3.87 ± 0.25 cd4.03 ± 0.39 b–d3.64 ± 0.84 M
2011/123.21 ± 0.31 fg3.48 ± 0.17 ef4.21 ± 0.22 a–c4.27 ± 0.25 ab4.16 ± 0.17 a–c4.39 ± 0.26 a3.97 ± 0.26 b–d3.10 ± 0.21 g3.77 ± 0.13 de3.93 ± 0.05 cd3.85 ± 0.45 L
2012/135.45 ± 0.15 bc5.56 ± 0.46 bc6.52 ± 0.33 a6.63 ± 0.43 a6.76 ± 0.88 a6.74 ± 1.01 a6.86 ± 0.80 a5.13 ± 0.92 c5.82 ± 0.58 b5.80 ± 0.64 b6.13 ± 0.64 D
2014/155.37 ± 0.07 de5.17 ± 0.32 ef6.18 ± 0.46 a–c6.69 ± 0.86 a6.51 ± 0.30 ab6.65 ± 0.82 a6.06 ± 0.41 a–d4.52 ± 0.29 f5.79 ± 0.34 c–e5.89 ± 0.21 b–d5.88 ± 0.70 E
2015/166.24 ± 0.15 d6.54 ± 0.41 cd7.45 ± 0.42 a7.36 ± 0.15 ab7.39 ± 0.55 ab7.29 ± 0.70 ab7.45 ± 0.64 a6.25 ± 0.19 d7.16 ± 048 ab6.97 ± 0.61 bc7.01 ± 0.49 A
2016/175.70 ± 0.60 c5.89 ± 0.65 bc6.36 ± 0.42 ab6.90 ± 0.22 a6.46 ± 0.30 ab6.31 ± 0.50 a–c6.53 ± 0.68 a5.72 ± 0.06 c6.45 ± 0.10 ab6.30 ± 0.21 a–c6.26 ± 0.38 C
2017/185.31 ± 0.10 b–d5.47 ± 0.26 a–d5.79 ± 0.87 a–c5.97 ± 0.62 a5.86 ± 0.25 ab5.91 ± 0.43 ab5.66 ± 0.50 a–c4.95 ± 0.29 d5.21 ± 0.19 cd5.43 ± 0.30 a–d5.56 ± 0.34 F
2018/194.98 ± 0.06 de5.14 ± 0.27 de5.85 ± 0.55 a–c6.10 ± 0.72 ab6.13 ± 0.85 ab6.24 ± 0.81 a6.17 ± 1.11 ab4.63 ± 0.98 e5.37 ± 0.75 cd5.60 ± 0.31 b–d5.62 ± 0.57 F
2019/205.32 ± 0.10 e5.47 ± 0.13 e6.88 ± 0.55 b–d7.59 ± 0.14 a7.28 ± 0.22 ab7.22 ± 0.35 a–c7.15 ± 0.38 bc5.13 ± 0.49 e6.74 ± 0.39 d6.82 ± 0.29 cd6.56 ± 0.90 B
Avg. (SN)4.01 F4.20 E5.40 C5.74 B5.77 B5.89 A5.90 A3.90 G5.24 D5.47 C5.15
SD (t ha−1)1.261.211.141.181.191.161.241.121.091.141.07
CV (%)31.528.821.120.620.519.621.028.820.820.920.8
Max. (t ha−1)6.246.547.457.597.397.427.626.257.166.977.01
Min. (t ha−1)2.082.323.223.142.963.152.932.442.692.622.93
* Mean value ± Standard deviation (SD). Within rows, means followed by different lowercase letters are significantly different in the same year; ** Data (mean ± SD) in column followed by different uppercase letters indicate significant differences between years (Fisher’s LSD test, p ≤ 0.05).
Table 4. Soil chemical properties in the surface layer (0–30 cm) at different SN treatments.
SN-TreatmentsSoil Chemical Properties *
StrawSNpHCaCO3HumusTNP2O5K2OSOC
(KCl)(H2O)(%)(%)(%)(mg 100 g−1)(g kg−1)
S1
With
straw
return
S1N007.167.464.522.95 e0.173 f29.69 cd27.62 cd12.864 cd
S1N07.187.514.633.13 d0.184 de31.59 b–d28.72 bc13.234 c
S1N607.197.524.583.23 bc0.189 b–d32.29 a–c29.69 ab13.168 c
S1N907.187.544.693.31 ab0.194 b34.57 a29.99 a14.164 b
S1N1207.167.504.973.33 a0.201 a33.61 ab28.75 a–c14.737 a
S1N1507.227.575.223.25 a–c0.191 bc32.90 ab29.63 ab14.649 a
S1N1807.197.545.203.23 bc0.190 bc33.39 ab27.92 c14.691 a
Avg. **7.187.534.883.24 A0.191 A33.06 A29.12 A14.107 A
S0
Without
straw
return
S0N07.157.555.172.97 e0.183 de28.83 de26.35 e12.734 d
S0N907.157.535.403.13 d0.179 ef31.11 b–d26.56 de12.296 e
S0N1507.197.475.443.18 cd0.185 c–e26.27 e25.73 e12.751 d
Avg.7.167.525.343.09 B0.183 B28.74 B26.21 B12.594 B
Descriptive
statistics
Mean7.177.524.983.170.18731.4328.1013.529
Max.7.227.575.443.330.20134.5729.9914.737
Min.7.157.464.522.950.17326.2725.7312.296
SD0.020.030.350.130.0082.541.510.936
CV (%)0.300.467.044.094.1548.075.386.918
ANOVA
(Sample size:
n = 40)
F–value0.811.581.1315.7013.746.3612.3145.71
p0.6090.1720.378<0.001<0.001<0.001<0.001<0.001
R20.1860.2950.2510.8370.8190.6410.7520.903
* Data in columns followed by different letters represent significant differences among experimental treatments for each parameter separately (LSD test, p ≤ 0.05); ** Without S1N00 treatment.
Table 5. Pearson’s correlation coefficients (r) between soil chemical properties and wheat GY *.
VariablespH (H2O)CaCO3HumusTNAP (P2O5)AK (K2O)SOCGY
pH (KCl)0.450.080.100.150.020.160.180.15
pH (H2O) −0.040.060.220.190.210.120.11
CaCO3 0.050.05−0.06−0.51−0.100.16
Humus 0.790.500.480.620.82
TN 0.510.420.690.64
AP (P2O5) 0.440.550.43
AK (K2O) 0.550.33
SOC 0.63
* Underlined values in italics are different from 0 with a significance level α = 0.05. Sample size: n = 40 (10 SN-treatments × 4 replicates).
Disclaimer/Publisher’s Note: The statements, opinions and data contained in all publications are solely those of the individual author(s) and contributor(s) and not of MDPI and/or the editor(s). MDPI and/or the editor(s) disclaim responsibility for any injury to people or property resulting from any ideas, methods, instructions or products referred to in the content.

