Abstract
With the increase in global warming and solar radiation, the starch quality and dough properties of wheat have also been affected to some negative extent. To prepare for the effects of future climate change, we explored the effects of different temperatures and radiation on the properties of wheat starch and dough. Six sowing dates for four wheat varieties were selected for this study. The seedling population on the first sowing date (S1) was 300 × 104 plants ha−1, which increased by approximately 10% after the subsequent sowing date. The results showed that a delay in sowing time increased the daily mean temperature after anthesis and decreased the effective accumulated temperature and cumulative solar radiation. When the daily mean temperature increased 0.32 °C after anthesis, the total starch content decreased 1.2%, the sedimentation value increased by 14.19 s, the water absorption increased 0.62%, the dough development time increased 0.4 min, and the dough stability time increased 0.28 min. The gelatinization and dough properties of wheat starch were not only related to the daily mean temperature, but were also significantly related to the effective accumulated temperature and cumulative solar radiation. The results showed that the starch and dough properties of wheat are also related to the cumulative radiation temperature after anthesis. Compared with radiation, temperature is the main climatic factor affecting the formation of wheat starch and dough.
1. Introduction
Being a major staple food, wheat is one of the top three cereals produced globally [1]. Wheat starch is mainly located in the endosperm cells of wheat, otherwise known as the wheat seed, and accounts for about 70% of its weight. Wheat starch has an important influence on the quality properties of food made from wheat flour [2,3]. Wheat starch is widely used in the food, light, textile, pharmaceutical, paper, industries, among others, and can be further transformed into high-value-added products [4]. In the process of heating, starch granules are gelatinized; indeed, starch gelatinization is an important index reflecting the quality of the starch or grain powder and even the food processing quality, which is of great significance for deep processing and the use of starch [5]. Previous studies have shown that there is a strong correlation between rheological and pasting behavior, and the quality of noodles, steamed buns, and other products [6]. The quality of steamed bread and other products is related not only to the parameters of the rapid visco-analyzer (RVA), but also to the properties of the dough [7,8,9]. The rheological properties of dough are not only the basic characteristics of wheat flour, but are also the main index for studying the quality of wheat flour.
The properties of wheat starch and dough are not only influenced by the wheat variety, but are also affected by cultivation and climatic conditions [10]. The lower reaches of the Huai River are important wheat-producing areas in China, and the climate of the Huai River Basin has been constantly changing in recent years [11]. Some studies have shown that the annual average temperature has increased by approximately 1.1 °C in the past 50 years. From the curve model, it can be seen that the temperature has increased significantly since 1980, and the temperature rise over the past 10 years has been faster than before [12]. Since 1951, the changing trend in the national average precipitation has not been obvious, but the spatial characteristics of precipitation change have been obvious and relatively stable [13]. In the past 50 years, climatic factors, such as average sunshine hours, average wind speed, and water surface evaporation, have all shown a significant downward trend [14]. Changes in temperature and sunshine are expected to affect the production of high-quality wheat in the future.
Some studies have shown that high temperatures at the filling stage have no significant effect on the amylose content of some wheat varieties, whereas others have shown an increasing trend in amylose content [15]. In these studies, the total starch content has been shown to decrease with an increase in temperature, which mainly decreases the amylopectin content of weak- and medium-gluten varieties; in addition, high-temperature stress has been shown to increase the ratio of amylose to amylopectin [16]. High temperatures have been found to reduce the activity of enzymes related to starch synthesis and inhibit the synthesis of amylopectin [17,18]. Temperature not only affects starch content, but also affects stress gelatinization [19]. Some studies have shown that high temperatures in the late filling stage increase starch viscosity parameters and affect the gelatinization temperature [20]. An increase in temperature has no significant effect on water absorption and development time; however, the stability time and farinograph quality number increases [21]. In addition, an increase in light intensity leads to an increased accumulation of wheat starch [22]. In a certain range, the grain peak viscosity, valley viscosity, final viscosity, tightness value, and recovery value increase with an increasing light exposure time [23]. Although there have been many studies on the effects of temperature and light on wheat starch and dough, most of the experiments have been carried out in a controlled greenhouse, and some results have been inconsistent. Few studies have investigated the effects of temperature and light on wheat starch and dough under natural conditions. Whether the effects of temperature and radiation on wheat starch and dough properties are consistent under natural conditions is a question that requires further investigation. Therefore, the study delayed the flowering date by setting different sowing dates, so that the post-anthesis temperature and light of each treatment reached different conditions. This study combined temperature and radiation to explore the starch and dough properties of wheat, aimed to explore the effects of different post-anthesis temperatures and radiation on wheat starch and dough properties, and aimed to provide a theoretical basis for regulating wheat quality under climate change in the future.
2. Materials and Methods
2.1. Experimental Site and Design
The field experiment was conducted during the 2017 and 2018 wheat seasons in the lower reaches of Huai River. A representative experimental site was selected to represent the lower reaches of the Huai River: Jianhu County, Yancheng City, Jiangsu Province, China (N 33°47′, E 119°77′). The chosen experimental site belongs to the north–south climate transition zone under a typical monsoon climate, with an annual total solar radiation of 4.75 × 10⁹–5.09 × 10⁹ J M−2 and an annual precipitation of approximately 1000 mm. The soil was clay loam with abundantly available phosphorus (45.6 mg kg−1) total nitrogen (1.59 g kg−1), and abundantly available potassium (96.6 mg kg−1).
Four wheat varieties (T. aestivum L.) (Yangmai23(YM23), Yangmai25 (YM25), Huaimai33 (HM33) and Nongmai158 (NM158)) were used on six sowing dates in the field experiment. YM23 and YM25 were obtained from the Jiangsu Li Xia He area Agricultural Science Research Institute; HM33 came from the Huaiyin Agricultural Science Institute; and NM158 came from the Jiangsu Shen Nong Da Feng seed industry. The first sowing date was October 31st, and the seeds were sown again every 10 days. The specific planting dates were as follows: 31/10 (S1), 10/11 (S2), 20/11 (S3), 30/11 (S4), 10/12 (S5) and 20/12 (S6). The test plots had 229.5N per hectare applied to them, using 750 kg of slow-release fertilizer and 75 kg of urea, and all fertilizers were used as basal fertilizers. Seeds were sown in rows 22 cm apart and at a depth of about 2 cm. The plot size was 15 m2 (3.3 m × 4.5 m), with 2 replications. The seedlings planted in the six sowing periods were 300 × 104 ha−1, 330 × 104 ha−1, 363 × 104 ha−1, 399 × 104 ha−1, 439 × 104 ha−1, and 483 × 104 ha−1 in size respectively. The seedlings were manually thinned in each field during the experiment.
2.2. Measurement Items
2.2.1. Calculation of Post-Anthesis Temperature
The effective accumulated temperature (EAT) = , where “n” is the number of days post-anthesis; “Ti” is the mean temperature of the “i” day; and “T0” is the biological zero temperatures.
Daily mean temperature (Tmean) = /days post-anthesis, where “n” is the number of days post-anthesis and “Ti” is the mean temperature of the “i” day.
Daily maximum temperature (Tmax) = /days post-anthesis, where “n” is the number of days post-anthesis and “Ti” is the maximum temperature on the “i” day.
Daily minimum temperature (Tmin) = /days post-anthesis, where “n” is the number of days post-anthesis and “Ti” is the minimum temperature on the “i” day.
2.2.2. Calculation of Post Anthesis Radiation
In this experiment, the Angstrom–Prescott (AP) equation was used to calculate the solar radiation [24].
Cumulative solar radiation (CSR) =
Daily mean solar radiation (Rmean) = /days post-anthesis
where “n” is the number of days post-anthesis and “Qi” is the total solar radiation on the “i” day.
2.2.3. Determination of Starch Content
In this study, the amylose content (AC) and amylopectin content (APC) of flour were determined using the dual-wavelength method [25], and their sum was the total starch content (TSC). The pure amylose and amylopectin were used to determine the wavelength, which was used to determine the amylose and amylopectin content in the flour.
2.2.4. Determination of Falling Number
The falling number (FN) of the sample was determined using an FN1500 fungal descent instrument produced by Perten (Stockholm, Sweden). In total, 7 g of the sample was weighed for the test, 25 mL of distilled water was added, and the mixture was shaken thoroughly. The samples were then placed in the instrument to determine the falling number. The test was repeated four times.
2.2.5. Determination of Starch Gelatinization
The gelatinization properties of the starch were determined using a rapid gelatinization viscometer (Micro Visco-Amylo-Graph, MVAG) manufactured by Brabender, Germany. Each sample was weighed to 3.5 g (14% wet base). The instrument was run under the control of a computer to measure the peak viscosity (PV), trough viscosity (TV), final viscosity (FV), breakdown (BD), and setback (SB) of flour. The thermal cycle for windows (TCW) software was used to analyze the thermal cycle. The test was repeated three times.
2.2.6. Determination of Dough Properties
The dough properties were measured using an electronic farinograph (Brabender, Germany). The sample was weighed to 50 g (14% wet base), placed in a kneading bowl, and the correct amount of water was added to ensure a dough consistency of approximately 500 F.U. According to the computer analysis, the water absorption (WA), development time (DT), stability time (ST), softening of dough (SD), and farinograph quality number (FQN) were obtained.
2.3. Experimental Data Collection and Analysis
The meteorological data were obtained from the local meteorological bureau at the experimental site. All meteorological factors in this experimental period were within the range of the meteorological data over the past ten years.
Microsoft Excel 2021 (Microsoft, Redmond, WA, USA) was used to record and organize the data, and SPSS22.0 (IBM, Armonk, NY, USA) was used for statistical analysis (ANOVA). Origin 2022 was used for graphing. Comparisons were made at the probability level of 0.05 (LSD, p = 0.05) using the mean value with the smallest difference.
3. Results
3.1. Effects of Different Sowing Dates on Post-Anthesis Temperature and Radiation of Wheat
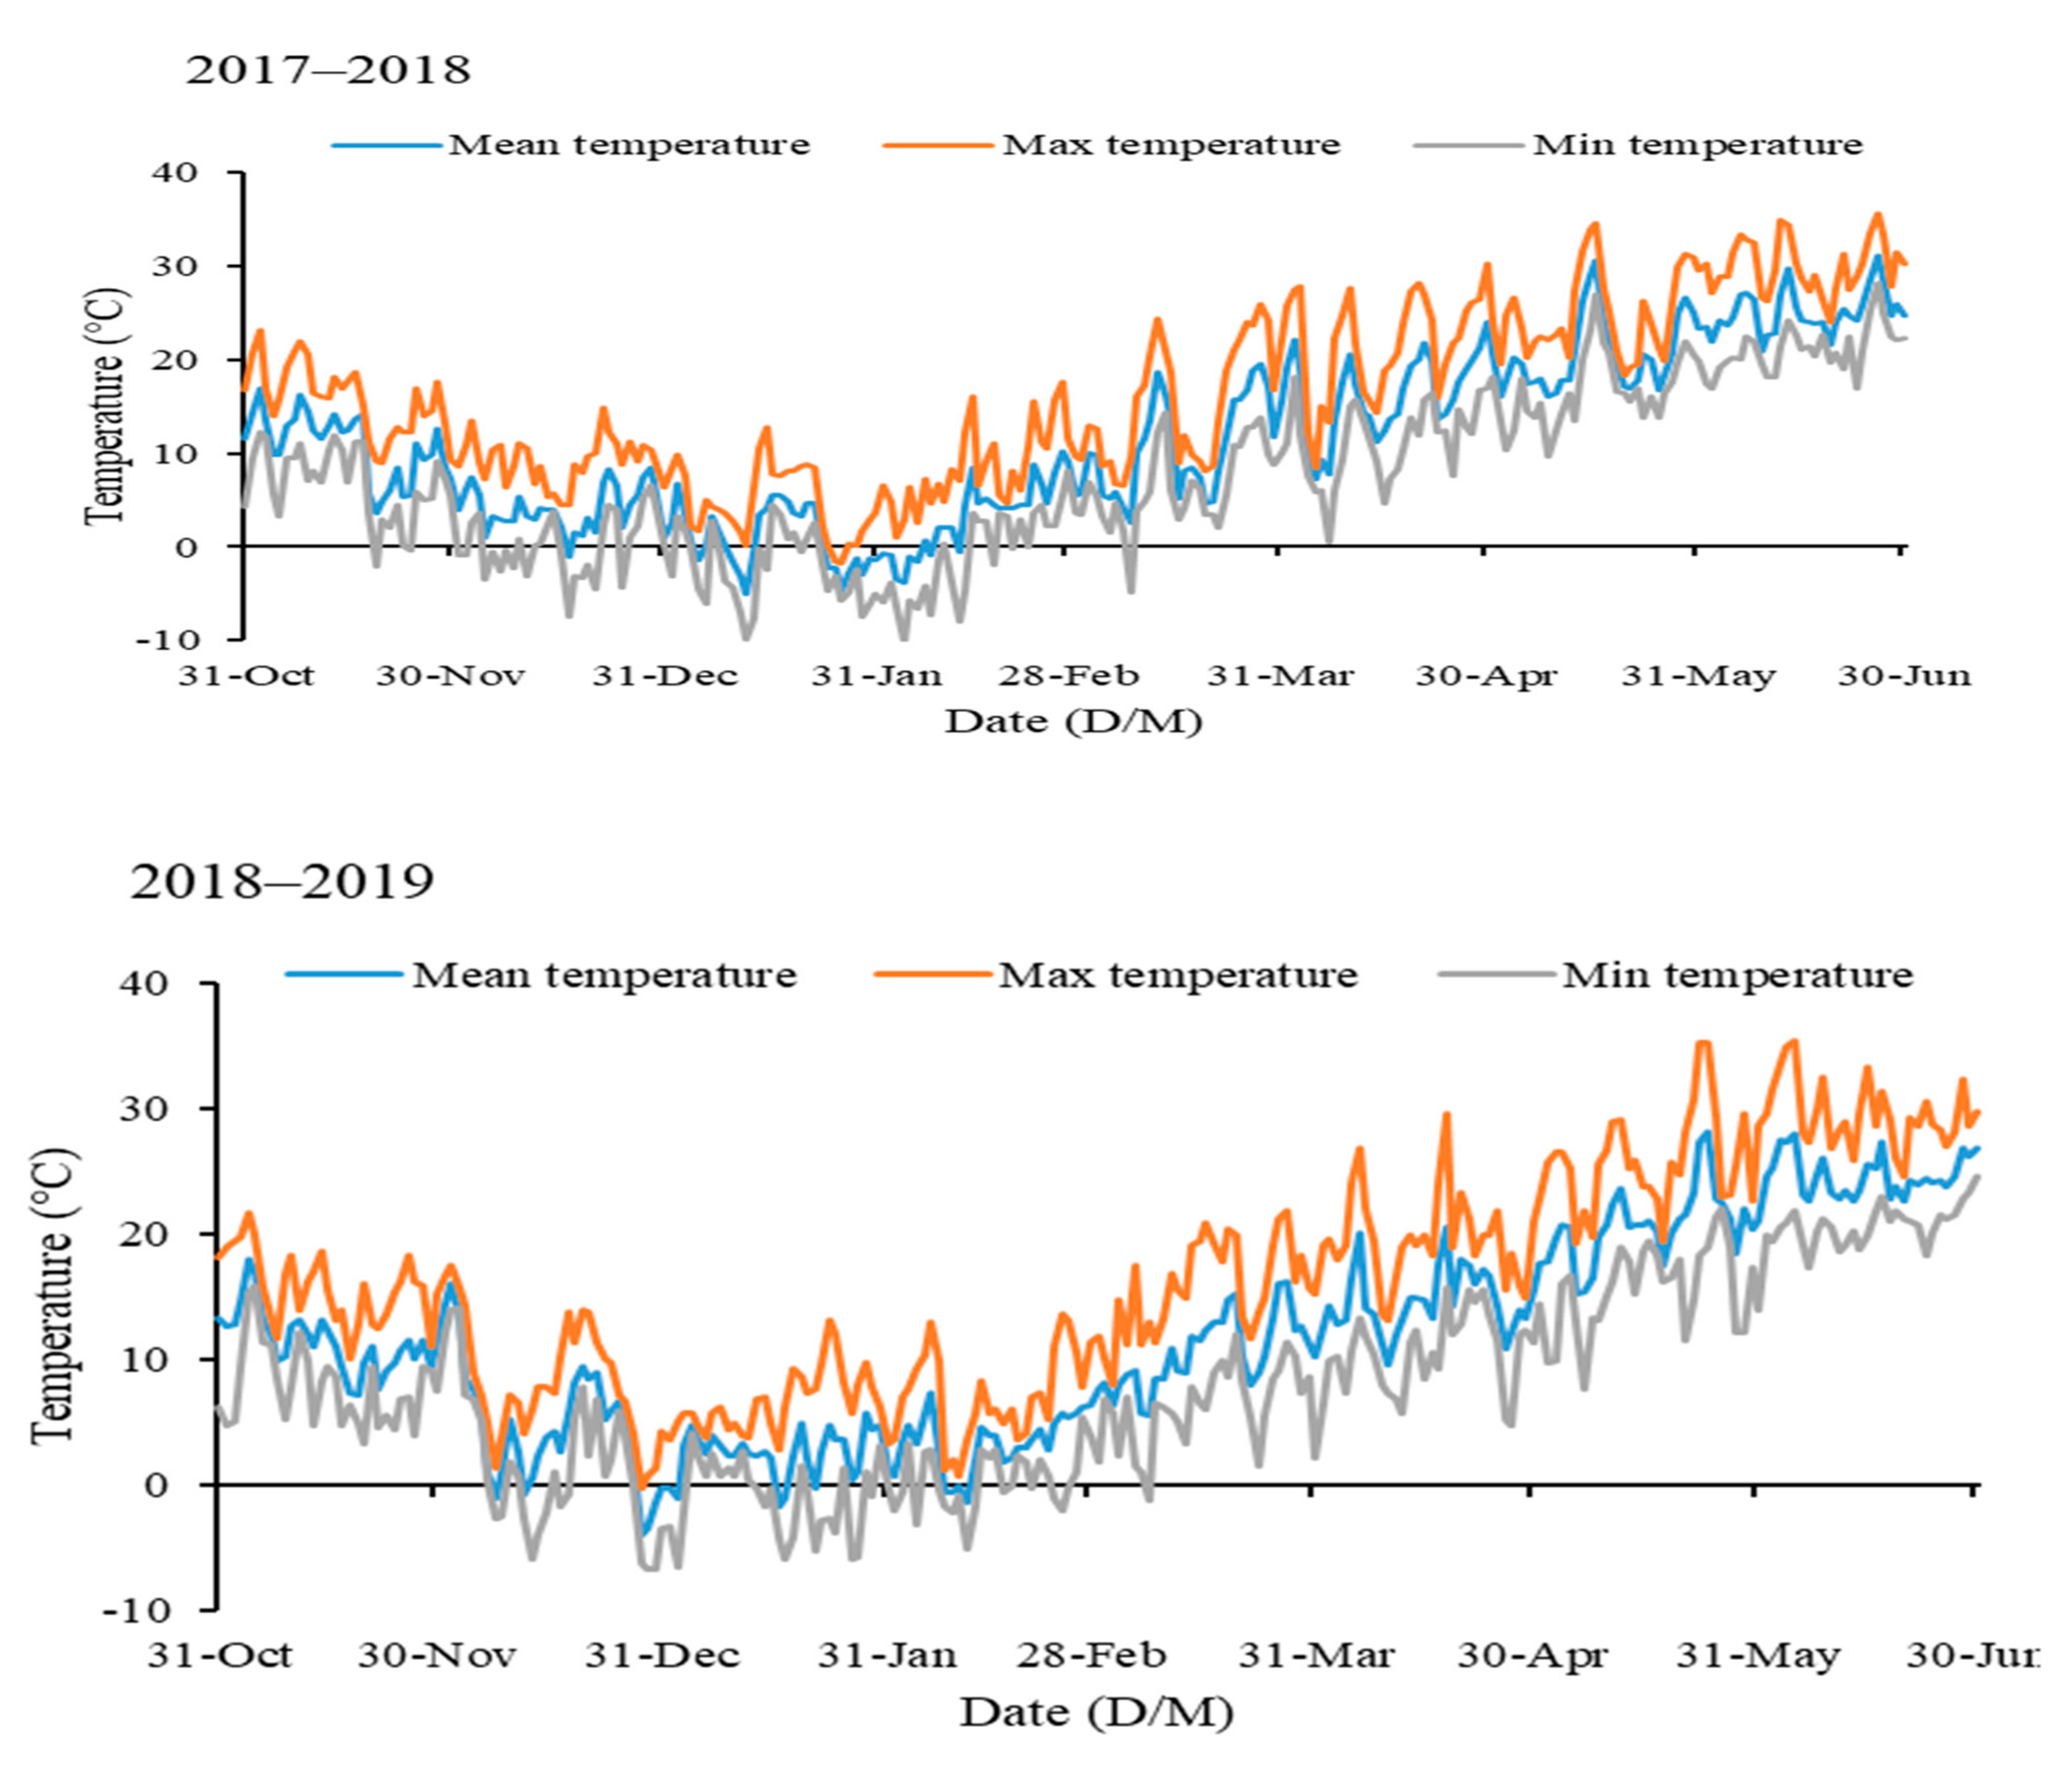
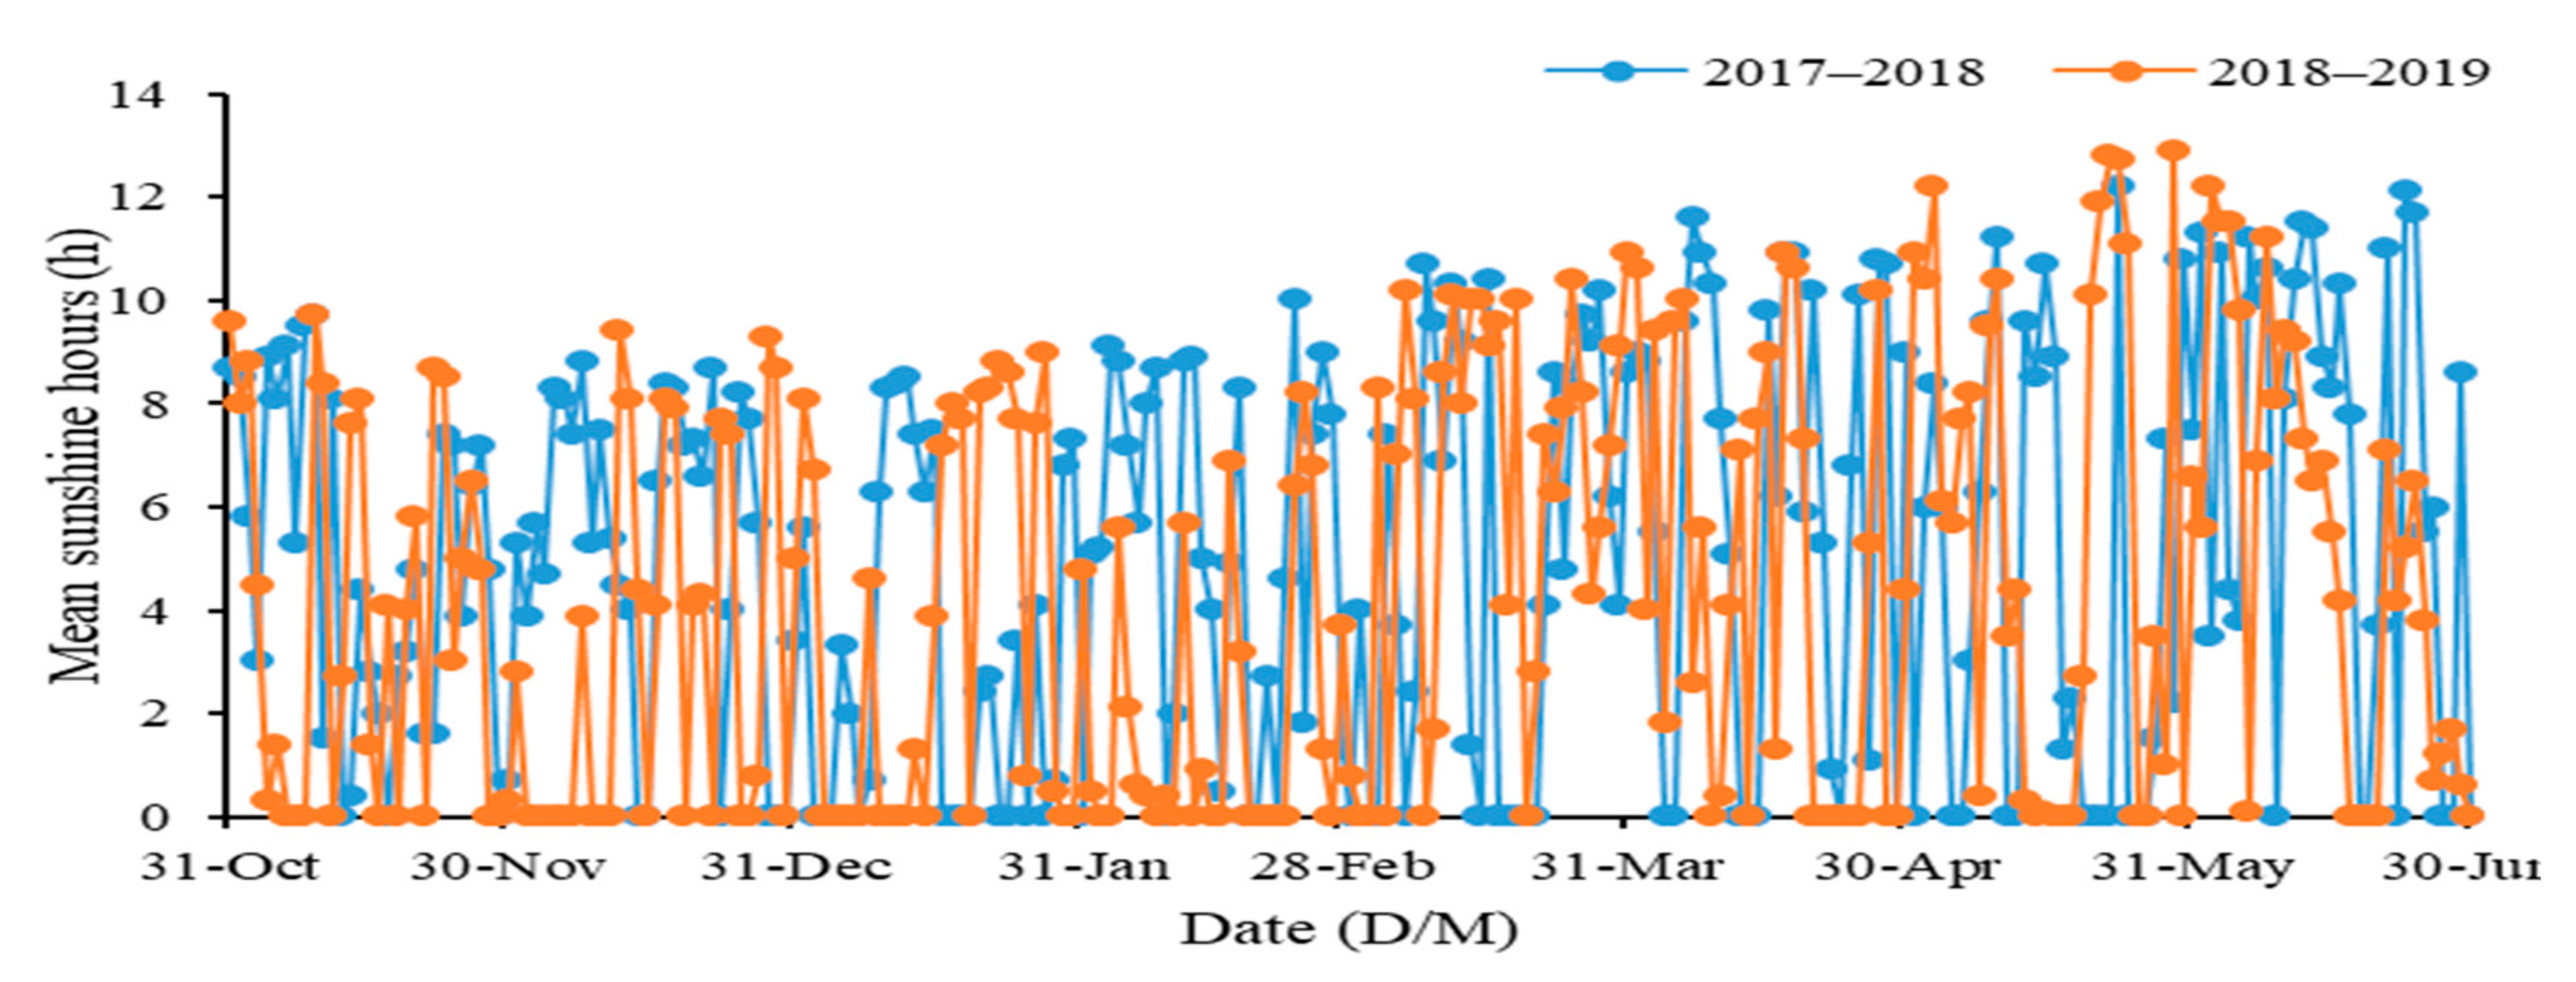
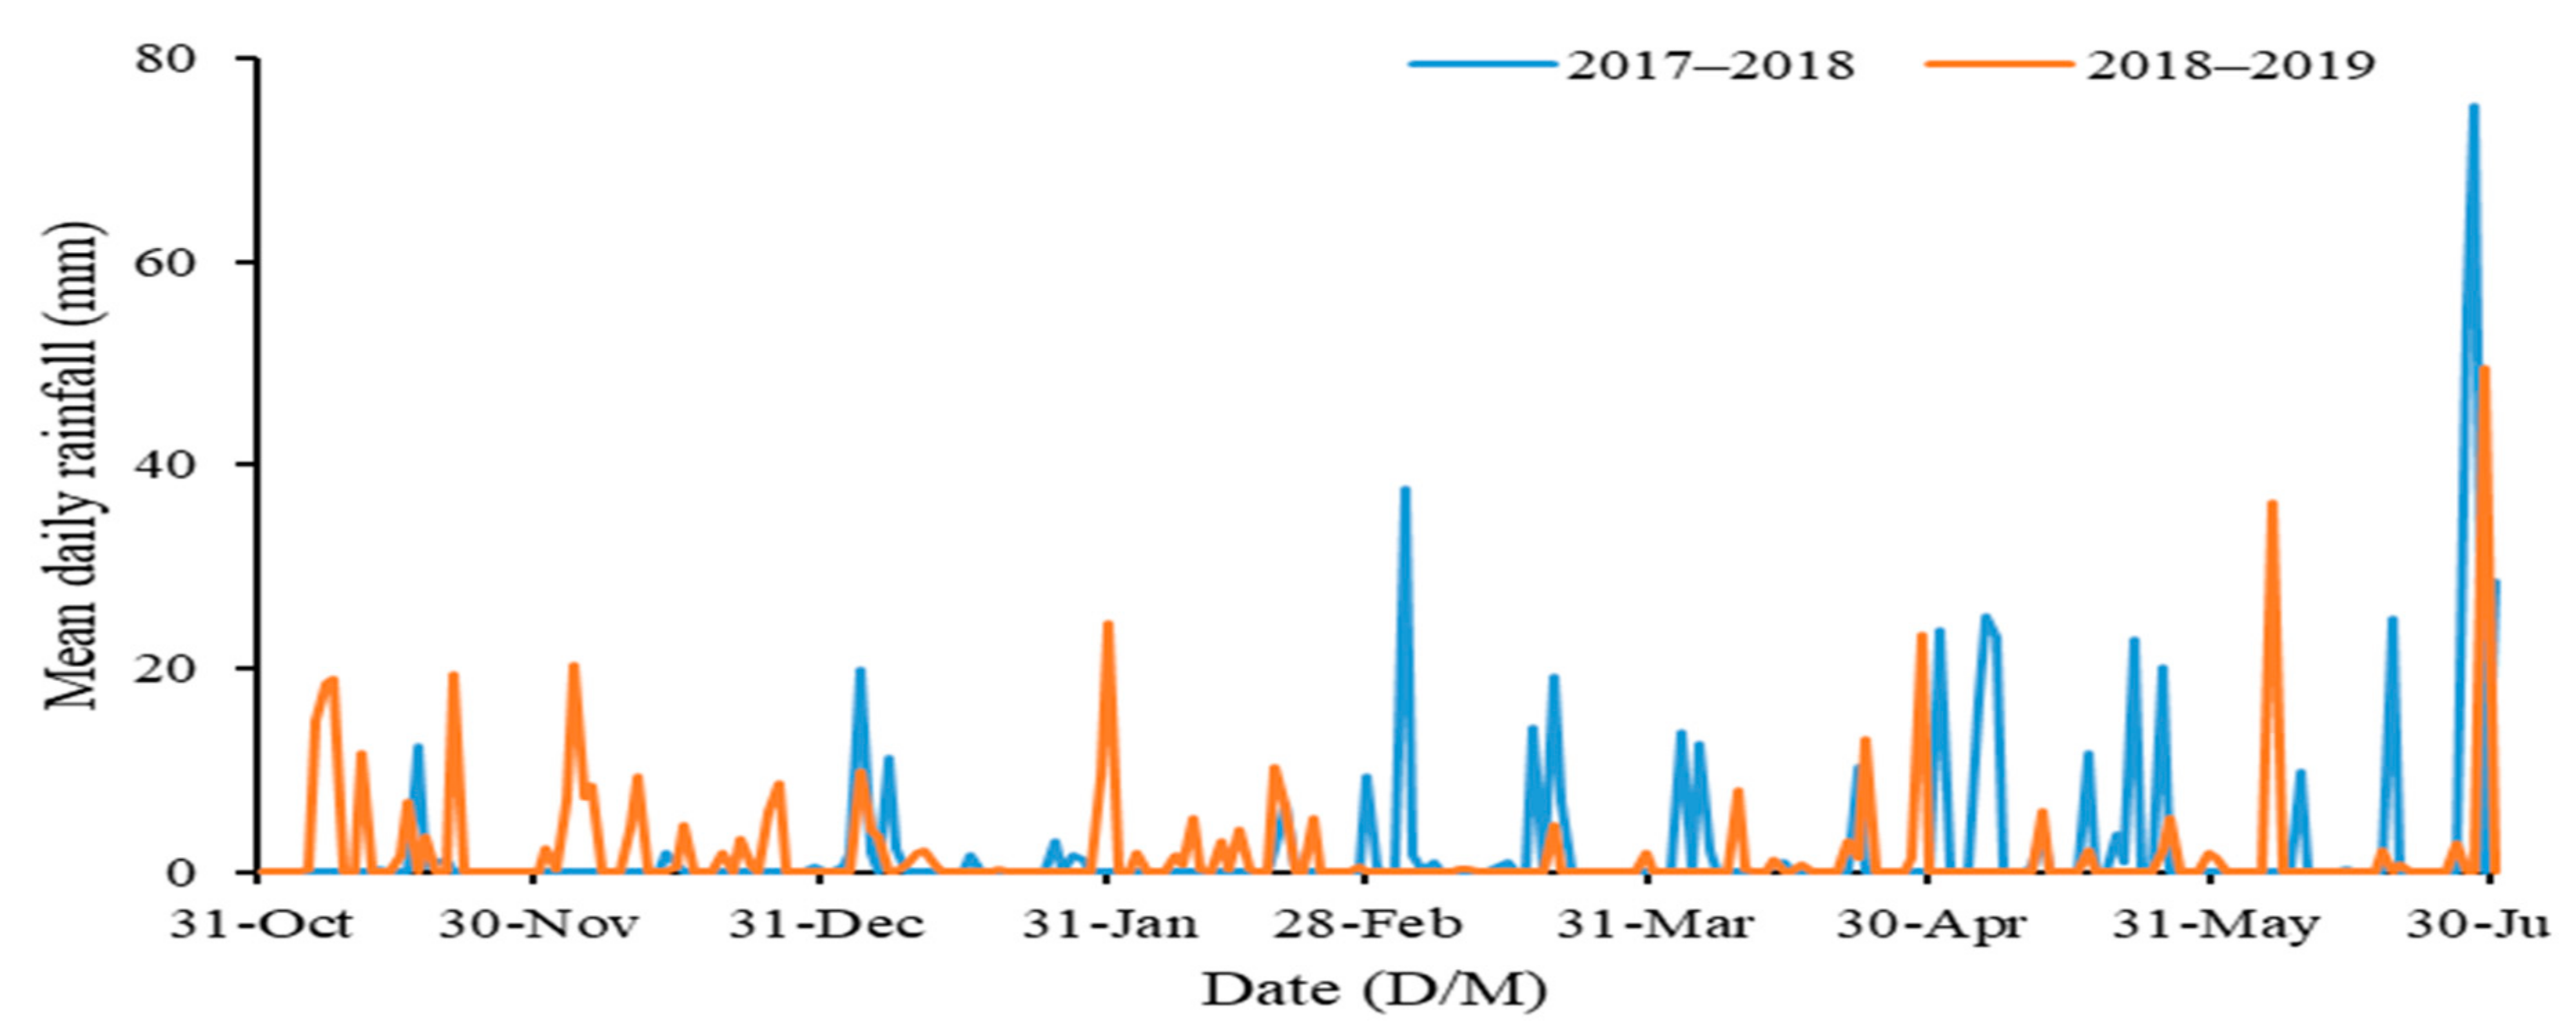
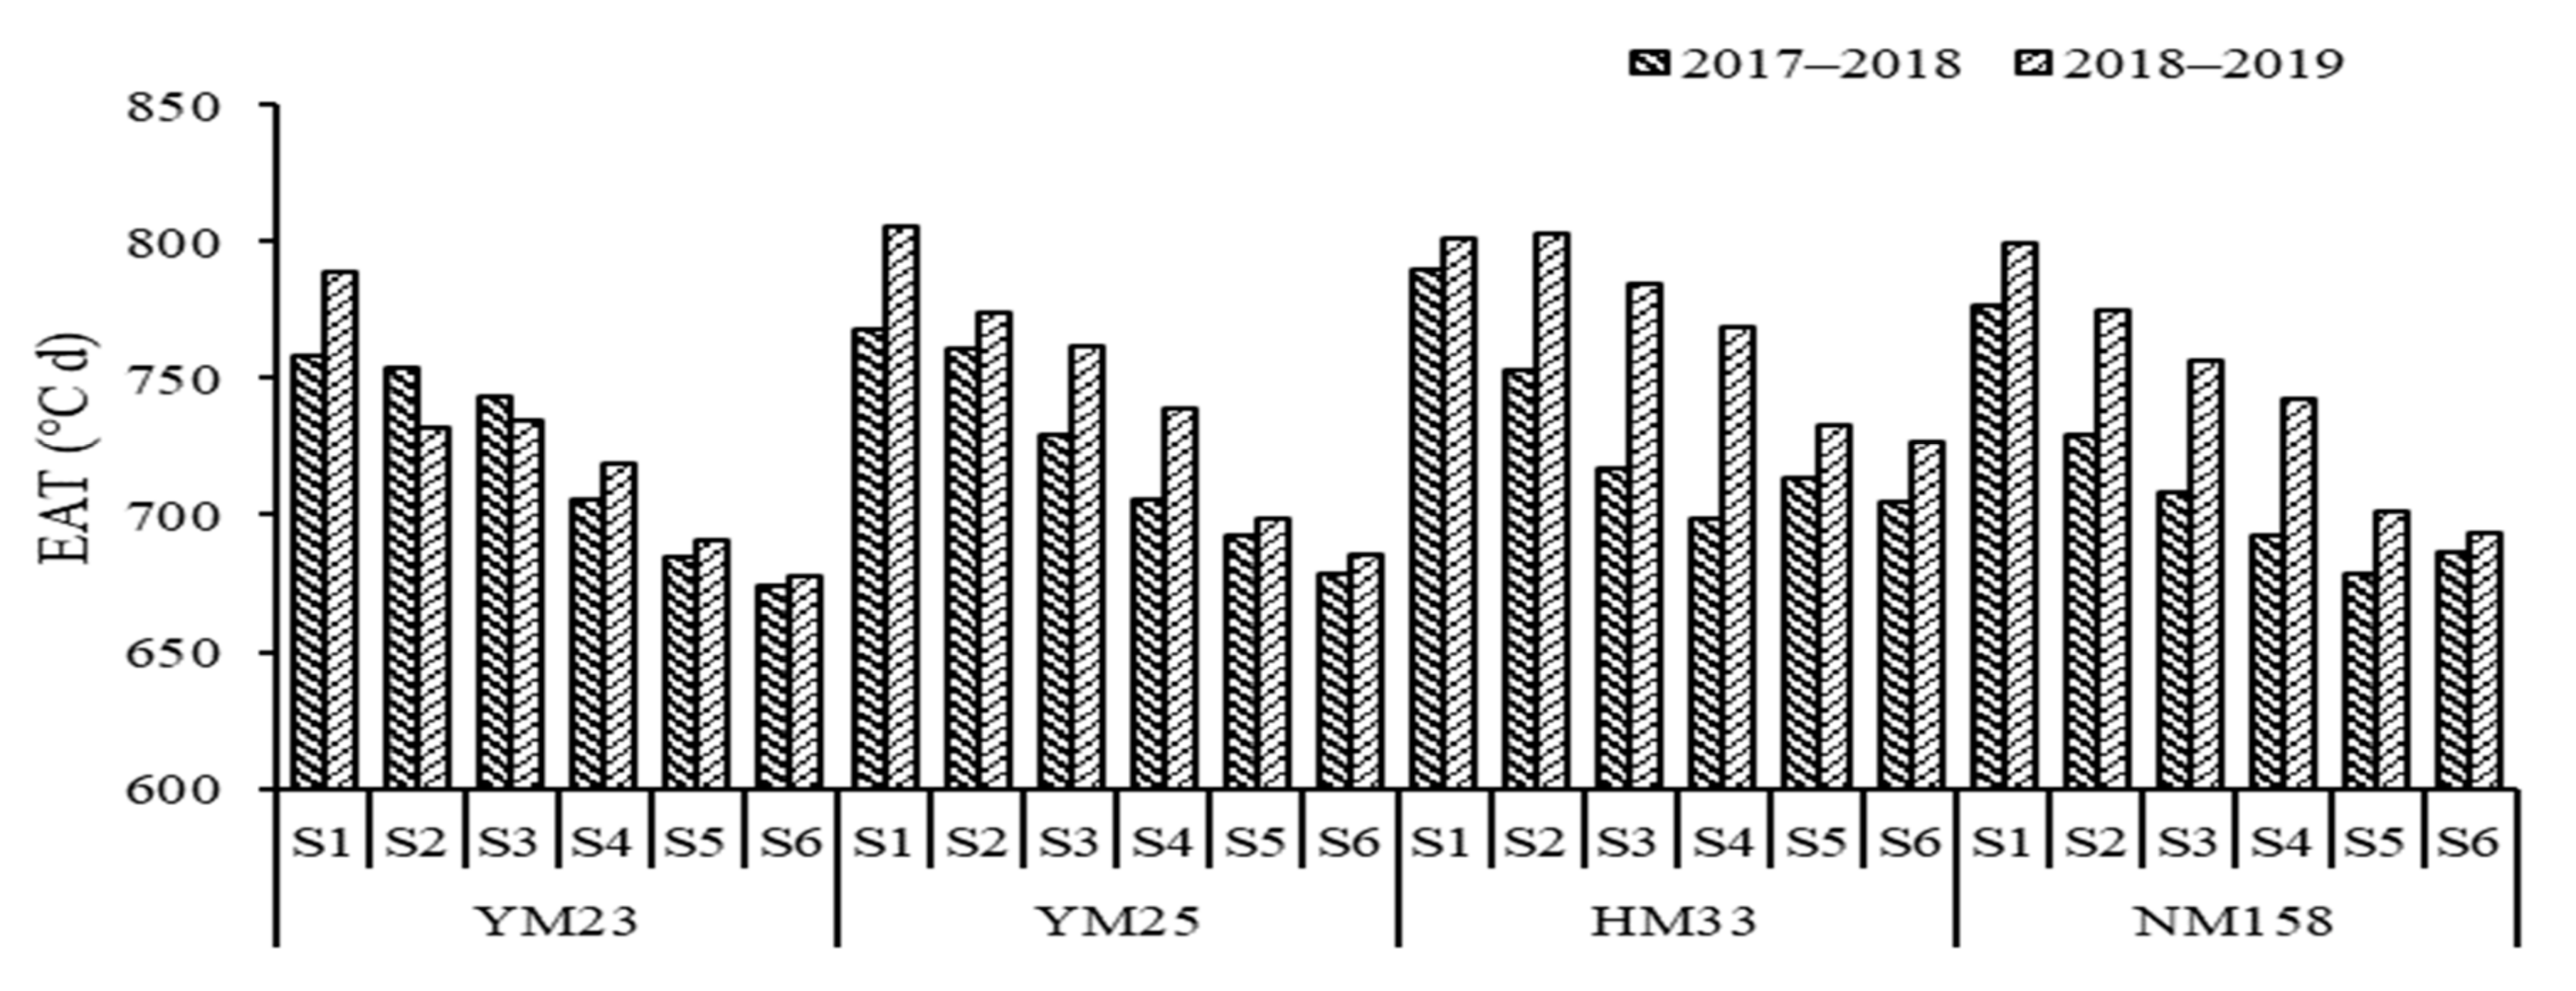
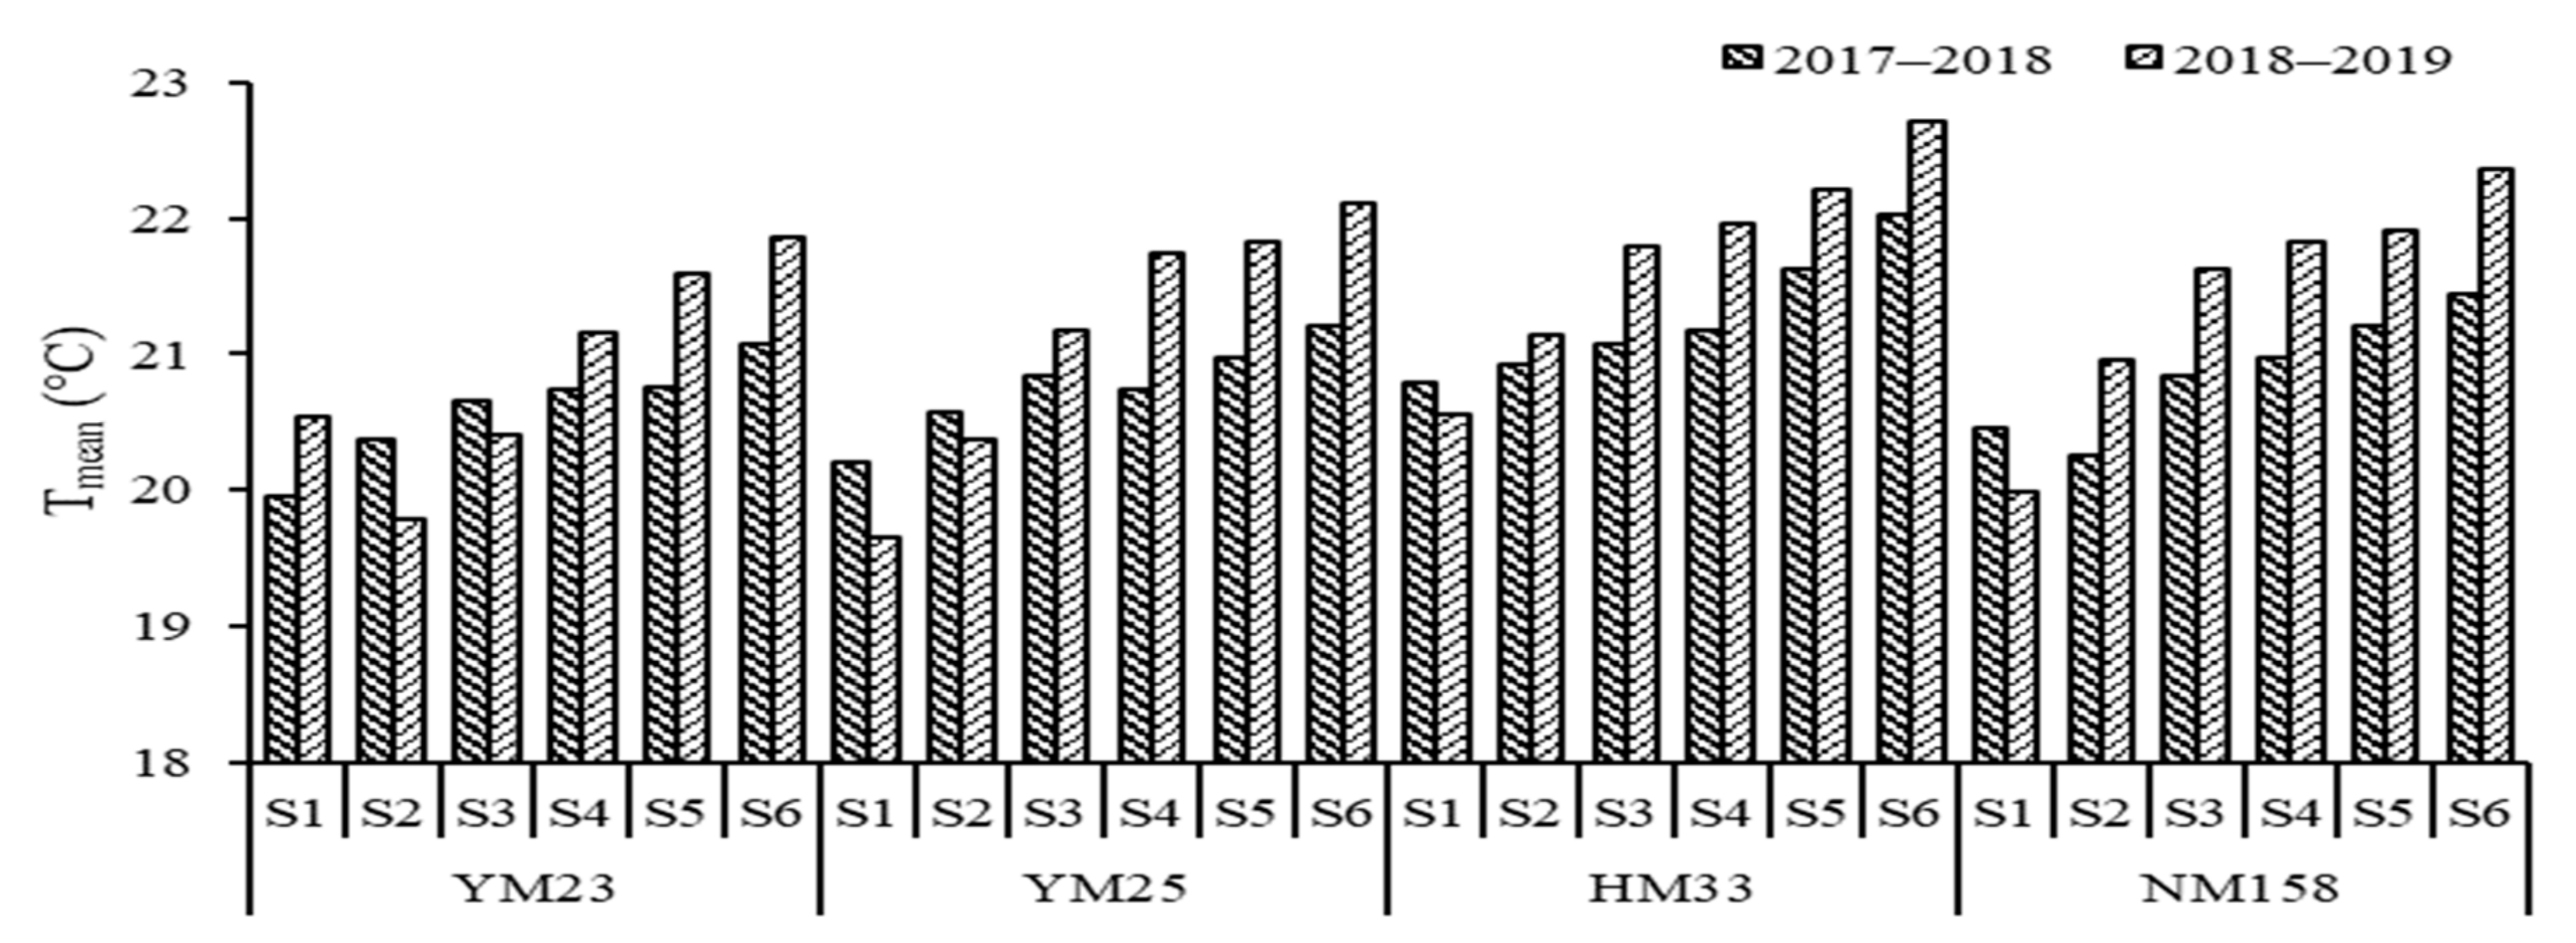
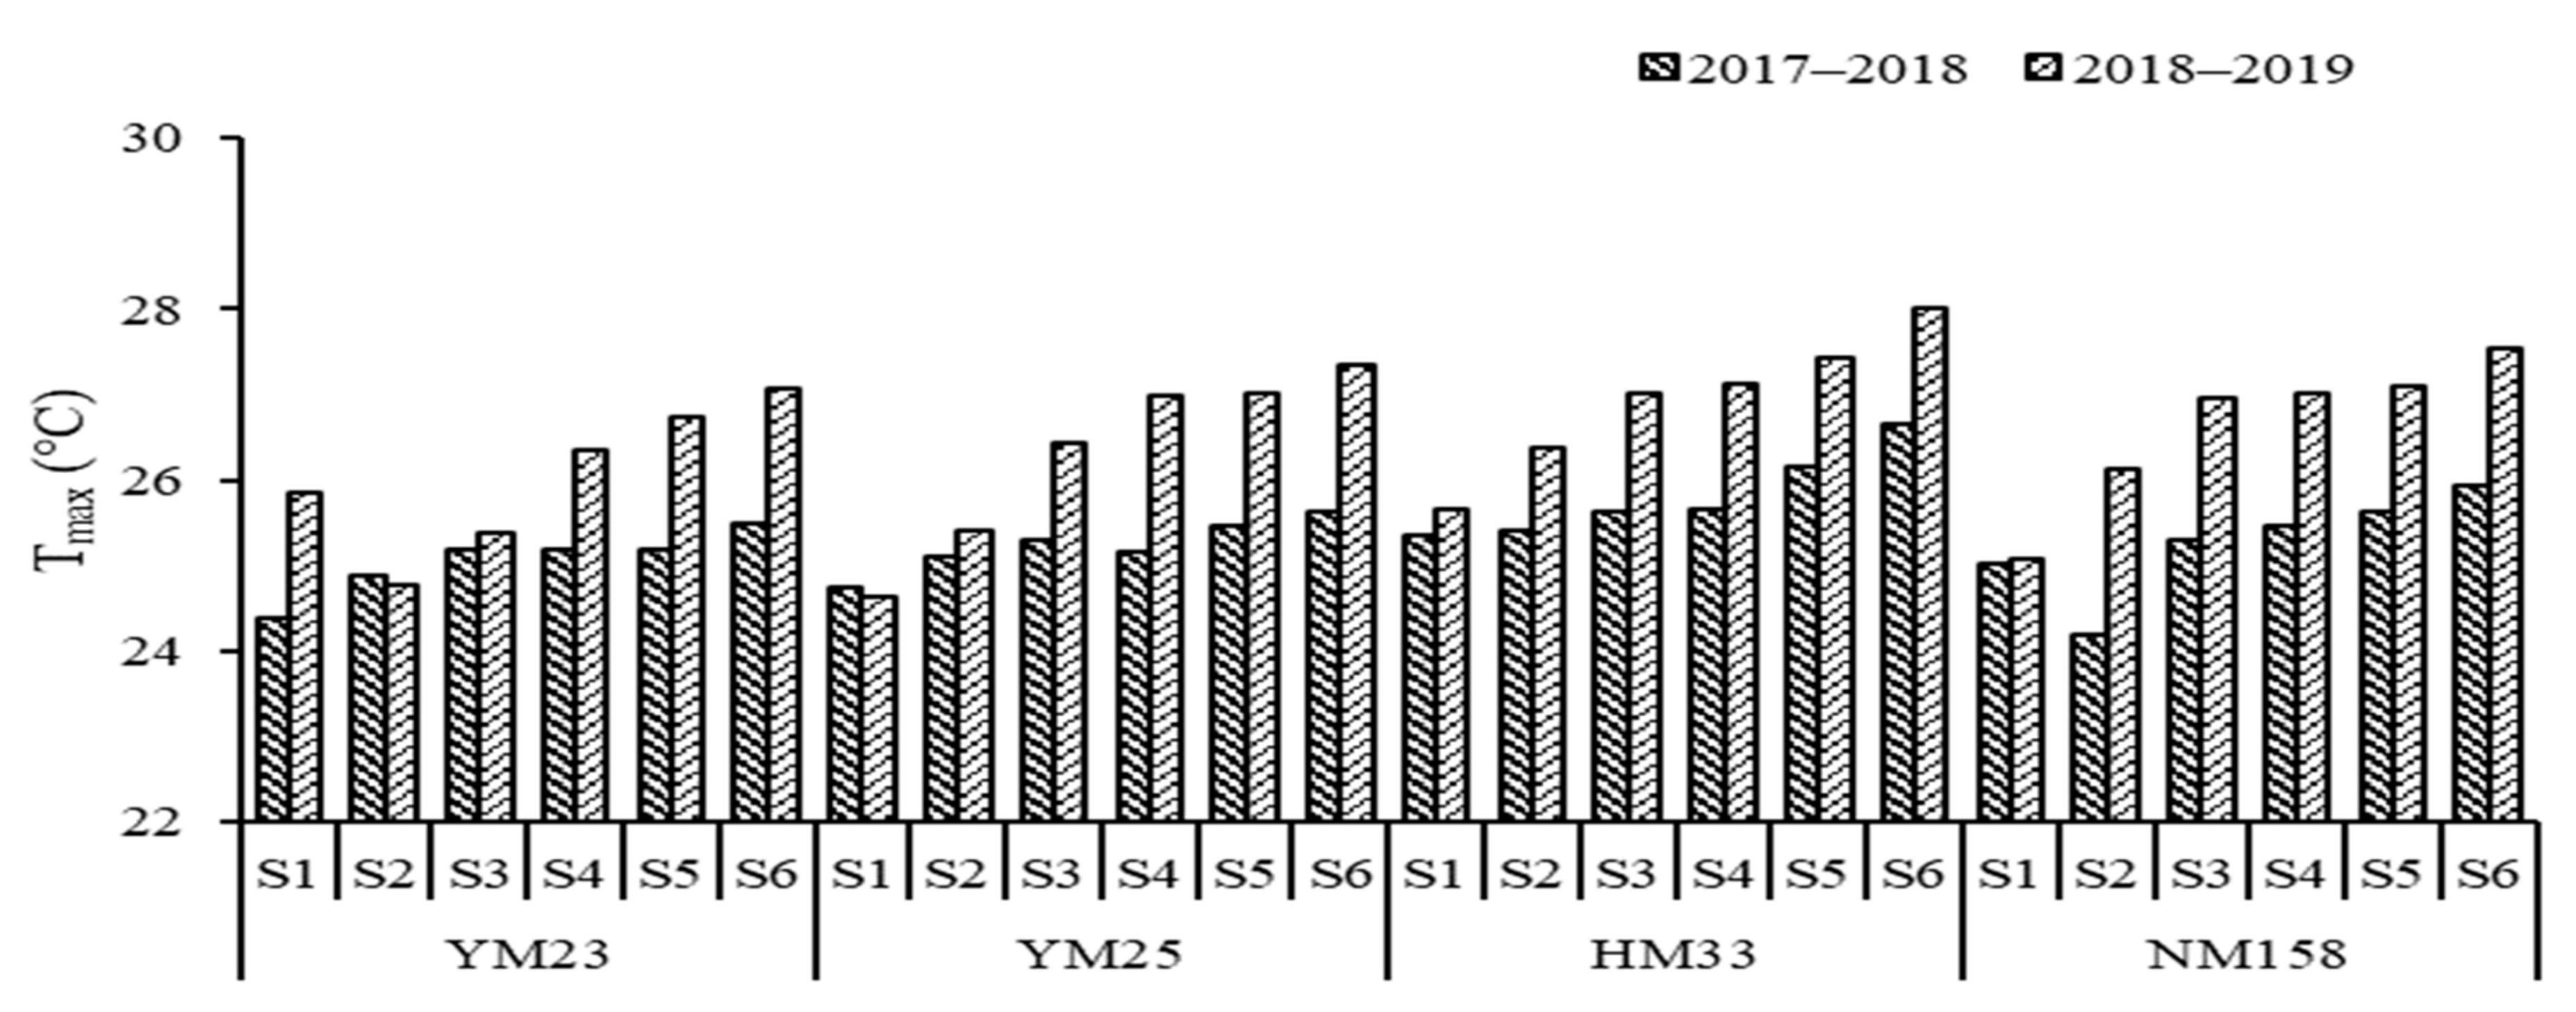
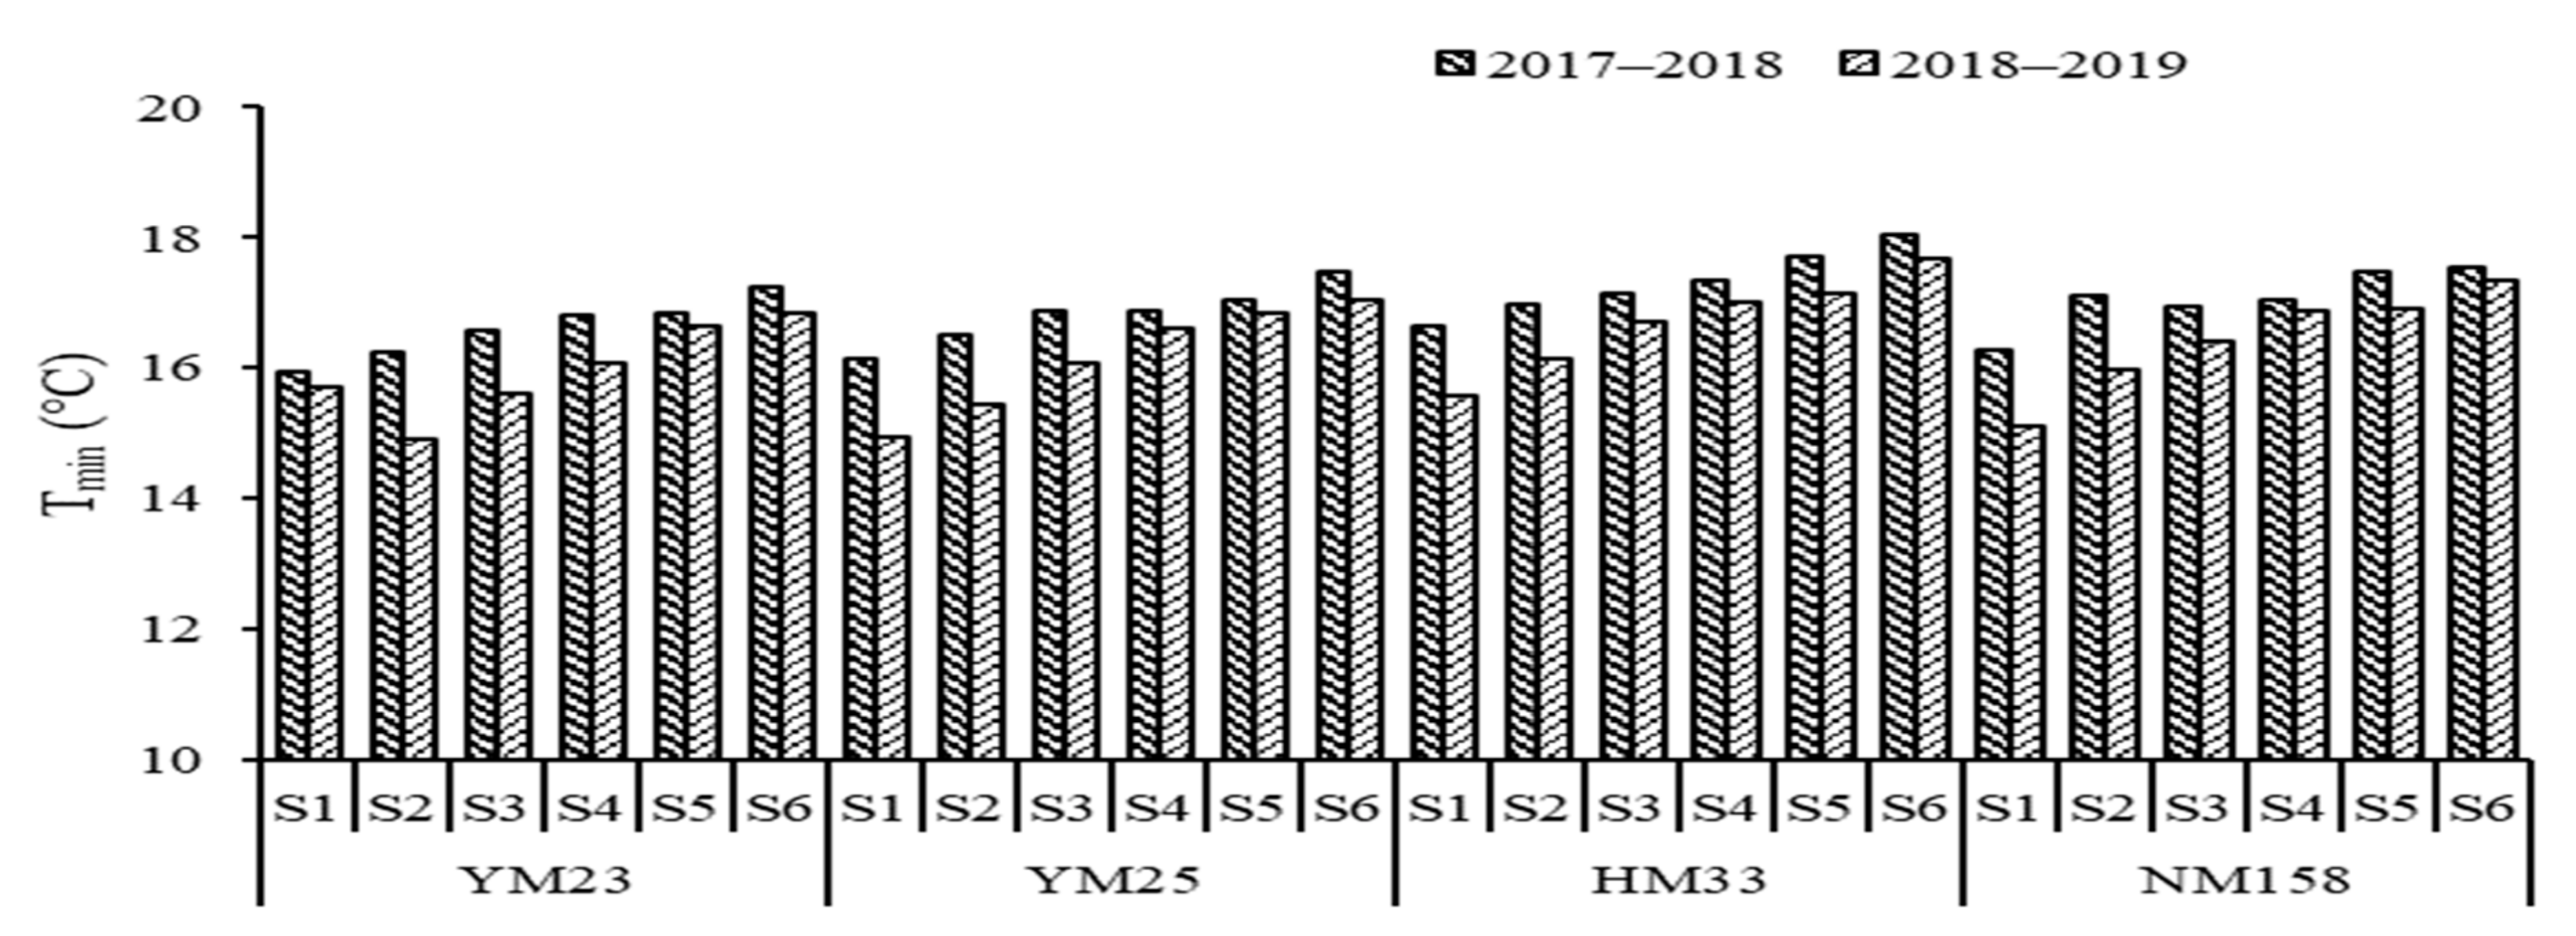
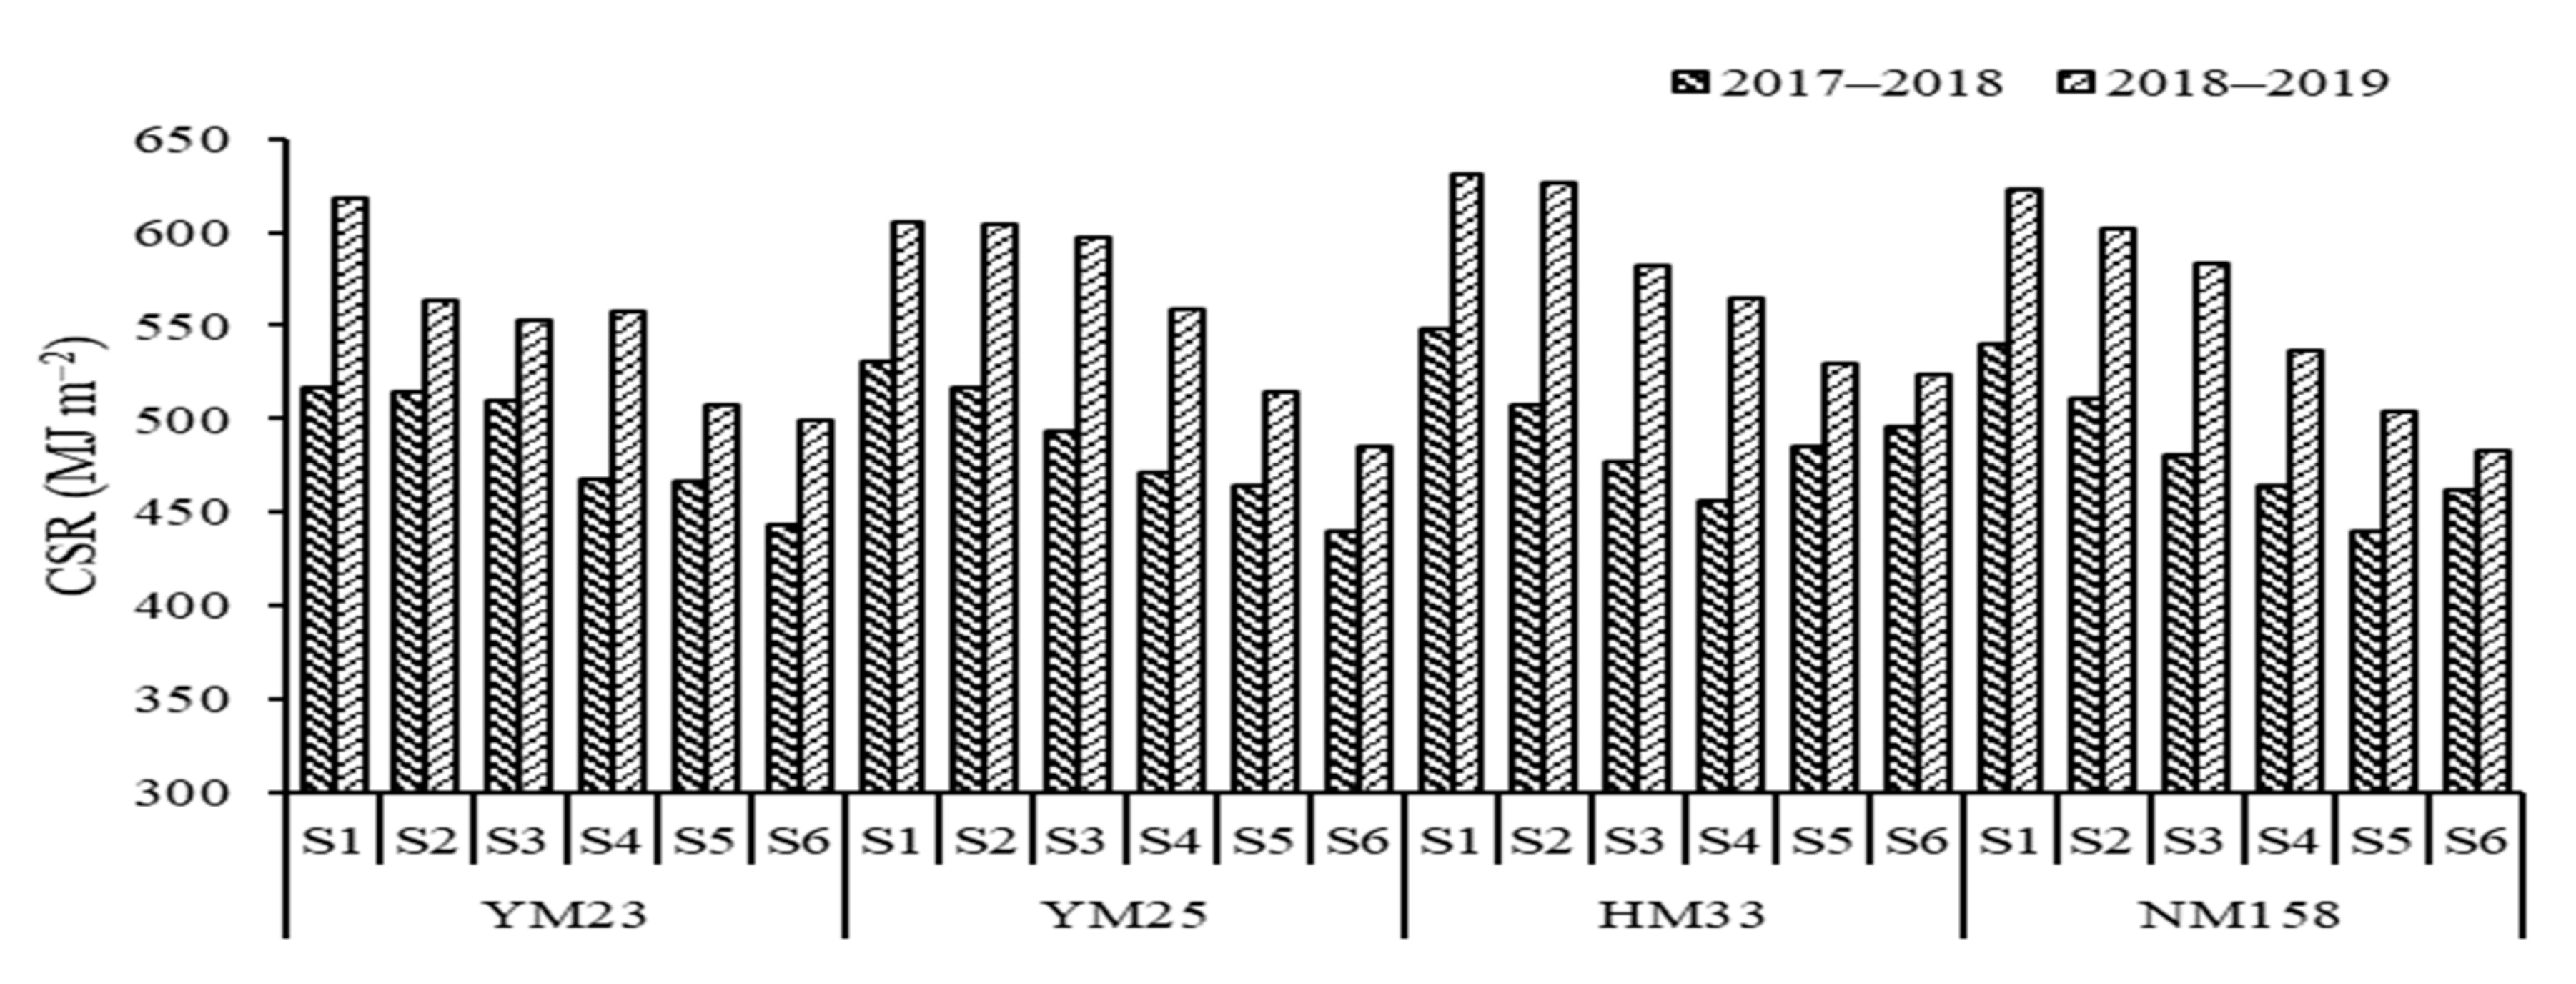
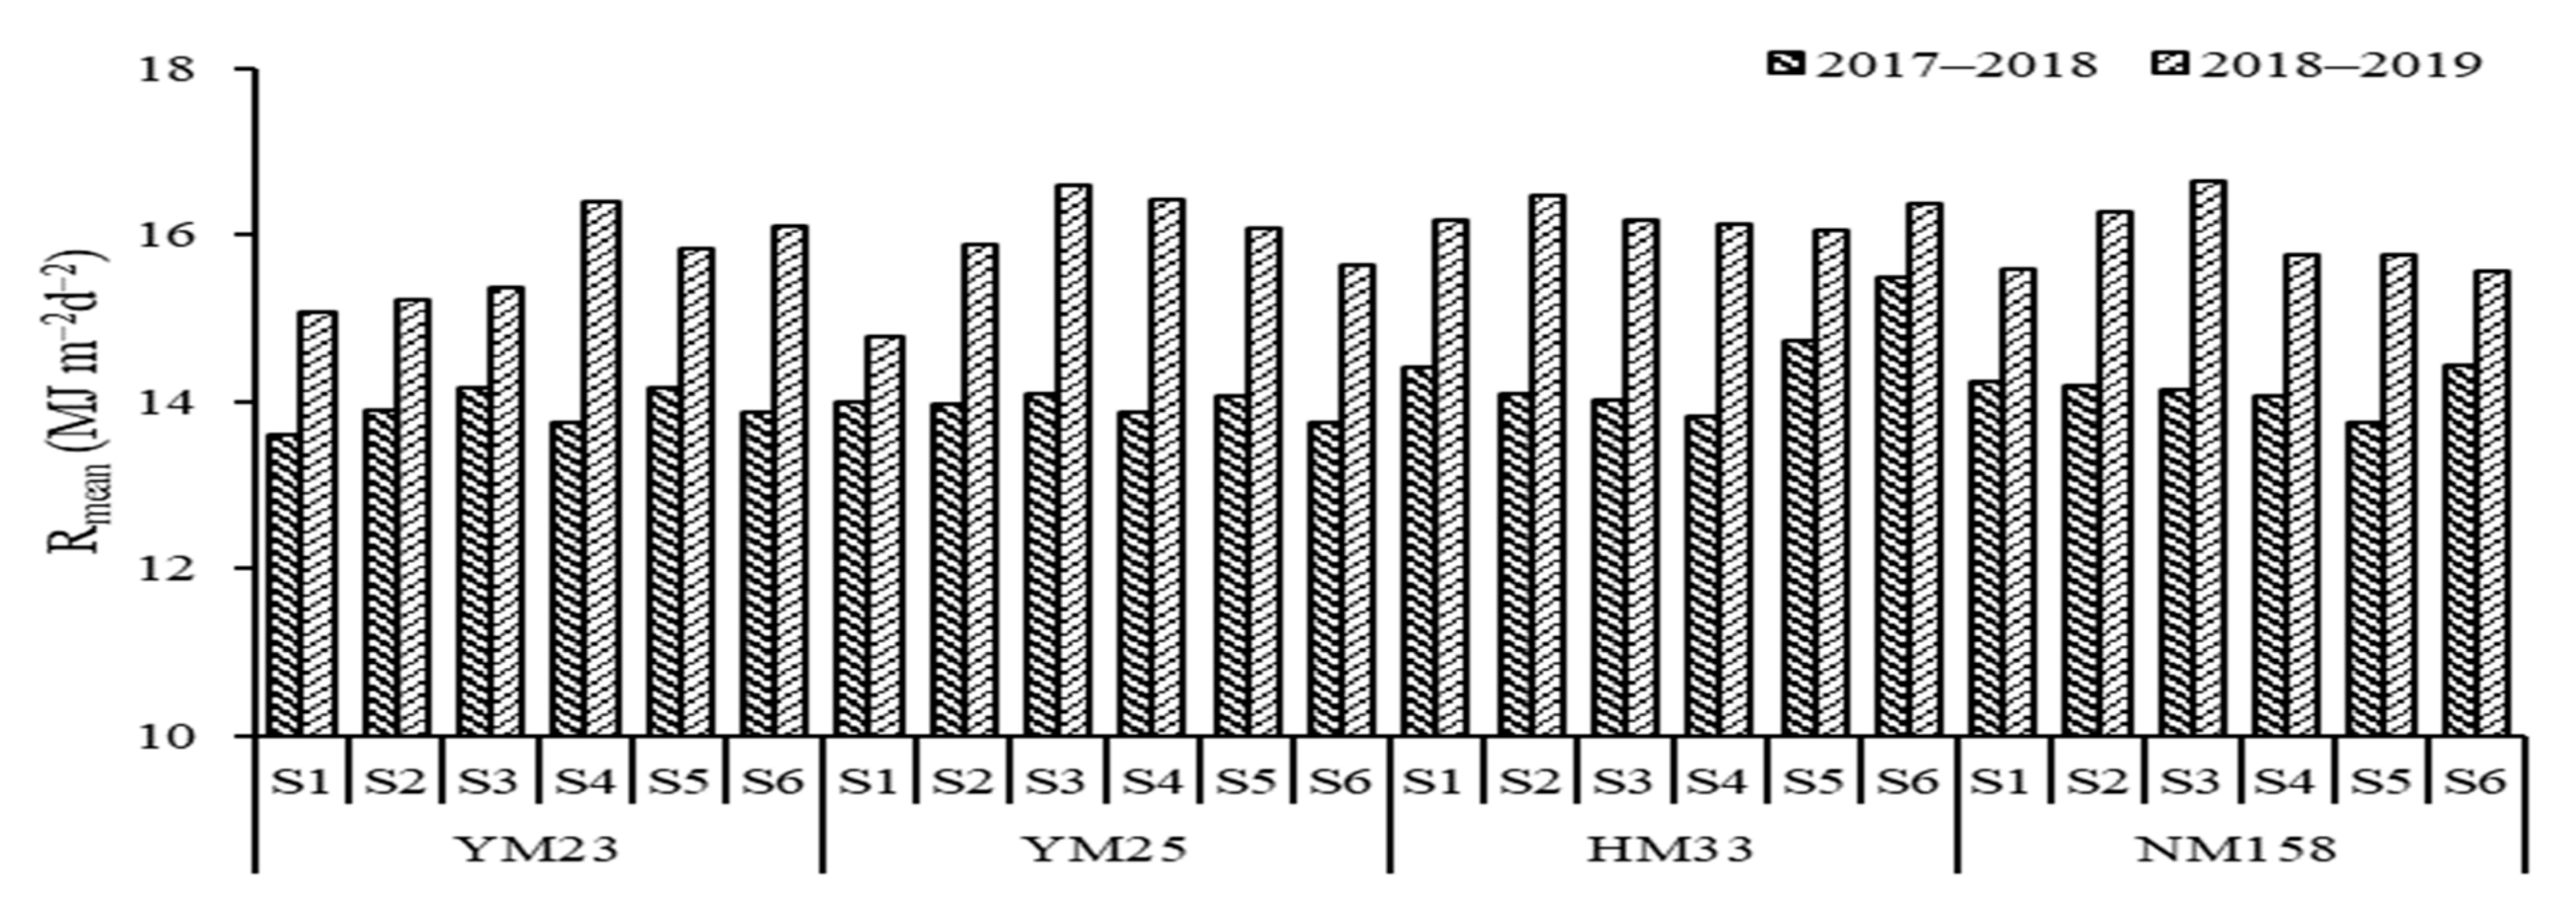
During the field experiment, the temperature first decreased and then increased, with a similar trend over the two years (Figure 1). During the experimental period, sunshine duration and rainfall did not differ significantly from year to year (Figure 2 and Figure 3). With the delay in the sowing date, the effective cumulative temperature (EAT) of the four wheat varieties post-anthesis decreased gradually, and the EAT of each delayed sowing date decreased by 19 °C on average over two years (Figure 4). With the postponement of the sowing date, the mean daily temperature (Tmean), minimum mean daily temperature (Tmin) and maximum mean daily temperature (Tmax) gradually increased, and the average temperature in the second year was slightly higher than that in the first year. However, the trend seen regarding the change in the temperature over the two years was the same (Figure 5, Figure 6 and Figure 7). The cumulative solar radiation (CSR) of the second year was slightly higher than the post-anthesis CSR of the first year (Figure 8). The CSR gradually decreased as the sowing date was postponed; for each postponement, the CSR decreased by 19.56 MJ m−2. The average daily solar radiation did not change significantly between the sowing days (Figure 9).
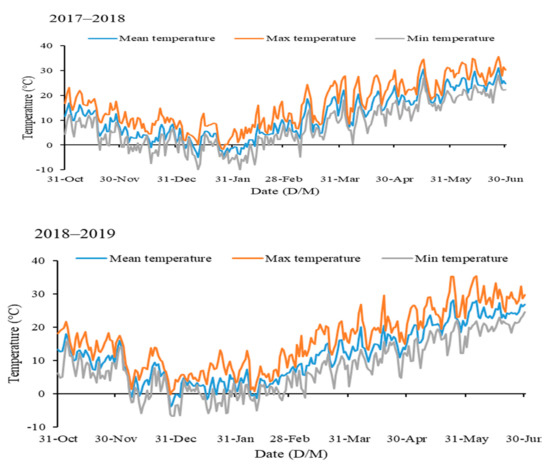
Figure 1.
Daily changes in mean daily, maximum, and minimum temperatures during the experiment.
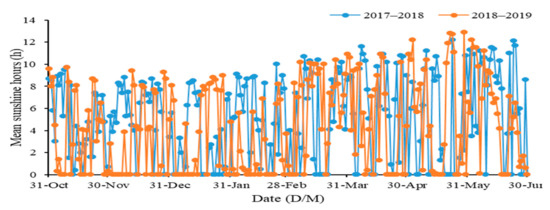
Figure 2.
Daily sunshine hours during the experiment.
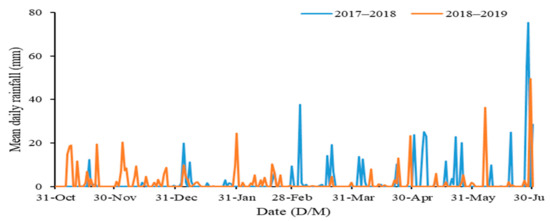
Figure 3.
Daily rainfall during the experiment.
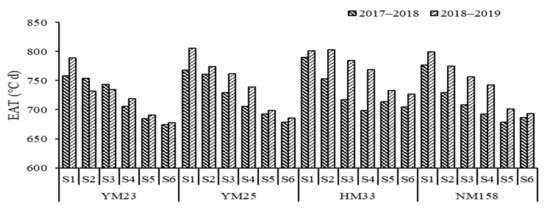
Figure 4.
Change in effective accumulated temperature (EAT) after anthesis on different sowing dates.
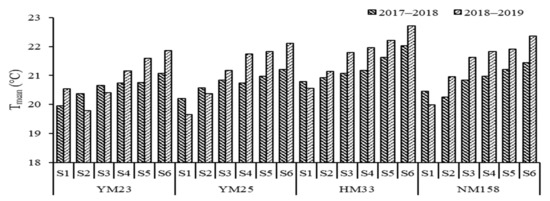
Figure 5.
Change in daily mean temperature (Tmean) after anthesis on different sowing dates.
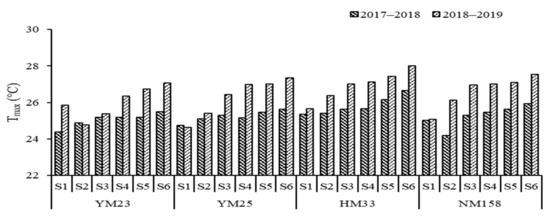
Figure 6.
Change in daily maximum temperature (Tmax) after anthesis on different sowing dates.
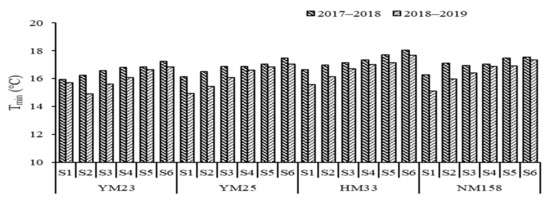
Figure 7.
Change in daily minimum temperature (Tmin) after anthesis on different sowing dates.
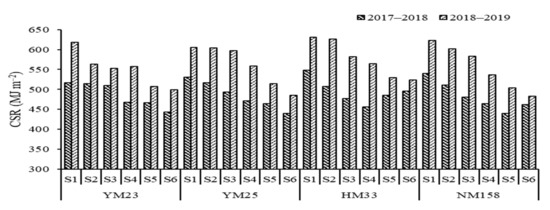
Figure 8.
Change in cumulative solar radiation (CSR) after anthesis on different sowing dates.
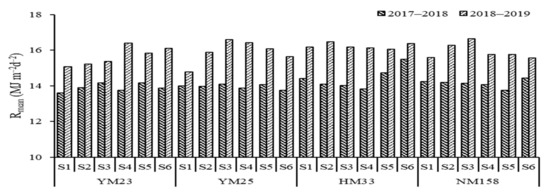
Figure 9.
Change in daily mean solar radiation (Rmean) after anthesis on different sowing dates.
3.2. Effects of Different Treatments on the Starch Content and Falling Number of Wheats
The starch content and the falling number of different wheat varieties showed the same trend under different treatments (Table 1). The sowing date was postponed, and the amylose content (AC) showed a gradual upward trend; the AC values of S2–S6 were higher than those of S1 by 0.23–0.77%, 0.82–1.23%, 1.26–1.75%, 1.61–2.44% and 1.79–2.91%, respectively. The amylopectin content (APC) decreased gradually with the delay in the sowing date; the APC values of S2–S6 were lower than those of S1 by 1.35–2.39%, 2.24–4.46%, 4.35–6.00%, 6.42–7.30% and 7.48–9.38%, respectively. The total starch content (TSC) decreased gradually with the delay in the sowing date, and the TSC values of S2–S6 were lower than those of S1 by 0.96–1.96%, 1.37–3.37%, 2.66–4.48%, 4.06–5.44% and 4.57–6.83%, respectively. The falling number gradually increased with a delay in the sowing date. The falling number increased by 14.19 s for each delayed sowing date.

Table 1.
Effects of temperature and radiation on grain starch content and falling number.
3.3. Effects of Different Treatments on the Pasting Properties of Wheat Starch
The starch gelatinization properties of different wheat varieties showed the same trend under different treatments (Table 2). The peak viscosity (PV) increased gradually with the postponement of the sowing date; as such, the PV values of S2–S6 were higher than those of S1 by 42.5–169.5 cp, 148–318.25 cp, 239–391.25 cp, 316.5–447.5 cp, and 368–539.75 cp, respectively. The trough viscosity (TV) increased gradually with the sowing date, and the TV increased 51.91 cp when one sowing date was delayed. The Breakdown (BD) increased gradually when the sowing date was delayed, exhibiting an increase of 41.37 cp with each delayed sowing date. The final viscosity (FV) increased gradually when the sowing date was delayed, and the FV increased by 100.61 cp with each postponement of the sowing date. The setback (SB) increased gradually when the sowing date was delayed, and the SB increased by 48.71 cp with each postponement of the sowing date.

Table 2.
Effects of temperature and radiation on the gelatinization of wheat starch after anthesis.
3.4. Effects of Different Treatments on Wheat Dough Properties
The dough properties of the different wheat varieties showed the same trend under different treatments (Table 3). The water absorption (WA) increased gradually when the sowing date was delayed, and the average WA increased by 0.62 F. U at each delayed sowing date. The dough development time (DT) increased gradually when the sowing date was delayed, and the DT increased by 0.4 min with each delayed sowing date. The dough stability time (ST) increased gradually when the sowing date was delayed, and the ST increased by 0.28 min per delayed sowing date. The softening of the dough (SD) decreased gradually when the sowing date was delayed, and the SD of each delayed sowing date decreased by 4.89 F. U on average. The farinograph quality number (FQN) increased gradually when the sowing date was delayed, and the FQN increased by 5.41 per delayed sowing date.

Table 3.
Effects of temperature and radiation on wheat dough properties.
3.5. Correlation of Different Temperature and Radiation on starCH and Falling Value of Wheat
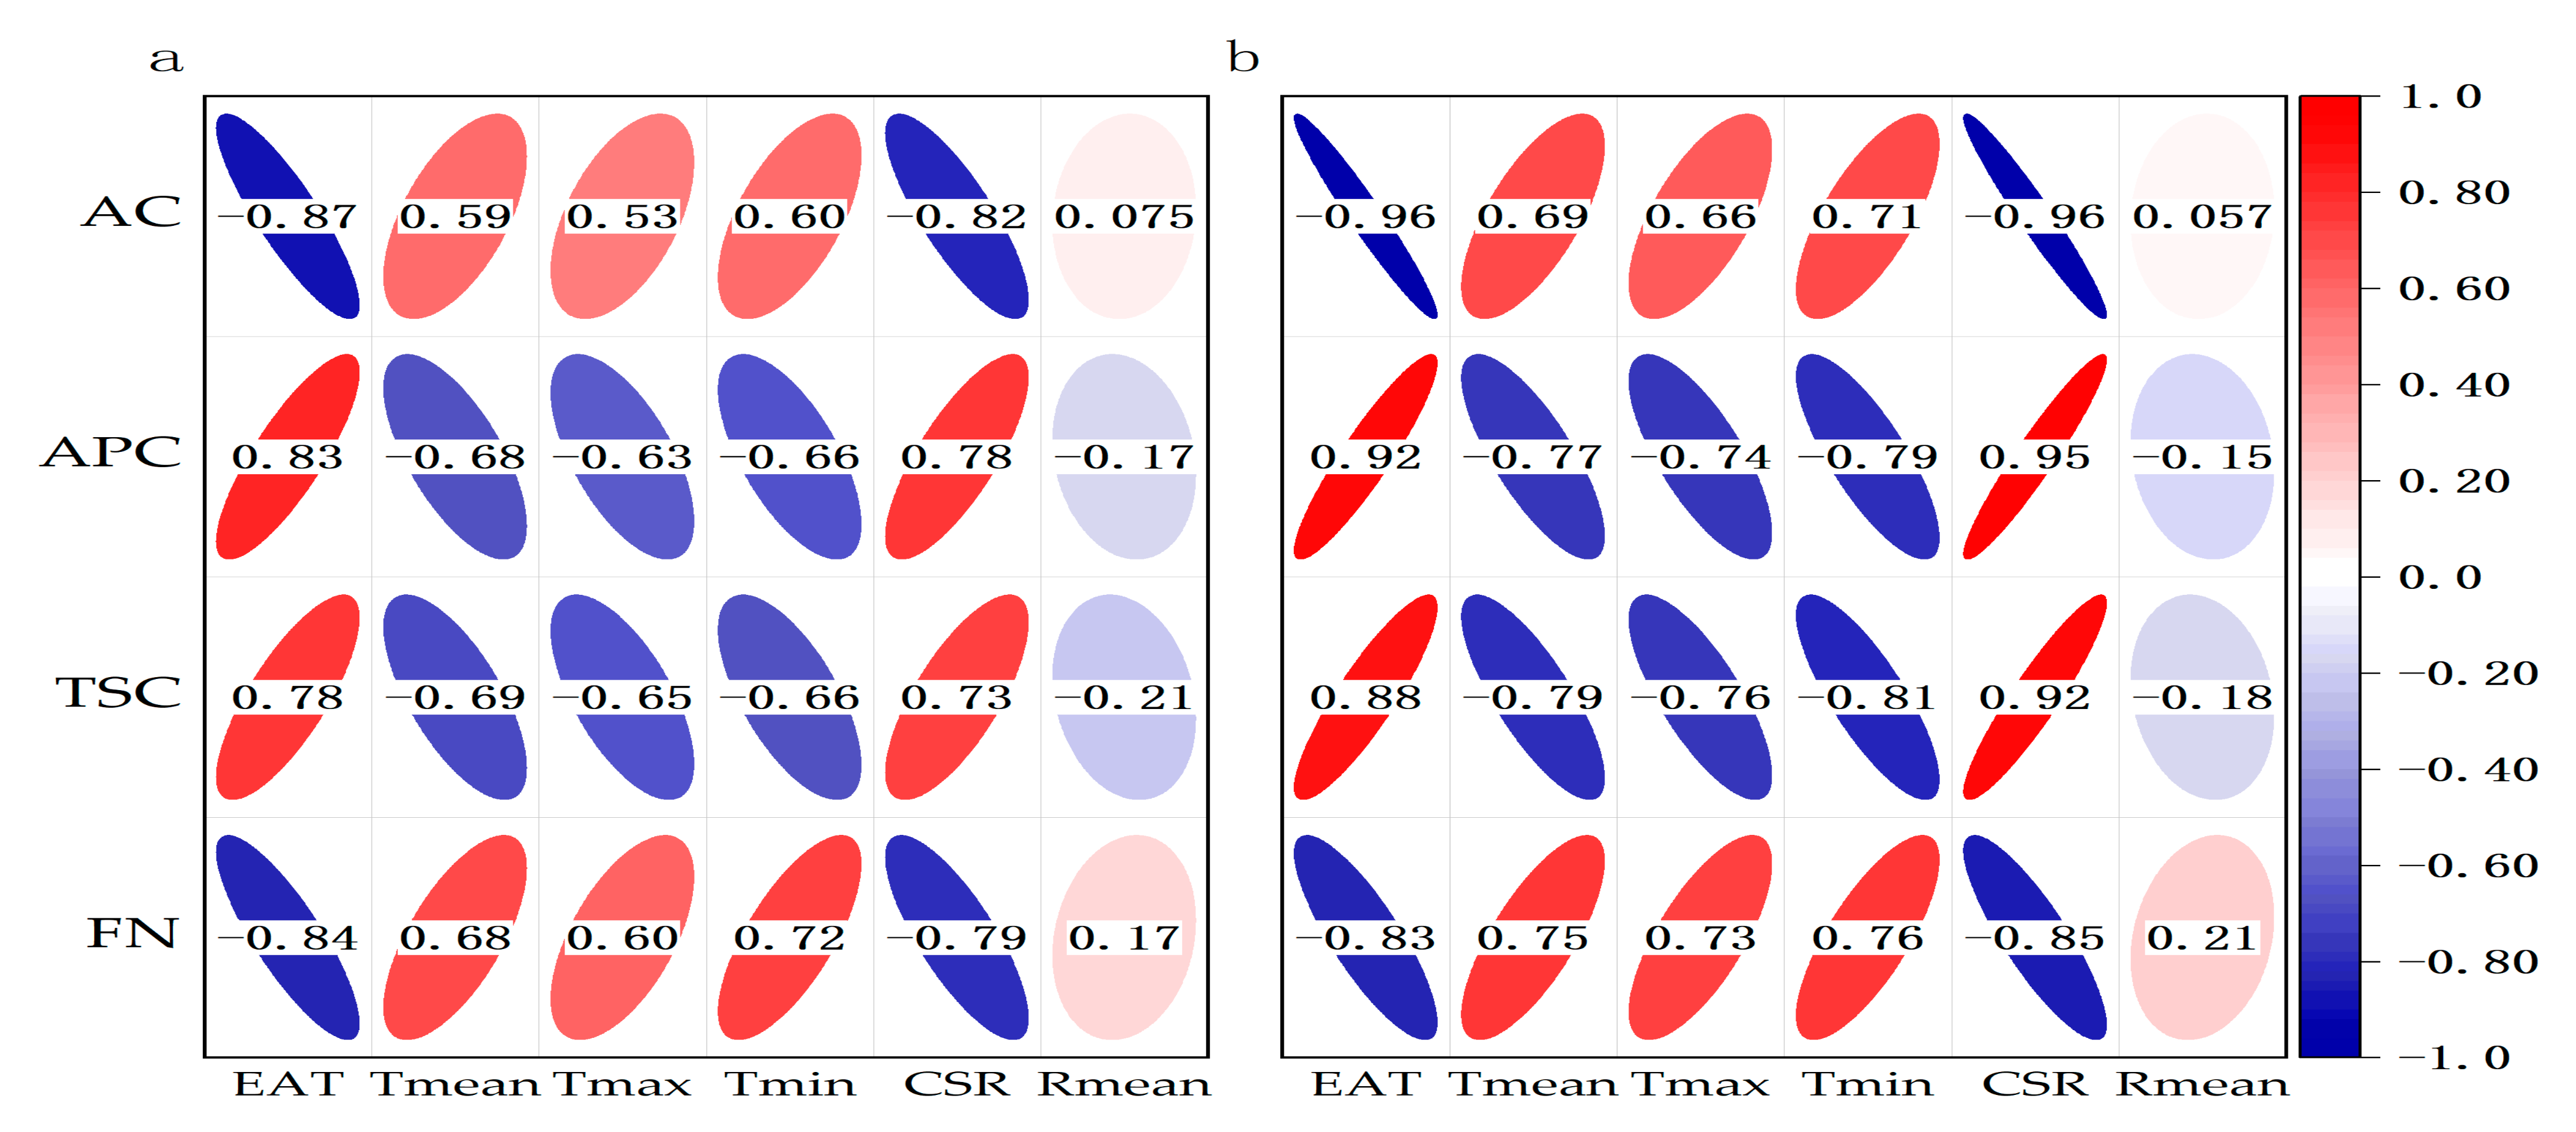
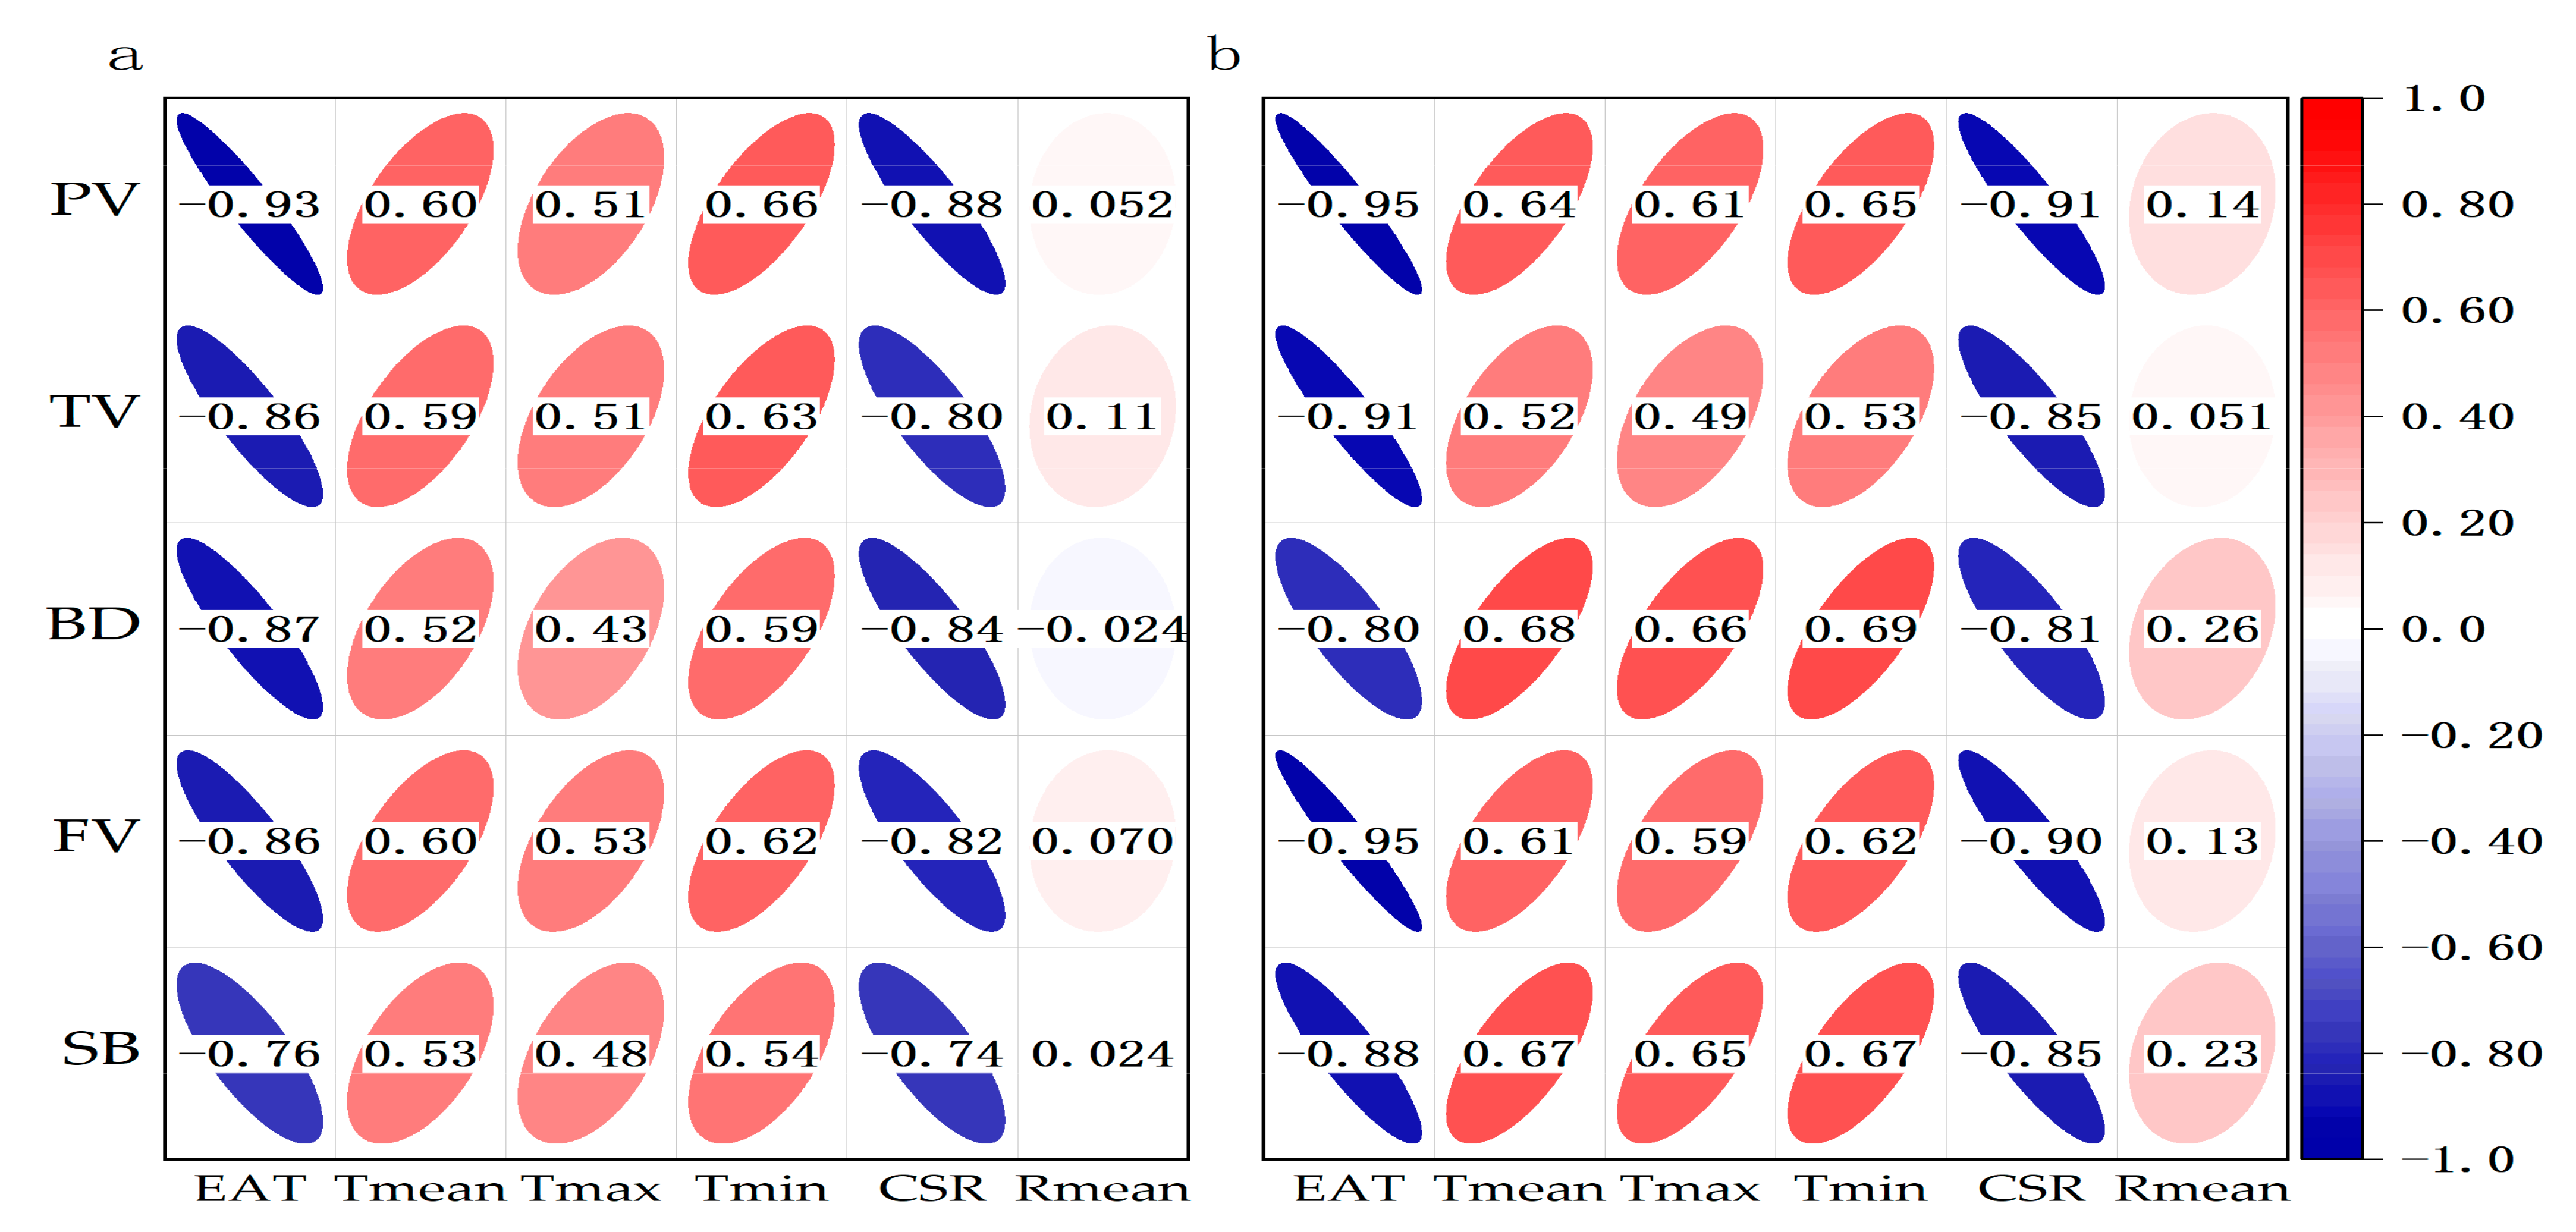
The correlations between starch, temperature, and radiation in different wheat varieties were the same, and the annual trends were also the same (Figure 10 and Figure 11). The amylose content was negatively correlated with EAT and CSR after anthesis and positively correlated with Tmean, Tmax, and Tmin. The amylopectin and total starch contents were positively correlated with EAT and CSR after anthesis and negatively correlated with Tmean, Tmax, and Tmin. The falling number was negatively correlated with EAT and CSR after anthesis and positively correlated with Tmean, Tmax, and Tmin. There was no correlation between starch content and daily mean radiation. The gelatinization viscosity of starch was negatively correlated with EAT and CSR after anthesis, and positively correlated with Tmean, Tmax, and Tmin. There was no correlation between the properties of starch and the average daily solar radiation.
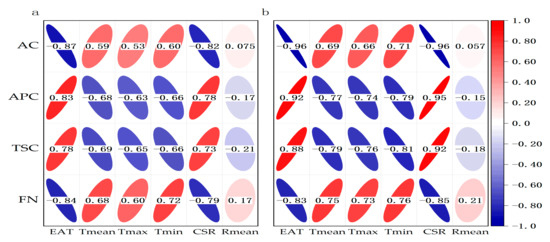
Figure 10.
Correlation of different post-anthesis temperatures and radiation on starch and related properties of wheat. (a): 2017–2018, (b): 2018–2019; EAT: effective accumulated temperature, Tmean: daily mean temperature, Tmax: daily average high temperature, Tmin: daily lowest temperature, CSR: cumulative effective radiation, Rmean: daily mean radiation; AC: amylose content; APC: amylopectin content; FN: falling number; TSC: total starch content. The critical values of the correlation coefficient are r0.05 = 0.404 and r0.01 = 0.5151.
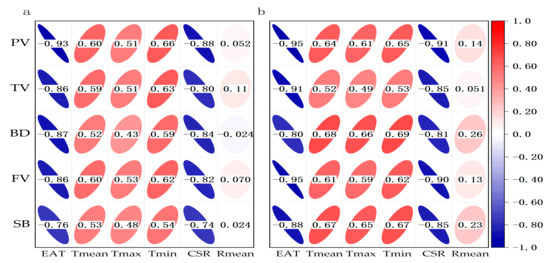
Figure 11.
Correlation of different post-anthesis temperatures and radiation on starch gelatinization properties of wheat. (a): 2017–2018, (b): 2018–2019; EAT: effective accumulated temperature, Tmean: daily mean temperature, Tmax: daily average high temperature, Tmin: daily lowest temperature, CSR: cumulative effective radiation, Rmean: daily mean radiation; PV: peak viscosity; TV: trough viscosity; FV: final viscosity; BD: Breakdown; and SB: Setback. The critical values of the correlation coefficient: r0.05 = 0.404 and r0.01 = 0.5151.
3.6. Correlation between Different Temperature and Radiation on Wheat Dough Properties
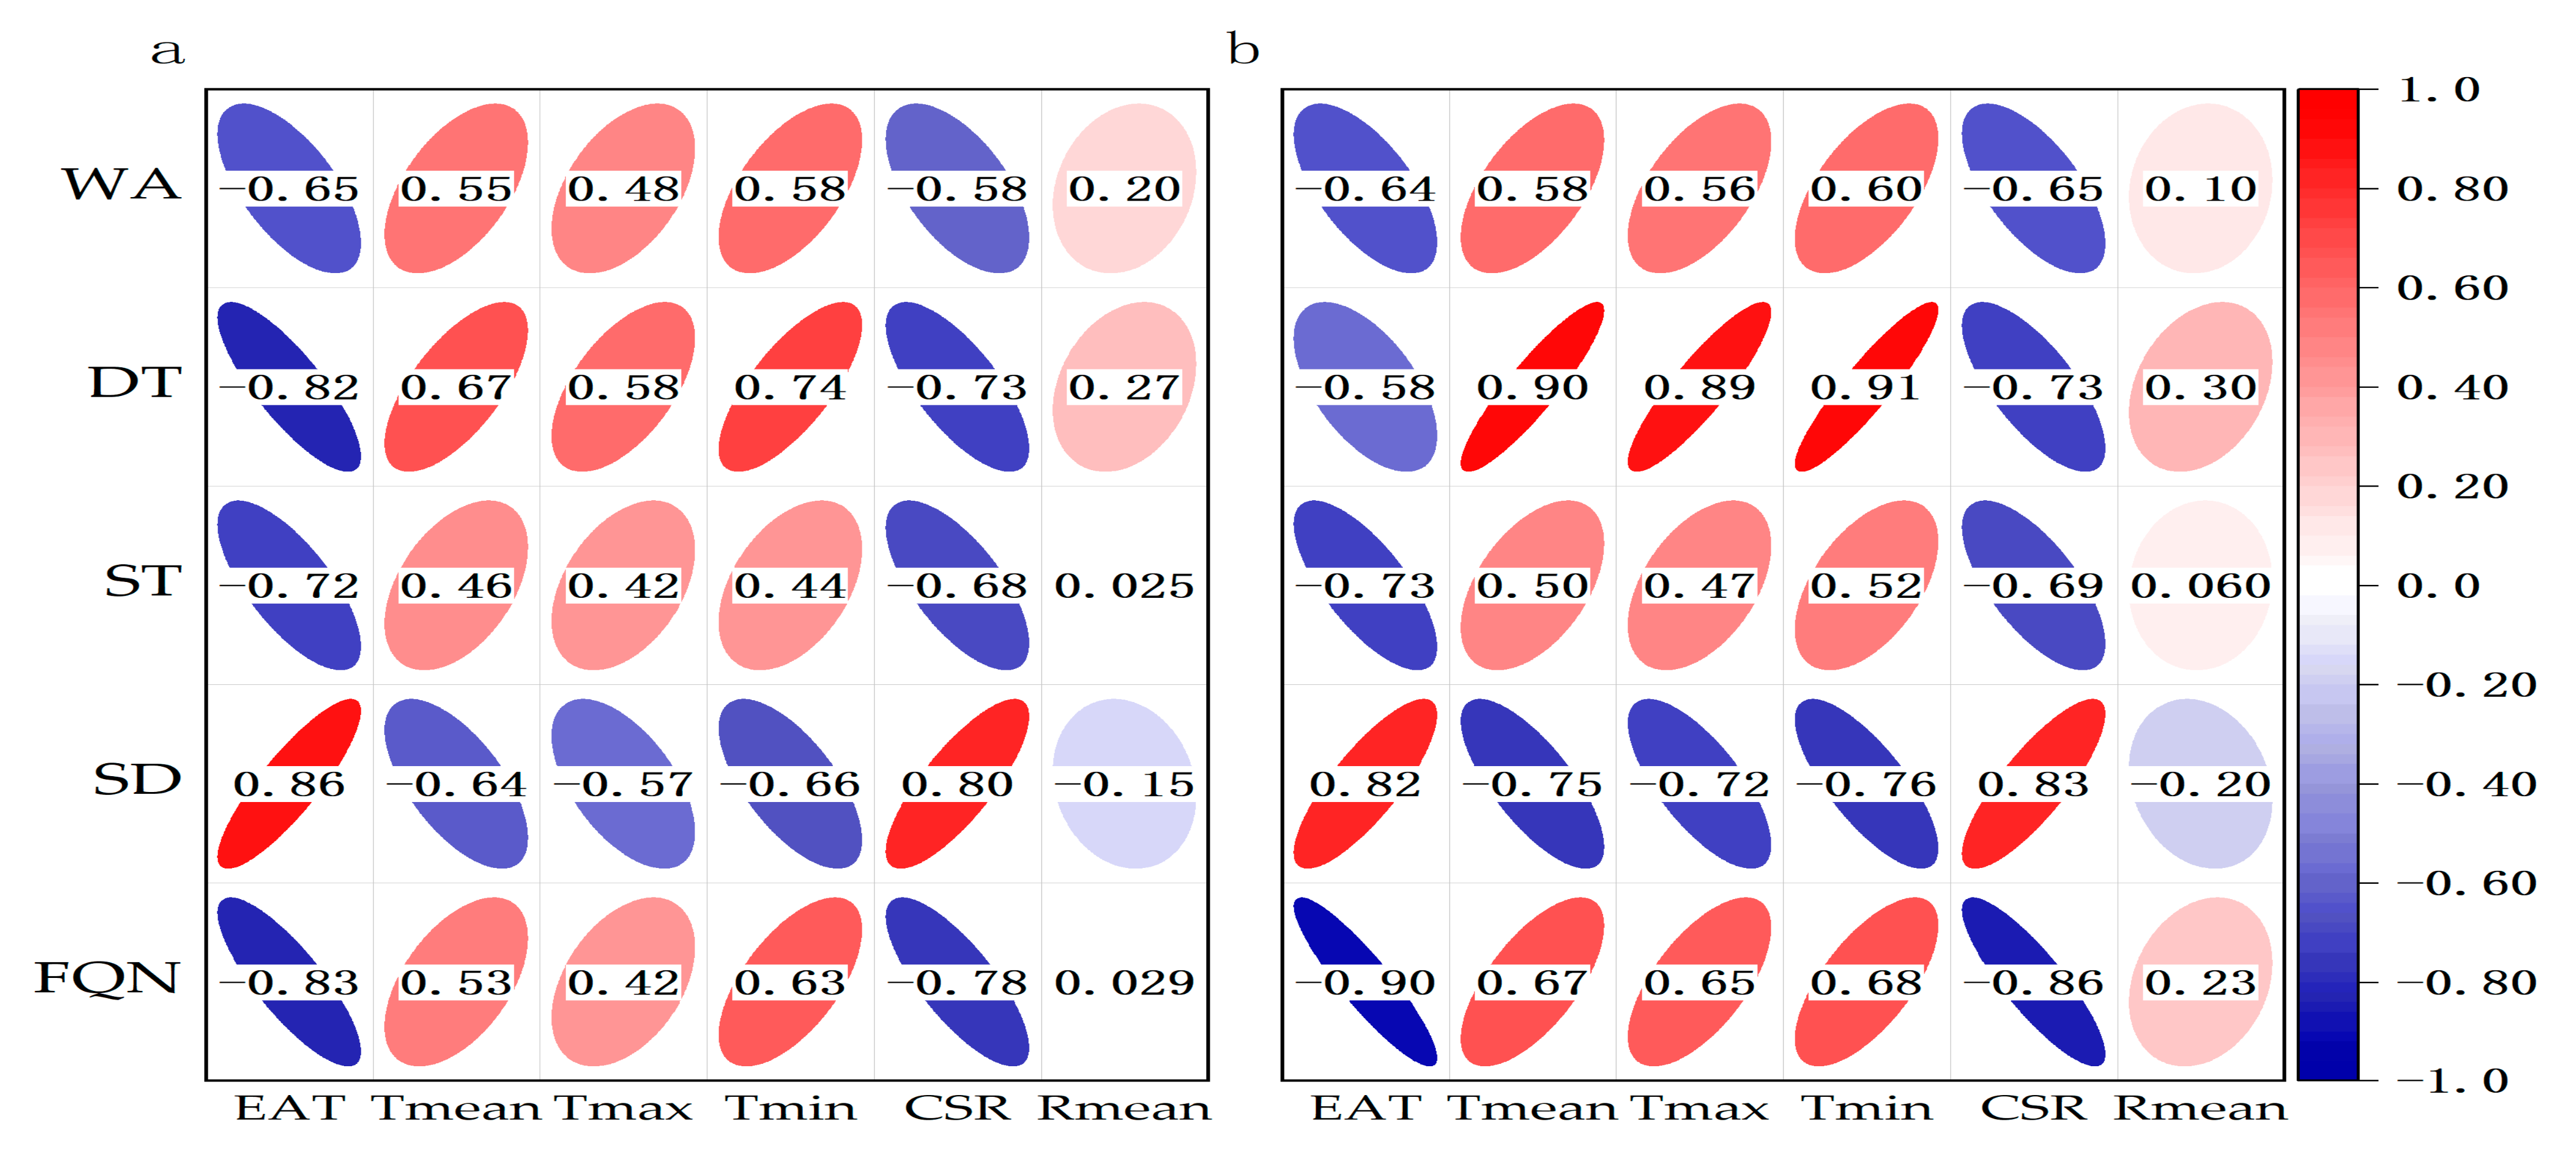
The correlation between the dough properties of different wheat varieties and different temperatures and radiation showed the same trend, and the annual trend was also the same (Figure 12). The water absorption of dough was negatively correlated with EAT and CSR after anthesis and was positively correlated with Tmean, Tmax, and Tmin. The dough development time and water absorption rates were the same. The dough stability time was significantly negatively correlated with EAT and CSR after anthesis, but not with Tmean, Tmax, and Tmin. Dough softening was positively correlated with EAT and CSR after anthesis, and negatively correlated with Tmean, Tmax, and Tmin. The powder quality parameters were negatively correlated with EAT and CSR after anthesis, and positively correlated with Tmean, Tmax, and Tmin.
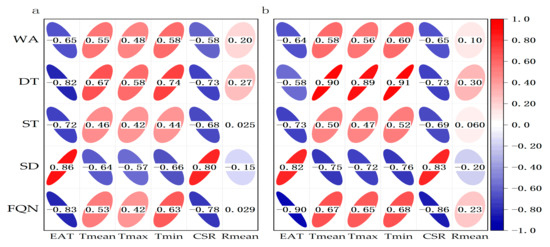
Figure 12.
Correlation of different post-anthesis temperatures and radiation on dough properties of wheat. (a): 2017–2018, (b): 2018–2019; EAT: effective accumulated temperature, Tmean: daily mean temperature, Tmax: daily average high temperature, Tmin: daily lowest temperature, CSR: cumulative effective radiation, Rmean: daily mean radiation; WA: water absorption; DT: development time; ST: stability time; SD: softening of dough; FQN: farinograph quality number. The critical values of the correlation coefficient: r0.05 = 0.404 and r0.01 = 0.5151.
4. Discussion
4.1. Changes in Temperature and Radiation after Anthesis at Different Sowing Dates
Temperature and radiation are the main meteorological factors affecting wheat flour quality, and different temperatures and radiation conditions can be achieved by changing the cultivation methods [26]. In this study, different post-anthesis temperatures and radiation levels were achieved by changing the sowing date, so as to further analyze the effects of post-anthesis temperature and radiation on wheat starch and dough qualities [27,28,29]. Previous studies have shown that as a consequence of the sowing delay, anthesis falls at a different time of the year, when different temperatures and radiance levels occur. A delay in the sowing time shortens the total growth period, reduces the effective accumulated temperature of the total surplus, and increases the average temperature [30]. The results of this study follow those of previous studies, showing that the postponement of the sowing date leads to the shortening of the time from flowering to maturity, and that the number of days at this stage is shortened by 1.5 days per delayed sowing date. When a sowing date is delayed, the number of days after the anthesis of wheat was reduced by 1.5 d; the Tmean increased by 0.32 °C; the EAT decreased by 19 °C d; and the CSR decreased by 19.56 MJ m−2. Thus, the sowing date changes the temperature and radiation levels that correspond to flowering and then maturity. The main reason for this phenomenon may be the postponement of the maturation of late-sowing wheat, so that the maximum temperature from the flowering to maturation of late-sowing wheat is higher than that in the case of early sown wheat, and the increase in temperature accelerates the growth and early senescence of wheat [31]. It is worth noting that, in this study, the daily average radiation change was not significantly different from the sowing date, which may be due to the influence of precipitation and cloudy days, in which the sunshine duration was not continuous. Therefore, changes in the sowing date led to changes in the temperature and radiation after flowering, with the change in temperature being more significant than that of radiation.
4.2. Study on Wheat Starch at Different Temperatures and Radiations
The formation of starch occurs mainly during the filling stage of wheat, and different temperatures and radiation levels affect the activity of amylase and photosynthesis at the filling stage. Some studies have shown that when the temperature is high during the ripening period, the starch content decreases, and the amylose content of some varieties shows no obvious change [32,33]. High temperatures change the time of starch synthesis and lead to an early peak in gene expression during starch synthesis. However, high temperatures have a significant effect on the enhancement of grain α-amylase activity during grain filling, and starch granules are easily hydrolyzed [34]. As a result, in this study, the total starch content of wheat was low, and the amylose content increased [35]. Some studies on the impact of the sowing date have shown that with a delay in the sowing date, the total starch content decreases, whereas the amylose content and final viscosity (FV) increases [36]. The amylose content and proportion of short amylopectin decreases, whereas the proportion of long amylopectin increases, resulting in an increase in the starch gelatinization temperature and gelatinization viscosity [37]. The results are similar to those described above. When the post-anthesis temperature was increased by 0.32 °C, the total starch content decreased by 1.2%, amylopectin content decreased by 1.67%, amylose increased by 0.47%, and the falling number increased by 14.19 s. The gelatinization viscosity of the starch increased with increasing temperature. Some studies have shown that the contents of starch, amylose, and amylopectin tend to decrease under low-light conditions after anthesis, which may be due to the lack of light, leading to low photosynthesis [38]. However, in this study, light was relatively sufficient in the later stages, and the starch content was still low. This may be because temperature is the main factor affecting starch formation, relative to radiation [39]. The total starch content was negatively correlated with the daily mean temperature and positively correlated with the effective accumulated temperature and cumulative solar radiation. Starch gelatinization viscosity was positively correlated with the daily mean temperature and negatively correlated with the effective accumulated temperature and cumulative solar radiation. This may indicate that the starch content and gelatinization properties of starch are not only related to the daily mean temperature, but also to the accumulation of temperature and radiation.
4.3. Study of the Properties of Wheat Dough under Different Temperature and Radiation
The dough quality parameter is an important index for wheat quality evaluation and variety classification, and dough properties are also affected by temperature and radiation. Some studies have shown that the postponement of the sowing time prolongs the development time and stability time of dough, reduces its weakening degree, and improves the comprehensive evaluation value of dough [40,41]. However, owing to the influence of the different varieties, the test results were different. When the post-anthesis temperature is affected by a higher temperature (highest temperature ≥ 28 °C), the daily mean temperature is proportional to the wheat dough strength [42,43]. When the average temperature of the day is lower than 30 °C, the dough strength increases with an increase in temperature, which is beneficial for improving dough properties. When the average temperature of the day is higher than 30 °C, the dough strength, dough development time, and maximum anti-extension resistance decrease [44]. In this study, an increase in the temperature by 0.32 °C increased water absorption by 0.62 F. U, the increased the dough development time by 0.4 min, increased the dough stability time by 0.28 min, decreased the softening of dough by 4.89 F. U, and increased the farinograph quality number by 5.41. Although the materials and methods used were different, the test results were consistent with those reported in the aforementioned studies. In this study, the daily average maximum temperature was below 28 °C; therefore, the daily mean temperature was positively correlated with water absorption, the development time, and stability. This may be due to the increase in temperature, protein content and gluten strength, water absorption of the flour, and processing quality of dough [45,46]. In this study, the dough development and stability times were significantly negatively correlated with the effective accumulated temperature and effective cumulative radiation. It is possible that the accumulation of temperature and radiation is not conducive to improving dough quality. After low-light treatment, the dough development and stability times can be increased, and the softening of the dough can be reduced. However, in this study, there was no correlation between the average daily cumulative radiation after anthesis and the dough properties, which may be because the temperature affected wheat photosynthesis at the filling stage, such that the higher solar radiation during the day could not be fully used. It is also possible that on overcast and rainy days after flowering, the daily average solar radiation after flowering at different sowing dates cannot produce a better trend. This series shows that relative to temperature, radiation may not be the main factor affecting wheat dough quality.
5. Conclusions
By setting different sowing dates, the daily mean temperature after anthesis, daily maximum temperature, and daily minimum temperature were gradually increased. An increase in the daily mean temperature decreased the total starch content and increased the amylose content of the wheat. The increase in the daily mean temperature decreased the starch content but improved the gelatinization viscosity of wheat starch and the processing quality of dough. The starch gelatinization of wheat and the processing quality of dough are not only related to the daily mean temperature, but also to the accumulation of temperature and radiation. The accumulation of temperature and radiation is less beneficial to the gelatinization properties of starch and the development and stability of the starch dough. Compared with radiation, temperature is the most important meteorological factor affecting wheat starch and dough properties. Therefore, changes in temperature and radiation in the future can be simulated by changing the sowing date, which can be used to adjust the starch and dough properties of wheat.
Author Contributions
Conceptualization, H.W.; methodology, N.Z.; validation, H.Z. and B.G.; for- mal analysis, Z.Z.; investigation, Z.Z.; resources, Z.Z. and D.J.; writing—original draft preparation, Z.Z. and K.X.; writing—review and editing, Z.Z., D.W. and Z.X.; supervision, H.Z. and H.W.; project administration, H.Z. All authors have read and agreed to the published version of the manuscript.
Funding
This research was funded by the Jiangsu Demonstration Project of Modern Agricultural Machinery Equipment and Technology (NJ2020-58, NJ2019-33, NJ2021-63); Jiangsu Province Key RD Program BE2022338.
Data Availability Statement
Not applicable.
Acknowledgments
We are grateful for grants from the Jiangsu Demonstration Project of Modern Agricultural Machinery Equipment and Technology, Jiangsu Province Key RD Program, Jiangsu Key Laboratory of Crop Cultivation and Physiology, Innovation Center of Rice Cultivation Technology in Yangtze Valley, Ministry of Agriculture, Co-Innovation Center for Modern Production Technology of Grain Crops, Agricultural College Yangzhou University. We would like to thank the editor and the reviewers for their useful feedback that improved this paper.
Conflicts of Interest
The authors declare no conflict of interest.
References
- Ma, J.; Xiao, Y.; Hou, L.; He, Y. Combining Protein Content and Grain Yield by Genetic Dissection in Bread Wheat under Low-Input Management. Foods 2021, 10, 1058. [Google Scholar] [CrossRef]
- Hawkins, E.; Chen, J.; Watson-Lazowski, A.; Ahn-Jarvis, J.; Barclay, J.E.; Fahy, B.; Hartley, M.; Warren, F.J.; Seung, D. STARCH SYNTHASE 4 is required for normal starch granule initiation in amyloplasts of wheat endosperm. New Phytol. 2021, 230, 2371–2386. [Google Scholar] [CrossRef]
- Dankwa, K.O.; Liu, Y.J.; Pu, Z.E. Evaluating the nutritional and sensory quality of bread, cookies and noodles made from wheat supplemented with root tuber flour. Br. Food J. 2017, 4, 895–908. [Google Scholar] [CrossRef]
- Zhang, R.; Ma, S.; Li, L.; Zhang, M.; Tian, S.; Wang, D. Comprehensive utilization of corn starch processing by-products: A review. Grain Oil Sci. Technol. 2021, 4, 89–107. [Google Scholar] [CrossRef]
- Lionetto, F.; Maffezzoli, A.; Ottenhof, M.A.; Farhat, I.A.; Mitchell, J.R. Ultrasonic investigation of wheat starch retrogradation. J. Food Eng. 2006, 75, 258–266. [Google Scholar] [CrossRef]
- Chipón, J.; Ramírez, K.; Morales, J.; Díaz-Calderón, P. Rheological and Thermal Study about the Gelatinization of Different Starches (Potato, Wheat and Waxy) in Blend with Cellulose Nanocrystals. Polymers 2022, 14, 1560. [Google Scholar] [CrossRef] [PubMed]
- Crosbie, G.B. The relationship between starch swelling properties, paste viscosity and boiled noodle quality in wheat flours. J. Cereal Sci. 1991, 13, 145–150. [Google Scholar] [CrossRef]
- Liu, R.; Wei, Y.M.; Xing, Y.N.; Zhang, B.; Zhang, Y.Q. Review on the relationship between starch and noodle quality in wheat. J. Triticeae Crops 2013, 33, 1058–1063. [Google Scholar]
- Noda, T.; Tohnooka, T.; Taya, S.; Suda, I. Relationship between physicochemical properties of starches and white salted noodle quality in japanese wheat flours. Cereal Chem. 2001, 78, 395–399. [Google Scholar] [CrossRef]
- Vignola, M.B.; Baroni, V.; Pérez, G.T. Genotypic and environmental effects on starch properties of Argentinean wheat flours. Starch—Stärke 2016, 68, 1065–1072. [Google Scholar] [CrossRef]
- Parmesan, C.; Yohe, G. A globally coherent fingerprint of climate change impacts across natural systems. Nature 2003, 421, 37–42. [Google Scholar] [CrossRef]
- Ren, G.Y.; Guo, J.; Xu, M.Z.; Chu, Z.Y.; Liu, X.N. Climate changes of mainland china over the past half century. J. Meteorol. Res. 2005, 63, 942–956. [Google Scholar]
- Jun, K. Climate Change and Drought in Jiangsu Province. Ph.D. Thesis, Nanjing University of Information Science and Technology, Nanjing, China, 2008. [Google Scholar]
- Spiertz, J. The influence of temperature and light intensity on grain growth in relation to the carbohydrate and nitrogen economy of the wheat plant. Neth. J. Agric. Sci. 1977, 25, 182–197. [Google Scholar] [CrossRef]
- Liu, P.; Guo, W.; Jiang, Z.; Pu, H.; Little, C.R. Effects of high temperature after anthesis on starch granules in grains of wheat (Triticum aestivum L.). J. Agric. Sci. 2011, 149, 159–169. [Google Scholar] [CrossRef]
- Kim, K.H.; Kim, J.Y. Understanding Wheat Starch Metabolism in Properties, Environmental Stress Condition, and Molecular Approaches for Value-Added Utilization. Plants 2021, 10, 2282. [Google Scholar] [CrossRef] [PubMed]
- Zahedi, M.; Sharma, R.; Jenner, C.F. Effects of high temperature on grain growth and on the metabolites and enzymes in the starch-synthesis pathway in the grains of two wheat cultivars differing in their responses to temperature. Funct. Plant Biol. 2003, 30, 291–300. [Google Scholar] [CrossRef] [PubMed]
- Zhang, W.; Zhao, Y.; Li, L.; Xu, X.; Huang, Z. The effects of short-term exposure to low temperatures during the booting stage on starch synthesis and yields in wheat grain. Front. Plant Sci. 2021, 12, 684784. [Google Scholar] [CrossRef] [PubMed]
- Liu, Y.Y.; Zhang, H.C.; Jiang, D.; Dai, Q.G.; Huo, Z.Y.; Ke, X.U. The influence of sowing date on different gluten wheat starch viscosity characteristics. Acta Agric. Boreali-Sin. 2009, 24, 5. [Google Scholar]
- Katyal, M.; Singh, N.; Kaur, S. Physicochemical, thermal, and pasting properties of starch separated from various timely sown and delayed sown (heat stressed) wheat of different wheat lines/variety. Starch 2022, 74, 5–6. [Google Scholar] [CrossRef]
- Bo, C.; Fang, C.; Sheng, D.L.; Ai, F.L.; Dun, G.C.; Li, S.Z. Effects of High Temperature Stress During Grain-filling Stages on Protein Components and Dough Mixing Properties in Different Wheat Cultivars. J. Nucl. Agric. Sci. 2020, 34, 642–649. [Google Scholar]
- Li, W.; Yan, S.; Yin, Y.; Wang, Z. Starch granule size distribution in wheat grain in relation to shading after anthesis. J. Agric. Sci. 2010, 148, 183–189. [Google Scholar] [CrossRef]
- Hua, S.L.; Hui, S.; Li, P.Z.; Chang, P.Z.; Bin, S.P.; Qing, S. Effects of Temperature and Illumination Time on Grain Paste Property in Different Wheat Cultivars. J. Chin. Cereals Oils Assoc. 2012, 27, 5. [Google Scholar]
- He, Q.H.; Xie, Y. Study on Climatological calculation method of Total Solar radiation in China. J. Nat. Resour. 2010, 25, 308–319. [Google Scholar]
- Jin, Y.H.; Zhang, K.L.; Zhang, X.C.; Du, J.X. Determination of amylose and amylopectin in wheat and wheat malt by dual wavelength method. Chin. J. Cereals Oils 2009, 24, 137–140. [Google Scholar]
- Demotes-Mainard, S.; Jeuffroy, M.H. Incorporating Radiation and Nitrogen Nutrition into a Model of Kernel Number in Wheat. Crop Sci. 2001, 41, 415–423. [Google Scholar] [CrossRef]
- Zhang, Z.; Zhou, N.; Xing, Z.; Liu, B.; Tian, J.; Wei, H.; Gao, H.; Zhang, H. Effects of Temperature and Radiation on Yield of Spring Wheat at Different Latitudes. Agriculture 2022, 12, 627. [Google Scholar] [CrossRef]
- Li, X.D.; Zhang, D.Q.; Wang, H.F.; Shao, Y.H.; Fang, B.T.; Yue, J.Q.; Ma, F.J. Impact of temperature increment before the over-wintering period on growth and development and grain yield of winter wheat. Chin. J. Appl. Ecol. 2015, 26, 839. [Google Scholar]
- Xing, Z.P.; Pei, W.U.; Zhu, M.; Qian, H.J.; Hu, Y.J.; Guo, B.W.; Wei, H.Y.; Xu, K.; Huo, Z.Y.; Dai, Q.G. Temperature and solar radiation utilization of rice for yield formation with different mechanized planting methods in the lower reaches of the Yangtze River, China. J. Integr. Agric. 2017, 16, 1923–1935. [Google Scholar] [CrossRef]
- Yang, H.B.; Xu, C.Z.; Li, C.G. Growth and Required Accumulated Temperature of Winter Wheat under Different Sowing Time. Chin. J. Agrometeorol. 2009, 30, 201–203. [Google Scholar]
- Porter, J.R.; Gawith, M. Temperatures and the growth and development of wheat: A review. Eur. J. Agron. 1999, 10, 23–36. [Google Scholar] [CrossRef]
- Kohyama, K.; Sasaki, T.; Yasui, T.; Matsuki, J. Effects of environmental temperature on structure and gelatinization properties of wheat starch. Cereal Chem. 2003, 80, 476–480. [Google Scholar]
- Yong, Z.; Hui, H.Y.; Li, P.R.; Rong, Z.; Yu, R.D.; Xu, R.Y.; Fei, X. Physicochemical Properties of Wheat Starch under Different Sowing Dates. Starch—Stärke 2022, 74, 2100290. [Google Scholar] [CrossRef]
- Li, C.Y.; Zhang, R.Q.; Fu, K.Y.; Li, C.; Li, C. Effects of high temperature on starch morphology and the expression of genes related to starch biosynthesis and degradation. J. Cereal Sci. 2017, 73, 25–32. [Google Scholar] [CrossRef]
- Lu, H.; Hu, Y.; Wang, C.; Liu, W.; Ma, D. Effects of high temperature and drought stress on the expression of gene encoding enzymes and the activity of key enzymes involved in starch biosynthesis in wheat grains. Front. Plant Sci. 2019, 10, 1414. [Google Scholar] [CrossRef]
- Singh, S.; Gupta, A.K.; Gupta, S.K.; Kaur, N. Effect of sowing time on protein quality and starch pasting characteristics in wheat (Triticum aestivum L.) genotypes grown under irrigated and rain-fed conditions. Food Chem. 2010, 122, 559–565. [Google Scholar] [CrossRef]
- Hu, Y.; Xue, J.; Li, L.; Cong, S.; Yu, E.; Xu, K.; Zhang, H. Influence of dynamic high temperature during grain filling on starch fine structure and functional properties of semi-waxy japonica rice. J. Cereal Sci. 2021, 101, 103319. [Google Scholar] [CrossRef]
- Liu, X.; Cai, R.; Li, Y.; Zhang, M.; Yang, M.; Zhang, Y. Starch component characteristics and physicochemical properties in wheat grains with different amylose contents in relation to low light after anthesis. Starch–Stärke 2018, 70, 1700050. [Google Scholar] [CrossRef]
- Deng, N.; Ling, X.; Sun, Y.; Zhang, C.; Fahad, S.; Peng, S.; Cui, K.; Nie, L.; Huang, J. Influence of temperature and solar radiation on grain yield and quality in irrigated rice system. Eur. J. Agron. 2015, 64, 37–46. [Google Scholar] [CrossRef]
- Bonfil, D.J.; Abbo, S.; Svoray, T. Sowing date and wheat quality as determined by gluten index. Crop Sci. 2015, 55, 2294–2306. [Google Scholar] [CrossRef]
- Fan, J.; Zhang, B.; Lv, G.; Gao, D.; Wu, L.; Lu, C.; Wu, H.; Zhang, Y.; Cheng, S. Effects of sowing date on main quality characters and flour mass parameters of wheat. Jiangsu Agric. Sci. 2003, 31, l0–l12. [Google Scholar]
- Yao, Y.; Wang, X.; Chen, J.; Yan, H.; Mu, Q.; Liu, P.; Tian, X. Bidirectional effect of warming during filling on grain setting and quality of wheat and its relationship with nitrogen application rate. J. Triticeae Crops 2015, 35, 860–866. [Google Scholar]
- Williams, R.M.; Diepeveen, D.A. Evaluating the impact of rainfall and temperature on wheat dough strength in western Australia. Cereal Chem. 2019, 96, 370–379. [Google Scholar] [CrossRef]
- Stone, P.J.; Savin, R.; Wardlaw, I.F.; Nicolas, M.E. The influence of recovery temperature on the effects of a brief heat shock on wheat. i. grain growth. Funct. Plant Biol. 1995, 22, 945–954. [Google Scholar] [CrossRef]
- Turksoy, S.; Erturk, M.Y.; Kokini, J. Behavior of semolina, hard, soft wheat flour dough at different aging times and temperatures through laos properties and molecular interactions of proteins. J. Food Eng. 2021, 301, 110549. [Google Scholar] [CrossRef]
- Blumenthal, C.S.; Barlow, E.W.R.; Wrigley, C.W. Growth environment and wheat quality: The effect of heat stress on dough properties and gluten proteins. J. Cereal Sci. 1993, 18, 3–21. [Google Scholar] [CrossRef]
Disclaimer/Publisher’s Note: The statements, opinions and data contained in all publications are solely those of the individual author(s) and contributor(s) and not of MDPI and/or the editor(s). MDPI and/or the editor(s) disclaim responsibility for any injury to people or property resulting from any ideas, methods, instructions or products referred to in the content. |
© 2023 by the authors. Licensee MDPI, Basel, Switzerland. This article is an open access article distributed under the terms and conditions of the Creative Commons Attribution (CC BY) license (https://creativecommons.org/licenses/by/4.0/).

