Article

Response of African Sorghum Genotypes for Drought Tolerance under Variable Environments

1
African Centre for Crop Improvement, School of Agricultural, Earth and Environmental Sciences, College of Agriculture, Engineering and Sciences, University of KwaZulu-Natal, Private Bag X01, Scottsville, Pietermaritzburg 3209, South Africa
2
Department of Plant Science, Institute for Agricultural Research Samaru, Ahmadu Bello University Zaria, PMB 1044, Kaduna 810211, Nigeria
3
International Maize and Wheat Improvement Center (CIMMYT), AfricaRice Sahel Regional Station, BP 96, Saint-Louis 32001, Senegal
4
Limpopo Department of Agriculture and Rural Development, Agriculture Regulatory and Technology Development, Crop Science Directorate, Towoomba Research Centre, Private Bag X1615, Bela-Bela 0480, South Africa
5
Department of Crop Science, Faculty of Agriculture, University of Life Sciences “King Michael I” from Timișoara, Calea Aradului 119, 300645 Timișoara, Romania
*
Author to whom correspondence should be addressed.
Agronomy 2023, 13(2), 557; https://doi.org/10.3390/agronomy13020557
Submission received: 2 January 2023 / Revised: 13 February 2023 / Accepted: 14 February 2023 / Published: 15 February 2023

Abstract

:
Sorghum (Sorghum bicolor (L.) Moench) is the main food staple for millions of people in Sub-Saharan Africa (SSA) and Asia. Sorghum is relatively drought tolerant and cultivated in arid and semi-arid regions under rain-fed production. However, severe drought stress often leads to crop loss and declined productivity. The development and deployment of high-yielding and drought-adapted genotypes is a cost-effective strategy for sustainable sorghum production globally. The objective of this study was to determine drought tolerance and genotype-by-environment interaction (GEI) effects on grain yields of a population of African sorghum genotypes to identify high-yielding and drought-adapted genotypes for direct production and also for use in breeding programs. Two hundred and twenty-five sorghum genotypes were evaluated under non-stressed (NS), pre-anthesis drought stress (PreADS), and post-anthesis drought stress (PoADS) conditions under field and greenhouse environments using a 15 × 15 alpha lattice design in two replicates. The three water regimes and two environments resulted in six testing environments. Data were collected on grain yield and drought tolerance parameters, and additive main effect and multiplicative interaction (AMMI) analysis were computed. The mean grain yield under NS, PreADS, and PoADS were 3.70, 1.76, and 2.58 t/ha, in that order. The best genotypes adapted to non-stressed environments were G09, and G109, whereas G114 and G56 were suitable for non-stressed and stressed conditions. G72 and G75 displayed the best performance in PreADS conditions only, whereas genotypes G210 and G12 were identified as high performers under PoADS only. The AMMI analysis revealed that genotype (G), environment (E), and GEI were significant (p < 0.05), which accounted for 38.7, 44.6, and 16.6% of the total explained variation in grain yield. AMMI 4 was the best-fitting model for grain yield. Based on AMMI 4 and the Best Linear Unbiased Estimates (BLUPs) calculations, genotypes G119 and G127 with a grain yield of 5.6 t/ha and 6.3 t/ha were selected as being suitable for non-stressed conditions. Genotypes G8 and G71 with BLUPs of 2.5 t/ha and 2.6 t/ha were best-suited for pre-anthesis drought stress conditions, whereas genotypes G115 and G120 with BLUPs of 4.2 t/ha and 4.3 t/ha are recommended for post-anthesis drought-prone environments, respectively. The identified sorghum genotypes are recommended for production in dry agro-ecologies of sub-Saharan Africa characterized by pre-and-post anthesis drought stress. In addition, the identified genotypes are valuable genetic resources to develop novel drought-tolerance material.

1. Introduction

Sorghum (Sorghum bicolor L.) is a highly valued cereal crop native to Sub-Saharan Africa (SSA) and has been cultivated for centuries [1]. Globally, sorghum is the fifth most important and widely cultivated cereal crop after maize, wheat, rice, and barley. It is a staple food in the drier parts of Africa, China, and India [2]. Sorghum is Africa’s second most important cereal in terms of area harvested (28.1 million hectares) preceded by maize with 42.5 million hectares and followed by rice with 15.8 million hectares [2]. In terms of yield, sorghum is the third most important cereal crop in Africa with 26.3 million metric tonnes after maize (96.6 million metric tonnes) and rice (37.2 million metric tonnes) [2]. The grains are an important food source that is processed into a variety of traditional cuisines such as couscous, porridge, and semi-leavened bread [3,4]. Sorghum is a major component in the flour blend that is used to produce gluten-free flour with a low glycemic index that is rich in iron and zinc, vitamin B6, vitamin B3 (niacin), magnesium, phosphorus, fiber, unsaturated fats, and protein [1,5].
Sorghum’s nutrient profile makes it appealing to the food industry and a food of choice among health-concerned consumers due to its gluten- and allergen-free nature. Furthermore, the crop is used to develop various feed products for livestock, including pigs, poultry, and cattle [6]. In addition, grains are widely used to prepare local beers and beverages (3). According to Tenywa et al., [7] there is an increased consumption of sorghum and sorghum-derived products in SSA and Asia, which has rendered the crop a staple food contributing to about 70% of the daily calorie requirements.
The world’s largest sorghum producers are the USA, with an annual grain production of 8.7 million tons, Nigeria (6.9 million tons), Ethiopia (5.3 million tons), and Sudan (3.7 million tons) [2]. In 2021, continental Africa produced about 26.2 million tons from 28.1 million hectares of land, resulting to an average yield of 0.93 t/ha, which is lower than the world average of 1.45 tons/ha and the 4.58 tons/ha achieved in the USA [2]. The lower yields in SSA are attributed to abiotic stresses (e.g., drought stress and poor soil fertility [1] and biotic factors e.g., anthracnose caused by Colletotrichum graminicola (Ces.) Wilson [8], stem borer (Chilo partellus (Swinhoe)), leaf blight (Exserohilum turcicum (Pass.) Leo and Suggs.) [9], and the parasitic weed (Striga hermonthica (Del.) Benth) [10]. The cultivation of susceptible varieties to various biotic and abiotic stresses exacerbates yield losses and poor yield gains of the crop in the region.
Sorghum is a relatively drought-tolerant crop, making it an ideal candidate to mitigate against the risks of crop loss posed by climate change [6,11,12,13,14]. Drought stress is the most yield-limiting factor for sorghum production in SSA [12,14]. For example, drought caused yield losses of 36% and 55% during vegetative and reproductive growth stages, respectively [15]. Pre-flowering drought stress reduced grain yield of sorghum by more than 40% [16], whereas post-flowering drought stress caused grain yield losses by 50 to 90% [17]. Yield-component traits such as the number of grains per panicle and seed size are reduced by drought stress [14,18]. Drought stress occurring during the critical growth stages of the crop, including pre- and-post anthesis, has a detrimental effect on grain quality [16,19]. Surveys in Ethiopia, Burkina Faso, and Nigeria indicated that severe drought during the pre- and post-flowering growth stage is a major sorghum production constraint [4,13,20]. As a result, concerted breeding efforts are required to develop drought-tolerant cultivars to urgently mitigate the effects of drought stress and improve sorghum production in SSA.
Phenotypic and genetic analysis of African sorghum genetic resources revealed wide diversity for multiple breeding utilities, including drought tolerance [21,22,23,24,25]. The extensive diversity in the cultivated sorghum germplasm will aid the selection of contrasting genotypes for specific and broad adaptation. However, the lack of information on the drought response of African sorghum genotypes, especially their adaptation to the adverse growing conditions in semi-arid regions of SSA, has limited the recommendation of improved varieties with desirable profiles and drought-resilience.
Genotype-by-environment interaction (GEI) is the differential response in the performance of genotypes grown in multiple environments [26]. Its analysis is an essential step for cultivar recommendation. To quantify the effects of genotype, environment, and GEI, several statistical methods are used, including the additive main effects and multiplicative interaction (AMMI) and genotype-by-environment (GGE) biplots [26,27,28,29]. Of the two methods, AMMI analysis is recommended as the most effective due to its ability to illustrate the complex interaction between genotypes and environments accurately and graphically [27]. AMMI has been applied successfully to understand genotype-by-environment reactions in sorghum which allowed the identification of suitable genotypes for a wide range of environments [16,30,31]. The GEI of African sorghum genotypes under drought-stress environments can aid the efficient selection and recommendation of the best-suited genotypes for multiple purposes.
Drought stress under rain-fed agricultural systems has been hampering sorghum productivity in SSA and Asia. This has prompted research collaboration by the International Crops Research Institute for the Semi-Arid Tropics (ICRISAT) and various National Agricultural Research Systems (NARS) under different projects such as the International Sorghum and Millet Program (INTSORMIL). Pre-breeding and breeding programs were initiated to develop and recommend drought-tolerant sorghum varieties [32,33,34]. As a result, valuable sorghum genetic resources, including historic accessions, wild relatives, landraces, and improved breeding lines, were collected and conserved in national gene banks [25,32,33]. These collections are yet to be exhaustively characterized to identify germplasm exhibiting various essential and winning traits. Furthermore, there is a need for a rigorous evaluation of African sorghum germplasm in drought-stricken environments to aid in recommending drought-adapted genotypes for cultivation and breeding in arid and semi-arid environments of SSA. Therefore, the objective of this study was to determine drought tolerance and genotype-by-environment interaction (GEI) effects on the grain yield of a population of African sorghum genotypes to identify high-yielding and drought-adapted genotypes for production and breeding.

2. Materials and Methods

2.1. Plant Materials

Two hundred and twenty-five (225) sorghum genotypes assembled from diverse origins were used for the study. These comprised 235 landraces and 52 elite lines from the International Crops Research Institute for the Semi-arid Tropics-Kano (ICRISAT-KN); 15 registered cultivars, 22 elite lines, and 83 landraces from the Institute for Agricultural Research (IAR), Samaru, Nigeria; nine elite lines from the African Centre for Crop Improvement (ACCI) in South Africa; and 21 genotypes from the United States Department of Agriculture, Agricultural Research Service, National Plant Germplasm System (USDA-ARS, NPGS). The names, codes, pedigree information, and genotype sources of origin are presented in Supplementary Materials Table S1.

2.2. Experimental Sites

The experiments were conducted at the University of KwaZulu-Natal’s Ukulinga Research and Training Farm (29°24′ E, 30°24′ S, altitude 845 m.a.s.l.) and Controlled Environment Facility (CEF) in Pietermaritzburg, South Africa (29°62′62″ S; 30°40′34″ E). Pietermaritzburg is characterized by warm to hot summers with a mean monthly maximum temperature of 26.4 °C in February, whereas winters are mild with occasional frost and a mean monthly minimum temperature of 8.8 °C in July [35]. The glasshouse experiment was designed to resemble those of a warm subtropical climate; therefore, the meteorological conditions in the CEF were semi-controlled and the temperatures were set at ~18/33 °C, day/night, and the relative humidity ranging between 60 and 80%.

2.3. Experimental Design and Cultural Practices

The two hundred and twenty-five (225) sorghum genotypes were evaluated under non-stressed (NS), pre-anthesis drought stress (PreADS), and post-anthesis drought stress (PoADS) conditions under field and greenhouse environments using a 15 × 15 alpha lattice design in two replicates. The three water regimes and two environments resulted in six testing environments, namely: glasshouse and non-stressed (E1); glasshouse and pre-anthesis drought stress (E2); glasshouse and post- anthesis drought stress (E3); field and non-stressed (E4); field and pre-anthesis drought stress (E5); field and post-anthesis drought stress (E6). Planting was carried out during the summer cropping season (October to March) in 2019/2020.
Under the glasshouse environment, four seeds of each variety were sown in 5 L capacity plastic pots (upper diameter: 30 cm, lower diameter: 20 cm, depth: 28 cm) filled with 4 kg of Gromor potting media. Plants were thinned out to two plants per pot two weeks after emergence. The plants were fertilized with Agchem hydroponic water-soluble fertilizer with the following nutrient compositions: 2:1:2 (nitrogen 175 g/kg, phosphorus 85 g/kg and potassium 174 g/kg). The plants received optimum fertigation four times a day for 3 min.
Under the field environment at Ukulinga, a tunnel was constructed using a steel frame covered by a 0.1 mm thick transparent polyethene bird net to prevent bird damage. It had a centre height of 3.00 m and was 0.8 m high at the open sides (40 m long and 10 m wide). Sorghum plants were planted in ridges on a two-row of 3 m plot, with 30 cm intra-row and 70 cm inter-row spacing. Each ridge was covered with polyethene mulch, and a surface drip irrigation system was installed down the center. Two seeds were planted and thinned to one plant two weeks after emergence. Osmocote® slow-release fertilizer (Dynatrade, Johannesburg South Africa) was directly applied in the field before sowing. The fertilizer was applied at the following rates: 120 kg/ha of urea (18% N), 60 kg/ha superphosphate (6%, P 2 O 5 ), and 60 kg/ha potassium chloride (12% K 2 O ). To monitor soil moisture content under field conditions two tensiometers sensors (Decagon Ech10HS, Pullman, WA, USA) were inserted at two depth zones: above, at the active root zone, and below the root zone at depths of 250 mm and 500 mm, respectively. The sensors recorded field capacity and permanent wilting point values at 22% and 8% volumetric moisture content, respectively.
Under both field and glasshouse environments, pre- and post-flowering drought stress were imposed, according to Reddy et al. [33]. Pre-flowering stress was imposed at growth stage 3 (when about one-third of the total leaf area has fully developed) and continued to stage 6 (half bloom stage), at which half of the plants in the plot have flowered [36]. Post-flowering drought stress was imposed by withdrawing irrigation during the booting stage approximately 45 days after sowing [36]. In our case, post-flowering stress was imposed between 90 and 100 days after sowing in the glasshouse and between 95 and 105 days in the field. Weed control was performed manually, whereas sugarcane aphid (Melanaphis sacchari (Zehntner)) was controlled by spraying chlorpyrifos at a recommended rate of 1 mL per 100 litres of water.

2.4. Data Collection

Grain yield (GY, in kg/plot) data under field conditions was recorded from 10–15 randomly selected plants from the inner middle rows of the plot and converted tons/hectare (t/ha) after adjusting to 12.5% grain moisture content. Under glasshouse conditions, GY was determined as the grain weight of all harvested sorghum heads in each pot. Subsequently, GY was calculated by dividing the total grain weight from each pot by the pot area using the formulae for the area of a circle: A = π r 2 (0.071 m2) adjusted to 12.5% moisture, expressed in kg ha−1, and converted to t/ha.

2.5. Data Analysis

BLUPs and BLUEs Estimates for Grain Yield

Best Linear Unbiased Estimates (BLUEs) and Best Linear Unbiased Predictors (BLUPs) for grain yield were calculated using META-R software version 6.0 [37].
The following linear model was used for combined analysis based on the alpha lattice design procedure:
Y ¯ i j k = μ + E n v i + R e p j ( E n v i ) + B l o c k k E n v i R e p j + G e n l + E n v i × G e n l + ε i j k l
where: Y ¯ i j k = the yield of the ith genotype in the jth environment, μ is the overall mean, Env i = the effects of the ith environment, R e p j = the effect of the jth replication, R e p j   E n v I = the effect of the jth replicate within ith environment, Blockk (EnviRepj) is the effect of the kth incomplete block within the ith environment and jth replicate, G e n l = the effect of the kth genotype, and ε i j k = the residual/error terms associated with ith environment, jth replications, and kth genotype.
The replications and blocks were treated as fixed factors, whereas genotypes, environment, and interactions were treated as random [12,37].

2.6. Drought Tolerance/Susceptibility Indices

Based on the BLUPs data summary, the following10 selection indices of drought tolerance were computed (Table 1): tolerance index (TOL), mean productivity (MP), harmonic mean (HM), stress susceptibility index (SSI), geometric mean productivity (GMP), stress tolerance index (STI), yield index (YI), yield stability index (YSI), modified stress tolerance index I (K1STI), and modified stress tolerance index II (K2STI).

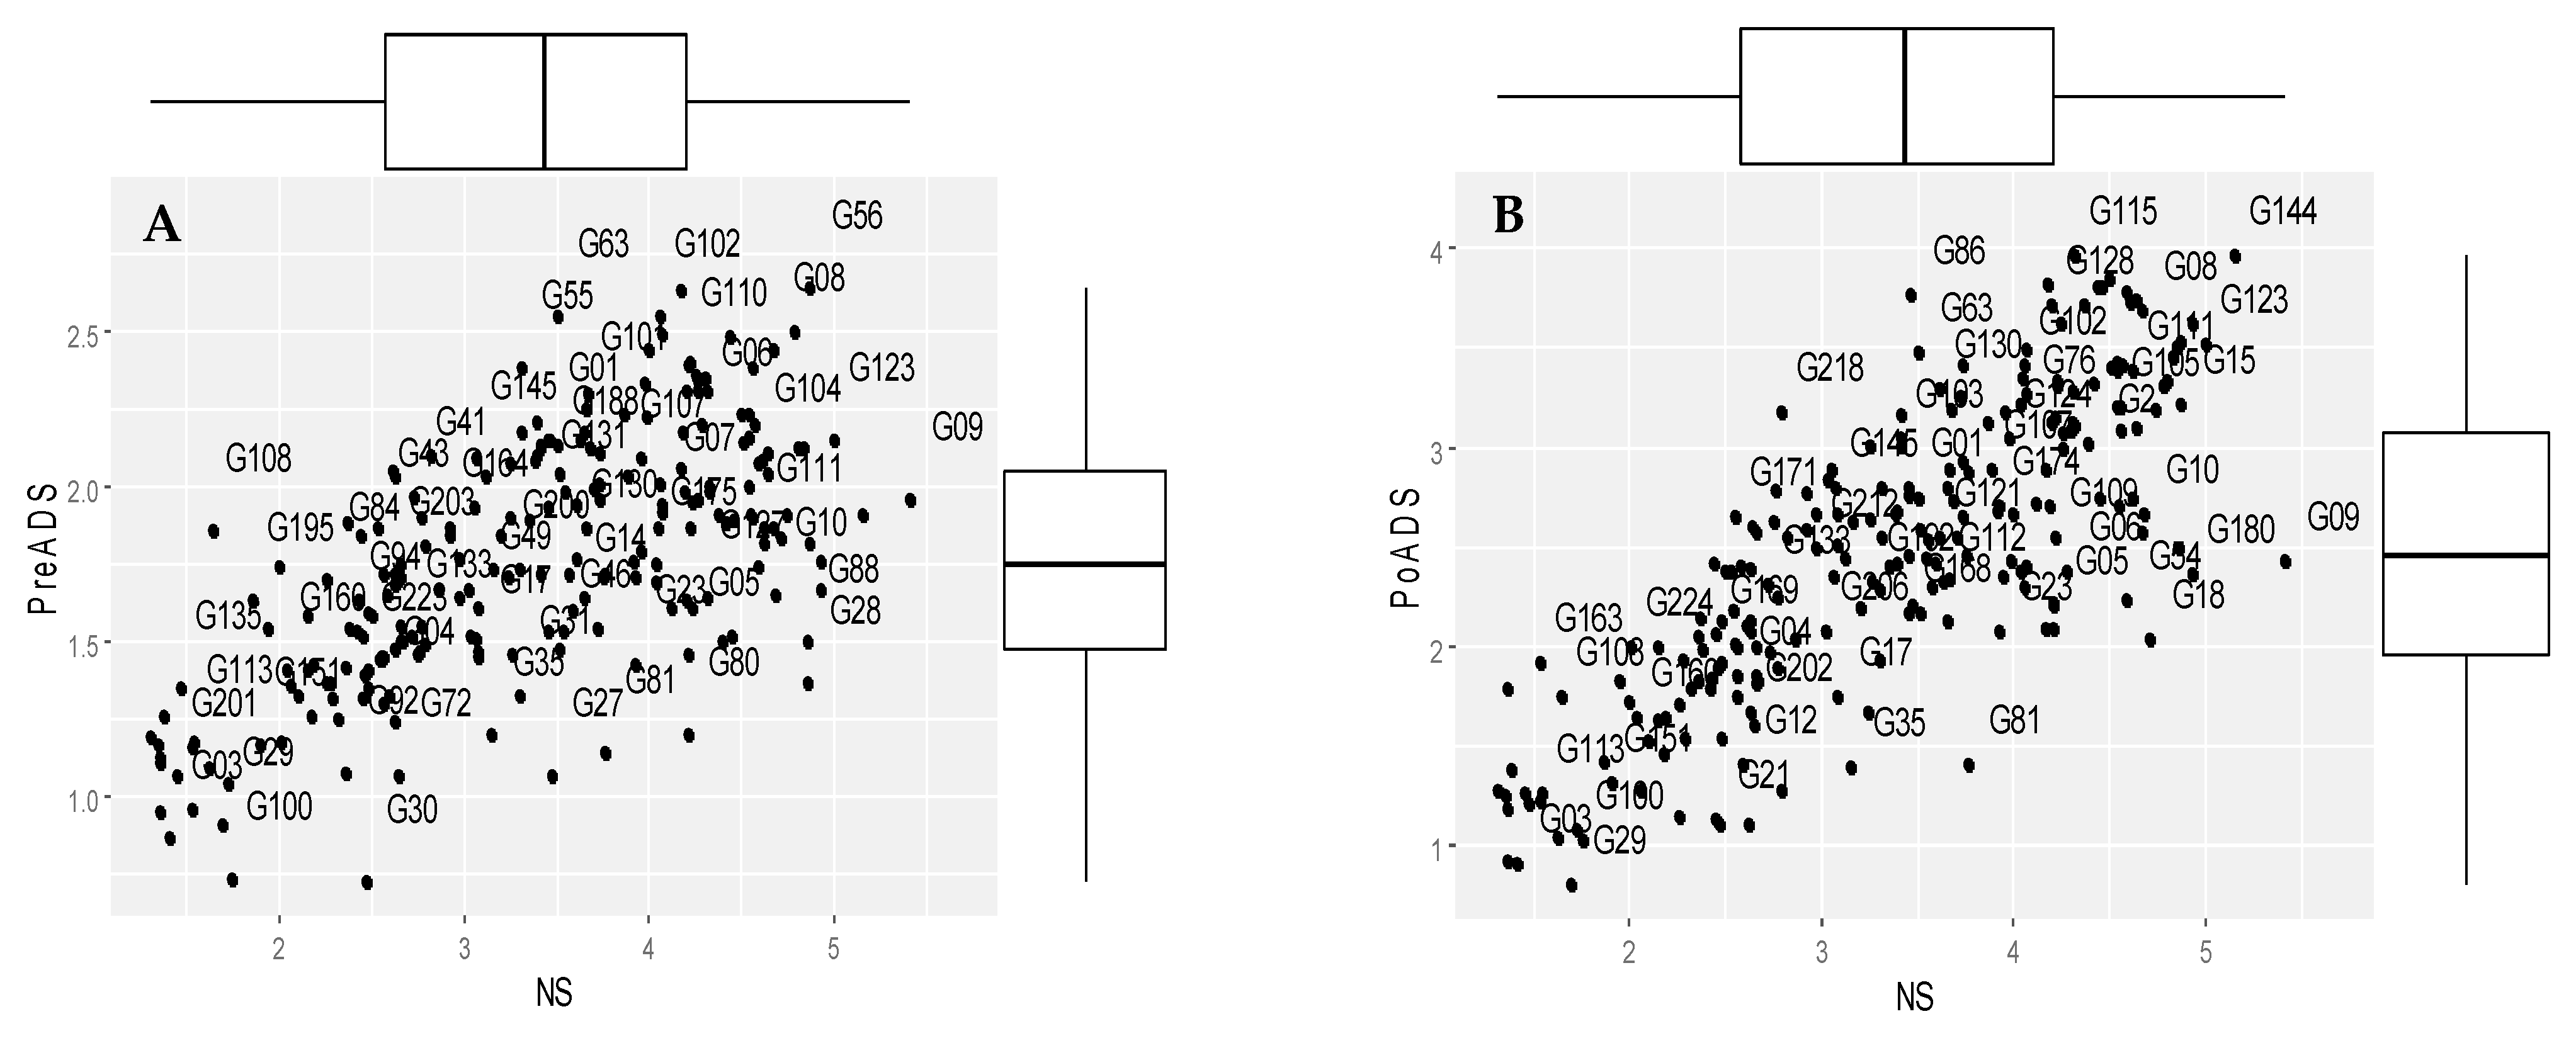
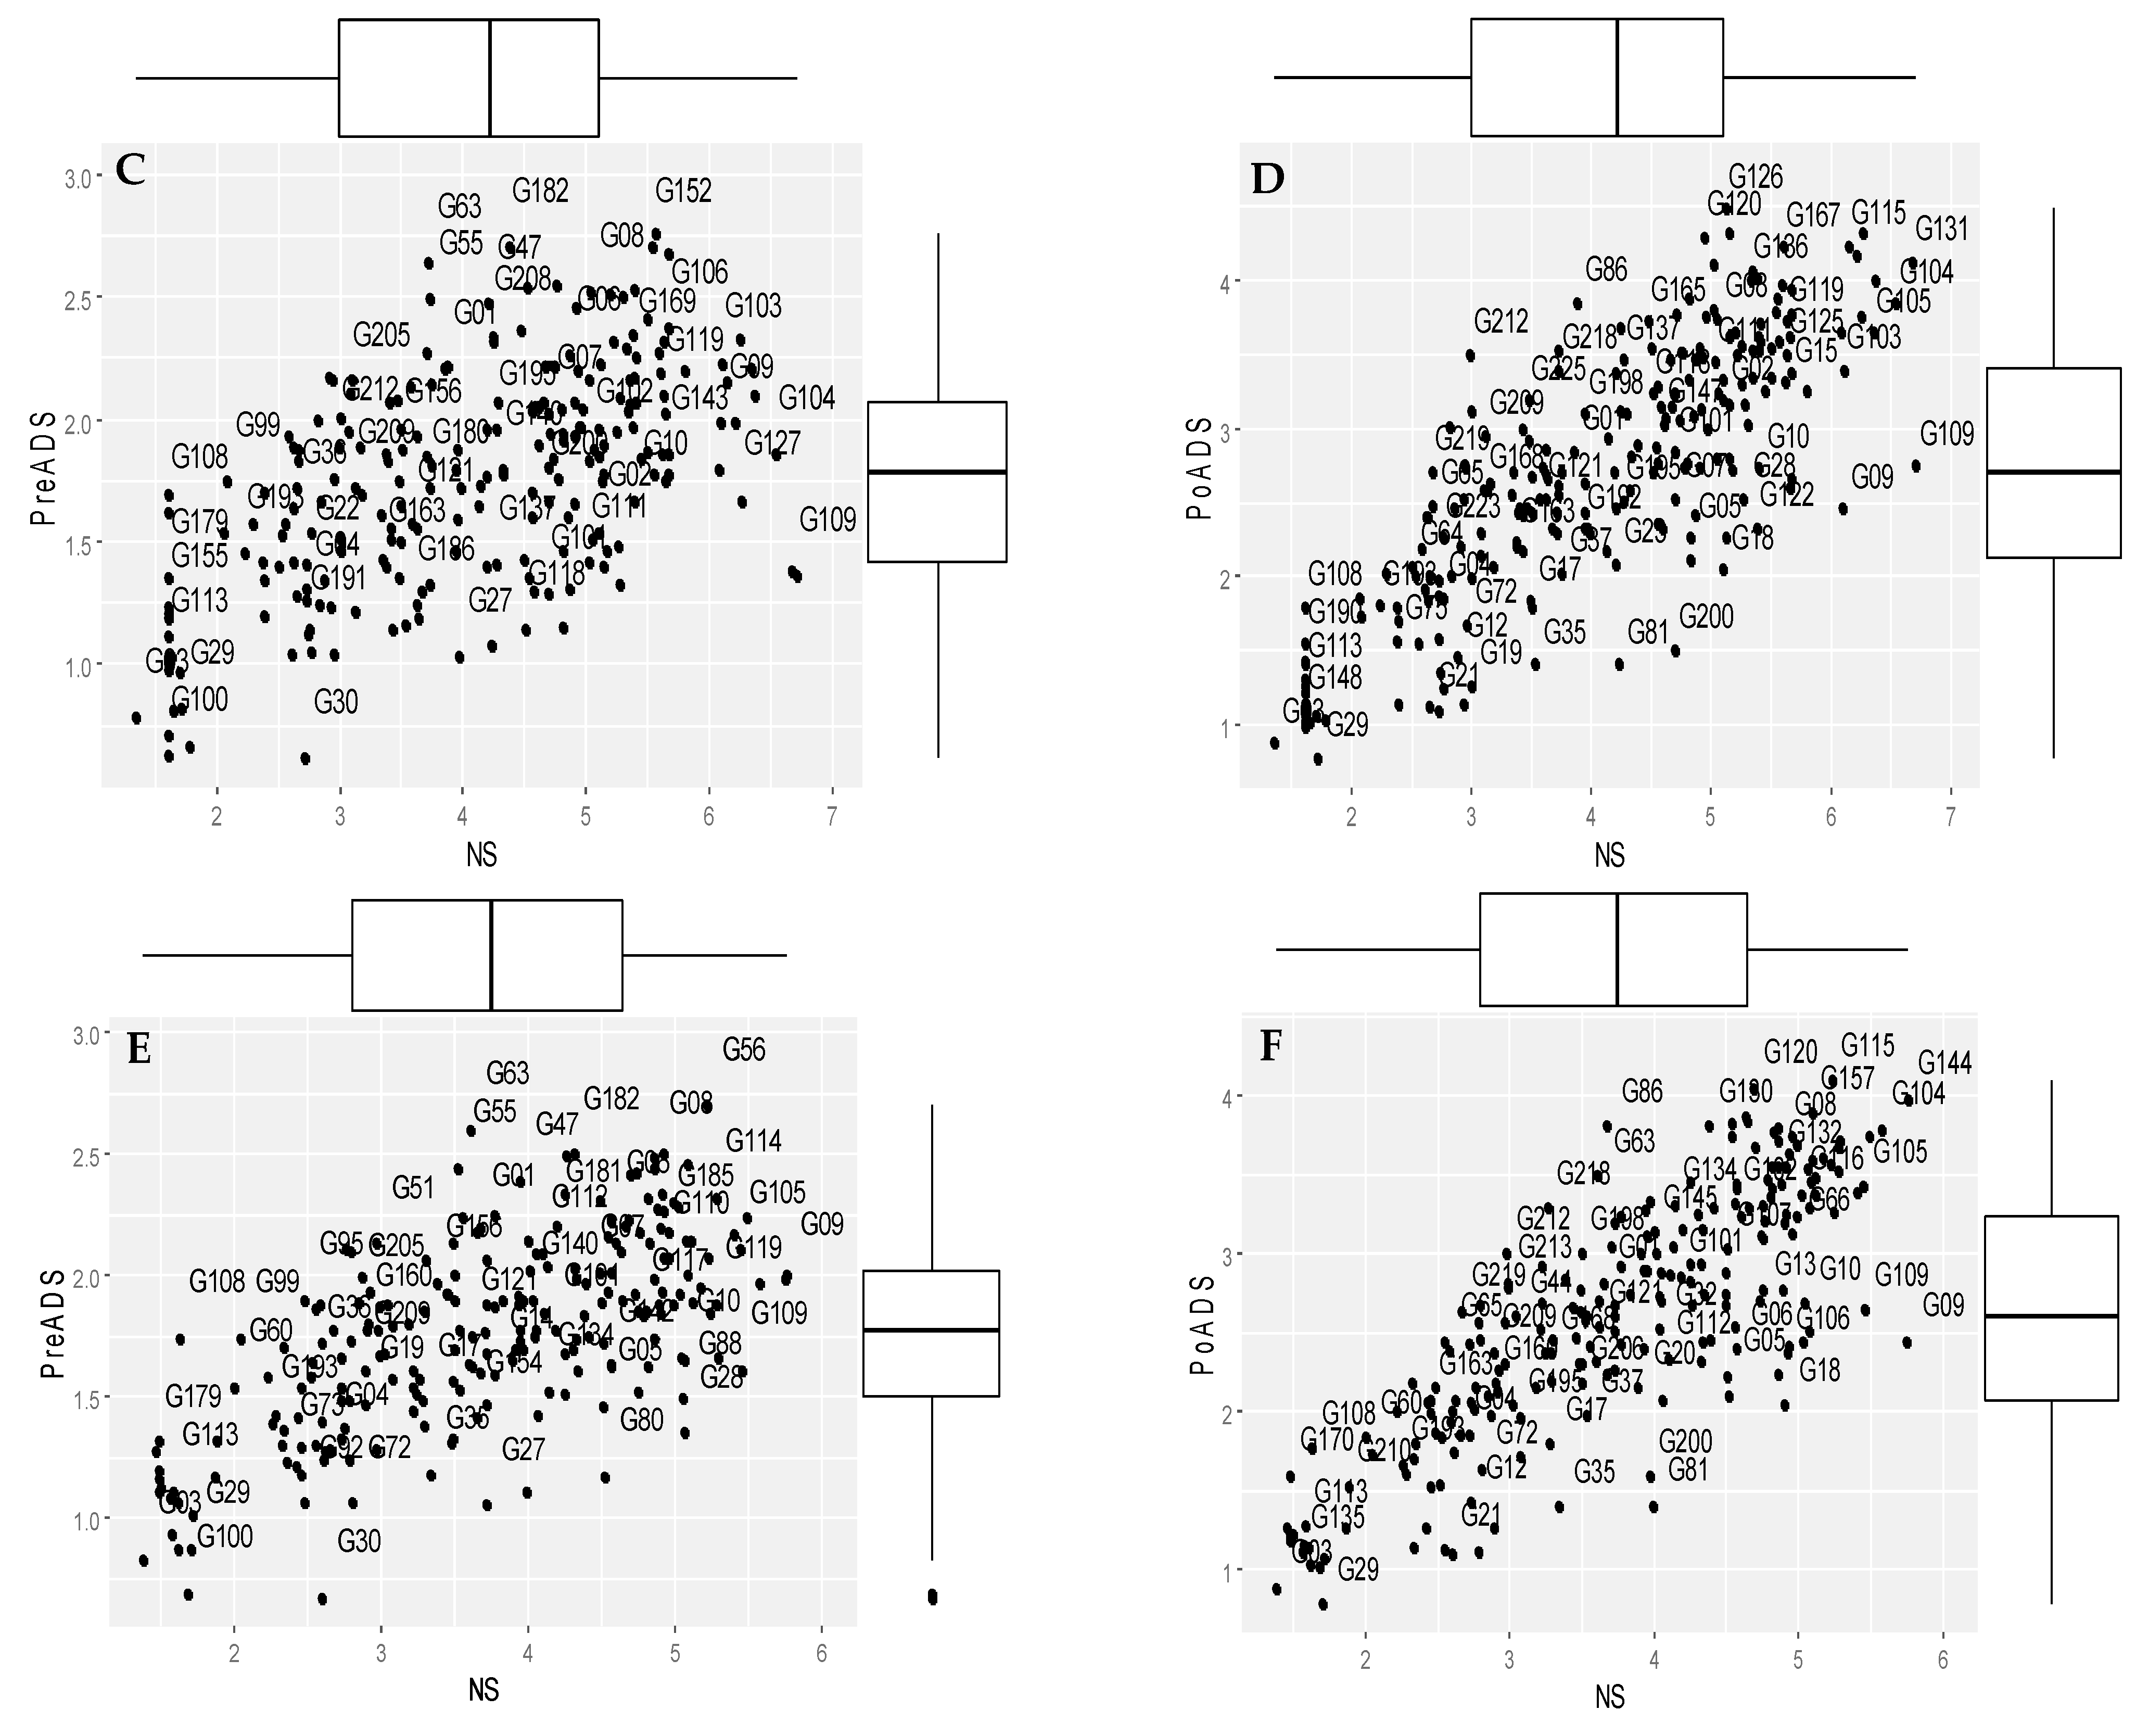
2.7. Scatterplots and Regression of Grain Yield under Non-Stressed and Drought-Stressed Conditions

Biplots were constructed based on BLUPs for grain yield under non-stressed vs pre-anthesis drought stress and NS vs post-anthesis drought stress conditions for field and glasshouse environments and across each drought condition and environment. This allowed grouping the sorghum genotypes for different levels of drought tolerance using the ggplot2 package [45] in R version 4.1.0 [46]. According to Fernandez [47], the scatterplots present intersecting lines through mean values for grain yield under non-stress condition vs grain yield under drought-stress condition to aid the identification of genotypes possessing four groups of drought tolerance, namely: Group A, which comprises genotypes expressing high grain yield under both non-stress and drought-stress conditions; Group B genotypes which comprises genotypes which perform favourably only in non-stress condition; Group C genotypes which are relatively higher performers under drought stress condition; and Group D genotypes which are low yielders under both non-stress and drought-stress conditions.
Simple linear regression models were fitted using the ggplot2 package in R to determine the relationship between grain yield among the tested sorghum genotypes under NS, PreADS, and PoADS conditions in glasshouse and field environments. Regression model diagnosis (e.g., fitted vs residual and quantile-quantile (QQ) plots) was performed in R using the ggfortify package [48,49].

2.8. Ranking Genotypes for Drought Tolerance

To determine the most desirable drought-tolerant genotype based on drought tolerance indices, the mean rank and standard deviation of ranks were calculated according to Farshadfar et al., [50] using the following relationship formula:
Rank   Sum   ( RS ) = Rank   Mean   ( R ¯ )   +   Standard   Deviation   of   Rank   ( SDR )
Standard deviation of rank (SDR) was measured as:
S D R = S i 2 = i = 1 m   R i j R ¯ i 2 n 1
where S = sample standard deviation, n = number of observations, where R i j is the rank of X i j within the jth environment, R ¯ i is the mean rank across all environments for the ith genotype.

2.9. AMMI Analysis

The Additive Main Effect and Multiplicative Interaction (AMMI) analysis was carried out using Genstat 20th edition [51]. The AMMI analysis fits additive effects due to genotypes (G) and environments (E) by the usual additive analysis of variance procedure and then fits multiplicative effects for GEI by principal components analysis (PCA). According to Gauch [52], model diagnosis is useful to determine the best AMMI model family for a given data set. It is recommended to use the FR test [53] to evaluate model diagnostics and identify significant interaction principal components (IPCs) in the AMMI model with AMMISOFT software for yield trial data analysis. The AMMI model is as follows:
Y ¯ i j k = μ + G i + E j + k = 1 m λ k σ i k γ j k + ρ i j
where Y ¯ i j k = the yield of the ith genotype in the jth environment, μ = the grand mean, G i = the mean of the ith genotype minus the grand mean, E j = the mean of the jth environment minus the grand mean, λ k = the square root of the eigenvalue of the kth IPCA axis, σ i k and γ j k = the principal component scores for IPCA axis k of the ith genotypes and the jth environment, and ρ i j = the deviation from the model.

2.10. AMMI Stability Value Analysis

AMMI stability value (ASV) was calculated to quantify and rank genotypes in terms of yield stability using the formula suggested by Purchase et al., [54] as follows:
A M M I   S t a b i l t y   V a l u e   A S V = S S I P C A 1 S S I P C A 2 I P C A 1 s c o r e 2 + I P C A 2 s c o r e 2
where SS = Sum of squares; IPCA1 = Interaction Principal Component Analysis axis 1 IPCA2 = Interaction Principal Component Analysis axis 2.
The larger the IPCA score, either in negative or positive direction, the more specifically adapted a genotype is to specific environments. Smaller ASV scores indicate a more stable genotype across environments, whereas larger ASV values indicate unstable performance [55]. AMMI-1 biplot was constructed based on the genotype and environment mean yields and their IPCA1 scores to characterize the GE interaction.

3. Results

3.1. BLUPs and BLUEs for Grain Yield among Sorghum Genotypes Evaluated under Non-Stressed and Drought-Stressed Conditions

BLUPs and BLUEs for the grain yield of the first 50 selected sorghum genotypes under six test environments are presented in Table 2, whereas BLUPs and BLUEs for all the test genotypes are provided in Supplementary Table S2. Under environment E1 (glasshouse environment, non-stress condition), 52.9% (119 genotypes) of the test genotypes recorded yields greater than the mean grain yield (3.34 t/ha). The grain yield ranged from 1.31 t/ha for G179 (Kaura– 1) to 5.41 t/ha for G9 (Yar Gumel). Under environment E1, 32 genotypes recorded a grain yield >4.50 t/ha, and the top yielders included G9 (5.41 t/ha), G144 (5.15 t/ha), G123 (4.99 t/ha), G180 (4.93 t/ha), G119 (4.93 t/ha), and G15 (4.87 t/ha) (Table S2). Under a glasshouse environment and a pre-flowering drought stress condition (Environment E2), 48.9% (110 genotypes) of the genotypes recorded values greater than the mean (1.76 t/ha), which varied from 0.70 t/ha for G30 (12KNICSV-297-2) to 2.66 t/ha for G56 (CSRO1). Genotypes G56, G106, G102, G63, G129, G158, and G120 were top yielders under E2 recording grain yields of >2.40 t/ha. Under environment E2 (glasshouse environment, pre-flowering stress condition), six genotypes recorded a grain yield <1.0 t/ha, whereas 151 genotypes recorded a grain yield ranging from 1.00 to 1.99 t/ha, and 68 genotypes had a grain yield of >2.0 t/ha. Under environment E3 (glasshouse and post-flowering drought stress), 49% (112 genotypes) of the test genotypes recorded grain yields greater than the mean grain yield of 2.46 t/ha. Top yielders with grain yield values of >3.50 t/ha under E3 included the following genotypes: G144, G115, G157, G152, G78, and G120. The worst yielders under E3 were G29, G3, and G190, which recorded grain yield of <1.00 t/ha.
The grain yield under environment E4 (Ukulinga and non-stressed condition) varied from 1.35 t/ha for G3 (Gadam) to 6.3 t/ha for G109 (Yalai). The grand mean yield was 4.05 t/ha across the test genotypes. Of the test genotypes, 52.4% (118 genotypes) recorded grain yields greater than the mean (4.05 t/ha). Genotypes G109, G131, G104, G144, G105, G127, G114, G105, and G127 were the top yielders with >4.05 t/ha. The lowest yielders under E4 were G3, G190, G100, G199, G148, G155, and G113, which recorded grain yields of <1.50 t/ha. Under environment E5 (Ukulinga and pre-anthesis drought stress), 53.3% (120 genotypes) of the genotypes recorded a grain yield of >1.75 t/ha, such as G56, G152, G182, G157, G63, G194, and G71. Furthermore, 10 genotypes recorded a grain yield <1.0 t/ha, whereas 144 genotypes recorded grain yields ranging from 1 to 1.99 t/ha, and 71 genotypes recorded grain yields >2.0 t/ha. Under environment E6 (Ukulinga and post-anthesis drought stress), 52.0% (117 genotypes) of the test genotypes recorded a mean grain yield of 2.68 t/ha. Genotype G29 (12KNICSV-293) recorded the lowest grain yield (0.78 t/ha), whereas G126 (Jan Kaura 1) recorded the highest grain yield of 4.49 t/ha. Only three genotypes recorded a grain yield < 1.0 t/ha, 44 genotypes recorded a grain yield ranging from 1 to 1.99 t/ha, and 178 genotypes recorded a grain yield >2.0 t/ha under environment E6. Across testing environments, 52.9% (119 genotypes) recorded a grain yield greater than the grand mean (2.68 t/ha). The highest grain yield recorded was at 3.91 t/ha for G144 (Kaura Short Panicle-1) and 3.86 t/ha for G56 (CSRO1) which were above the mean grain yield (2.68 t/ha). The lowest grain yield across environments were recorded for genotype G3 (Gadam) at 1.01 t/ha and G100 (AS 97) at 1.10 t/ha.
Overall, drought stress reduced grain yields to varying degrees in all sorghum genotypes. PreADS caused a severe yield reduction of 75% for G30 (12KNICSV-297-2) followed by G80 (AS 71) with 74.3%. Under the PoADS, G81 (E 119) and G200 (Buhu Banza 1) recorded yield reductions of 64.9 and 60.1%, respectively, across environments. The extent of grain yield reduction differed under glasshouse and field environments. Yield loss were detrimental under PreADS than PoADS compared with NS condition in a glasshouse environment. PreADS (E2) led to reduced grain yield by 47.5% and PoADS (E3) by 26.3%. PreADS (E5) and PoADS (E6) reduced grain yields by 56.8 and 33.4% in the field environment, respectively.

3.2. Drought Tolerance Indices

The drought tolerance/susceptibility indices of 50 selected sorghum genotypes are presented in Table 3. In addition, Supplementary Table S3 presents drought tolerance/susceptibility indices values of all evaluated sorghum genotypes. TOL under PreADS varied from 0.22 (G108) to 3.52 (G109), and 48.0% of the evaluated sorghum genotypes (108) recorded TOL values less than the grand mean (1.94) and were identified as less sensitive to PreADS. Under PoADS, G108 and G170 recorded the lowest TOL values of 0.06 and 0.07 and were identified as tolerant, whereas a high TOL value of 2.96 indicated high drought sensitivity.
Mean productivity under PreADS varied from 0.89 for G3 to 4.11 for G56. High MP values of >4 were recorded for G56 and G144, whereas genotypes G100 and G3 recorded MP values <1.00. Under PoADS, MP values varied from 4.89 (G144) to 1.06 (G3), and 49 genotypes recorded MP values >4.00 whereas 28 genotypes recorded values <2.00. Genotypes G100 (0.83) and G30 (0.96) recorded the lowest HM values under PreADS, whereas the highest values were recorded for G108 (23.89) and G63 (19.32). Under PoADS, the lowest HM values were recorded for genotypes G29 (2.48) and G3 (3.57), whereas the highest HM values were recorded for G89 (369.22 and G218 (135.93). Genotypes G108 (0.24) and G99 (0.51) recorded the lowest SSI values under PreADS compared with G30 G100 with an SSI of >1. Under PoADS, the genotypes with the lowest stress sensitivity were G86 with an SSI value of 0.07 and G108 with an SSI value of 0.11, whereas G81 (2.03) and G97 (1.92) recorded the SSI highest values and were identified as drought sensitive.
Values for GMP, under PreADS were high for G109 (1.88) and G28 (1.87), whereas genotypes G108 (0.47), G190 (0.72), and G179 (0.73) recorded the lowest values. Under PoADS, lower GMP values were recorded for G108 (0.24) and G170 (0.26) compared with higher values recorded for G9 (1.72) and G18 (1.61). Values for STI under PreADS were low for genotypes G108 (0.02), G190 (0.04), G179 (0.04), and G99 (0.04), whereas high values were recorded for genotypes G109 (0.26), G28 (0.26), G9 (0.25), G144 (0.25), and G127 (0.25). STI values under PoADS identified genotypes G108 and G170 as susceptible, recording values <0.01, and G9 as a tolerant genotype with STI values >0.20.
Under PreADS, lower YI values ≤0.30 were recorded for G201, G29, G3, G30, and G100 whereas YI values ≥1.50 were recorded for G182, G106, G152, G8, G157, G63, and G56. Under PoADS, lower YI values ≤0.30 were recorded for G3 and G29 compared with YI values ≥1.50 for G141, G157, G120, G144, and G115.
Under PreADS, lower YSI values ≤0.30 were recorded for G28, G27, G80, G81, G100, and G30 whereas higher YSI values ≥0.70 were recorded for G95, G82, G52, G63, G99, and G108. Under PoADS, genotypes G81 (0.39), G97 (0.42), and G30 (0.42) recorded the lowest YSI values whereas genotypes G86 (0.98) and G108 (0.97) recorded the highest YSI values.
Indices such as k1STI and k2STI are a modification to improve the efficiency of the STI. The two indices are based on correction coefficients (k1 and k2) which correct the STI as a weight. Under PreADS, G144 (Kaura Short Panicle-1) and G9 (Yar Gumel) recorded high k1STI values of 1.42 and 1.31, whereas G3 (Gadam) and G100 (AS 97) recorded the lowest K1STI values of 0.02 and 0.03 under PreADS and were identified as drought sensitive. Under PoADS, high k1STI values were recorded for G144 (1.73), G104 (1.54), and G129 (1.50), whereas genotypes with low values included G3 (0.02) and G155 (0.03). High K2STI values were recorded to genotypes G56 (CSRO1) at 1.71 and G157 (Kaura Mai Baki Kona) at 1.37 compared with genotypes G3 (Gadam) and G100 (AS 97), which recorded the lowest K2STI of 0.20 and 0,12, respectively, under PreADS. Under PoADS, the G3 (Gadam) genotype recorded the lowest K2STI value of 0.12 followed by G29 (12KNICSV-293) (0.13), while high values were recorded by G144 (Kaura Short Panicle-1) (14.83), followed by G115 (Danyar Bana) (14.13) and G104 (Dan Yara) (12.95).

3.3. Genotypes and Trait Correlations under Non-Stressed and Drought-Stressed Conditions

Biplots showing the groupings of 225 sorghum genotypes based on grain yield under NS, PreADS, and PoADS in glasshouse and field environments are shown in Figure 1. Grain yield performance under PreADS versus NS conditions in a glasshouse environment (Figure 1A) revealed genotypes G56 as being more suitable for both stressed and non-stressed environments (Group A), while G09 is more desirable for non-stress conditions (Group B). Similarly, genotypes G145 and G1 recorded relatively higher grain yield only under PreADS in a glasshouse environment (Group C), whereas genotypes G100 and G03 were sensitive to drought due to poor yield performance in both PreADS and non-stress conditions (Group D). Biplots showing grain yield performance under PoADS versus NS conditions in a glasshouse environment (Figure 1B) revealed genotypes G08 and 144 as drought tolerant with high performance in both conditions (Group A), while genotypes G09 and G10 were more suitable for a non-stress environment (Group B) and recorded a high grain yield of ~2.40 t/ha (Figure 1B). Genotypes G81 and G35 are more desirable for stressed conditions (Group C). Genotypes G29 and G100 are drought-susceptible and recorded low grain yields under PoADS and NS conditions in a glasshouse environment (Group D).
Under the field environment (Figure 1C), sorghum genotypes G152, G08, and G106 were allocated to Group A and recorded high grain yield values under PreADS and NS conditions. The second group (Group B) comprised G109, which is semi-tolerant and recorded a grain yield below the mean values (1.76 t/ha) under PreADS condition, whereas G55 and G63 were highly tolerant to PreADS, recording a grain yield >2.5 t/ha. Similarly, genotypes including G27, G81, G80, and G28 were clustered in the third group (Group C). In this group, the genotype had a more desirable yield under stressed conditions and comprised G22, G04, and G191. Finally, Group D consisted of genotypes G03, G29, and G100 with a low yield performance under both stressed and non-stressed conditions. The genotypes in group D were susceptible to PreADS conditions (<1.00 t/ha) under a glasshouse environment (Figure 1C). Under PoADS in a glasshouse environment (Figure 1D), G131, G115, and G104 were identified as high performers under PoADS and NS conditions (Group A), whereas genotype G109 belonged to Group B (high-yielding only under NS condition) and recorded a grain yield of 2.75 t/ha. Genotypes G81 and G18 belong to Group C with a high grain yield only under PoADS condition and Group D comprises G03 and G29 with a low yield (<1.00 t/ha) under both PoADS and NS conditions.
Across glasshouse and field environments, genotypes G114 and 56 were identified as drought tolerant with high performances in both stress conditions under NS and PreADS conditions (Group A), while genotypes G09 and G109 were more suitable for non-stress environments (Group B). Genotype G72 and G75 were more desirable for stressed conditions recording 2.65 t/ha and 2.19 t/ha (Group C). Genotypes G03, G29, and G100 were drought susceptible and recorded low grain yields under PreADS and NS conditions across both glasshouse and field environments (Group D) (Figure 1E). Genotypes G144, G115, and G104 were identified as high performers under PoADS and NS condition (Group A), whereas genotypes G109 and G09 belonged to Group B (High-yielding only under NS condition) (Figure 1F). Genotypes G210 and G12 belong to Group C with high grain yield only under PoADS conditions and Group D comprises G03, G135, and G29 with low yields (<1.00 t/ha) under both PoADS and NS conditions across environments.
Simple linear regression models showing the relationships between grain yield under drought stress (e.g., PreADS and PoADS) and non-stress (NS) conditions in glasshouse and field environments are shown in Figure 2. For grain yield under PreADS vs NS conditions and PoADS vs NS conditions in a glasshouse environment, the model was highly significant (p < 0.001) and explained 42% (R2 = 0.42) and 63% (R2 = 0.63) of the total explained variations in grain yield, respectively (Figure 2A,B). Under PreADS vs NS conditions and PoADS vs NS conditions in the field environment, the model was highly significant (p < 0.001) and explained 32% (R2 = 0.32) and 78% (R2 = 0.78) of the total explained variation in grain yield, respectively (Figure 2C,D). Across glasshouse and field environments (Figure 2E,F), the model was highly significant (p < 0.001) for grain yield under PreADS vs. NS conditions, and PoADS vs NS conditions and was explained by 42% (R2 = 0.42) and 73% (R2 = 0.73) of the total variation in grain yield of the tested sorghum genotypes.

3.4. Genotype Ranking for Drought Tolerance

The drought tolerance/susceptibility presented in Table 3 highlighted some challenges in the identification of drought-tolerant genotypes. For example, different indices identified drought-tolerant and susceptible genotypes. To determine the most desirable drought-tolerant genotypes according to all indices, the mean rank and the standard deviation of ranks of all drought tolerance criteria were calculated and presented in Table 4 and Table 5. On the basis on these two criteria, the most desirable drought tolerant cultivars were identified. For PreADS, genotypes G56 (CSRO1), G157 (Kaura Mai Baki Kona), G8 (ICNSL2014-022-4), and G152 (Bog Farwa) exhibited the best mean rank and low standard deviation of rank. Hence, they were identified as the most drought tolerant cultivars, while G3 (Gadam) and G100 (AS 97) were identified as the most drought sensitive genotypes (Table 4).
Under PoADS condition, genotypes G115 (Danyar Bana), followed by G157 (Kaura Mai Baki Kona), G120 (Gagarau–4), and G144 (Kaura Short Panicle-1) recorded high-rank mean and were identified (Table 5) as the most drought tolerant. The genotypes G115 (Danyar Bana), G157 (Kaura Mai Baki Kona), G120 (Gagarau–4), G144 (Kaura Short Panicle- 1), and G152 (Bog Farwa) were identified as the most desirable drought tolerant cultivars. In contrast, genotypes G3 (Gadam), G29 (12KNICSV-293), and G100 (AS 97) exhibited the worst mean rank and high standard deviation of rank and are considered as the most sensitive to drought stress (Table 5).

3.5. AMMI Analysis of the GE Interaction

AMMI analysis of variance for sorghum grain yield showed that 44.6% of the total sum of squares was attributed to environmental effects, 38.7% to genotypic effects, and 16.7% to GEI effects (Table 6). Three interactive principal components axes (IPCA), including IPCA1, IPCA 2, and IPCA 3 were significant in the AMMI model (Table 6). IPCA1, IPCA2, and IPCA3 explained 61.4%, 19.4%, and 12.8% of the GEI variation, respectively. The three IPCAs cumulatively explained 93.6% of the variation to GEI, indicating that the AMMI model was a good fit for the grain yield data. The FR statistic is considered under the null hypothesis that no more than n terms determine the interaction. Thus, a significant result by the test suggests that at least one multiplicative term should be added to the already adjusted n. In the present study, three significant IPCAs were detected, indicating the need for adding a multiplicative term. As a result, AMMI model 4 is the best-fitting model for the yield dataset based on the FR test.
The AMMI model family showing the best-performing sorghum genotypes in the test environments under non-stress, pre-flowering drought, and post-flowering drought stresses for grain yield are displayed in Table 7. Each model identifies the best-performing genotypes to guide selection. The mean comparison of environments showed that drought stress conditions significantly decreased sorghum grain yield compared with non-stressed environmental conditions. Four genotypes, G9 (Yar Gumel), G144 (Kaura Short Panicle-1), G123 (Masakwa), and G119 (Yar Lazau) were best-performers under environment E1 (greenhouse and non-stressed condition) based on AMMI model families 1, 2, 3, and 4 in that order. Under environment E2, the genotypes G56 (CSRO1), G63 (Tun Buman Maiduguri), G182 (Gwaza Banji Borno), and G8 (ICNSL2014-022-4) were selected as the top performing genotypes based on AMMI models 1, 2, 3, and 4, respectively. The genotypes G131 (Yar Labe), G109 (Yalai), G104 (Dan Yara), and G127 (Dangama Wulchichi) were the best performers under environment E4 based on AMMI model families 1, 2, 3, and 4 model families. Under E5 (Ukulinga and pre-flowering drought stress), genotypes G56 (CSRO1), G63 (Tun Buman Maiduguri), G106 (ICNSL2014-021-1), and G71 (Takumbo) were selected for high yield performance based on AMMI model families 1, 2, 3, and 4. The top four genotypes in E6 (Ukulinga and post-flowering drought stress) were G115 (Danyar Bana), G130 (S7-Lata/RIB/BC1-1-7-V), G126 (Jan Kaura 1), and G120 (Gagarau-4). AMMI 4 was the best-fitting model allowing genotypes to be selected for specific environments.

3.6. AMMI Stability Value

The AMMI model does not provide for a quantitative measure of stability. However, such a measure is essential to quantify and rank genotypes according to their yield stability. The AMMI stability value (ASV) measure was proposed by Purchase et al. [54] to address this problem. The ASV of the top and poor performing genotypes in yield stability are shown in Table 8. An ideal genotype should have a high mean grain yield and small ASV. In this study, genotypes G42 (12KNICSV-107-1), G206 (Jawar), G186 (Harjiu), G147 (Geddawaki Panguga), and G177 (SSV2008113) showed the lowest ASV with a yield >2.5 t/ha and above the total average. The genotypes G109 (YALAI), G9 (YAR GUMEL), G131 (Yar Labe), and G127 (Dangama Wulchichi) had the highest ASV and were identified as the most unstable genotype recording ASV values ˃1.5.

4. Discussion

Sorghum is an important cereal crop in the dry region of Africa, mainly grown under dry conditions. The crop often experiences severe drought stress leading to significant yield losses and reduced yield gains. There is a lack of information on the response of African sorghum genotypes to drought, particularly their adaptation to adverse growing conditions in the semi-arid regions of SSA. Breeding efforts have been made to develop and dispatch abiotic stress-tolerant and high-yielding sorghum varieties. However, the developed varieties were not readily adopted by farmers due to a lack of farmer-preferred traits and poor adaptation to local conditions [4,56]. The present study examined the response of African sorghum genetic resources (Supplementary Table S1) under variable environments to select unique germplasm for production and breeding. The results revealed a wide genetic diversity for yield gains and drought tolerance. The diversity recorded in the presently assessed sorghum germplasm will facilitate the selection of contrasting and promising genotypes with specific and broad adaptations.
The significance of the environment effects shows that there are trends and variations in how genotypes respond to variable environments. The higher environment effect relative to the genotype effect suggests a differential expression of phenotypes across the test environments (Table 6). Hence, the testing environments were distinct and discriminative of the genotypes for selection [22,23]. Grain yield response was significantly (p < 0.01) affected by the test environments, which accounts for 44.6% of the model’s SS (Table 6). This agrees with the mean yield varying from 1.75 t/ha at environment E5 to 4.05 t/ha at environment E4 (Table 2), indicating a significant variance in yield productivity of the 225 sorghum genotypes in the six selected environments. Several studies have also reported that grain yield in multi-environment trials is highly affected by environmental influence [16,22,30,31]. Therefore, the selection of genotypes suited for specific environments is critical to improving grain production. In the current study, considerable yield improvements were recorded in environments without stress (NS) compared with stress conditions (e.g., PrADS and PoADS) (Table 2). However, under both non-stressed and stressed conditions, the landraces and breeding lines from IAR-NG and ICRSIAT-KN demonstrated a high superiority for grain yield than the collections from the USDA-ARS, NPGS, and to a lesser extent, ACCI-SA collections (Table 2 and Supplementary Table S2). The high yield response of the collections from IAR-NG and ICRSIAT-KN under stressed and non-stressed conditions suggested that evaluating the genotypes in drought-prone locations was worthwhile. The yield variability could be attributed to the inherent differences in the genetic composition of the test materials and the long agricultural and selection history by farmers in regions that are prone to drought.
The genotypic variation was the second largest contributor to grain yield differences. Hence, the genetic composition of the test lines was diverse, allowing for the selection of desirable genotypes for current and future sorghum improvement programs (Table 6). The present results agree with previous studies that reported extensive variation in sorghum genetic resources for grain yield in east African, Indian, and Brazil [16,22,32,34].
The GEI effect was significant but accounted for the lowest contribution to variation for grain yield relative to environmental and genotypic components. In agreement with the present findings, other studies in sorghum [57], wheat [58] and rice [59], reported lower variation in grain yield due to GEI. These indicated that highly stable genotypes for grain yield could be selected for multiple growing conditions, particularly drought-stressed environments. The current results showed that the genotypes, e.g., G42, G206, G186, were adapted to both low- and high-yielding environments, while G56 and G106 were adapted to high-yielding environments (Table 7). Based on stability analysis, the average stable performers for grain yield were G42, G206, and G186, with mean grain yield ranging between 2.4 and 3.0 t/ha (Table 8). The selected genetic resources are useful for cultivation or breeding. Different drought tolerance traits can be pyramided through recurrent selection in novel varieties to buffer the effects of drought stress in water-limited growing conditions.
Drought imposed during pre- and post-flowering stages markedly decreased grain yield (Table 2). Pre-anthesis drought stress reduced grain yield significantly compared with post-flowering drought stress (Table 2), suggesting that the studied sorghum genotypes were more prone to pre-anthesis drought stress and less susceptible to post-anthesis drought stress. Several studies on sorghum have shown that drought stress at both pre- and post-flowering growth stages significantly reduced grain quantity and quality [16,60,61]. Emendack et al. [61] reported 55% and 52% sorghum yield reduction under pre-and post-flowering irrigation treatments, respectively. Rosenow et al. [62] pointed out that drought stress during the pre-flowering growth stage may significantly impact grain yield, as this is the most prolonged crop growth and development stage. Water stress at this stage resulted in delayed flowering, poor panicle emergence, panicle blasting and ovary abortion, and a reduction in panicle size and grain number, which are economic traits directly contributing to grain yield [16,60,61,62]. Sorghum is relatively better adapted to drought stress and has genetic variability for pre-and post-flowering drought tolerance and related traits when compared with major crops such as maize and wheat [60,61,62,63].
Genotypes respond to water stress in various ways [16,39,44]. Regarding this, several criteria have been put forth to select genotypes based on their performance in an environment under stressed or non-stressed conditions [44]. Tolerant genotypes exhibit the lowest SSI, and TOL values while greater values were found for MP, HM, GMP, STI, YI, and YSI [38,39,44]. Based on mean rank and the high standard deviation of the rank, it can be inferred that genotypes G56, G157, G8, and G152 were the most drought tolerant selections to PreADS condition, while genotypes G115, G157, G120, and G144 were the most tolerant to PoADS conditions (Table 5). This was supported by the biplot summary presented in Figure 1. The linear regression models (Figure 2) fitted the observed grain yield under non-stressed conditions and post-anthesis under glasshouse and field environments and across both environments. The model was a good predictor of post-anthesis grain yield response and allowed for the selection of post-anthesis drought-tolerant genotypes. Based on the biplot analyses for grain yield performance under non-stressed and post-anthesis drought conditions across environments, the following genotypes were selected as being highly tolerant to post-flowering drought stress, namely: G144 (3.91 t/ha), G115 (3.80 t/ha), G105 (3.66 t/ha), G157 (3.83 t/ha), G08 (3.81 t/ha), and G120 (3.67 t/ha). A relatively low correlation was recorded for grain yield under non-stressed and pre-anthesis drought stress conditions (R2 = 41.677%). This indicated that the grain yield recorded under non-stressed conditions provides information about the pre-anthesis drought-stress yield performance response. Further, the results inferred that the non-stress grain yield response might not discern the pre-anthesis grain yield response. Nevertheless, genotypes such as G72 and G75 were highly tolerant to pre-anthesis drought stress. These genotypes recorded a grain yield of >2.30 t/ha under non-stress conditions and >1.50 t/ha under pre-anthesis drought stress. Emendack et al. [61] reported that grain yield under well-watered treatment was a strong predictor for grain yield under both pre-flowering and post-flowering drought treatments.
The genotypes such as G144 (Kaura Short Panicle-1) and G157 (Kaura Mai Baki Kona) were selected due to their high grain yield performance under drought stress environments. These genotypes have yellow endosperm and are derived as hybrid selections from the durra and caudatum sorghum races. Furthermore, the selections have farmer-preferred traits, and drought tolerance attributes that are popular with local farmers in West Africa [25,64,65,66]. In addition, G08 (ICNSL2014-022-4) is an elite and high-yielding breeding line developed at ICRISAT-Kenya with a drought tolerance [25,66]. Genotypes G144, G157, and G08 outperformed some registered cultivated varieties in West Africa, such as G59 (SAMSORG 48) with a grain yield of 2.76 t/ha and G94 (SAMSORG 45) with 1.99 t/ha. The genotypes have superior grain quality and a wider adaptability compared with the currently registered cultivars and can thus be valuable parents in sorghum breeding programmes to exploit heterosis.

5. Conclusions

The present study evaluated the drought-tolerance and genotype-by-environment interaction (GEI) effects on grain yield involving a genetically diverse population of African sorghum genotypes to identify high-yielding and drought-tolerant sorghum genotypes for production and breeding programs. Our findings have shown the existence of significant and intricate GE interactions, which suggests that genotype performance varied among the test conditions. This information can be used to enhance the selection and evaluation. The environment, which accounted for more than 44.6% of all variation, was the main cause of variation in grain yield. According to AMMI, appropriate genotypes for all locations or for specific locations were identified, with the following genotypes, G119 and G127, with grain yields of 5.6 t/ha and 6.3 t/ha, respectively, chosen as suitable for non-stressed conditions due to their stability and high yield. The genotypes G56, G157, G8, and G152 were highly tolerant to pre-anthesis drought stress based on yield performance and drought tolerance ranking, while the genotypes G144, G115, G157, and G08 were selected with tolerance to post-anthesis drought stress. The identified sorghum genotypes are recommended for production in the dry agro-ecologies of sub-Saharan Africa characterized by pre-and-post anthesis drought stress and as valuable genetic material for pre- and/or post-drought tolerance, contributing to enhancing farmers’ resilience.

Supplementary Materials

The following supporting information can be downloaded at: https://www.mdpi.com/article/10.3390/agronomy13020557/s1, Table S1: Code, pedigree, and origin of 225 sorghum genotypes, Table S2: Best linear and unbiased predictions (BLUPs) and best linear and unbiased estimates (BLUEs) of 225 grain sorghum genotypes grown under non-water stressed conditions and with stress at pre- and post-flowering among six environments, Table S3: Values of tolerance, susceptibility indices, and grain yield of the assessed sorghum genotypes.

Author Contributions

Conceptualization, M.A.Y., H.S., and B.N.; Formal analysis, M.A.Y., H.S., and J.M.; Funding acquisition, H.S. and B.N.; Investigation, M.A.Y.; Methodology, M.A.Y., H.S., J.M., and G.P.; Project administration, H.S. and B.N.; Software, M.A.Y. and J.M.; Supervision, H.S., B.N., J.M., and G.P.; Validation, H.S. and J.M.; Writing—original draft, M.A.Y. All authors have read and agreed to the published version of the manuscript.

Funding

This research and the APC was funded by the Accelerated Varietal Improvement and Seed delivery of legumes and cereals in Africa (AVISA) project (OPP1198373) funded by the Bill and Melinda Gates Foundation.

Institutional Review Board Statement

Not applicable.

Informed Consent Statement

Not applicable.

Data Availability Statement

Not applicable.

Acknowledgments

The first author acknowledges the following: Ph.D. Scholarship granted by the International Crops Research Institute for the Semi-Arid Tropics (ICRISAT) ‘Harnessing Opportunities for Productivity Enhancement (HOPE II) for Sorghum and Millets in Sub-Saharan Africa’ project funded by the Bill and Melinda Gates Foundation (BMGF); study fellowship granted by the Institute for Agricultural Research Samaru, Ahmadu Bello University Zaria Nigeria; and a staff member of the African Centre for Crop Improvement (ACCI) of the University of KwaZulu-Natal (UKZN)/South Africa for technical support.

Conflicts of Interest

The authors declare no conflict of interest.

References

  1. Ejeta, G.; Knoll, J.E. Marker-assisted selection in Sorghum. Genomics-Assisted Crop Improvement; In Genomics Applications in Crops; Varshney, R.K., Tuberosa, R., Eds.; Springer: Dordrecht, The Netherlands, 2007; Volume 2, pp. 187–205. [Google Scholar]
  2. Food and Agriculture Organization of the United Nations (FAOSTAT). Database of Agricultural Production. FAO Statistical Databases. 2021. Available online: http://www.fao.org/faostat/en/#data/QC (accessed on 22 November 2022).
  3. Teferra, T.F.; Awika, J.M. Sorghum as a healthy global food security crop: Opportunities and challenges. Cereal Foods World 2019, 64, 1–8. [Google Scholar] [CrossRef]
  4. Yahaya, M.A.; Shimelis, H.; Nebie, B.; Ojiewo, C.O.; Danso-Abbeam, G. Sorghum Production in Nigeria: Opportunities, Constraints, and Recommendations. Acta Agric. Scand. Sect. B—Soil Plant Sci. 2022, 72, 660–672. [Google Scholar]
  5. Thilakarathna, R.C.N.; Madhusankha, G.D.M.P.; Navaratne, S.B. Potential food applications of sorghum (Sorghum bicolor) and rapid screening methods of nutritional traits by spectroscopic platforms. J. Food Sci. 2022, 87, 36–51. [Google Scholar] [CrossRef] [PubMed]
  6. Rad, S.V.; Valadabadi, S.A.R.; Pouryousef, M.; Saifzadeh, S.; Zakrin, H.R.; Mastinu, A. Quantitative and qualitative evaluation of Sorghum bicolor L. under intercropping with legumes and different weed control methods. Horticulturae 2020, 6, 78. [Google Scholar]
  7. Tenywa, M.M.; Nyamwaro, S.O.; Kalibwani, R.; Mogabo, J.; Buruchara, R.; Fatunbi, A.O. Innovation opportunities in sorghum production in Uganda. FARA Res. Rep. 2018, 2, 20. [Google Scholar]
  8. Marley, P.S.; Diourte, M.; Neya, A.; Rattunde, F.W. Sorghum anthracnose and sustainable management strategies in West and Central Africa. J. Sustain. Agric. 2005, 25, 43–56. [Google Scholar] [CrossRef] [Green Version]
  9. Beshir, M.M.; Ahmed, N.E.; Ali, A.M.; Babiker, I.H.; Rubaihayo, P.; Okori, P. Prevalence and severity of sorghum leaf blight in the sorghum growing areas of Central Sudan. Wudpecker J. Agric. Res. 2015, 4, 54–60. [Google Scholar] [CrossRef]
  10. Odeny, D.A.; Muchira, N.; Ngugi, K.; Wamalwa, L.N.; Avosa, M.; Chepkorir, W.; Manyasa, E.; Nyamongo, D. Genotypic variation in cultivated and wild sorghum genotypes in response to Striga hermonthica infestation. Front. Plant Sci. 2021, 12, 1291. [Google Scholar]
  11. Jordan, D.R.; Hunt, C.H.; Cruickshank, A.W.; Borrell, A.K.; Henzell, R.G. The relationship between the stay-green trait and grain yield in elite sorghum hybrids grown in a range of environments. Crop Sci. 2012, 52, 1153–1161. [Google Scholar] [CrossRef]
  12. Sabadin, P.K.; Malosetti, M.; Boer, M.P.; Tardin, F.D.; Santos, F.G.; Guimaraes, C.T.; Gomide, R.L.; Andrade, C.L.T.; Albuquerque, P.E.P.; Caniato, F.F.; et al. Studying the genetic basis of drought tolerance in sorghum by managed stress trials and adjustments for phenological and plant height differences. Theor. Appl. Genet. 2012, 124, 1389–1402. [Google Scholar] [CrossRef]
  13. Ouedraogo, N.; Sanou, J.; Kam, H.; Traore, H.; Adam, M.; Gracen, V.; Danquah, E.Y. Farmers’ perception on impact of drought and their preference for sorghum cultivars in Burkina Faso. Agric. Sci. Res. J. 2017, 7, 277–284. [Google Scholar]
  14. Abreha, K.B.; Enyew, M.; Carlsson, A.S.; Vetukuri, R.R.; Feyissa, T.; Motlhaodi, T.; Ng’uni, D.; Geleta, M. Sorghum in dryland: Morphological, physiological, and molecular responses of sorghum under drought stress. Planta 2022, 255, 20. [Google Scholar] [CrossRef]
  15. Assefa, Y.; Staggenborg, S.A.; Prasad, V.P. Grain sorghum water requirement and responses to drought stress: A review. Crop Manag. 2010, 9, 1–11. [Google Scholar] [CrossRef] [Green Version]
  16. de Souza, A.A.; de Carvalho, A.J.; Bastos, E.A.; Portugal, A.F.; Torres, L.G.; Batista, P.S.C.; Julio, M.P.M.; Julio, B.H.M.; de Menezes, C.B. Grain Sorghum Grown Under Drought Stress at Pre-and Post-Flowering In Semiarid Environment. J. Agric. Sci. 2020, 12, 97–105. [Google Scholar] [CrossRef] [Green Version]
  17. Harris, K.; Subudhi, P.K.; Borrell, A.; Jordan, D.; Rosenow, D.; Nguyen, H.; Klein, P.; Klein, R.; Mullet, J. Sorghum stay-green qtl individually reduce post-flowering drought-induced leaf senescence. J. Exp. Bot. 2007, 58, 327–338. [Google Scholar] [CrossRef] [Green Version]
  18. Burke, J.J.; Emendack, Y.; Hayes, C.; Xin, Z.; Burow, G. Registration of Four Postflowering Drought-Tolerant Grain Sorghum Lines with Early-Season Cold Tolerance. J. Plant Regist. 2018, 12, 386–390. [Google Scholar] [CrossRef]
  19. Kebede, H.; Subudhi, P.K.; Rosenow, D.T.; Nguyen, H.T. Quantitative trait loci influencing drought tolerance in grain sorghum (Sorghum bicolor L. Moench). Theor. Appl. Genet. 2001, 103, 266–276. [Google Scholar] [CrossRef]
  20. Derese, S.A.; Shimelis, H.; Laing, M.; Mengistu, F. The impact of drought on sorghum production, and farmer’s varietal and trait preferences, in the northeastern Ethiopia: Implications for breeding. Acta Agric. Scand. Sect. B—Soil Plant Sci. 2018, 68, 424–436. [Google Scholar]
  21. Tesso, T.; Kapran, I.; Grenier, C.; Snow, A.; Sweeney, P.; Pedersen, J.; Marx, D.; Bothma, G.; Ejeta, G. The potential for crop-to-wild gene flow in sorghum in Ethiopia and Niger: A geographic survey. Crop Sci. 2008, 48, 1425–1431. [Google Scholar] [CrossRef] [Green Version]
  22. Amelework, B.A.; Shimelis, H.A.; Laing, M.D.; Ayele, D.G.; Tongoona, P.; Mengistu, F. Sorghum production systems and constraints, and coping strategies under drought-prone agro-ecologies of Ethiopia. S. Afr. J. Plant Soil 2016, 33, 207–217. [Google Scholar] [CrossRef]
  23. Mofokeng, A.M.; Shimelis, H.A.; Laing, M.D. Agromorphological diversity of South African sorghum genotypes assessed through quantitative and qualitative phenotypic traits. S. Afr. J. Plant Soil 2017, 34, 361–370. [Google Scholar] [CrossRef]
  24. Olatoye, M.O.; Hu, Z.; Maina, F.; Morris, G.P. Genomic signatures of adaptation to a precipitation gradient in Nigerian sorghum. G3 Genes Genomes Genet. 2018, 8, 3269–3281. [Google Scholar] [CrossRef] [PubMed] [Green Version]
  25. Angarawai, I.I.; Hamidou, F.; Sunday, A.; Yeye, M.; Daniel, A.A.; Hakeem, A.; Maryam, A.; Gloria, A.; Rekiya, A.; Jonah, J.; et al. Sorghum landrace germplasm: Genetic resources for demand lead product development and profiling in modern crop improvement. J. Agric. Biotechnol. Sustain. Dev. 2021, 13, 33–43. [Google Scholar]
  26. Yan, W.; Hunt, L.A.; Sheng, Q.; Szlavnics, Z. Cultivar evaluation and mega-environment investigation based on the GGE biplot. Crop Sci. 2000, 40, 597–605. [Google Scholar] [CrossRef]
  27. Zobel, R.W.; Wright, M.J.; Gauch, H.G., Jr. Statistical analysis of a yield trial. Agron. J. 1988, 80, 388–393. [Google Scholar] [CrossRef]
  28. Da Silva, C.P.; de Oliveira, L.A.; Nuvunga, J.J.; Pamplona, A.K.A.; Balestre, M. A Bayesian Shrinkage Approach for AMMI Models. PloS ONE 2015, 10, e0131414. [Google Scholar] [CrossRef]
  29. de Oliveira, L.A.; da Silva, C.P.; da Silva, A.Q.; Mendes, C.T.E.; Nuvunga, J.J.; Nunes, J.A.R.; Parrella, R.A.D.C.; Baleste, M.; Filho, J.S.D.S.B. Bayesian GGE model for heteroscedastic multienvironmental trials. Crop Sci. 2022, 62, 982–996. [Google Scholar] [CrossRef]
  30. Gebeyehu, C.; Bulti, T.; Dagnachew, L.; Kebede, D. Additive main effect and multiplicative interactions (AMMI) and regression analysis in sorghum [Sorghum bicolor (L). Moench] varieties. J. Appl. Biosci. 2019, 136, 13877–13886. [Google Scholar] [CrossRef] [Green Version]
  31. Al-Naggar, A.M.M.; Abd El-Salam, R.M.; Yaseen, W.Y.S. Yield Stability and Adaptability of 25 Grain Sorghum B-Lines across Six Environments in Egypt Using AMMI and GGE-Biplot Models. Adv. Agric. Fish. Res. 2020, 1, 80–96. [Google Scholar]
  32. Rosenow, D.T.; Dahlberg, J.A. Collection, Conversion, and Utilisation of Sorghum. In Sorghum: Origin, History, Technology and Production; Smith, C.W., Frederiksen, R.A., Eds.; Wiley: Hoboken, NJ, USA, 2000; pp. 309–328. [Google Scholar]
  33. Reddy, B.V.S.; Ramesh, S.; Reddy, P.S.; Kumar, A.A. Genetic Enhancement for Drought Tolerance In Sorghum. Plant Breed. Rev. 2009, 31, 189–222. [Google Scholar]
  34. Kumar, A.A.; Reddy, B.V.; Ramaiah, B.; Sahrawat, K.L.; Pfeiffer, W.H. Gene effects and heterosis for grain iron and zinc concentration in sorghum [Sorghum bicolor (L.) Moench]. Field Crops Res. 2013, 146, 86–95. [Google Scholar] [CrossRef] [Green Version]
  35. Fynn, R.W.; O’Connor, T.G. Determinants of community organization of a South African mesic grassland. J. Veg. Sci. 2005, 16, 93–102. [Google Scholar] [CrossRef]
  36. Vanderlip, R.L. How a Sorghum Plant Develops, Kansas State University Agricultural Experiment Station and Cooperative Extension Service, S-3. File code: Crops and Soils-1 Kansas State University. 1993. Available online: https://bookstore.ksre.ksu.edu/pubs/s3.pdf (accessed on 28 November 2022).
  37. Alvarado, G.; Rodríguez, F.M.; Pacheco, A.; Burgueño, J.; Crossa, J.; Vargas, M.; Pérez-Rodríguez, P.; Lopez-Cruz, M.A. META-R: A software to analyze data from multi-environment plant breeding trials. Crop J. 2020, 8, 745–756. [Google Scholar] [CrossRef]
  38. Rosielle, A.A.; Hamblin, J. Theoretical aspects of selection for yield in stress and non-stress environment 1. Crop Sci. 1981, 21, 943–946. [Google Scholar] [CrossRef]
  39. Jafari, A.; Paknejad, F.; Jami AL-Ahmad, M. Evaluation of selection indices for drought tolerance of corn (Zea mays L.) hybrids. Int. J. Plant Prod. 2009, 3, 33–38. [Google Scholar]
  40. Fischer, R.A.; Maurer, R. Drought resistance in spring wheat cultivars. I. Grain yield responses. Aust. J. Agric. Res. 1978, 29, 897–912. [Google Scholar] [CrossRef]
  41. Schneider, K.A.; Rosales-Serna, R.; Ibarra-Perez, F.; Cazares-Enriquez, B.; Acosta-Gallegos, J.A.; Ramirez-Vallejo, P.; Wassimi, N.; Kelly, J.D. Improving common bean performance under drought stress. Crop Sci. 1997, 37, 43–50. [Google Scholar] [CrossRef]
  42. Gavuzzi, P.; Rizza, F.; Palumbo, M.; Campanile, R.G.; Ricciardi, G.L.; Borghi, B. Evaluation of field and laboratory predictors of drought and heat tolerance in winter cereals. Can. J. Plant Sci. 1997, 77, 523–531. [Google Scholar] [CrossRef]
  43. Bouslama, M.; Schapaugh, W.T., Jr. Stress tolerance in soybeans. I. Evaluation of three screening techniques for heat and drought tolerance 1. Crop Sci. 1984, 24, 933–937. [Google Scholar] [CrossRef]
  44. Farshadfar, E.; Sutka, J. Multivariate analysis of drought tolerance in wheat substitution lines. Cereal Res. Commun. 2003, 31, 33–40. [Google Scholar] [CrossRef]
  45. Wickham, H. ggplot2: Elegant Graphics for Data Analysis; Springer: New York, NY, USA, 2016; ISBN1 978-3-319-24277-4. Available online: https://ggplot2.tidyverse.org (accessed on 16 July 2022)ISBN2 978-3-319-24277-4.
  46. R Development Core Team. R: A language and environment for statistical computing. Vienna: R Foundation for Statistical Computing. 2016. Available online: http://www.R-project.org (accessed on 16 April 2022).
  47. Fernandez, G.C. Effective selection criteria for assessing plant stress tolerance. In Proceedings of the International Symposium on Adaptation of Vegetables and other Food Crops in Temperature and Water Stress, Shanhua, Taiwan, 13–16 August 1992; pp. 257–270. [Google Scholar]
  48. Horikoshi, M.; Tang, Y. ggfortify: Data Visualization Tools for Statistical Analysis Results. 2016. Available online: https://CRAN.R-project.org/package=ggfortify (accessed on 16 July 2022).
  49. Tang, Y.; Horikoshi, M.; Li, W. ggfortify: Unified Interface to Visualize Statistical Result of Popular R Packages. R J. 2016, 8, 478–489. [Google Scholar] [CrossRef] [Green Version]
  50. Farshadfar, E.; Mahmodi, N.; Yaghotipoor, A. AMMI stability value and simultaneous estimation of yield and yield stability in bread wheat (Triticum aestivum L.). Aust. J. Crop Sci. 2011, 5, 1837–1844. [Google Scholar]
  51. Payne, R.; Murray, D.; Harding, S. An Introduction to the GenStat Command Language; VSN International: Hempstead, UK, 2017. [Google Scholar]
  52. Gauch, H.G., Jr. A simple protocol for AMMI analysis of yield trials. Crop Sci. 2013, 53, 1860–1869. [Google Scholar] [CrossRef]
  53. Cornelius, P.L. Statistical tests and retention of terms in the additive main effects and multiplicative interaction model for cultivar trials. Crop Sci. 1993, 33, 1186–1193. [Google Scholar] [CrossRef]
  54. Purchase, J.L.; Hatting, H.; Van Deventer, C.S. Genotype × Environment Interaction of Winter Wheat (Triticum aestivum L.) in South Africa: II. Stability Analysis of Yield Performance. S. Afr. J. Plant Soil 2000, 17, 101–107. [Google Scholar] [CrossRef]
  55. Purchase, J.L. Parametric Analysis to Describe G X E Interaction and Stability in Winter Wheat. PhD Thesis, Department of Agronomy, Faculty of Agriculture, University of the Orange Free State, Bloemfonten, South Africa, 1997. [Google Scholar]
  56. Kamara, A.Y.; Ekeleme, F.; Jibrin, J.M.; Tarawali, G.; Tofa, I. Assessment of level, extent and factors influencing Striga infestation of cereals and cowpea in a Sudan Savanna ecology of northern Nigeria. Agric. Ecosyst. Environ. 2014, 188, 111–121. [Google Scholar] [CrossRef]
  57. Rakshit, S.; Ganapathy, K.N.; Gomashe, S.S.; Dhandapani, A.; Swapna, M.; Mehtre, S.P.; Gadakh, S.R.; Ghorade, R.B.; Kamatar, M.Y.; Jadhav, B.D.; et al. Analysis of Indian post-rainy sorghum multi-location trial data reveals complexity of genotype × environment interaction. J. Agric. Sci. 2017, 155, 44–59. [Google Scholar] [CrossRef]
  58. Koutis, K.; Mavromatis, A.G.; Baxevanos, D.; Koutsika-Sotiriou, M. Multienvironmental evaluation of wheat landraces by GGE biplot analysis for organic breeding. Agric. Sci. 2012, 3, 66–74. [Google Scholar] [CrossRef] [Green Version]
  59. Samonte, S.O.P.; Wilson, L.T.; McClung, A.M.; Medley, J.C. Targeting cultivars onto rice growing environments using AMMI and SREG GGE biplot analyses. Crop Sci. 2005, 45, 2414–2424. [Google Scholar] [CrossRef] [Green Version]
  60. Kapanigowda, M.H.; Perumal, R.; Djanaguiraman, M.; Aiken, R.M.; Tesso, T.; Prasad, P.V.; Little, C.R. Genotypic variation in sorghum [Sorghum bicolor (L.) Moench] exotic germplasm collections for drought and disease tolerance. SpringerPlus 2013, 2, 650. [Google Scholar] [CrossRef] [Green Version]
  61. Emendack, Y.; Burke, J.; Sanchez, J.; Laza, H.E.; Hayes, C. Agro-morphological characterization of diverse sorghum lines for pre-and post-flowering drought tolerance. Aust. J. Crop Sci. 2018, 12, 135–150. [Google Scholar] [CrossRef]
  62. Rosenow, D.T.; Ejeta, G.; Clark, L.E.; Gilbbert, M.L.; Henzell, R.G.; Borrell, A.K.; Muchow, R.C. Breeding for pre-flowering and post-flowering drought stress in sorghum. In Proceedings of the International Conference on Genetic Improvement of Sorghum and Pearl Millet, Lubbock, TX, USA, 22–27 September 1996; INTSORMIL and ICRISAT Publication: Hyderabad, India, 1996; pp. 400–411. [Google Scholar]
  63. Burke, J.J.; Chen, J.; Burow, G.; Mechref, Y.; Rosenow, D.; Payton, P.; Xin, Z.; Hayes, C.M. Leaf dhurrin content is a quantitative measure of the level of pre-and postflowering drought tolerance in sorghum. Crop Sci. 2013, 53, 1056–1065. [Google Scholar] [CrossRef]
  64. Curtis, D.L. The races of sorghum in Nigeria: Their distribution and relative importance. Exp. Agric. 1967, 3, 275–286. [Google Scholar] [CrossRef]
  65. Smith, C.W.; Frederiksen, R.A. (Eds.) Sorghum: Origin, History, Technology, and Production; John Wiley & Sons: Hoboken, NJ, USA, 2000; Volume 2. [Google Scholar]
  66. Reddy, P.S.; Reddy, B.V. History of sorghum improvement. In Breeding Sorghum for Diverse End Uses; Woodhead Publishing: Sawston, UK, 2019; pp. 61–75. [Google Scholar]
Figure 1. Scheme showing grouping of 225 sorghum genotypes for mean grain yield (t/ha) when evaluated under non-stressed (NS), pre-anthesis drought-stress (PreADS), and post-anthesis drought-stress (PoADS) conditions in the greenhouse (A,B) and field (C,D) environments, and across both glasshouse and field (E,F) environments. The box plots summarise the five data summaries (minimum, first quartile, median, third quartile, and maximum) of grain yields under NS, PreADs, and PoADS conditions.
Agronomy 13 00557 g001aAgronomy 13 00557 g001b
Figure 2. Simple linear regression model fitting grain yield (t/ha) performance of 225 sorghum genotypes evaluated under non-stressed (NS), pre-anthesis drought-stress (PreADS), and post-anthesis drought-stress (PoADS) in the glasshouse (A,B) and field (C,D) environments, and across both glasshouse and field (E,F) environments.
Agronomy 13 00557 g002aAgronomy 13 00557 g002b
Table 1. Drought tolerance/susceptibility indices used to evaluate 225 African sorghum genotypes.
S/NoDrought Tolerance Index AbbreviationEquation 1References
1Tolerance indexTOL Y p Y s Rosielle and Hamblin [38]
2Mean productivityMP Y s + Y p 2 Rosielle and Hamblin [38]
3Harmonic meanHM 2 Y P × Y s Y p Y s Jafari et al. [39]
4Stress susceptibility indexSSI 1 Y s Y p 1 Y ¯ s Y ¯ p Fisher and Maurer [40]
5Geometric mean productivityGMP Y p × Y s Schneider et al. [41]
6Stress tolerance indexSTI Y p Y s ( Y ¯ p ) 2 Schneider et al. [41]
7Yield IndexYI Y s Y ¯ s Gavuzzi et al. [42]
8Yield Stability IndexYSI Y s Y p Bouslama and Schapaugh [43]
9Modified stress tolerance
index
MSTI/K1STI Y p 2 Y ¯ p 2 × Y p + Y S Y ¯ p 2 Farshadfar and Sutka [44]
10Modified stress tolerance
index
MSTI/K2STI Y s 2 Y ¯ s 2 × Y p + Y S Y ¯ p 2 Farshadfar and Sutka [44]
Y s and Y p are stress and optimal (potential) grain yield of a given genotype, respectively. Y ¯ s and Y ¯ p are average grain yield of all genotypes under stress and nonstressed conditions, respectively. 1 Mathematical formula of drought tolerance/susceptibility indices.
Table 2. Best linear and unbiased predictions (BLUPs) and best linear and unbiased estimates (BLUEs) for grain yield of 225 sorghum genotypes evaluated under non-stress conditions, pre- and post-anthesis drought stress in glasshouse and field environments.
Genotype CodeE1E2E3E4E5E6OVERALL
BLUPsBLUEsBLUPsBLUEsBLUPsBLUEsBLUPsBLUEsBLUPsBLUEsBLUPsBLUEsBLUPsBLUEs
G13.453.472.162.272.802.833.853.852.222.302.852.862.902.93
G24.394.531.491.423.023.075.105.151.531.503.193.223.113.15
G31.411.160.850.600.890.771.351.230.760.600.880.771.010.85
G42.562.461.291.161.851.802.732.671.251.171.871.821.921.85
G54.214.321.461.372.212.194.824.861.451.402.262.232.722.73
G64.284.402.212.342.382.384.864.902.282.362.412.403.093.13
G74.074.171.931.982.402.394.704.742.032.082.532.522.952.98
G84.664.842.452.653.693.795.045.092.532.663.753.813.713.81
G95.415.691.962.022.432.436.096.182.002.042.462.453.403.47
G104.684.861.651.622.662.685.395.461.671.662.732.733.123.17
G114.064.152.012.092.302.294.594.612.062.112.332.312.912.93
G122.592.491.321.201.391.312.882.831.331.261.451.381.821.74
G134.554.711.911.962.702.724.914.951.941.972.732.733.133.17
G143.593.621.601.552.412.413.943.941.591.562.442.432.592.58
G154.875.071.831.853.223.285.625.691.871.893.313.353.453.52
G164.454.591.521.452.742.775.055.101.511.472.792.803.003.03
G173.083.051.461.381.751.703.493.461.491.451.841.792.182.14
G184.714.891.831.862.032.005.105.151.851.872.042.012.932.96
G192.792.721.481.401.261.173.002.951.461.411.261.181.881.80
G203.653.691.641.612.122.104.134.141.651.642.172.142.562.55
G212.452.341.311.191.121.022.652.591.271.201.121.031.651.56
G222.462.351.381.281.891.842.732.671.401.351.981.941.971.90
G233.924.001.421.332.072.044.204.211.391.342.092.052.512.49
G242.262.131.361.251.131.032.392.321.331.271.131.041.611.50
G253.063.022.242.372.582.593.423.402.332.422.652.652.732.74
G262.722.641.120.941.511.442.982.931.060.951.521.461.811.72
G273.473.491.050.862.202.183.973.971.020.902.322.302.312.28
G284.865.061.361.252.502.505.275.331.321.262.532.522.962.98
G291.691.480.890.650.790.661.711.610.800.650.780.671.100.95
G302.482.360.700.401.090.992.722.660.600.411.101.011.421.30
G313.303.291.321.202.292.283.673.651.291.212.322.302.352.32
G323.753.811.711.702.452.454.324.341.781.792.592.582.772.78
G331.721.511.020.821.070.961.701.600.950.831.060.971.251.11
G341.621.391.080.891.040.931.631.521.010.901.030.941.231.09
G353.153.131.191.031.381.303.533.511.151.051.411.331.961.89
G362.432.311.631.601.821.782.632.571.631.621.841.792.011.94
G373.303.291.731.731.921.883.753.741.811.822.021.992.432.41
G383.913.991.761.772.682.704.194.201.771.782.712.722.842.86
G394.624.791.871.912.752.775.155.211.901.932.792.803.183.23
G404.194.301.992.052.702.724.804.832.042.092.772.783.093.13
G412.732.661.972.041.971.933.002.952.022.061.991.952.302.26
G423.733.781.972.032.932.974.294.302.082.143.103.123.023.05
G432.532.431.881.912.382.372.622.561.901.922.402.392.302.26
G442.922.871.871.902.592.613.163.121.901.922.632.632.522.51
G454.564.721.911.953.213.275.255.311.961.993.303.343.363.43
G463.513.541.471.392.592.603.943.931.451.412.632.632.592.58
G473.673.712.322.483.193.254.214.222.492.613.383.423.233.28
G483.203.181.841.872.192.173.383.351.861.882.212.182.462.44
G493.083.041.611.572.512.523.343.311.601.582.552.542.452.43
G502.772.691.911.952.242.233.073.021.961.992.292.272.382.36
Mean3.341.762.464.051.752.72.68
CV (%)29.1323.0030.1131.8826.1132.0513.9
Significance (G)***************
CV = coefficient of variation, G = Genotype significance, E1 = greenhouse and non-stressed, E2 = greenhouse and pre-anthesis drought stress, E3 = greenhouse and post- anthesis drought stress, E4 = Ukulinga and non-stressed, E5 = Ukulinga and pre-anthesis drought stress, E6 = Ukulinga and post-anthesis drought stress, ** = Significant at the 5% probability level, *** = significant at the 1% probability level. See codes of genotypes in Supplementary Table S1.
Table 3. Values of tolerance, susceptibility indices, and grain yield of the assessed sorghum genotype under stress and non-stress conditions in glasshouse and field environments.
CodeTOLMPHMSSIGMPSTIYIYSIMSTI/k1STIMSTI/k2STI
PreADSPoADSPreADSPoADSPreADSPoADSPreADSPoADSPreADSPoADSPreADSPoADSPreADSPoADSPreADSPoADSPreADSPoADSPreADSPoADS
G11.500.882.973.2811.0223.920.770.791.220.940.110.061.271.100.600.760.440.490.704.74
G23.061.573.163.905.0118.681.241.111.751.250.220.110.931.210.350.670.750.920.407.19
G30.900.580.891.061.333.571.271.420.950.760.070.040.250.300.330.570.020.020.010.12
G41.520.831.872.213.8411.351.101.051.230.910.110.060.630.700.420.680.140.160.111.34
G52.922.102.943.354.469.661.261.581.711.450.210.150.840.890.340.520.610.690.313.63
G62.222.003.423.539.4711.460.931.461.491.410.160.151.320.980.510.560.750.780.874.54
G72.311.803.193.457.6412.331.011.371.521.340.170.131.160.990.470.590.650.700.634.42
G82.231.153.824.3511.9832.260.860.781.491.070.160.081.541.460.550.771.001.141.3311.15
G93.462.963.874.136.9510.031.171.751.861.720.250.221.221.030.380.471.311.390.856.10
G103.162.153.363.865.5412.771.221.451.781.470.230.161.011.080.360.560.881.010.505.98
G112.201.863.183.358.1011.140.981.441.481.360.160.141.190.940.490.570.630.660.663.92
G121.541.271.912.053.955.991.101.571.241.130.110.090.650.550.420.530.150.160.120.84
G132.661.883.353.747.1313.941.081.331.631.370.190.141.151.090.430.600.790.880.655.75
G142.161.312.663.085.4713.891.101.161.471.140.160.100.900.940.420.650.400.460.323.47
G153.161.853.614.266.6718.721.161.181.781.360.230.141.161.290.390.641.041.230.719.09
G163.061.853.143.744.9114.191.251.321.751.360.220.140.921.090.340.600.730.870.395.79
G171.861.422.302.524.768.241.101.461.361.190.140.100.780.700.420.560.260.280.211.65
G182.882.593.343.496.308.121.151.791.701.610.210.191.080.850.400.460.820.860.573.58
G191.541.532.062.064.724.771.041.801.241.240.110.110.730.500.450.460.180.180.160.73
G202.211.642.733.015.6210.241.101.421.491.280.160.120.920.850.420.570.430.470.342.88
G211.421.371.771.803.724.081.091.821.191.170.100.100.610.430.430.450.120.120.100.48
G221.360.731.922.234.7213.331.000.931.170.850.100.050.700.720.480.720.140.160.141.44
G232.581.852.683.054.269.121.241.541.611.360.190.140.790.820.350.530.450.510.242.79
G241.181.171.701.704.284.380.981.691.091.080.090.090.630.430.480.490.100.100.100.44
G251.070.712.802.9814.1624.710.610.701.030.840.080.051.291.020.680.790.330.350.683.64
G261.861.291.842.132.736.411.281.541.361.130.140.090.520.580.330.540.150.180.070.96
G272.641.412.312.932.7111.481.391.281.631.190.190.100.560.860.270.610.330.410.112.81
G283.492.333.183.764.0510.951.351.571.871.530.260.170.821.000.290.530.830.980.315.16
G291.130.931.071.171.472.481.311.891.060.960.080.070.290.270.310.430.030.030.010.13
G302.071.431.431.750.963.611.591.921.441.190.150.100.230.400.160.420.090.110.010.41
G312.191.172.352.863.9313.391.211.131.481.080.160.090.710.880.360.660.300.360.172.80
G322.241.462.893.286.3414.051.061.201.501.210.160.111.010.990.440.640.500.570.434.10
G331.000.711.181.332.294.641.131.391.000.840.070.050.390.380.410.580.040.040.030.25
G340.870.651.161.272.694.621.031.360.930.810.060.050.420.370.460.590.030.030.030.22
G352.201.802.132.333.005.101.301.851.481.340.160.130.580.550.320.440.240.260.111.01
G361.080.762.012.186.9712.110.800.981.040.870.080.060.840.700.580.700.140.150.211.30
G371.791.482.602.766.699.550.971.401.341.220.130.110.970.780.490.580.340.360.362.23
G382.231.322.923.386.5316.591.051.091.491.150.160.101.031.050.450.670.510.590.454.70
G392.821.963.413.856.8514.101.111.351.681.400.210.141.141.110.420.590.850.960.656.20
G402.371.663.293.647.9315.151.011.231.541.290.170.121.201.090.470.630.700.780.695.55
G411.020.922.402.4510.7912.620.671.051.010.960.070.071.080.770.650.680.220.220.411.82
G421.951.023.073.538.6623.900.920.841.401.010.140.071.191.170.520.750.540.620.645.85
G430.880.342.222.5010.7736.660.630.420.940.580.060.021.020.900.670.870.170.190.342.31
G441.270.542.472.848.9929.680.780.571.130.730.090.041.051.000.590.830.260.290.403.27
G452.791.583.494.107.3220.511.091.071.671.260.200.121.191.280.430.680.891.050.738.43
G462.241.122.583.144.8117.111.151.001.501.060.160.080.831.000.390.700.380.460.263.90
G471.540.743.273.6713.1335.970.720.611.240.860.110.051.431.280.620.820.570.640.976.98
G481.511.102.552.767.8113.330.871.101.231.050.110.081.020.860.540.670.300.320.392.54
G491.670.752.392.866.0121.420.990.771.290.870.120.050.890.960.480.770.270.320.283.16
G501.120.722.412.619.8118.480.720.811.060.850.080.051.060.870.620.760.230.250.392.38
Mean1.941.112.723.147.2223.240.990.991.371.020.140.081.001.000.480.700.490.570.494.86
Minimum0.220.060.891.060.832.480.240.070.470.240.020.000.190.270.160.390.020.020.010.12
Maximum3.522.964.114.8923.89369.221.592.031.881.720.260.221.691.600.870.981.421.731.7114.83
PreADS and PoADS denote pre-anthesis drought-stress and post-anthesis drought-stress, respectively; see codes of genotypes in Supplementary Table S1 and codes of drought tolerance indices in Table 1.
Table 4. Rank, rank mean R ¯ and standard deviation of ranks (SDR) of drought tolerance indices of the sorghum genotypes in PreADS.
Code Genotype Name or Designation YpYsTOLMPHMSSIGMPSTIYIYSIMSTI/
k1STI
MSTI/
k2STI
R ¯
SDR
Drought tolerant genotypes
G56CSRO181152174374741435134.1744.62
G157KAURA MAI BAKI KONA15316342268636336810240.3345.72
G8ICNSL2014-022-4314142101253848445321341.7541.50
G152BOG FARWA335149121961777756124443.9241.43
G106ICNSL2014-021-1386144152160828266027545.5040.29
G114JAR LAU9111895401023737111028746.5054.30
G128BASSA DAWA498127211751999985136847.8338.83
G184CAPARLKSG20150291291215816297468681274261048.0041.35
G129ICNSL2014-023-54132063471252020131253648.7563.63
G178YAR MAGOGO201517013358856561588171348.8345.41
G53CAPARLGSG20150124489131242355959595537949.1737.94
G136TUNKURA391415622307170701471301450.0839.28
G116JAR KAURA211817614419250501892191550.5046.42
G167MAGARA251716618388660601786251751.2542.73
G182GWAZA BANJI BORNO74792411029134134729661152.8345.09
G70FARA FARA MAI-SHAHO342016423398562622085281953.4240.77
G120GAGARAU–4451915328337573731975402054.4236.97
G71TAKUMBO8110894911271371371027701655.3345.29
G123MASAKWA62420766513619192413671855.5864.10
G185FARAFARA KADUNA23251782050109484825109232156.5847.68
Drought sensitive genotypes
G215ICSV 14522121572192046421921921564221216173.6775.61
G191KAURA BORNO18719876194202180150150198180190198175.2534.33
G73ZAGO BLACK GLUME20020052204201151174174200151200202175.7541.86
G113JAR BALAKWAMA215216122132108721421421687213215176.0068.17
G211GP11BR20920924210205115202202209115210211176.7557.40
G97SAMSORG 717920187190208199139139201199184201177.2535.20
G135NDU VARI218217112202129821521521798216217179.5067.04
G163HIPUSINI19620366201206181160160203181196204179.7537.71
G26MAI-GOJE173208102191213216124124208216180206180.0839.21
G222IS 826819920659206207176167167206176201205181.2539.98
G72SAMBULMU- 3176210103195218218123123210218183207182.0040.30
G3412KNICSV-297-421421817216216128209209218128212218183.5859.59
G92SAMSORG 4219421184205217207142142211207197208185.4239.15
G3012KNICSV-297-2193224124209224225102102224225205223190.0047.82
G3312KNICSV-17621121925214219182201201219182211219191.9251.94
G148KOMA21722022221220190204204220190222220195.8353.64
G2912KNICSV-29321222239222222219187187222219214222198.9249.77
G201AKO VARIETY21622127223221211199199221211219221199.0852.50
G100AS 9721322550224225224176176225224224225200.9248.83
G3GADAM22522321225223215205205223215225224202.4255.16
Yp = grain yield under NS condition, Ys grain yield under drought-stress condition, R ¯   = Rank Mean, SDR = Standard Deviation of Rank. See codes of genotypes in Supplementary Table S1 and codes of drought tolerance indices in Table 1.
Table 5. Rank, rank mean R ¯ , and standard deviation of ranks (SDR) of drought resistance/tolerance indices of the sorghum genotypes (PoADS).
CODEGENOTYPEYpYsTOLMPHMSSIGMPSTIYIYSIMSTI/k1STIMSTI/k2STI
R ¯
SDR
Drought tolerant genotypes
G115DANYAR BANA111119322441071071446238.9244.17
G157KAURA MAI BAKI KONA15413153253959545312441.9242.04
G120GAGARAU–4453641282016216232031644.6755.30
G144KAURA SHORT PANICLE- 112197147120292921201145.8362.12
G152BOG FARWA33610915274511711764525746.0041.54
G185FARAFARA KADUNA231213516366491911264211148.0039.01
G68PAM PARA–237111122030481141141148281549.0039.00
G8ICNSL2014-022-431131231833561031031356261449.0837.96
G141ICNSL2014-024-753576231530150150530401349.1749.12
G178YAR MAGOGO201514114427485851574181249.5839.85
G104DAN YARA37196261130303071302350.0863.09
G129ICNSL2014-023-548193462127333381273550.5861.25
G78E 2954979281733147147933431651.2546.88
G127DANGAMA WULCHICHI121717275310954541710911851.9250.50
G126JAN KAURA 15910703314261561561026511952.5049.81
G119YAR LAZAU10201796591154747201159953.0053.06
G167MAGARA252113921437687872176242053.3337.25
G128BASSA DAWA49181053031461211211846382353.8337.24
G56CSRO182218686912540402212581055.2556.60
G83AS 1526219803518341461461934532756.0844.02
Drought sensitive genotypes
G58SAMSORG 4919019799196203183127127197183194198174.5033.93
G215ICSV 145221214192161978620720721486221215175.2566.62
G12YARWASHA1802041381942102068888204206186200175.3343.27
G214GPP4BR(H)C519720094198205182132132200182196201176.5834.89
G199YAR BURUNDUZU223215202192019220620621592223216177.3365.68
G97SAMSORG 71792101832012222244343210224189206177.8362.00
G155YAR KOMA222216212202029720520521697224217178.5064.57
G21GAGARAWA–31922121562042202197070212219199208181.7552.67
G222IS 8268199206120205214212106106206212204205182.9242.02
G3012KNICSV-297-21932181642062232236262218223201210183.5856.69
G211GP11BR20920750210208176176176207176209211184.5843.30
G24ADAMAWA–22022131282072192159898213215205209185.1745.33
G148KOMA21721731218207151195195217151218218186.2552.47
G135NDU VARI21822033221211163193193220163219221189.5851.57
G201AKO VARIETY21621935217212171191191219171216219189.7549.86
G3312KNICSV-17621122155213217193171171221193211220191.4244.63
G3412KNICSV-297-421422246222218188180180222188215222193.0847.36
G100AS 9721322360223221202166166223202214223194.6745.19
G2912KNICSV-29321222593224225222133133225222217224196.2545.36
G3GADAM22522437225224197189189224197225225198.4250.85
Yp = grain yield under NS condition, Ys grain yield under drought-stress condition, R ¯ = Rank Mean, SDR = Standard Deviation of Rank. See codes of genotypes in Supplementary Table S1 and codes of drought tolerance indices in Table 1.
Table 6. Additive main effects and multiplicative interaction analysis of variance for grain yield of 225 sorghum accessions tested in six environments.
Source of VariationDegree of FreedomSum of Square†TV (%)FR-Test MS
Total26994305.32 1.60
Treatments13494117.54 3.05
Genotype (G)2241593.1838.77.11 **
Environment (E)51837.0344.6367.30 **
GEI1120687.2216.70.61 **
Error1344186.71 0.14
Block/E62.25 0.40
IPCA1228421.8161.41.85 **
IPCA2226133.1419.40.59 **
IPCA322488.1012.80.39 **
Residuals44244.11 0.10
** Highly significant at p < 0.01 probability level; †TV, total variance; GEI, genotype-by-environment interaction; IPCA1: The first interaction principal components axes; IPCA2: The second interaction principal components axes; IPCA3: The third interaction principal components axes; FR-Test MS = The mean sum of squares and test of significance.
Table 7. Winning sorghum genotypes for grain yield based on additive main effects and multiplicative interaction (AMMI) model families.
Environment Code Environment DesignationsMeanScoreAMMI Model Family #
1234
E1TN-NS3.3441.382G9G144G123G119
E2TN-PR1.755−1.598G56G63G182G8
E3TN-PO2.464−0.432G120G144G78G115
E4UK-NS4.0492.565G131G109G104G127
E5UK-PR1.750−1.809G56G63G106G71
E6UK-PO2.698−0.109G115G130G126G120
# Genotype (G) codes are presented in Supplementary Table S1. E1 = greenhouse and non-stressed (TN-NS); E2 = greenhouse and pre-flowering drought stress (TN-PR); E3 = greenhouse and post-flowering drought stress (TN-PO); E4 = Ukulinga and non-stressed (UK-NS); E5 = Ukulinga and pre-flowering (UK-PR); E6 = Ukulinga and post-flowering (UK-PO).
Table 8. Mean grain yield value, IPCA-1 and IPCA-2 scores, and AMMI stability values (ASV) of 225 sorghum genotypes for grain yield.
Genotype CodeMeans (t/ha)IPCA1IPCA2ASV
Top 10 most stable
G423.05−0.0100.03
G2062.44−0.010.020.05
G1862.55−0.0200.06
G1473.050.01−0.050.06
G1772.54−0.010.050.06
G1922.490.020.050.07
G1813.250.02−0.130.14
G721.73−0.040.090.15
G1682.31−0.040.110.16
G1943.42−0.03−0.130.16
Top 10 least stable
G1093.280.6201.97
G1081.64−0.6−0.011.89
G93.470.540.481.77
G1313.370.52−0.531.72
G1273.610.51−0.351.65
G282.980.510.31.63
G1444.030.49−0.041.56
G1043.870.48−0.151.54
G1901.21−0.48−0.091.52
G1791.19−0.48−0.031.51
See genotype (G) codes in Supplementary Table S1; IPCA1: The first interaction principal components axes; IPCA2: The second interaction principal components axes.
Disclaimer/Publisher’s Note: The statements, opinions and data contained in all publications are solely those of the individual author(s) and contributor(s) and not of MDPI and/or the editor(s). MDPI and/or the editor(s) disclaim responsibility for any injury to people or property resulting from any ideas, methods, instructions or products referred to in the content.

