

Performance of Winter-Sown Chickpea Breeding Lines with Contrasting Levels of Resistance to Ascochyta Blight


Abstract
:1. Introduction
2. Materials and Methods
2.1. Plant and Experimental Design
2.2. Statistical Analysis
2.2.1. Variance Components
2.2.2. GEI Analysis
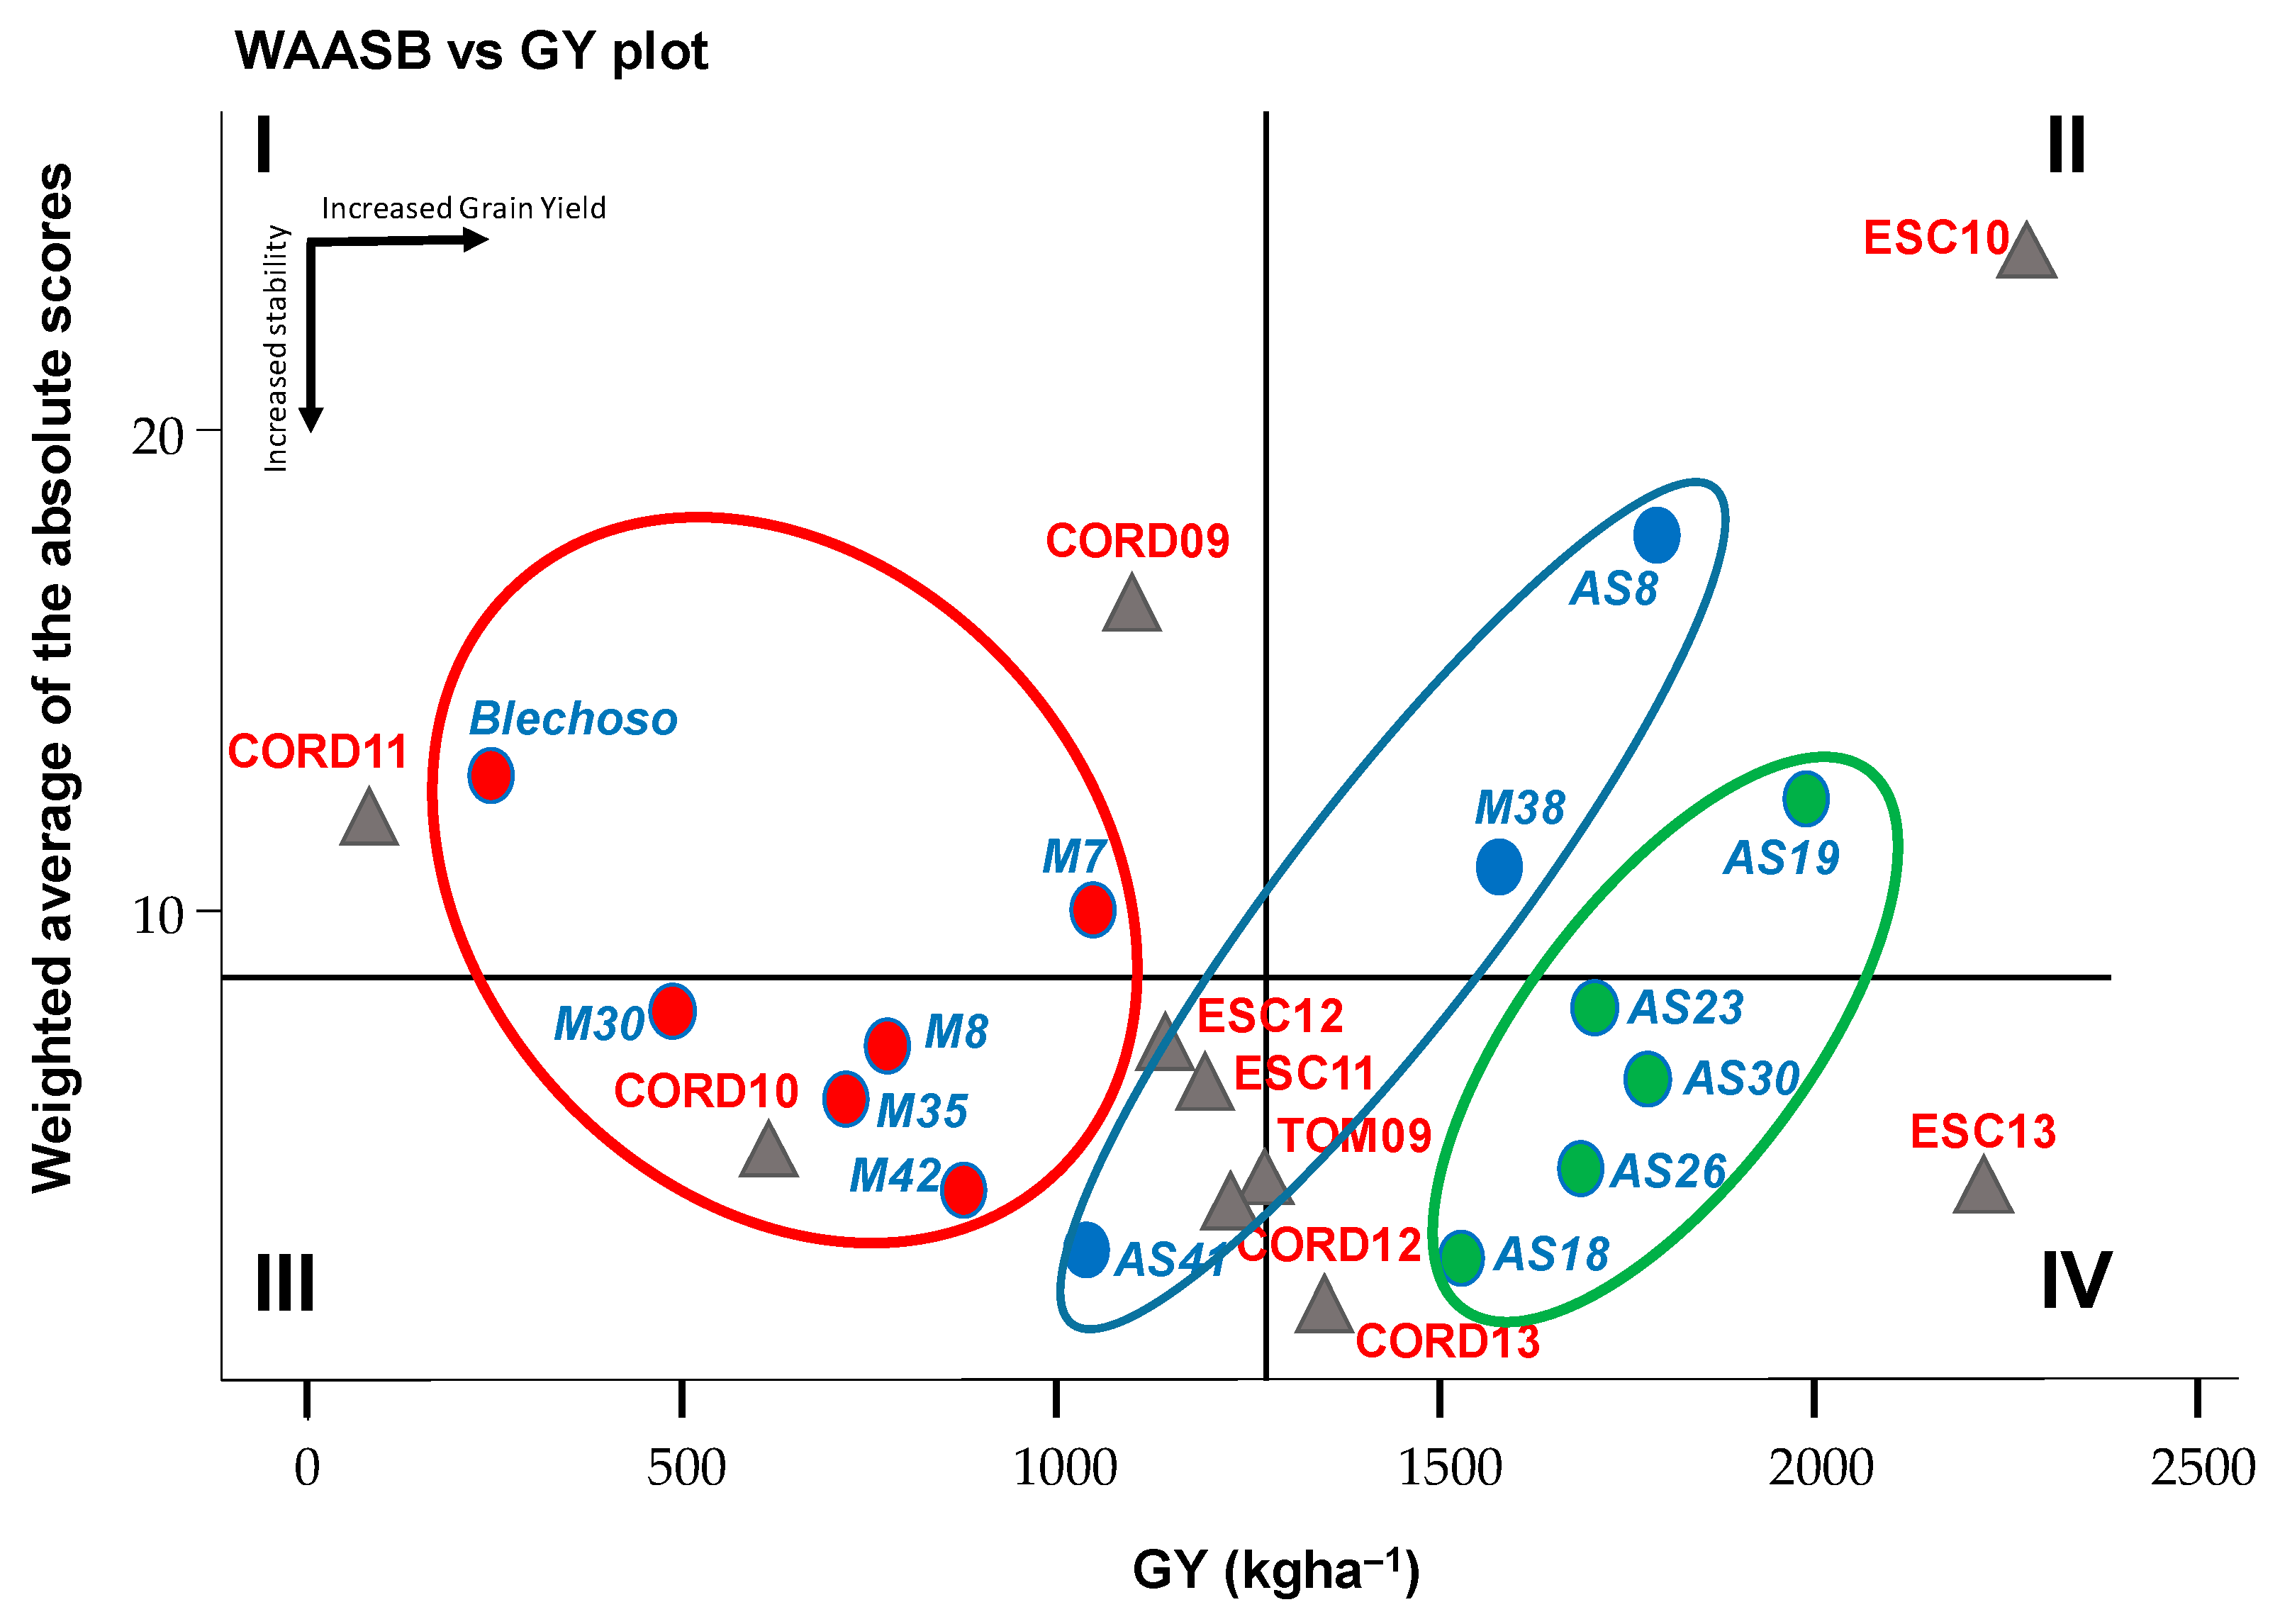
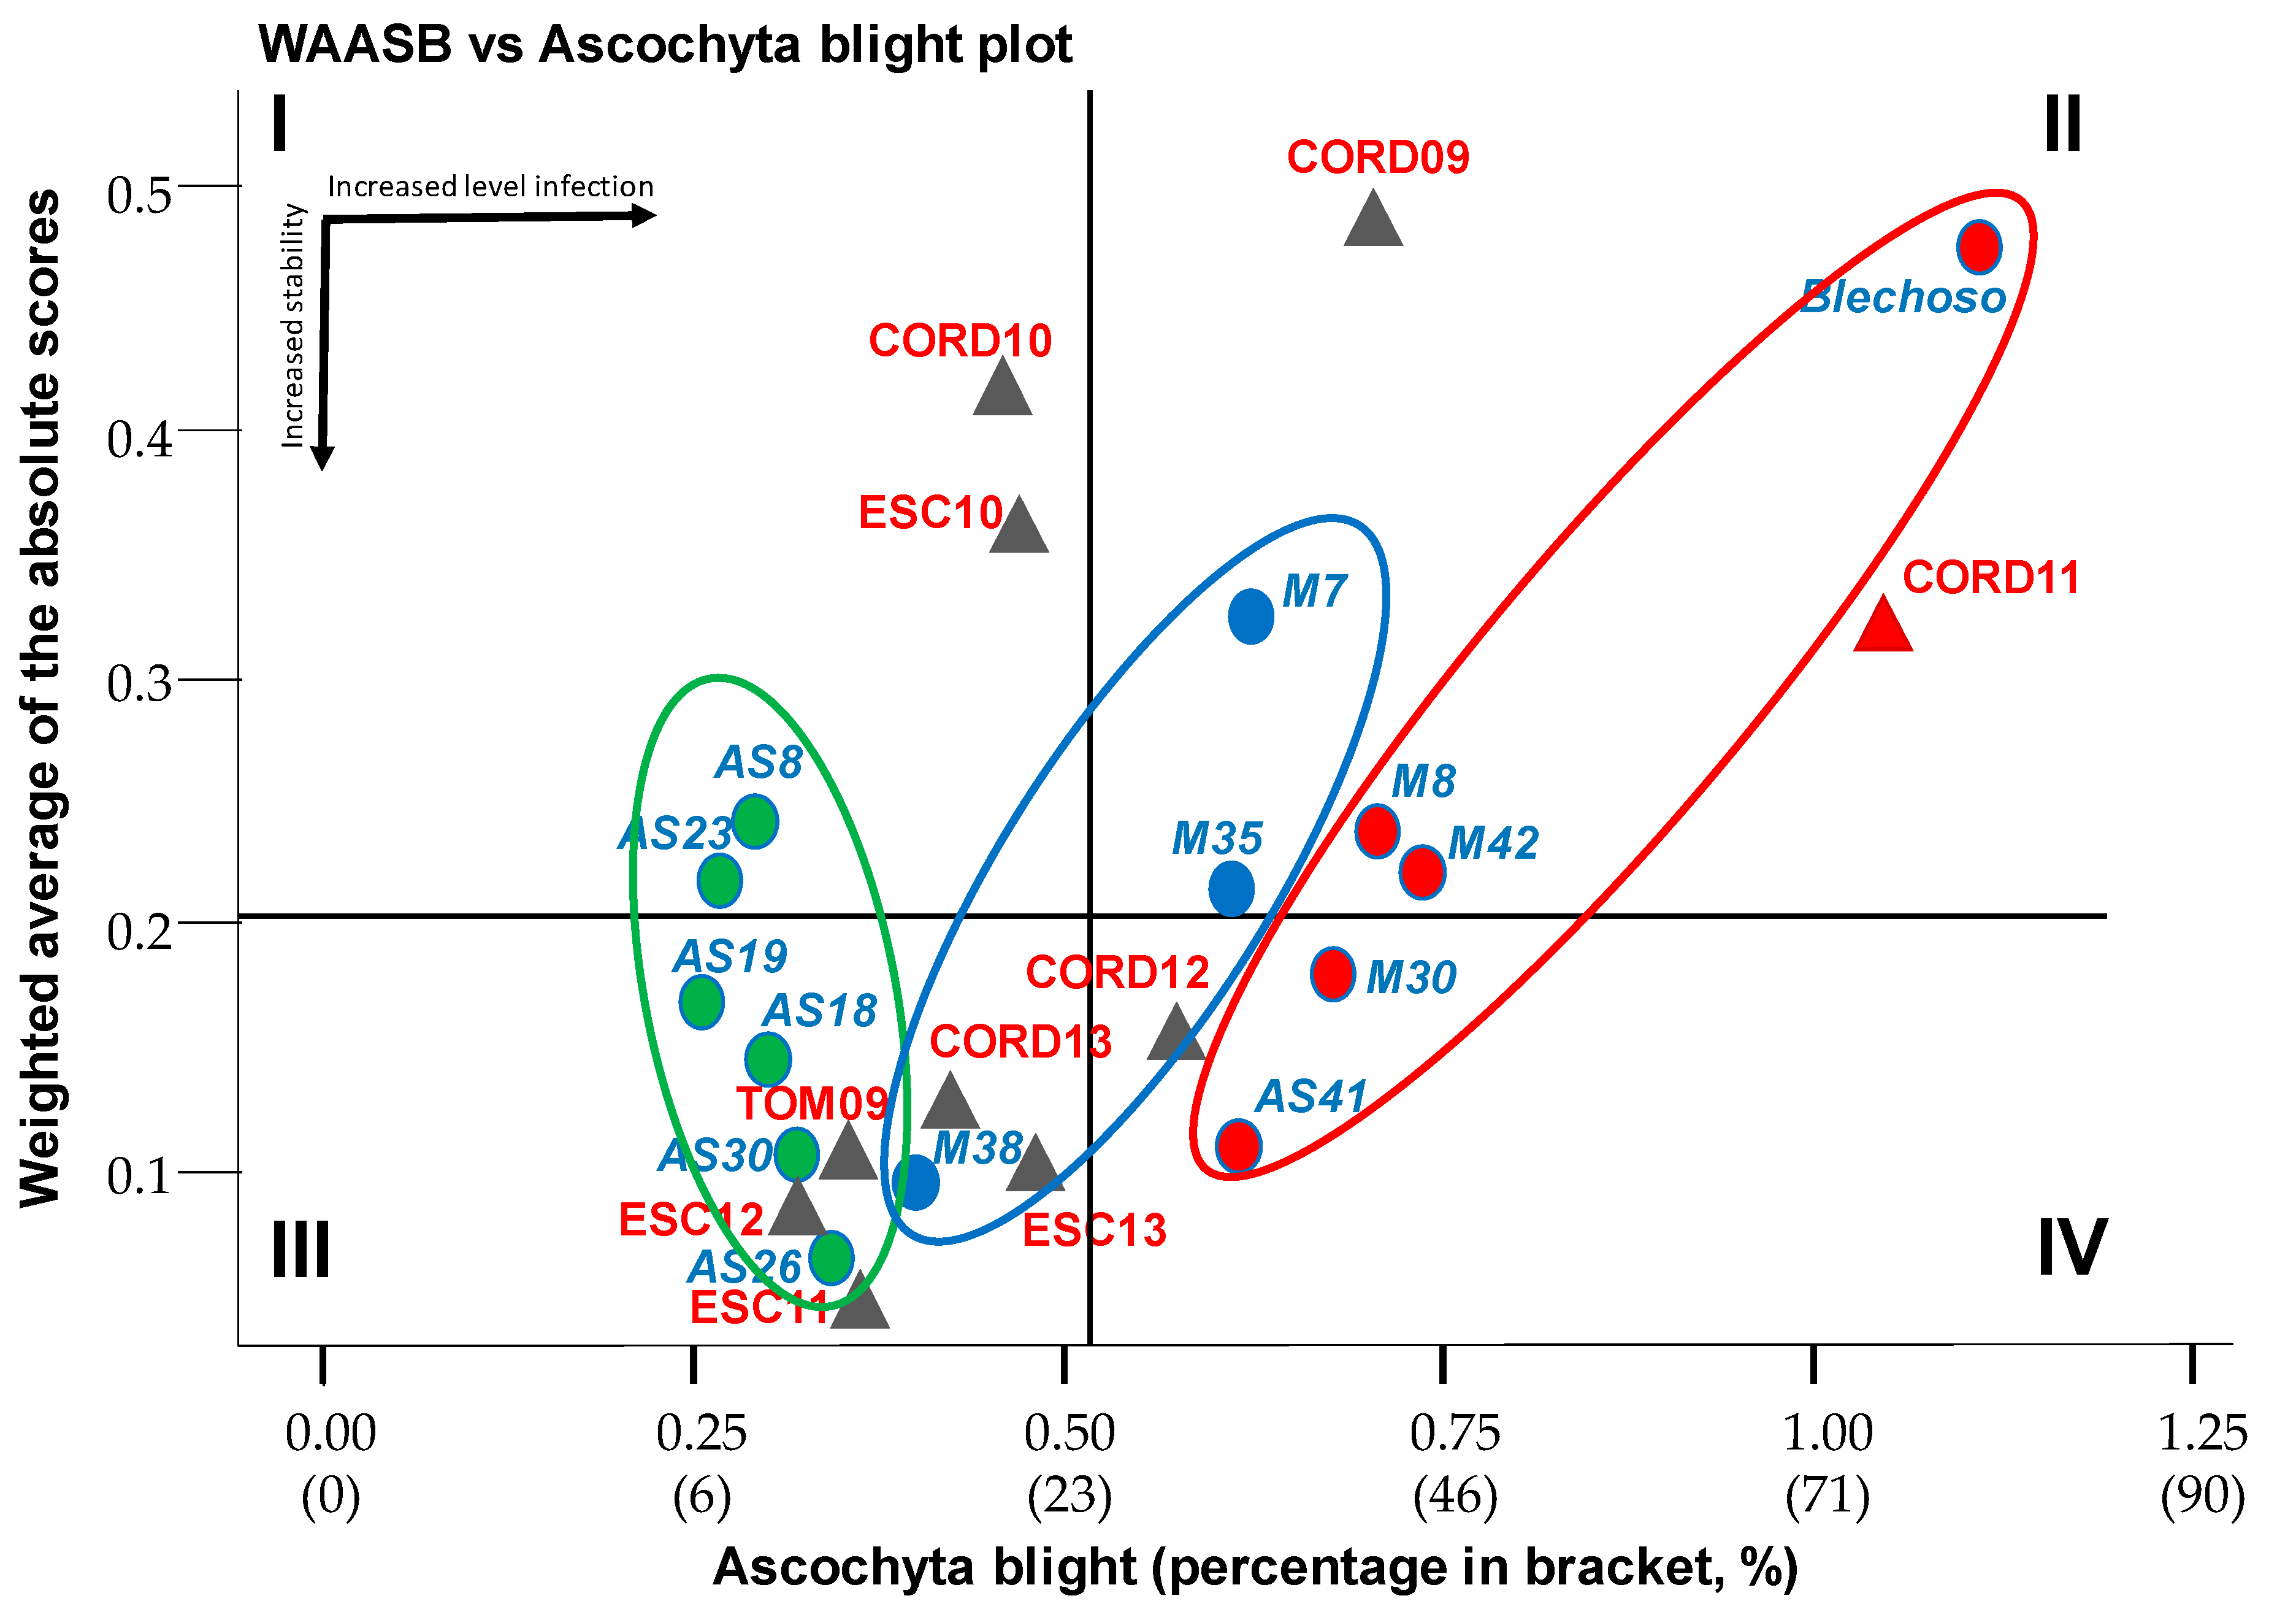
Means vs. Stability Biplot
Cluster Analysis
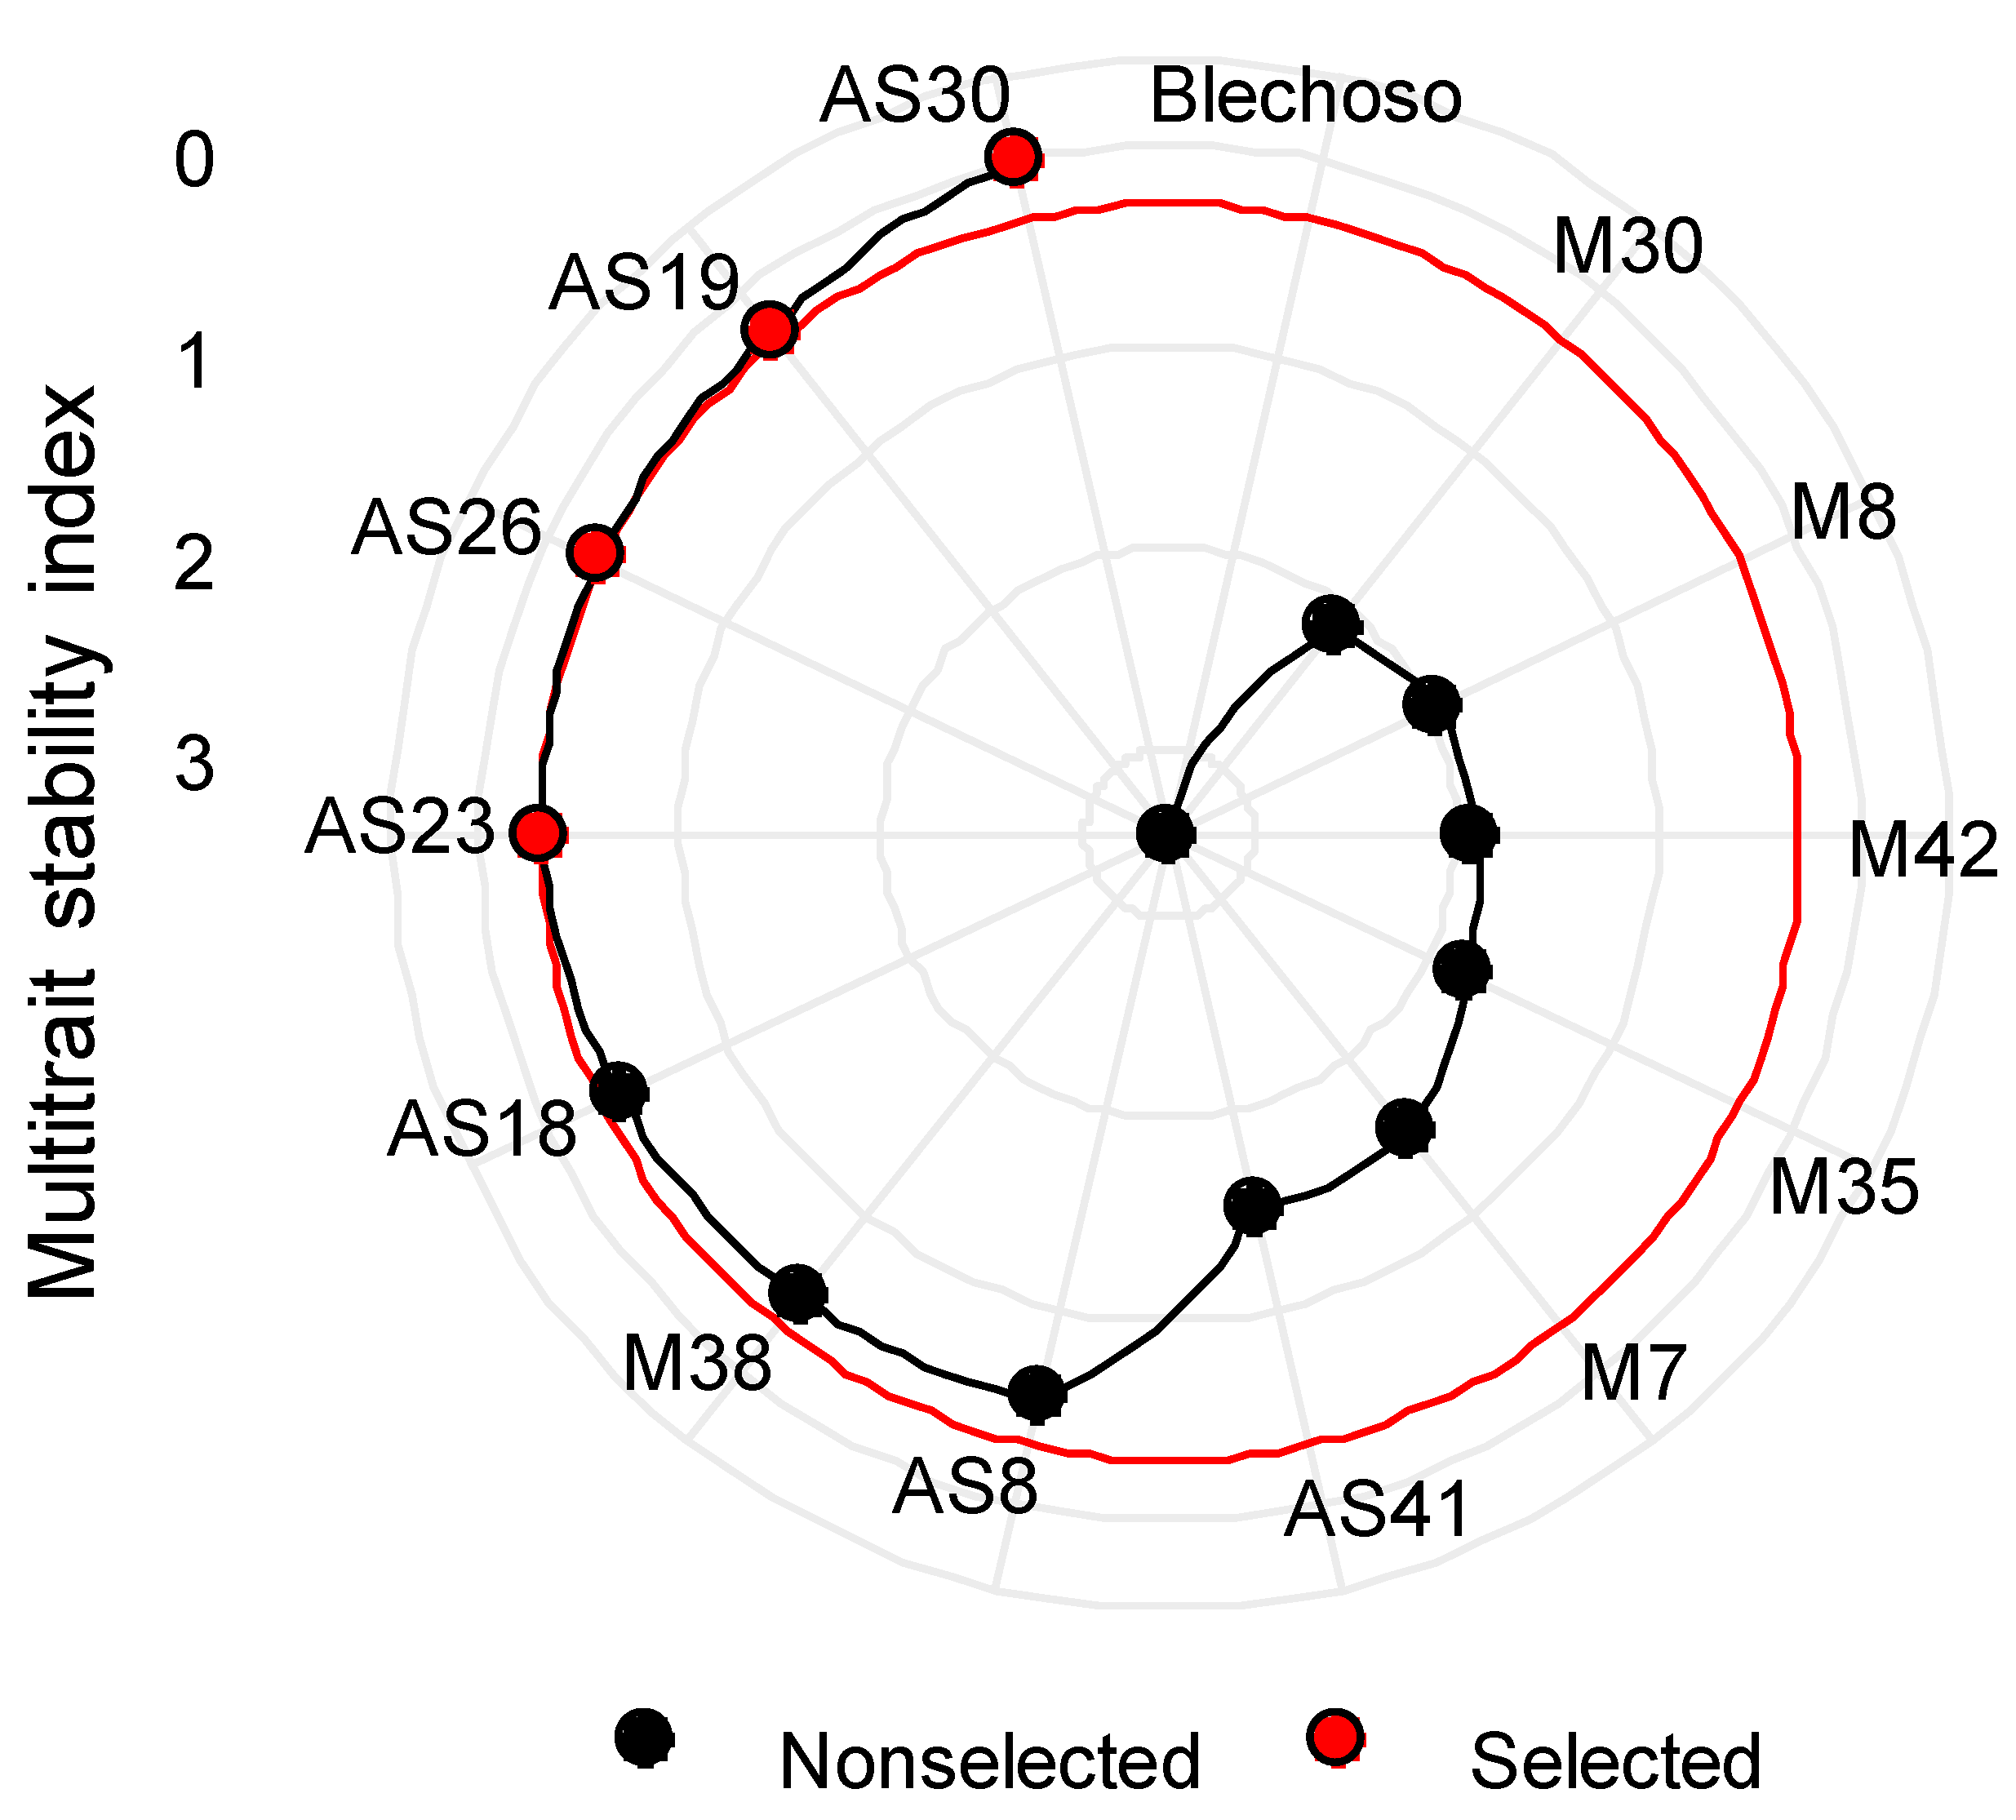
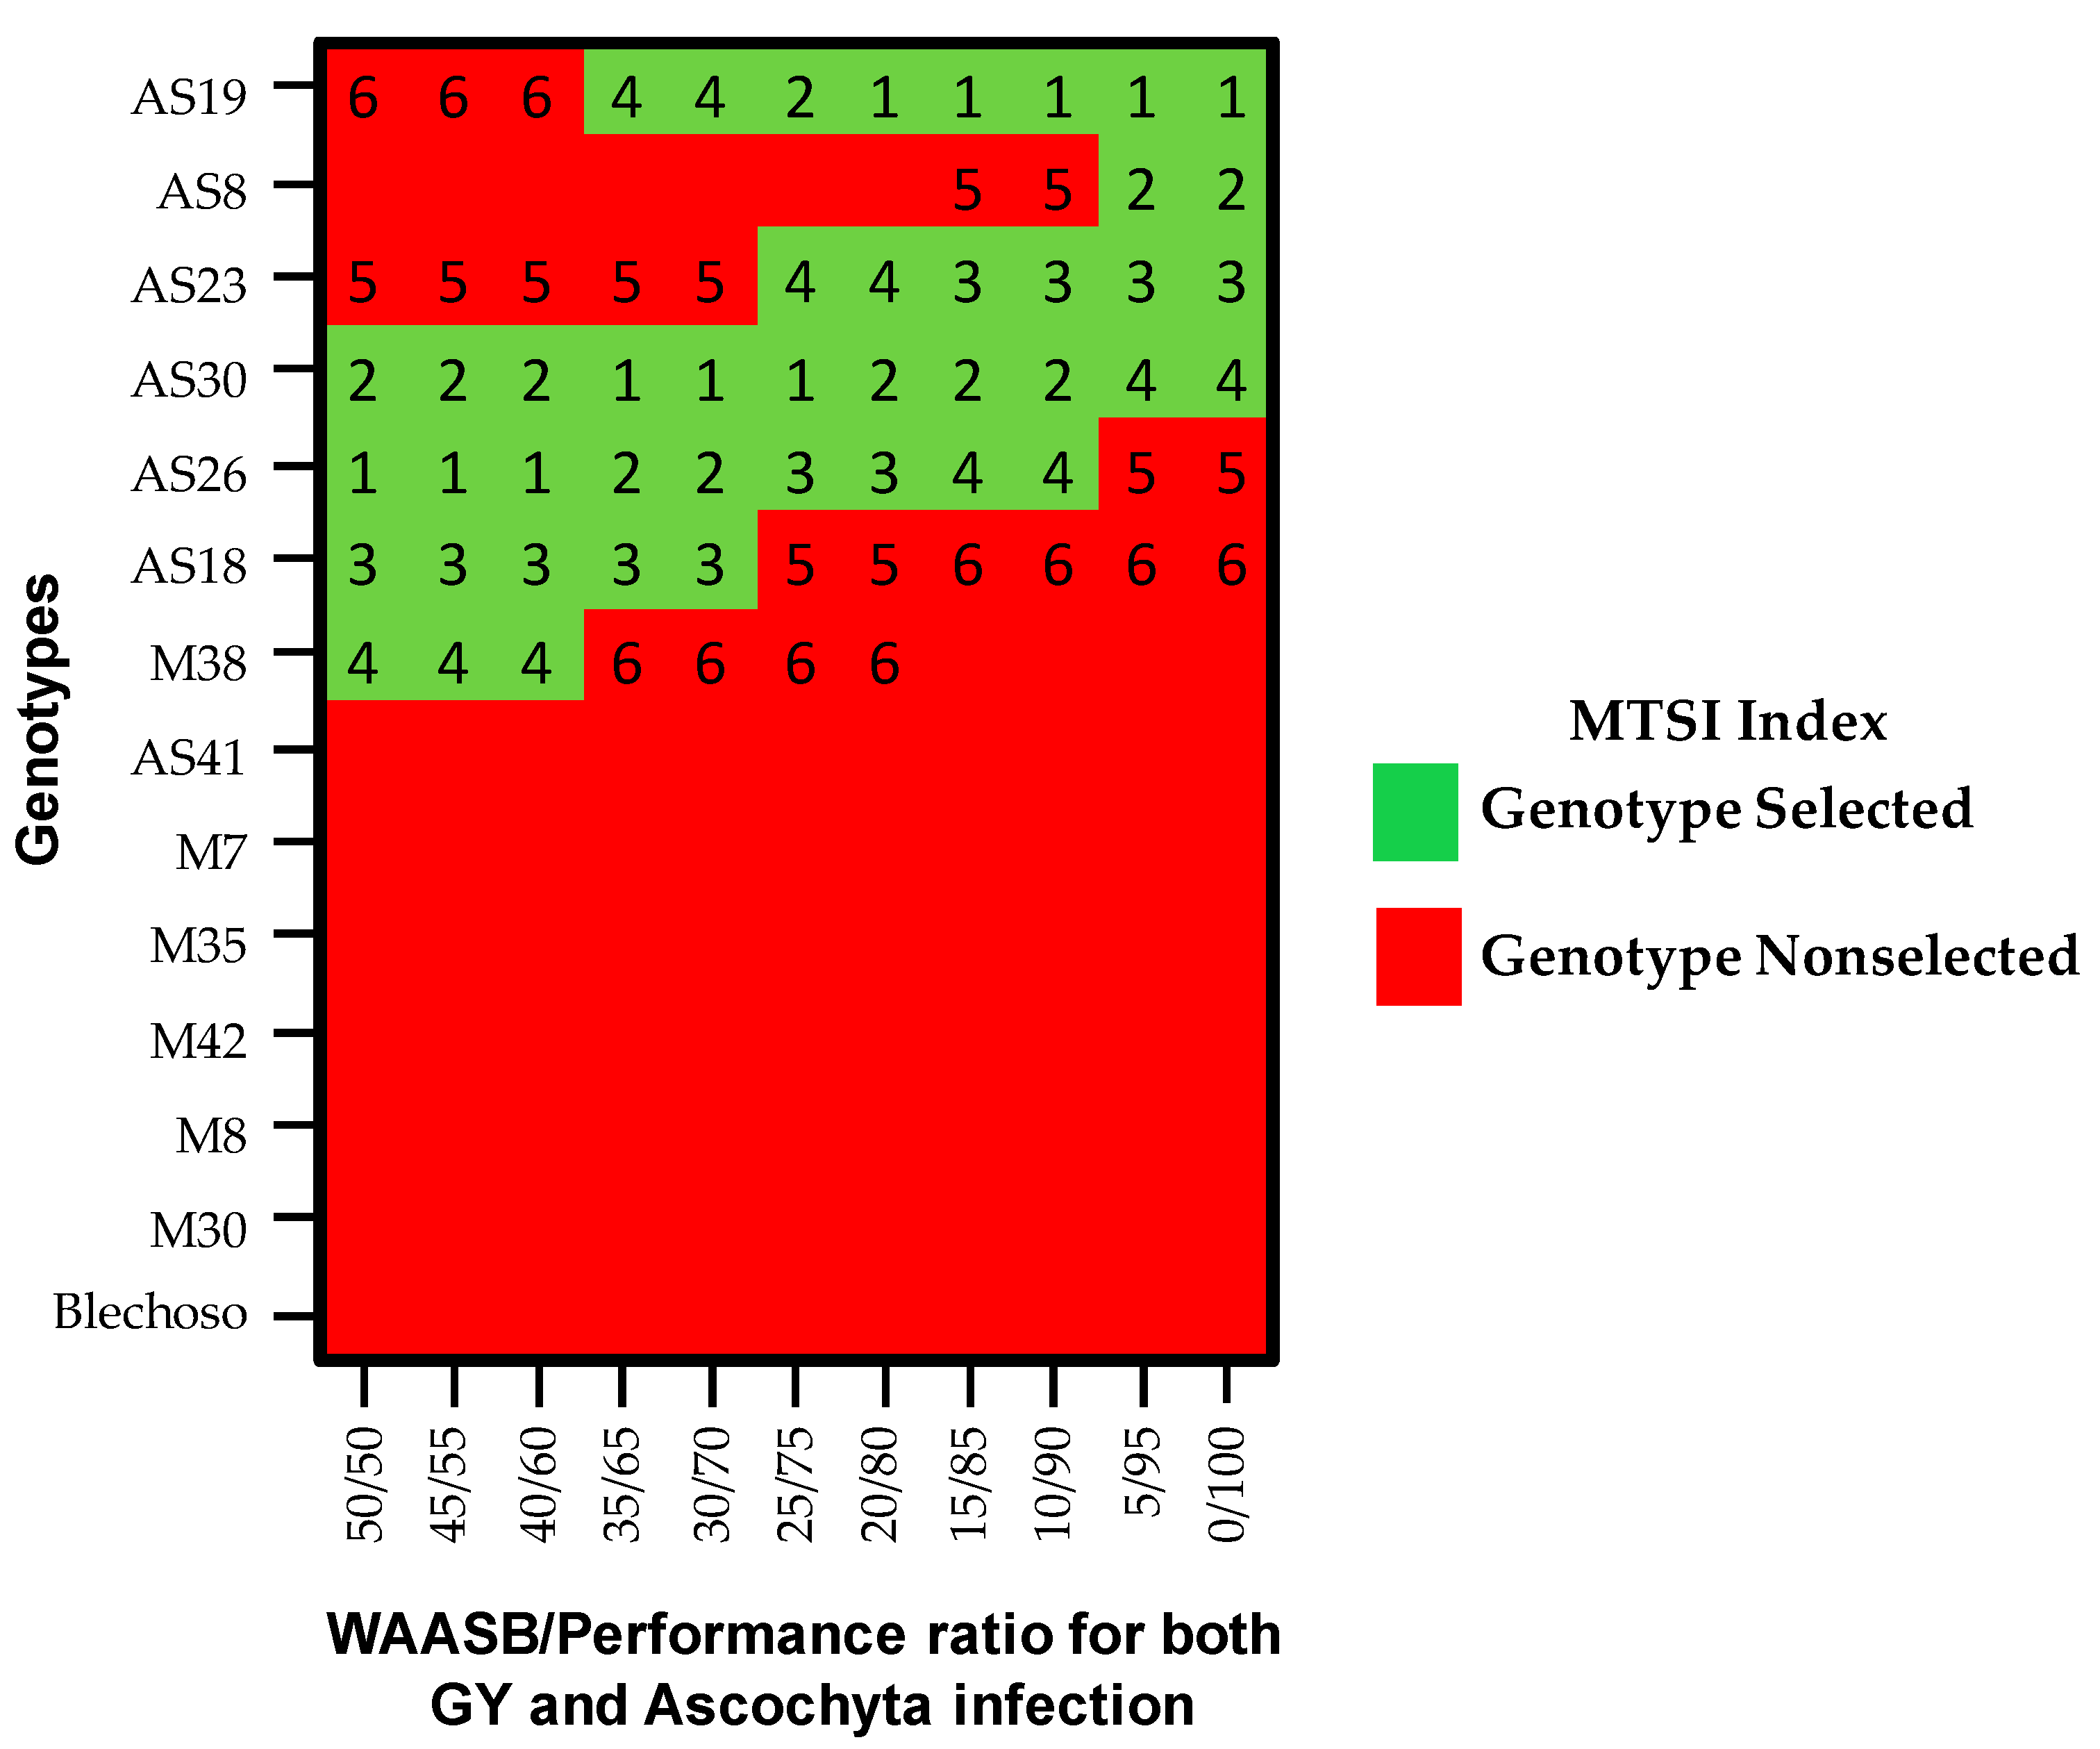
Multi-Trait Stability Index (MTSI)
2.2.3. Correlations
3. Results
3.1. Pooled ANOVA
3.2. Grain Yield
3.3. Ascochyta Blight
3.4. MTSI Index
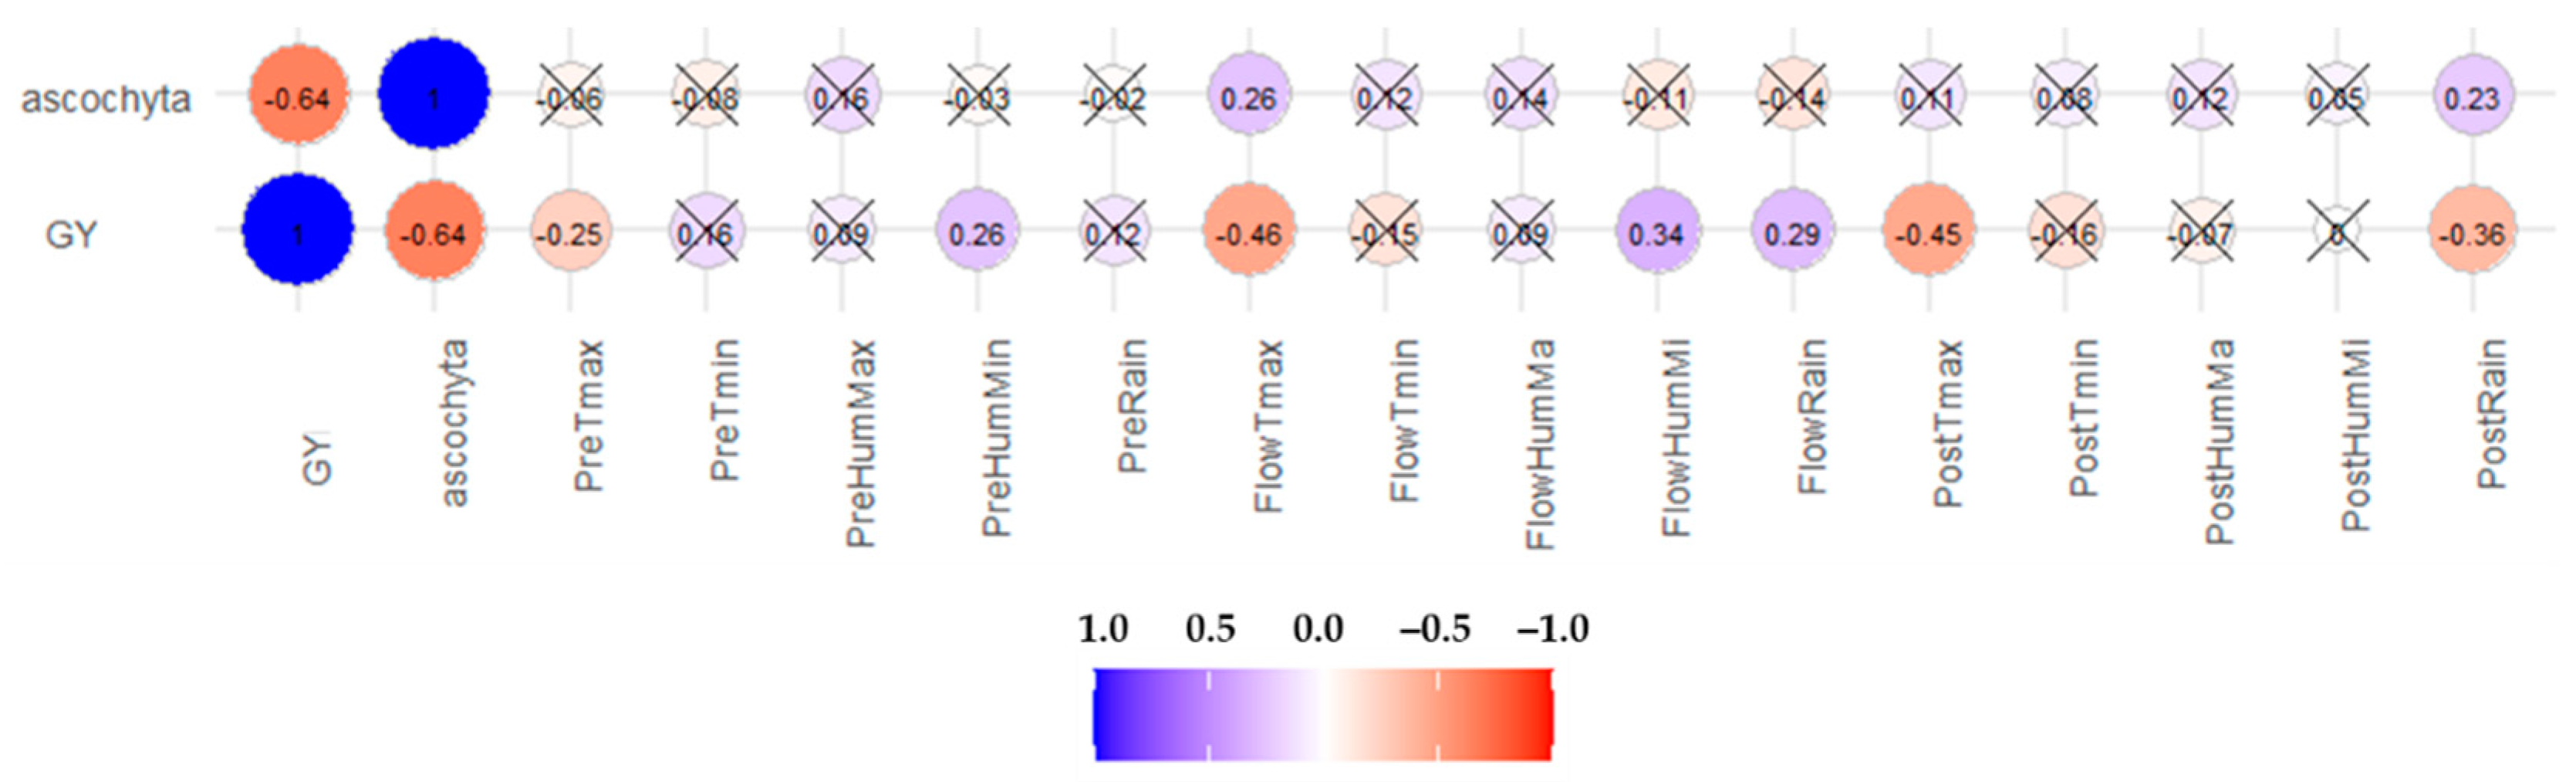
3.5. Correlations among Traits and Environmental Factors
4. Discussions
Supplementary Materials
Author Contributions
Funding
Data Availability Statement
Acknowledgments
Conflicts of Interest
References
- Mazid, A.; Shideed, K.; El-Abdullah, M.; Zyadeh, G.; Moustafa, J. Impacts of crop improvement research on farmers’ livelihoods: The case of winter-sown chickpea in Syria. Exp. Agric. 2013, 49, 336–351. [Google Scholar] [CrossRef]
- Rubio, J.; Gil, J.; Cobos, M.J.; Millán, T. Chickpea. In Genetics, Genomics and Breeding of Cool Season Grain Legumes; Pérez-de-la-Vega, M., Torres, A.M., Cubero, J.I., Kole, C., Eds.; CRC-Press: Boca Raton, FL, USA, 2011; pp. 205–236. [Google Scholar]
- Singh, R.; Kumar, K.; Purayannur, S.; Chen, W.; Verma, P.K. Ascochyta rabiei: A threat to global chickpea production. Mol. Plant Pathol. 2022, 23, 1241–1261. [Google Scholar] [CrossRef] [PubMed]
- Singh, K.B.; Malhotra, R.S.; Saxena, M.C.; Bejiga, G. Superiority of Winter Sowing over Traditional Spring Sowing of Chickpea in the Mediterranean Region. Agron. J. 1997, 89, 112–118. [Google Scholar] [CrossRef]
- Iliadis, C. Evaluation of six chickpea varieties for seed yield under autumn and spring sowing. J. Agric. Sci. 2001, 137, 439–444. [Google Scholar] [CrossRef]
- Sharma, M.; Ghosh, R. An Update on Genetic Resistance of Chickpea to Ascochyta Blight. Agronomy 2016, 6, 18. [Google Scholar] [CrossRef]
- Zobel, R.W.; Wright, M.J.; Gauch, H.G. Statistical analysis of a yield trial. Agron. J. 1988, 80, 388–393. [Google Scholar] [CrossRef]
- Yan, W.; Hunt, L.A.; Sheng, Q.; Szlavnics, Z. Cultivar evaluation and mega-environment investigation based on the GGE biplot. Crop Sci. 2000, 40, 597–605. [Google Scholar] [CrossRef]
- Olivoto, T.; Lúcio, A.D.C.; da Silva, J.A.G.; Marchioro, V.S.; de Souza, V.Q.; Jost, E. Mean Performance and Stability in Multi-Environment Trials I: Combining Features of AMMI and BLUP Techniques. Agron. J. 2019, 111, 2949–2960. [Google Scholar] [CrossRef]
- Red de Información Agroclimática de Andalucía (RIA). Available online: https://www.juntadeandalucia.es/agriculturaypesca/ifapa/riaweb/web/ (accessed on 2 March 2022).
- Olivoto, T.; Lúcio, A.D.C. Metan: An R package for multienvironment trial analysis. Methods Ecol. Evol. 2020, 11, 783–789. [Google Scholar] [CrossRef]
- Olivoto, T.; Lúcio, A.D.; da Silva, J.A.; Sari, B.G.; Diel, M.I. Mean performance and stability in multi-environment trials II: Selection based on multiple traits. Agron. J. 2019, 111, 2961–2969. [Google Scholar] [CrossRef]
- RAEA. Ensayos de Garbanzos y Habas, Campaña 2006–2007. 2007. Available online: https://www.juntadeandalucia.es/agriculturaypesca/ifapa/servifapa/registro-servifapa/b98168f1-d488-4695-a274-b297c69f9af5 (accessed on 2 August 2022).
- Rubiales, D.; Moral, A.; Flores, F. Agronomic performance of broomrape resistant and susceptible faba bean accession. Agronomy 2022, 12, 1421. [Google Scholar] [CrossRef]
- Sellami, M.H.; Pulvento, C.; Lavini, A. Selection of Suitable Genotypes of Lentil (Lens culinaris Medik.) under Rainfed Conditions in South Italy Using Multi-Trait Stability Index (MTSI). Agronomy 2021, 11, 1807. [Google Scholar] [CrossRef]
- Sellami, M.H.; Lavini, A.; Pulvento, C. Phenotypic and Quality Traits of Chickpea Genotypes under Rainfed Conditions in South Italy. Agronomy 2021, 11, 962. [Google Scholar] [CrossRef]
- Abbo, S.; Berger, J.; Turner, N. Evolution of cultivated chickpea: Four bottlenecks limit diversity and constrain adaptation. Funct. Plant Biol. 2003, 30, 1081–1087. [Google Scholar] [CrossRef]
- Chandirasekaran, R.; Warkentin, T.D.; Gan, Y.; Shirtliffe, S.; Gossen, B.D.; Taran, B.; Banniza, S. Improved sources of resistance to ascochyta blight in chickpea. Can. J. Plant Sci. 2009, 89, 107–118. [Google Scholar] [CrossRef]
- Landa, B.B.; Navas-Cortés, J.A.; Jiménez-Díaz, R. Integrated Management of Fusarium Wilt of Chickpea with Sowing Date, Host Resistance, and Biological Control. Phytopathology 2004, 94, 946–960. [Google Scholar] [CrossRef] [PubMed]
- Sillero, J.C.; Moreno-Alías, I.; Rubiales, D. Identification and characterization of resistance to rust (Uromyces ciceris-arietini (Grognot) Jacz. & Boyd) in a germplasm collection of Cicer spp. Euphytica 2012, 188, 229–238. [Google Scholar] [CrossRef]
- Nefzi, F.; Trabelsi, I.; Amri, M.; Triki, E.; Kharrat, M.; Abbes, Z. Response of some chickpea (Cicer arietinum L.) genotypes to Orobanche foetida Poir. parasitism. Chil. J. Agric. Res. 2016, 76, 170–178. [Google Scholar] [CrossRef]
- Rubiales, D.; Osuna-Caballero, S.; González-Bernal, M.J.; Cobos, M.J.; Flores, F. Pea breeding lines adapted to autumn sowings in broomrape prone Mediterranean environments. Agronomy 2021, 11, 769. [Google Scholar] [CrossRef]
- Rubiales, D.; Moral, A.; Flores, F. Heat waves and broomrape are the major constraints for lentil cultivation in Southern Spain. Agronomy 2021, 11, 1871. [Google Scholar] [CrossRef]
- Rubiales, D.; Alcántara, C.; Pérez-de-Luque, A.; Gil, J.; Sillero, J.C. Infection of chickpea (Cicer arietinum) by crenate broomrape (Orobanche crenata) as influenced by sowing date and weather conditions. Agronomie 2003, 23, 359–362. [Google Scholar] [CrossRef]
- Rubiales, D.; Pérez-de-Luque, A.; Joel, D.M.; Alcantara, C.; Sillero, J.C. Characterisation of resistance in chickpea to crenate broomrape (Orobanche crenata). Weed Sci. 2003, 51, 702–707. [Google Scholar] [CrossRef]
- Kadiyala, M.D.M.; Kumara-Charyulu, D.; Nedumaran, S.; Shyam, M.; Gumma, M.K.; Bantilan, M.C.S. Agronomic management options for sustaining chickpea yield under climate change scenario. J. Agrometeorol. 2016, 18, 41–47. [Google Scholar] [CrossRef]
- Singh, K.B.; Malhotra, R.S.; Saxena, M.C. Relationship between cold severity and yield loss in chickpea (Cicer arietinum L.). J. Agron. Crop Sci. 1993, 170, 121–127. [Google Scholar] [CrossRef]
- Croser, J.S.; Clarke, H.J.; Siddique, K.H.M.; Khan, T.N. Low-temperature stress: Implications for chickpea (Cicer arietinum L.) improvement. CRC Crit. Rev. Plant Sci. 2003, 22, 185–219. [Google Scholar] [CrossRef]
- Nezami, A.; Bandara, M.S.; Gusta, L.V. An evaluation of freezing tolerance of winter chickpea (Cicer arietinum L.) using controlled freeze tests. Can. J. Plant Sci. 2012, 92, 155–161. [Google Scholar] [CrossRef]
- Wang, J.; Gan, Y.T.; Clarke, F.; McDonald, C.L. Response of chickpea yield to high temperature stress during reproductive development. Crop Sci. 2006, 46, 2171–2178. [Google Scholar] [CrossRef]
- Devasirvatham, V.; Gaur, P.M.; Mallikarjuna, N.; Tokashishu, R.N.; Trethowan, R.M.; Tan, D.K.Y. Effect of high temperature on the reproductive development of chickpea genotypes under controlled environments. Funct. Plant Biol. 2012, 39, 1009–1018. [Google Scholar] [CrossRef]
- Kaushal, N.; Awasthi, R.; Gupta, K.; Gaur, P.M.; Siddique, K.H.M.; Nayyar, H. Heat-stress-induced reproductive failures in chickpea (Cicer arietinum) are associated with impaired sucrose metabolism in leaves and anthers. Funct. Plant Biol. 2013, 40, 1334–1349. [Google Scholar] [CrossRef]
- Rani, A.; Devi, P.; Jha, U.C.; Sharma, K.D.; Siddique, K.H.M.; Nayyar, H. Developing Climate-Resilient Chickpea Involving Physiological and Molecular Approaches with a Focus on Temperature and Drought Stresses. Front. Plant Sci. 2020, 10, 1759. [Google Scholar] [CrossRef]
- Krishnamurthy, L.; Gaur, P.M.; Basu, P.S.; Chaturvedi, S.K.; Tripathi, S.; Vadez, V.; Rathore, A.; Varshney, R.K.; Gowda, C.L.L. Large genetic variation for heat tolerance in the reference collection of chickpea (Cicer arietinum L.) germplasm. Plant Genet. Resour. 2011, 9, 59–69. [Google Scholar] [CrossRef]
- Devasirvatham, V.; Gaur, P.M.; Raju, T.N.; Trethowan, R.M.; Tan, D.K.Y. Field response of chickpea (Cicer arietinum L.) to high temperature. Field Crop Res. 2015, 172, 59–71. [Google Scholar] [CrossRef]
- Kumar, A.; Agrawal, T.; Kumar, S.; Kumar, A.; Kumar, R.R.; Kumar, M.; Singh, C.K.P. Identification and evaluation of Heat Tolerant Chickpea genotypes for Enhancing its Productivity in Rice Fallow area of Bihar and Mitigating Impacts of Climate Change. J. Pharmacogn. Phytochem. 2017, SP1, 1105–1113. [Google Scholar]
- Paul, P.J.; Samineni, S.; Thudi, M.; Sajja, S.B.; Rathore, A.; Das, R.R.; Khan, A.W.; Chaturvedi, S.K.; Lavanya, G.R.; Varshney, R.K.; et al. Molecular Mapping of QTLs for Heat Tolerance in Chickpea. Int. J. Mol. Sci. 2018, 19, 2166. [Google Scholar] [CrossRef]
- Singh, S.; Singh, I.; Kapoor, K.; Gaur, P.M.; Chaturvedi, S.K.; Singh, N.P.; Sandhu, J.S. Chickpea. In Broadening the Genetic Base of Grain Legumes; Singh, M., Bisht, I., Dutta, M., Eds.; Springer: New Delhi, India, 2014; pp. 51–73. [Google Scholar] [CrossRef]
- Gaur, P.M.; Samineni, S.; Thudi, M.; Tripathi, S.; Sajja, S.B.; Jayalakshmi, V.; Mannur, D.M.; Vijayakumar, A.D.; Ganga Rao, N.V.P.R.; Ojiewo, C.; et al. Integrated breeding approaches for improving drought and heat adaptation in chickpea (Cicer arietinum L.). Plant Breed. 2019, 138, 389–400. [Google Scholar] [CrossRef] [Green Version]


| Accessions | Donor’s Code | Origin/Derived from Accession no. |
|---|---|---|
| AS19 | FLIP 03—40C | 98TH83/[(ILC1306 X S 94321) X ILC4236] X S 96114 |
| AS8 | FLIP 98—129C | 95TH47/(FLIP 88—6C* ILC3373)XFLIP 89—4C |
| AS30 | FLIP 03—128C | 00TH51/FLIP 98—52C X FLIP 98-47C |
| AS23 | FLIP 03—48C | 99TH13/FLIP 93—62C X FLIP 93—50C |
| AS26 | FLIP 03—76C | 00TH28/FLIP 98—15C X S 98588 |
| M38 | LMR 186 | X99TH155/ILC5901XILC5309 |
| AS18 | FLIP 03—37C | 98TH38/S 96114 X FLIP 92—159C |
| M7 | LMR 29 | X99TH151/ILC3805XILC5901 |
| AS41 | ILC 263 | PI 339223 |
| M42 | ILC 3397 | |
| M8 | LMR 40 | X99TH151/ILC3805XILC5901 |
| M35 | LMR 164 | X99TH154/ILC5901XILC3397 |
| M30 | LMR 158 | X99TH154/ILC5901XILC3397 |
| Blanco Lechoso | Local check | Extra-large seeds, superior market quality but highly susceptible to ascochyta blight |
| Environment | Season | Soil Type | Soil pH | Latit. | Longit. | Altit. | Average Tmax (°C) | Average Tmin (°C) | Rain (mm) |
|---|---|---|---|---|---|---|---|---|---|
| Cor-09 | 2008–2009 | Cambisol | 6.5–7 | 37°50′ N | 4°50′ W | 90 | 19.2 | 4.1 | 279 |
| Cor-10 | 2009–2010 | Cambisol | 6.5–7 | 37°50′ N | 4°50′ W | 90 | 20.1 | 8.4 | 1053 |
| Cor-11 | 2010–2011 | Cambisol | 6.5–7 | 37°50′ N | 4°50′ W | 90 | 22.5 | 10.3 | 514 |
| Cor-12 | 2011–2012 | Cambisol | 6.5–7 | 37°50′ N | 4°50′ W | 90 | 20.8 | 5.6 | 163 |
| Cor-13 | 2012–2013 | Cambisol | 6.5–7 | 37°50′ N | 4°50′ W | 90 | 18.3 | 7.5 | 497 |
| Esc-10 | 2009–2010 | Fluvisol | 7–7.5 | 37°25′ N | 6°15′ W | 88 | 19.3 | 9.4 | 1206 |
| Esc-11 | 2010–2011 | Fluvisol | 7–7.5 | 37°25′ N | 6°15′ W | 88 | 21.6 | 11.4 | 534 |
| Esc-12 | 2011–2012 | Fluvisol | 7–7.5 | 37°25′ N | 6°15′ W | 88 | 20.4 | 9.1 | 134 |
| Esc-13 | 2012–2013 | Fluvisol | 7–7.5 | 37°25′ N | 6°15′ W | 88 | 18.2 | 8.7 | 473 |
| Tom-09 | 2008–2009 | Vertisol | 7–7.5 | 37°30′ N | 5°57′ W | 12 | 21.3 | 6.9 | 219 |
| Trait | Random Effects | Estimate | Standard Error | Pr > Chisq | % of Total Variance Explained by |
|---|---|---|---|---|---|
| Grain yield (kg/ha) | E | 398911 | 198702 | <0.0001 | 38 |
| Block(E) | 24957 | 13523 | <0.0021 | 2 | |
| G | 274398 | 115428 | <0.0001 | 26 | |
| GEI | 116124 | 26865 | <0.0001 | 11 | |
| Residual | 245612 | 21538 | <0.0001 | 23 | |
| Ascochyta blight | E | 0.043 | 0.02 | <0.0001 | 35 |
| Block(E) | 0.0 | 0 | |||
| G | 0.054 | 0.02 | <0.0001 | 44 | |
| GEI | 0.016 | 0.002 | <0.0001 | 13 | |
| Residual | 0.01 | 0.0009 | <0.0001 | 8 |
| Accessions | Tom09 | Cord09 | Cord10 | Cord11 | Cord12 | Cord13 | Esc10 | Esc11 | Esc12 | Esc13 | Average Over Environments | SE * |
|---|---|---|---|---|---|---|---|---|---|---|---|---|
| AS19 | 1686 | 2224 | 1028 | 571 | 2247 | 1974 | 4304 | 1675 | 1777 | 2458 | 1994 | 193 |
| AS8 | 1305 | 2358 | 853 | 100 | 1791 | 1729 | 4779 | 1383 | 1255 | 2480 | 1803 | 236 |
| AS30 | 1935 | 2058 | 775 | 282 | 1509 | 1664 | 2896 | 1771 | 1897 | 2824 | 1761 | 174 |
| AS23 | 1735 | 2910 | 1035 | 100 | 1718 | 1763 | 2118 | 1742 | 1427 | 2524 | 1707 | 176 |
| AS26 | 1664 | 1971 | 940 | 42 | 1476 | 1869 | 2467 | 1787 | 1738 | 2920 | 1687 | 159 |
| M38 | 1847 | 945 | 900 | 20 | 1586 | 1424 | 3381 | 1089 | 1200 | 3522 | 1592 | 250 |
| AS18 | 1858 | 1520 | 911 | 467 | 1229 | 1589 | 2697 | 1260 | 1116 | 2571 | 1522 | 148 |
| M7 | 1303 | 3 | 323 | 0 | 1504 | 1355 | 1873 | 1155 | 1658 | 1742 | 1092 | 138 |
| AS41 | 978 | 1024 | 547 | 0 | 320 | 1050 | 1962 | 1327 | 810 | 2264 | 1028 | 123 |
| M42 | 826 | 402 | 468 | 0 | 686 | 1202 | 1666 | 1080 | 1055 | 1649 | 903 | 100 |
| M8 | 861 | 8 | 298 | 0 | 1031 | 979 | 1403 | 1031 | 622 | 1954 | 819 | 120 |
| M35 | 606 | 179 | 400 | 0 | 940 | 884 | 1357 | 498 | 973 | 1957 | 779 | 125 |
| M30 | 510 | 22 | 533 | 0 | 540 | 494 | 1213 | 150 | 155 | 1660 | 528 | 97 |
| Blanco Lechoso | 281 | 0 | 0 | 0 | 367 | 329 | 0 | 299 | 298 | 987 | 256 | 55 |
| Mean | 1243 | 1116 | 644 | 113 | 1210 | 1308 | 2294 | 1160 | 1142 | 2251 | 1248 | |
| SE | 109 | 168 | 55 | 32 | 109 | 94 | 231 | 107 | 100 | 107 | 49 |
| Accessions | Tom09 | Cord09 | Cord10 | Cord11 | Cord12 | Cord13 | Esc10 | Esc11 | Esc12 | Esc13 | Average Over Environments | SE |
|---|---|---|---|---|---|---|---|---|---|---|---|---|
| AS19 | 8.7 | 13.7 | 10 | 31.7 | 14.7 | 6.7 | 6.7 | 0 | 2.3 | 6 | 10.0 | 1.8 |
| AS23 | 2.3 | 6.7 | 15 | 35 | 17 | 9.7 | 3 | 1.7 | 1.3 | 14.3 | 10.6 | 2.1 |
| AS18 | 4 | 13.3 | 13.3 | 35 | 15.7 | 6.3 | 13.3 | 2.3 | 2 | 10 | 11.5 | 1.9 |
| AS8 | 2 | 3.7 | 10 | 50 | 17.3 | 8 | 7 | 2.7 | 5 | 21 | 12.7 | 3.1 |
| AS30 | 3.7 | 18.3 | 9.3 | 40 | 17 | 6.3 | 16.7 | 3.3 | 0.7 | 14.3 | 13.0 | 2.5 |
| AS26 | 5.3 | 15 | 13.3 | 56.7 | 21.3 | 5.3 | 8.7 | 5 | 1.3 | 6 | 13.8 | 3.1 |
| M38 | 8.3 | 33.3 | 5 | 50 | 22.3 | 5.3 | 10.3 | 7.3 | 7.3 | 5.3 | 15.5 | 2.7 |
| AS41 | 15.7 | 45 | 21.3 | 95 | 31.7 | 19.7 | 24 | 18.3 | 16.3 | 26.3 | 31.3 | 4.3 |
| M7 | 11.7 | 86.7 | 23 | 95 | 23 | 15 | 28.3 | 14 | 13 | 24 | 33.4 | 5.5 |
| M35 | 30 | 73.3 | 20 | 73.3 | 32.7 | 16.7 | 12.7 | 26 | 22.3 | 27.3 | 33.4 | 4.1 |
| M30 | 26.7 | 70 | 15 | 86.7 | 31.3 | 22.3 | 30 | 21.3 | 31.7 | 31.7 | 36.7 | 4.2 |
| M8 | 23.3 | 90 | 26 | 90 | 40.7 | 27 | 27.7 | 24.7 | 20 | 30.3 | 40.0 | 4.8 |
| M42 | 20.7 | 87 | 24 | 93.3 | 40.3 | 28.7 | 28 | 26.3 | 22 | 44 | 41.4 | 5.0 |
| Blanco Lechoso | 46.7 | 83.3 | 100 | 100 | 65.3 | 60.7 | 100 | 51.3 | 48 | 76 | 73.1 | 3.9 |
| Mean | 14.9 | 45.7 | 21.8 | 66.5 | 27.9 | 17.0 | 22.6 | 14.6 | 13.8 | 24.0 | 26.8 | |
| SE | 2.2 | 5.3 | 3.6 | 4.4 | 2.2 | 2.5 | 3.7 | 2.2 | 2.2 | 2.9 | 1.3 |
| Trait | XO | XS | SD | h2 | SG(%) |
|---|---|---|---|---|---|
| Grain yield (kg/ha) | 1248 | 1787 | 539 | 0.93 | 40.3 |
| Ascochyta infection (%) | 26.8 | 11.8 | −15 | 0.96 | 53.7 |
Publisher’s Note: MDPI stays neutral with regard to jurisdictional claims in published maps and institutional affiliations. |
© 2022 by the authors. Licensee MDPI, Basel, Switzerland. This article is an open access article distributed under the terms and conditions of the Creative Commons Attribution (CC BY) license (https://creativecommons.org/licenses/by/4.0/).
Share and Cite
Rubiales, D.; Moral, A.; Flores, F. Performance of Winter-Sown Chickpea Breeding Lines with Contrasting Levels of Resistance to Ascochyta Blight. Agronomy 2022, 12, 2194. https://doi.org/10.3390/agronomy12092194
Rubiales D, Moral A, Flores F. Performance of Winter-Sown Chickpea Breeding Lines with Contrasting Levels of Resistance to Ascochyta Blight. Agronomy. 2022; 12(9):2194. https://doi.org/10.3390/agronomy12092194
Chicago/Turabian StyleRubiales, Diego, Ana Moral, and Fernando Flores. 2022. "Performance of Winter-Sown Chickpea Breeding Lines with Contrasting Levels of Resistance to Ascochyta Blight" Agronomy 12, no. 9: 2194. https://doi.org/10.3390/agronomy12092194
APA StyleRubiales, D., Moral, A., & Flores, F. (2022). Performance of Winter-Sown Chickpea Breeding Lines with Contrasting Levels of Resistance to Ascochyta Blight. Agronomy, 12(9), 2194. https://doi.org/10.3390/agronomy12092194