

Effects of Weed Control Treatments on Weed Composition and Yield Components of Winter Wheat (Triticum aestivum L.) and Winter Pea (Pisum sativum L.) Intercrops

 , , , , , and
Abstract
1. Introduction
2. Materials and Methods
2.1. Experimental Design
2.2. Assessments
2.3. Statistical Analysis
3. Results
3.1. Weed Cover
3.2. Weed Control Efficiency
3.3. Yield Components
3.3.1. Variance Analysis of Yield Components
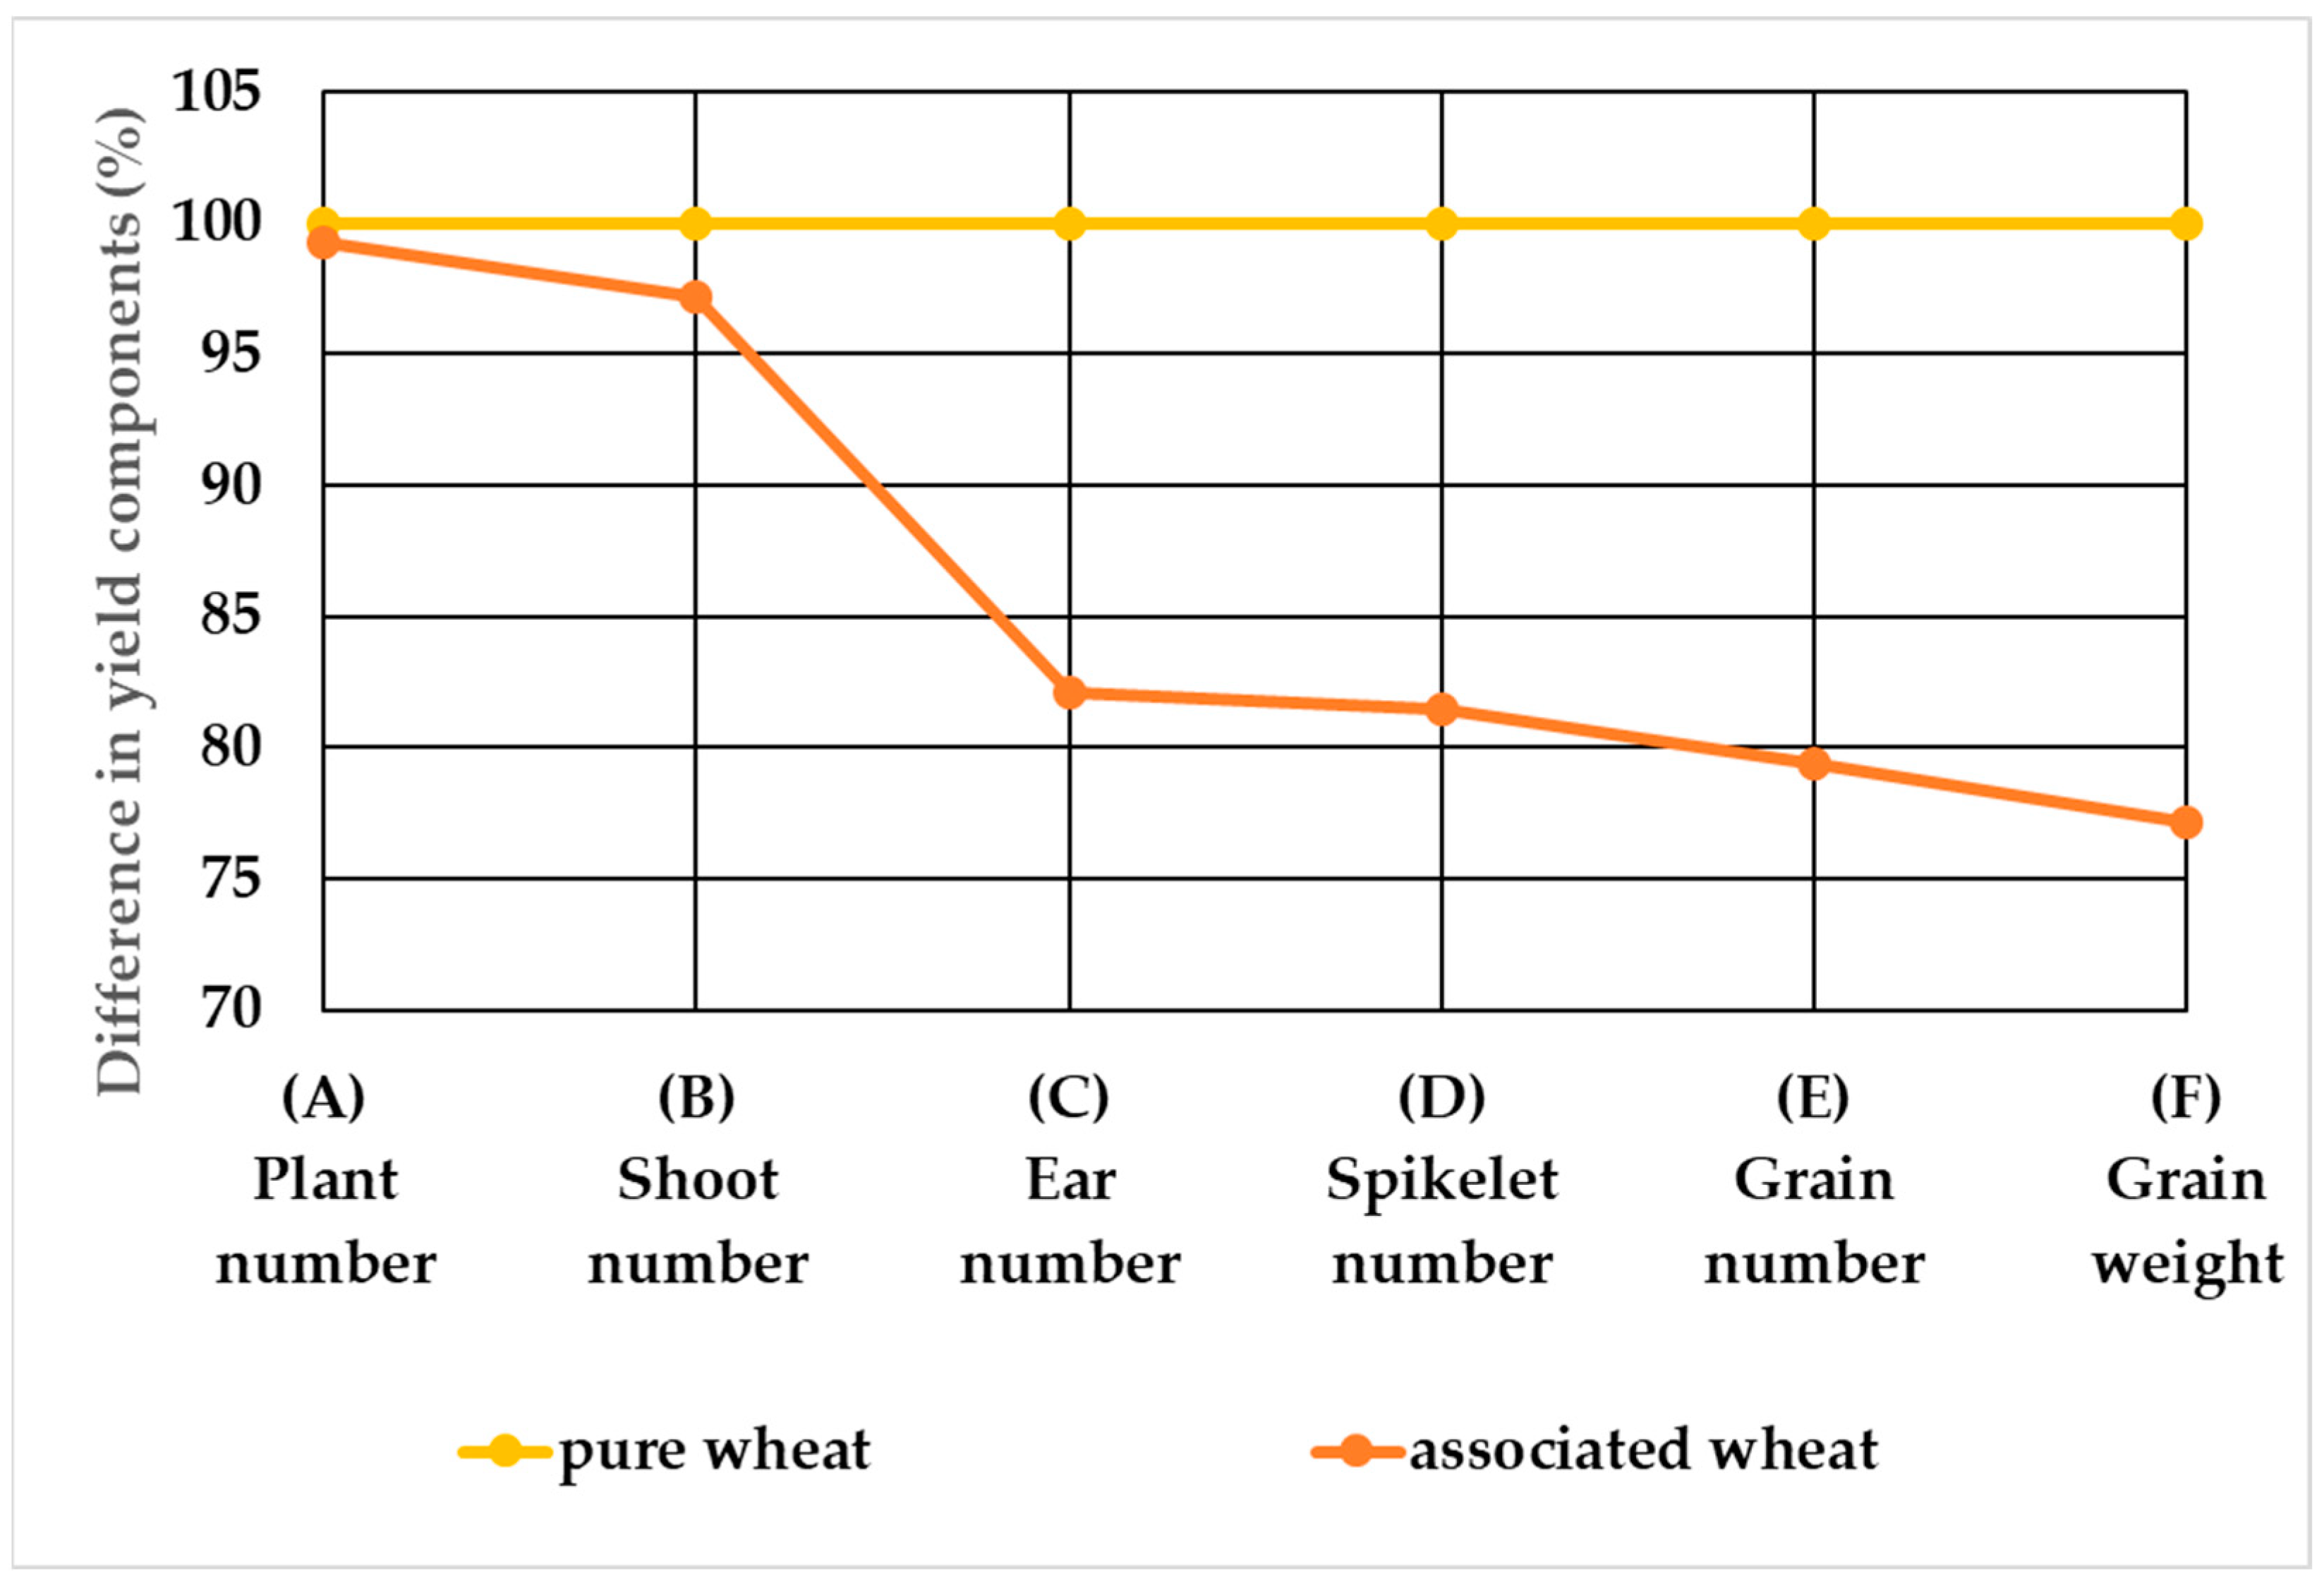
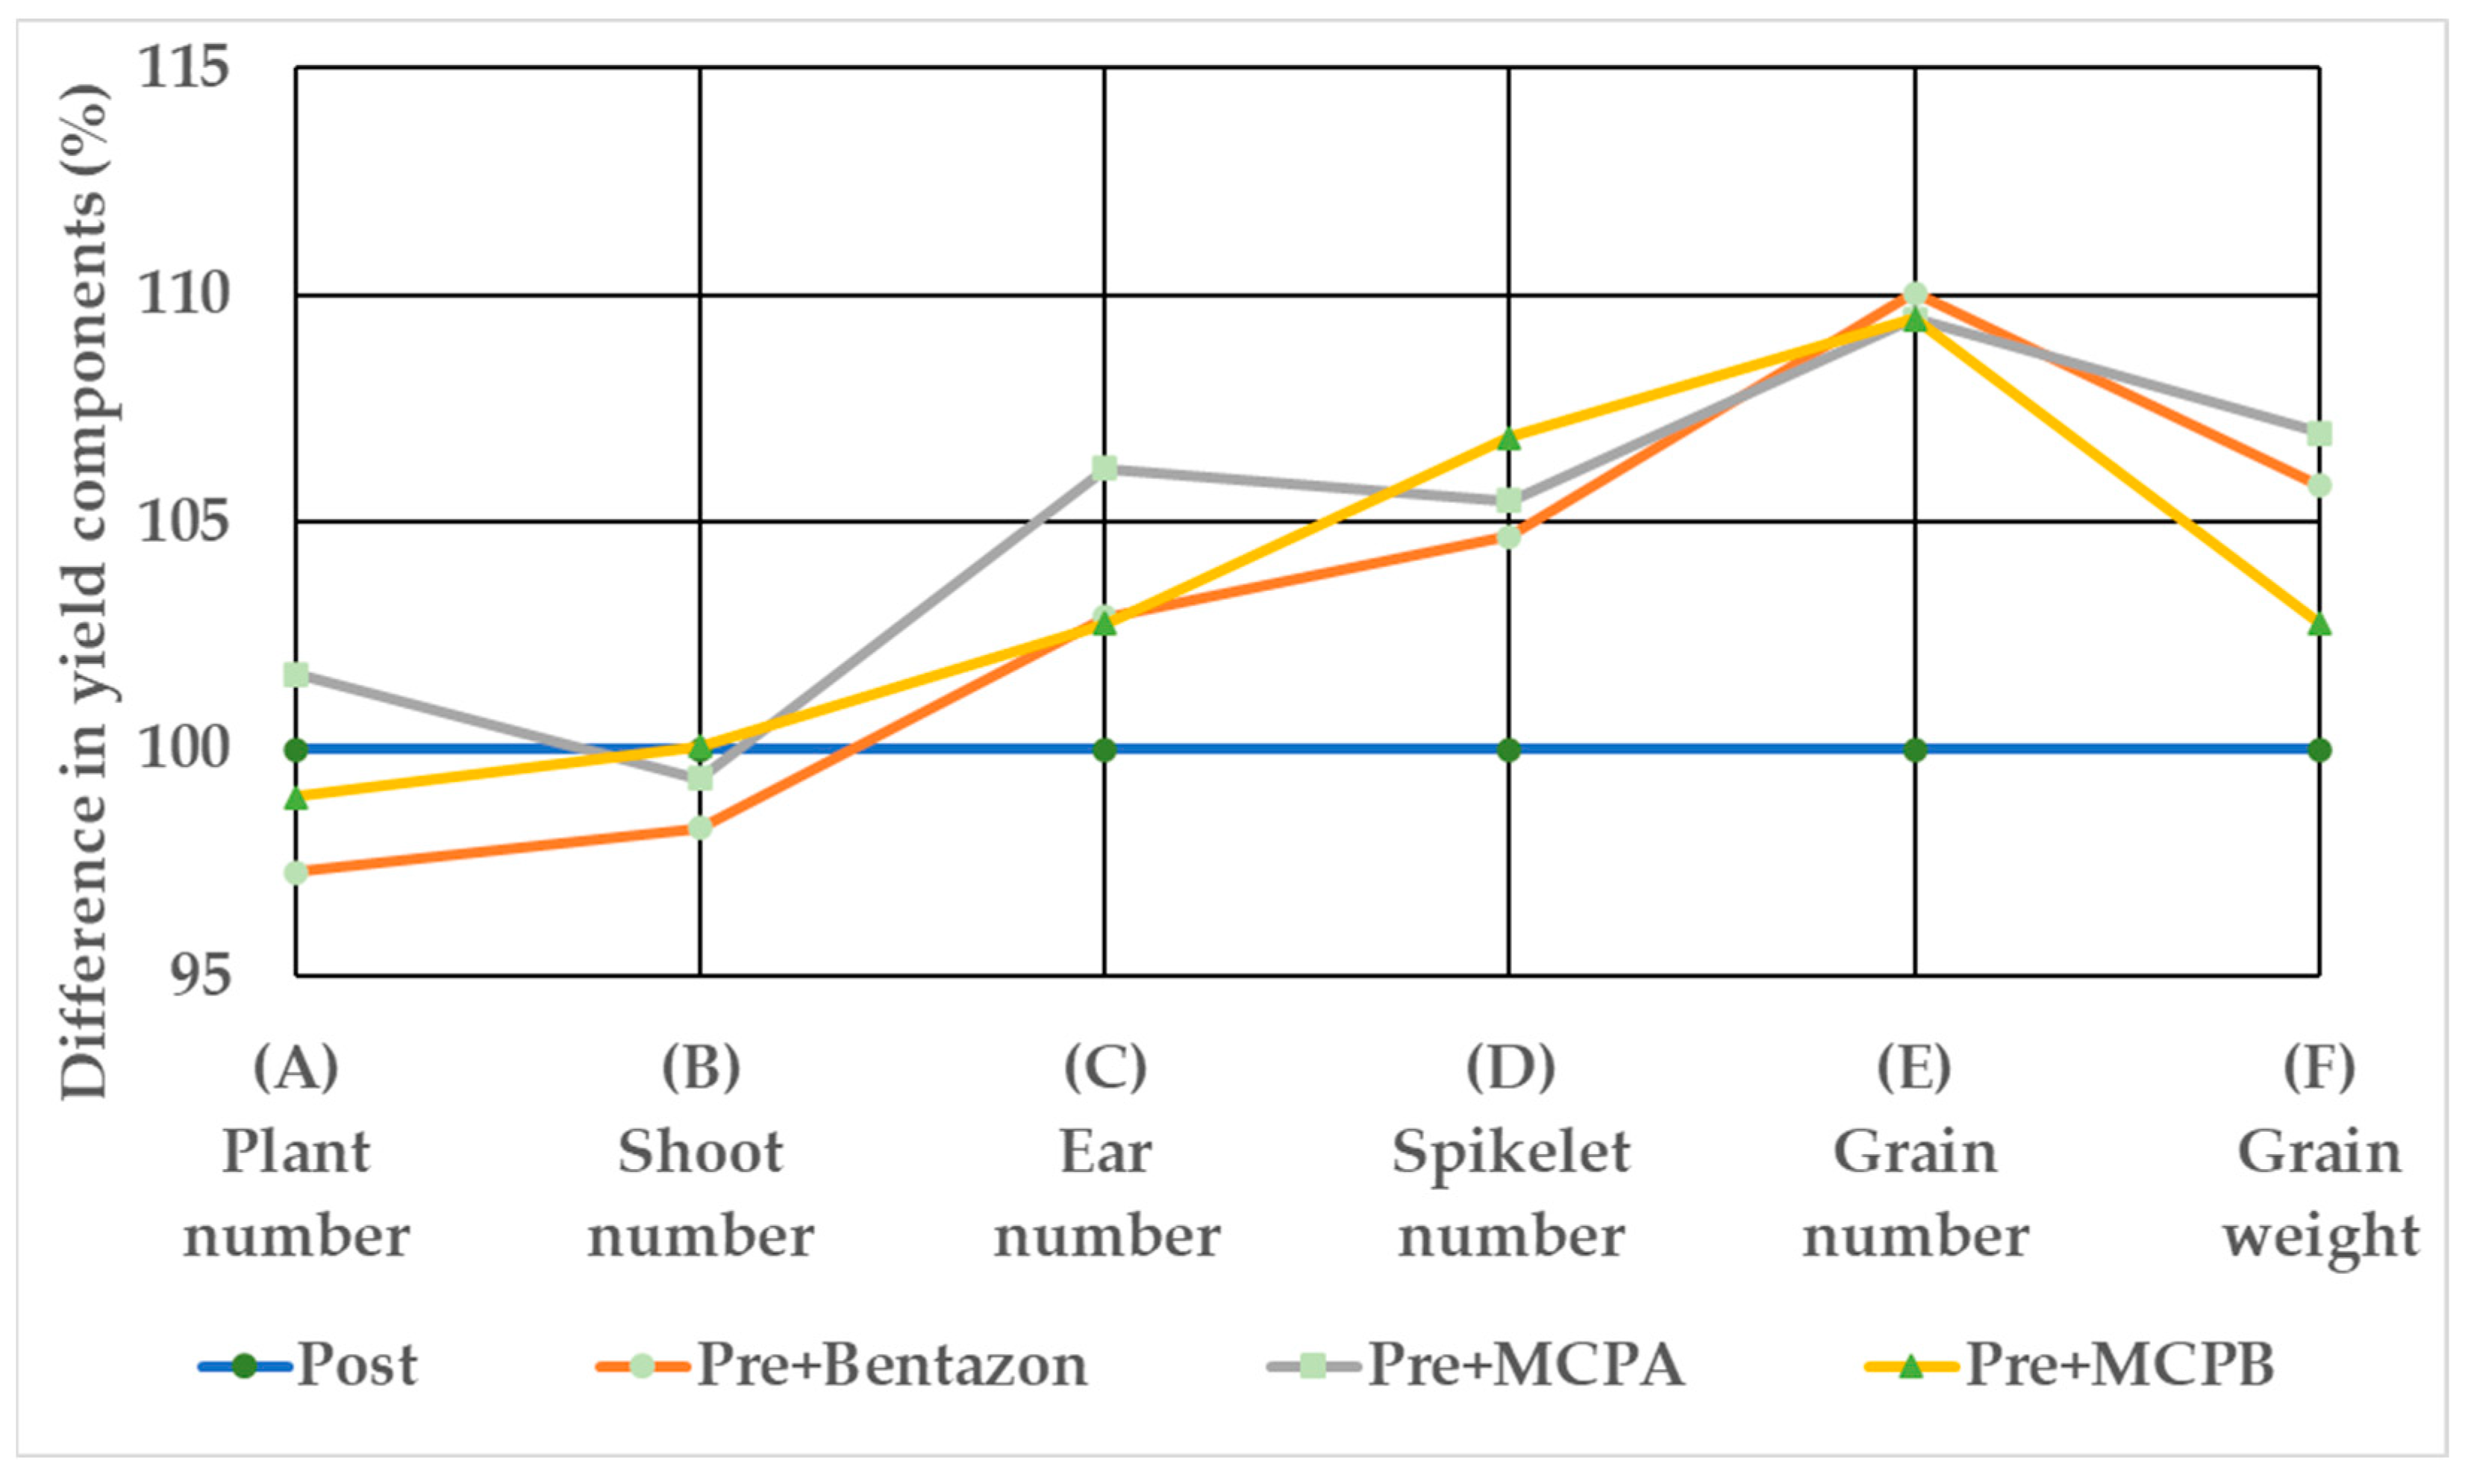
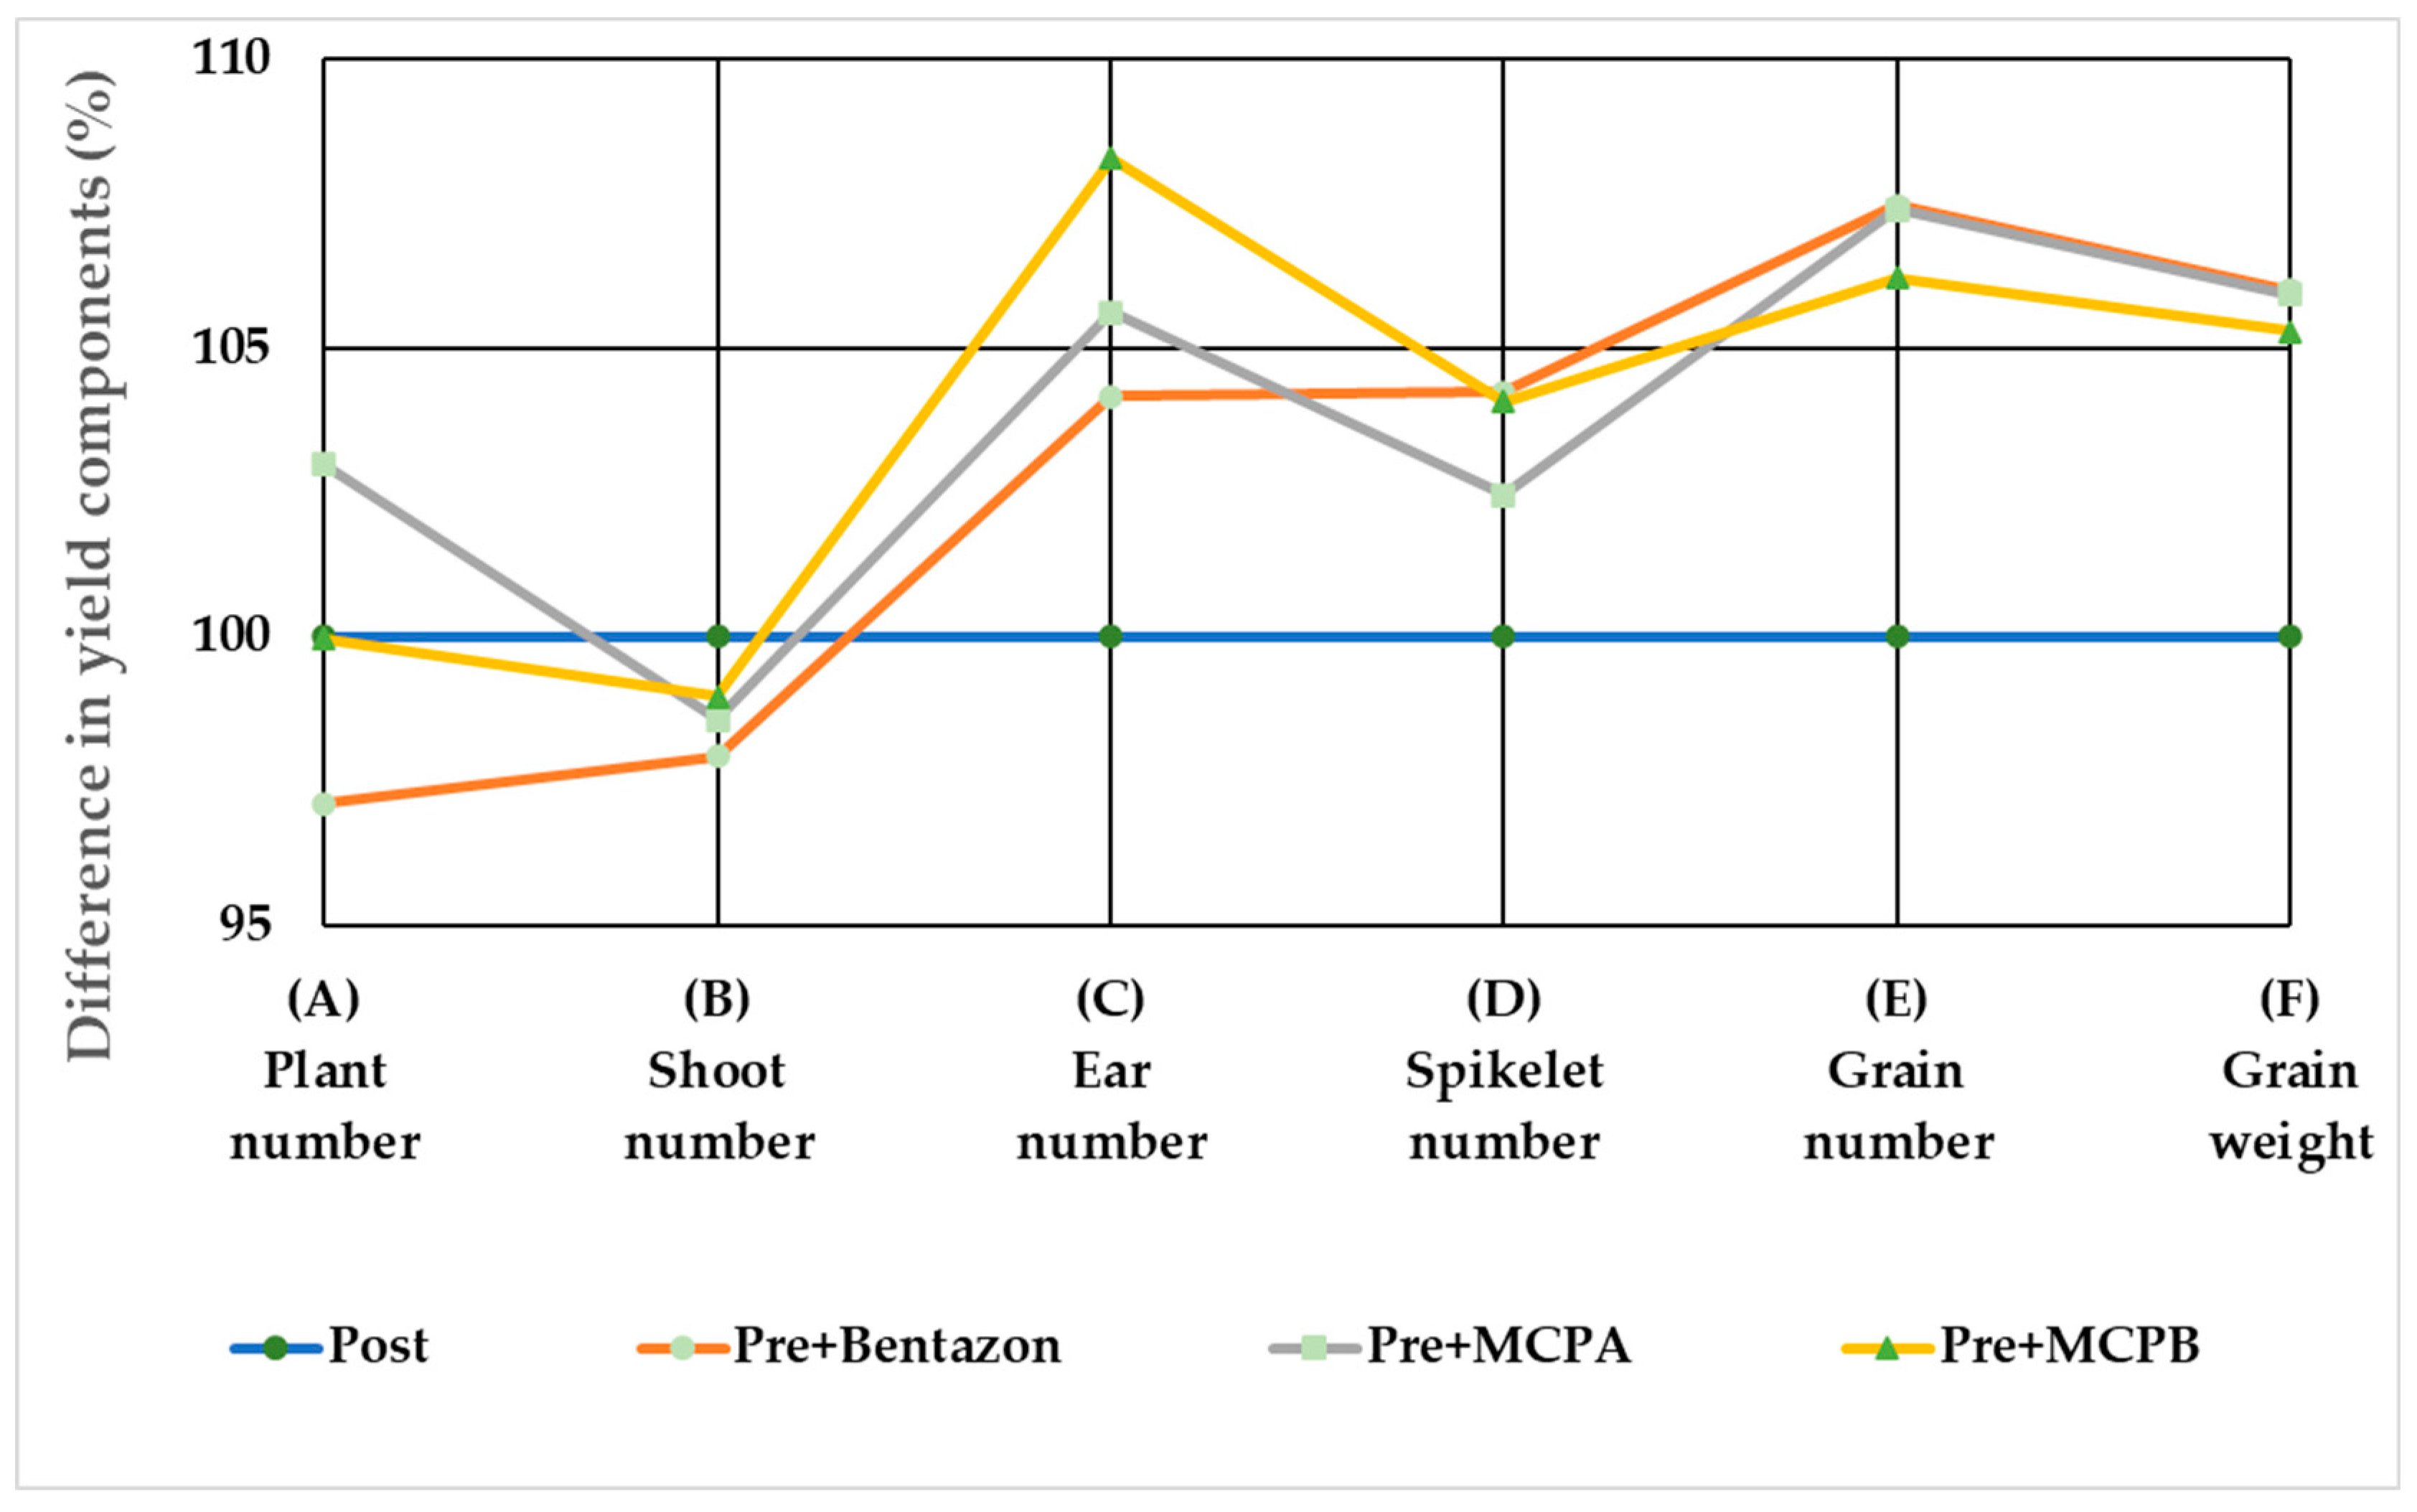
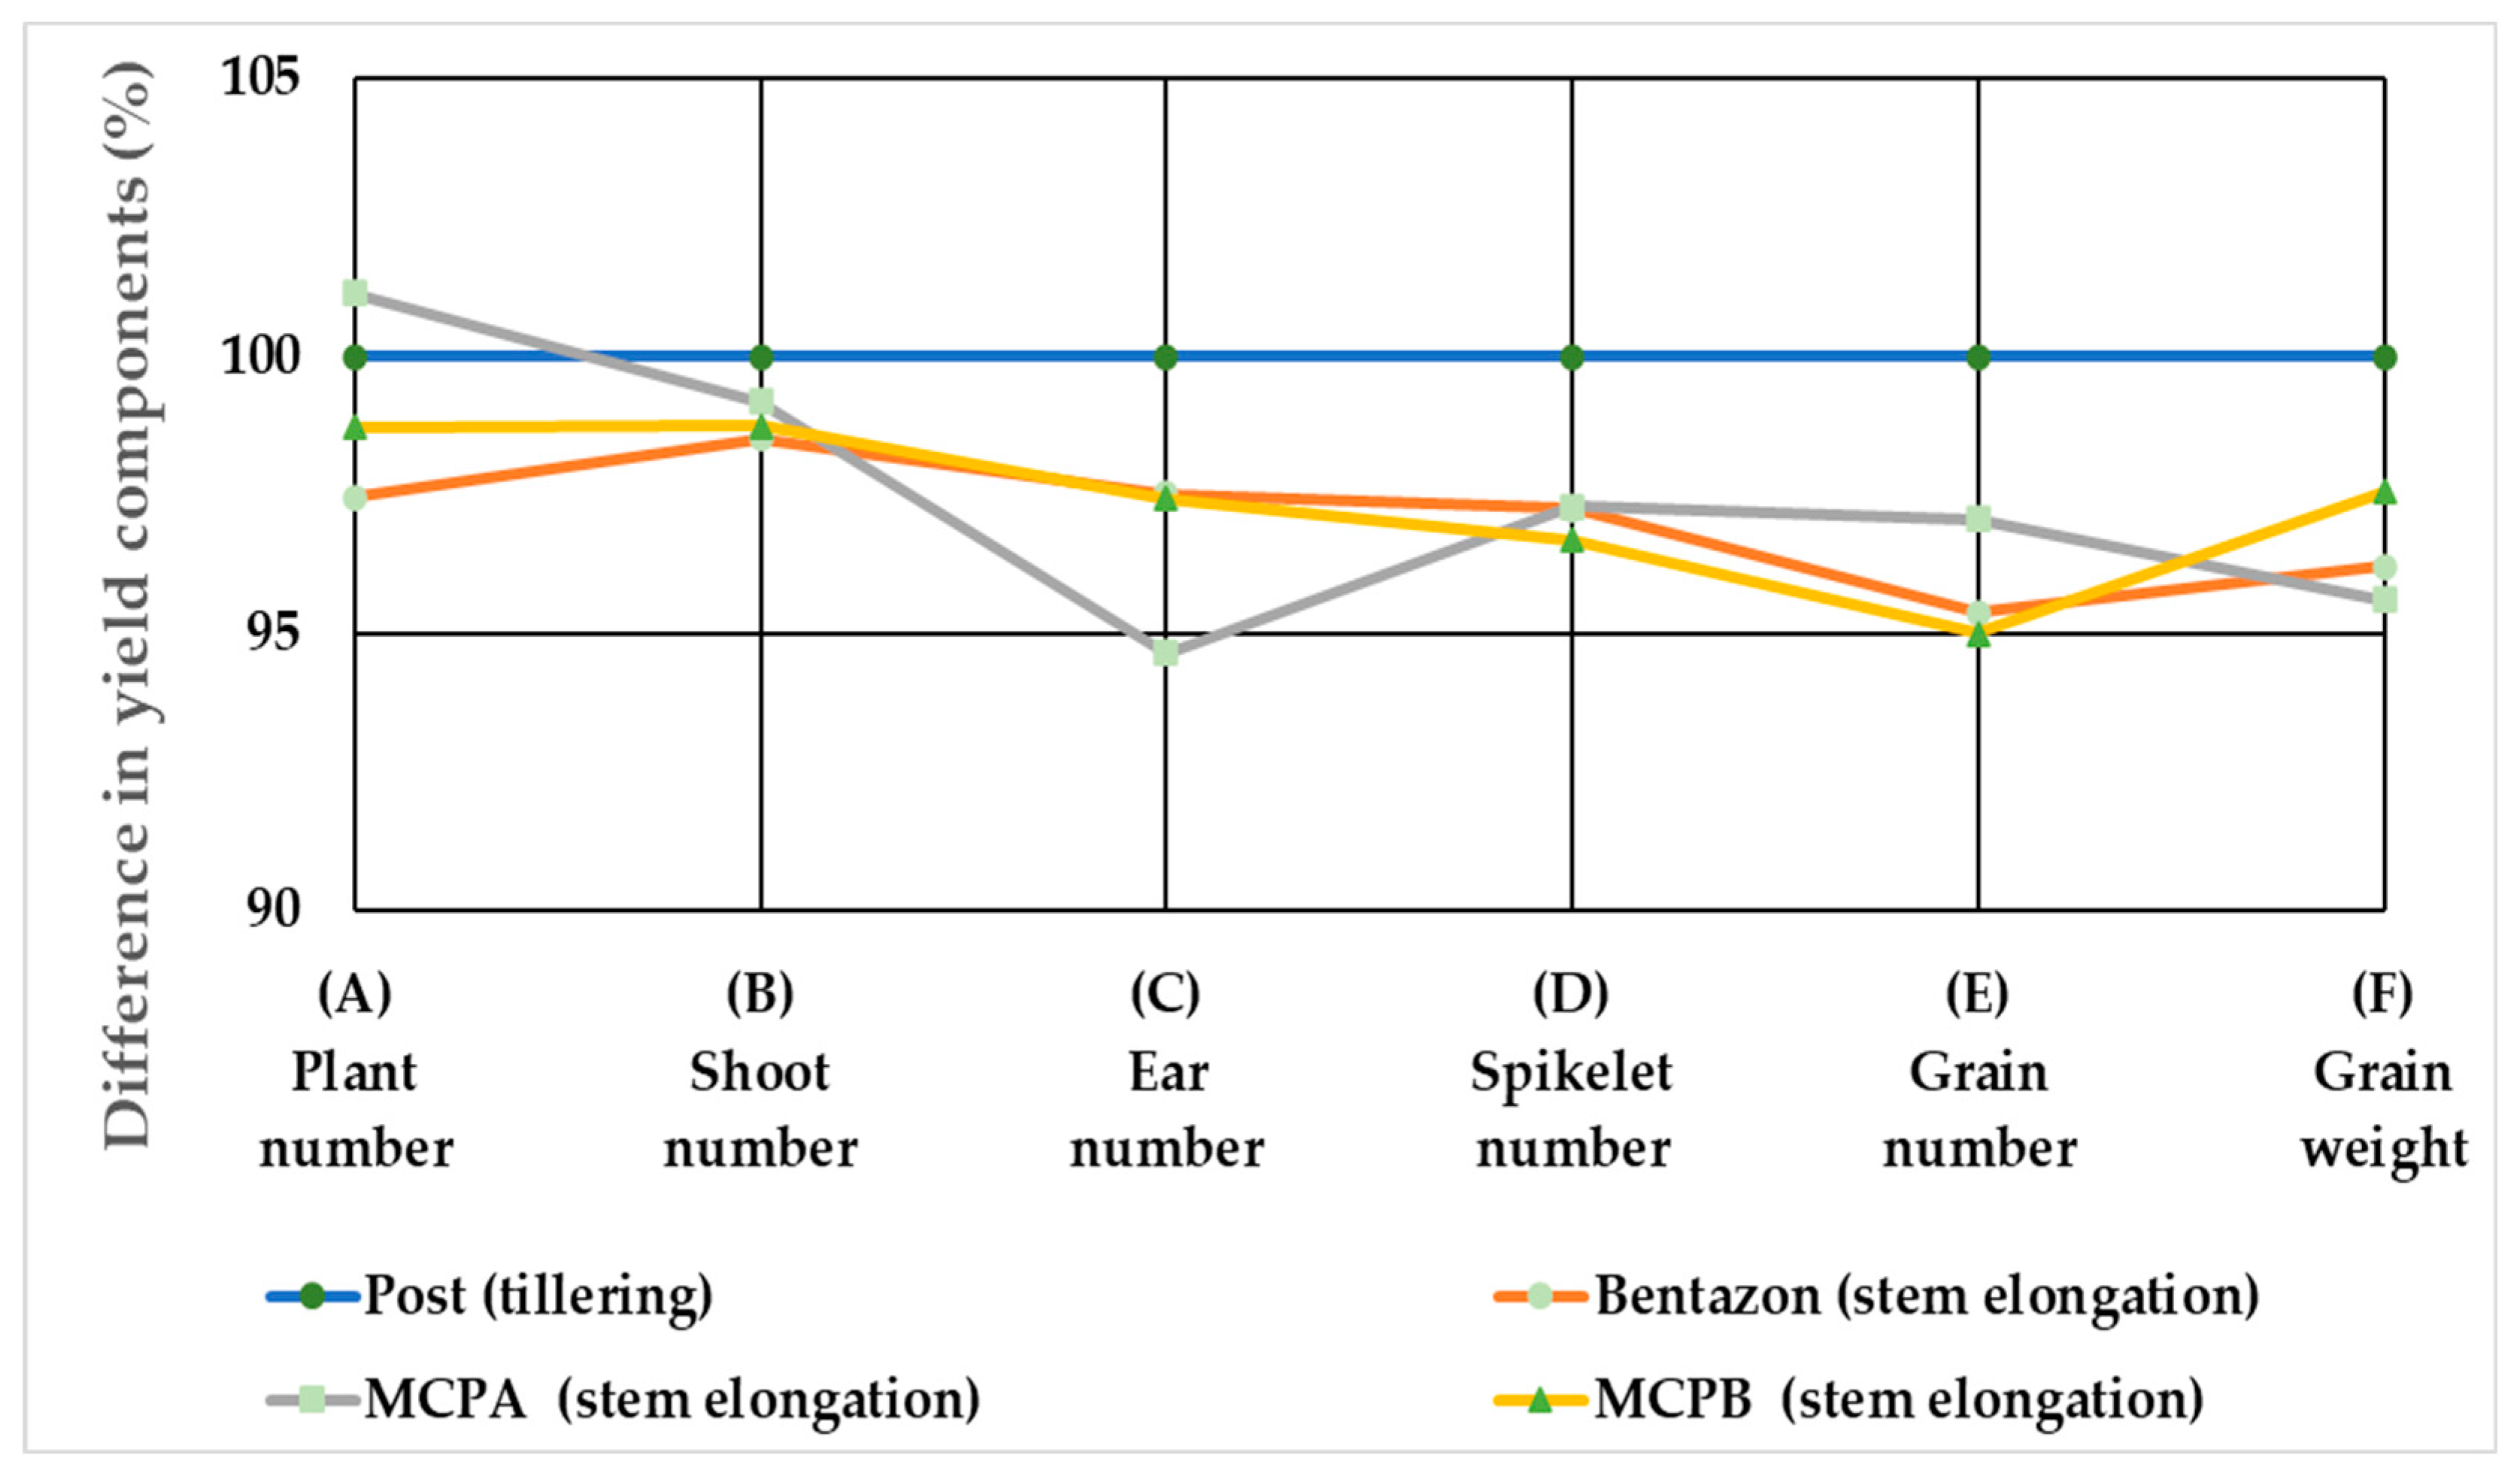
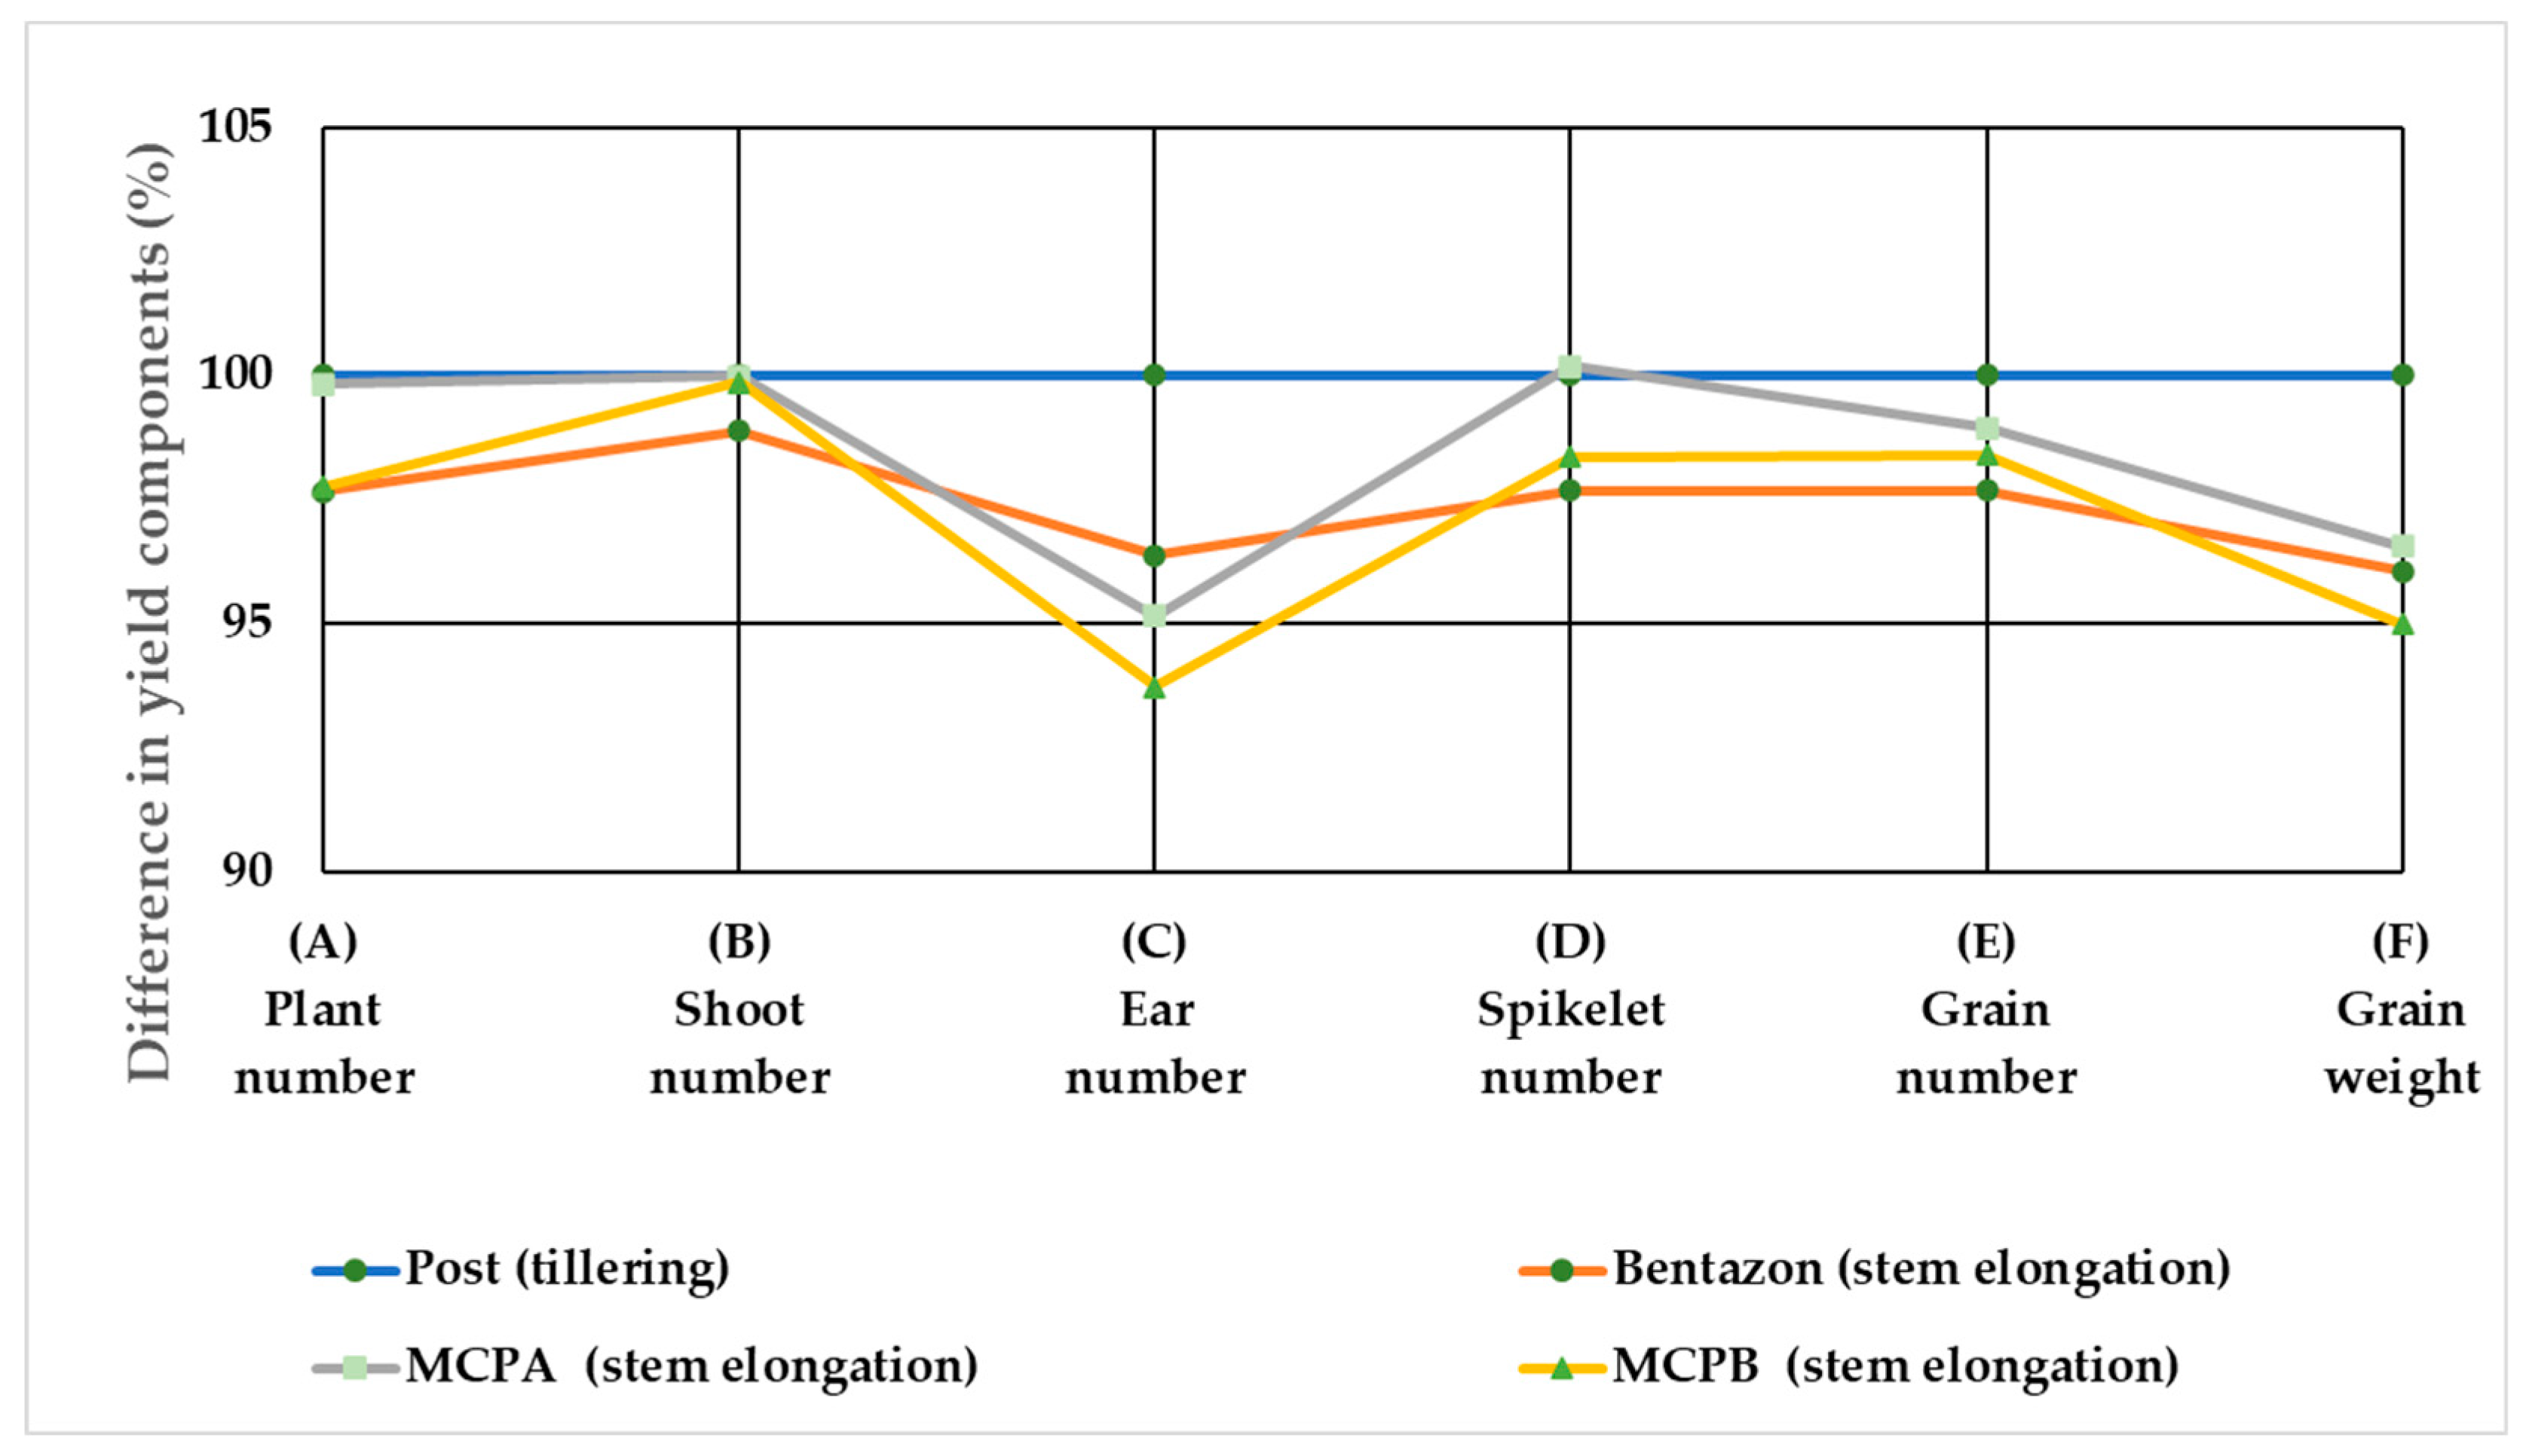
3.3.2. Changes in Winter Wheat Yield Components
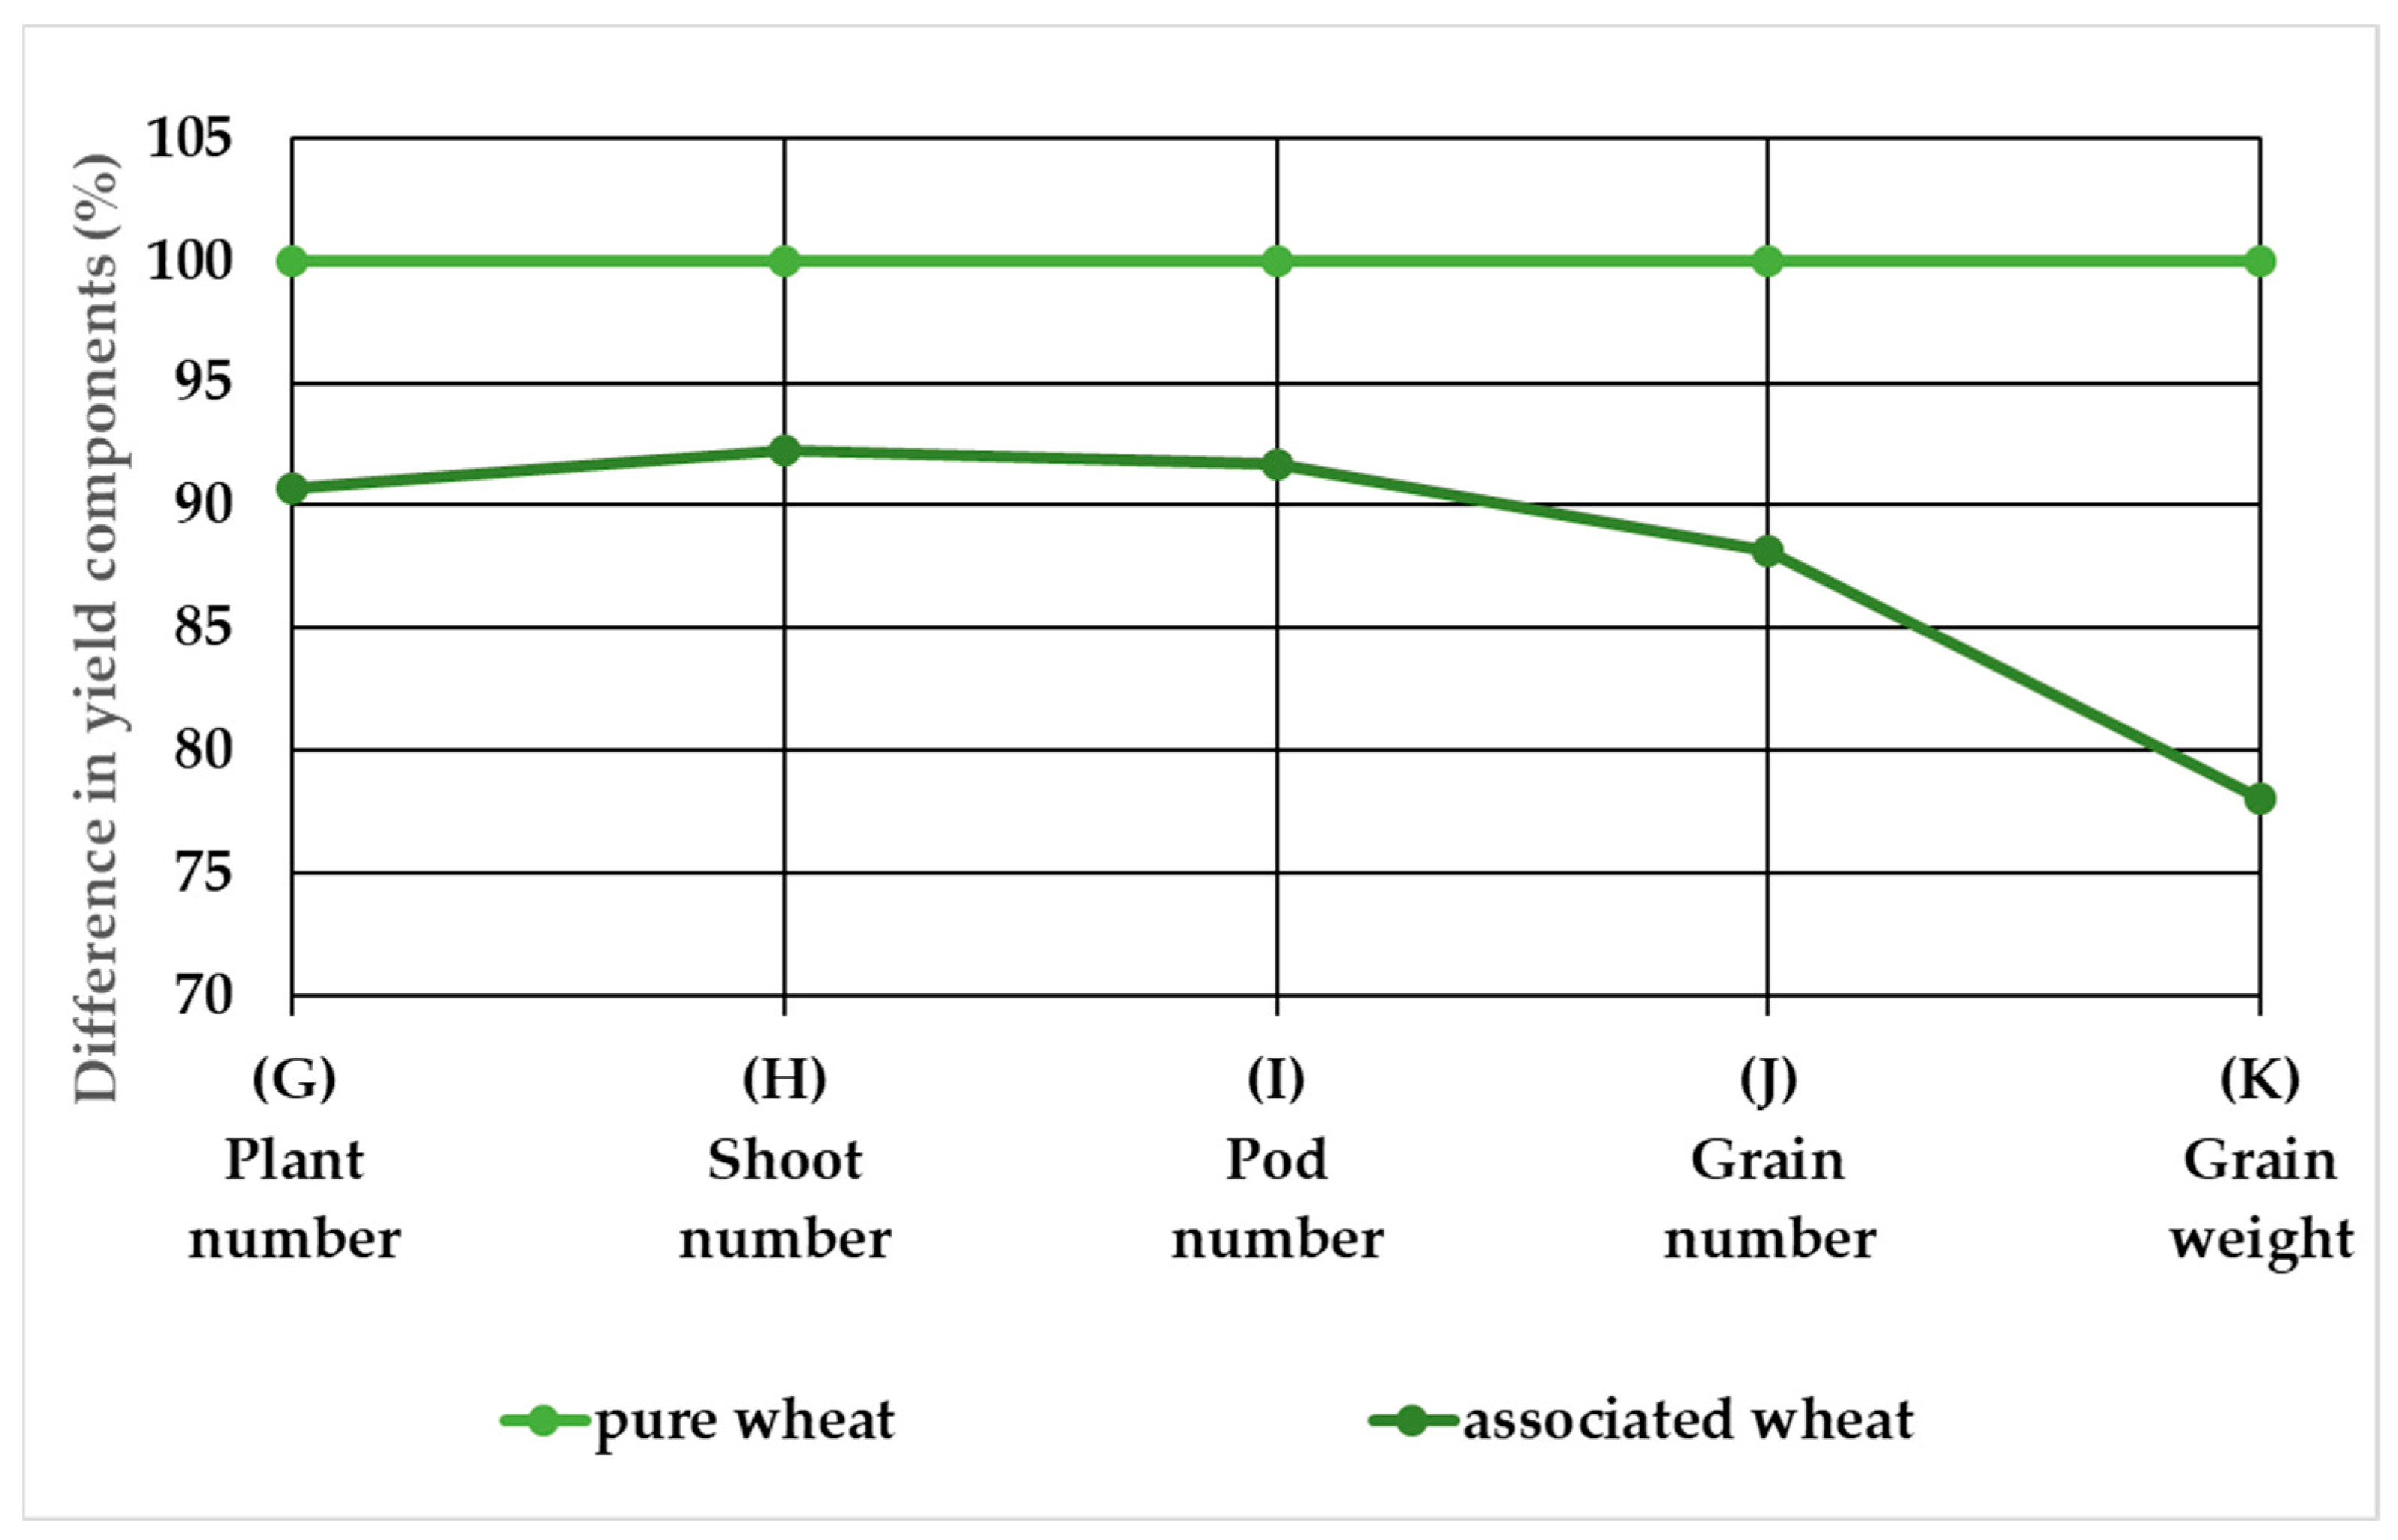
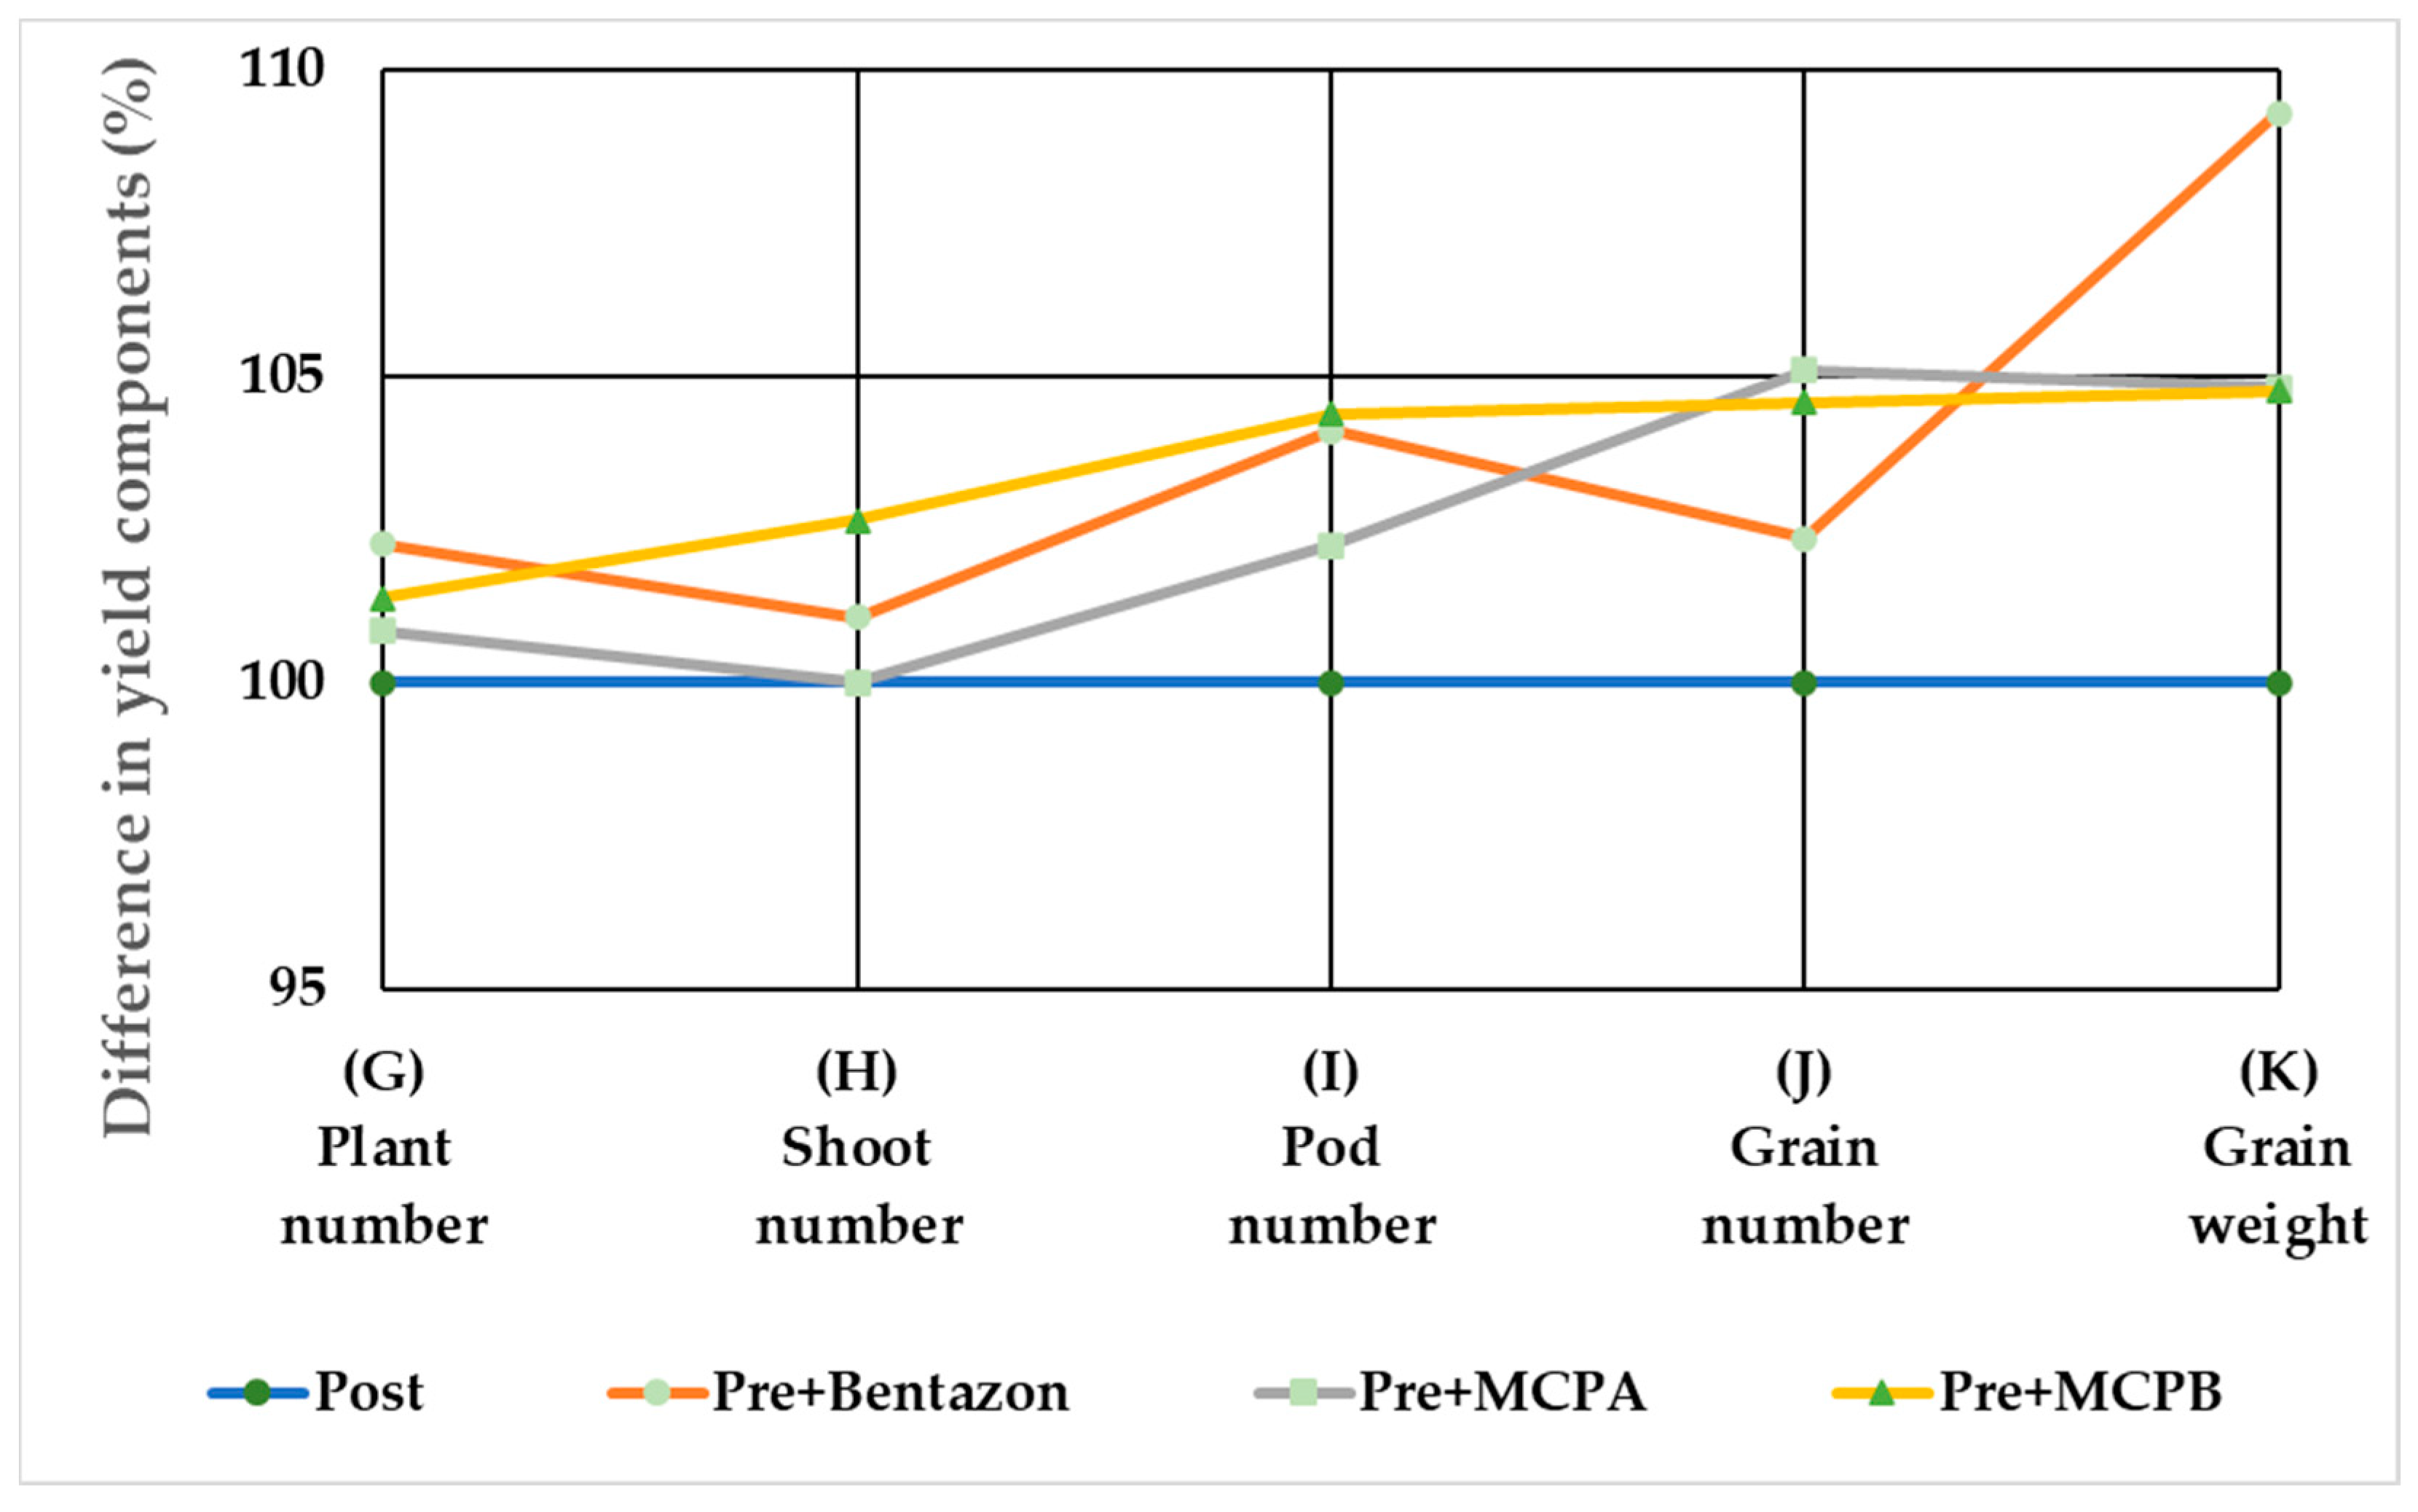
3.3.3. Changes in Winter Pea Yield Components
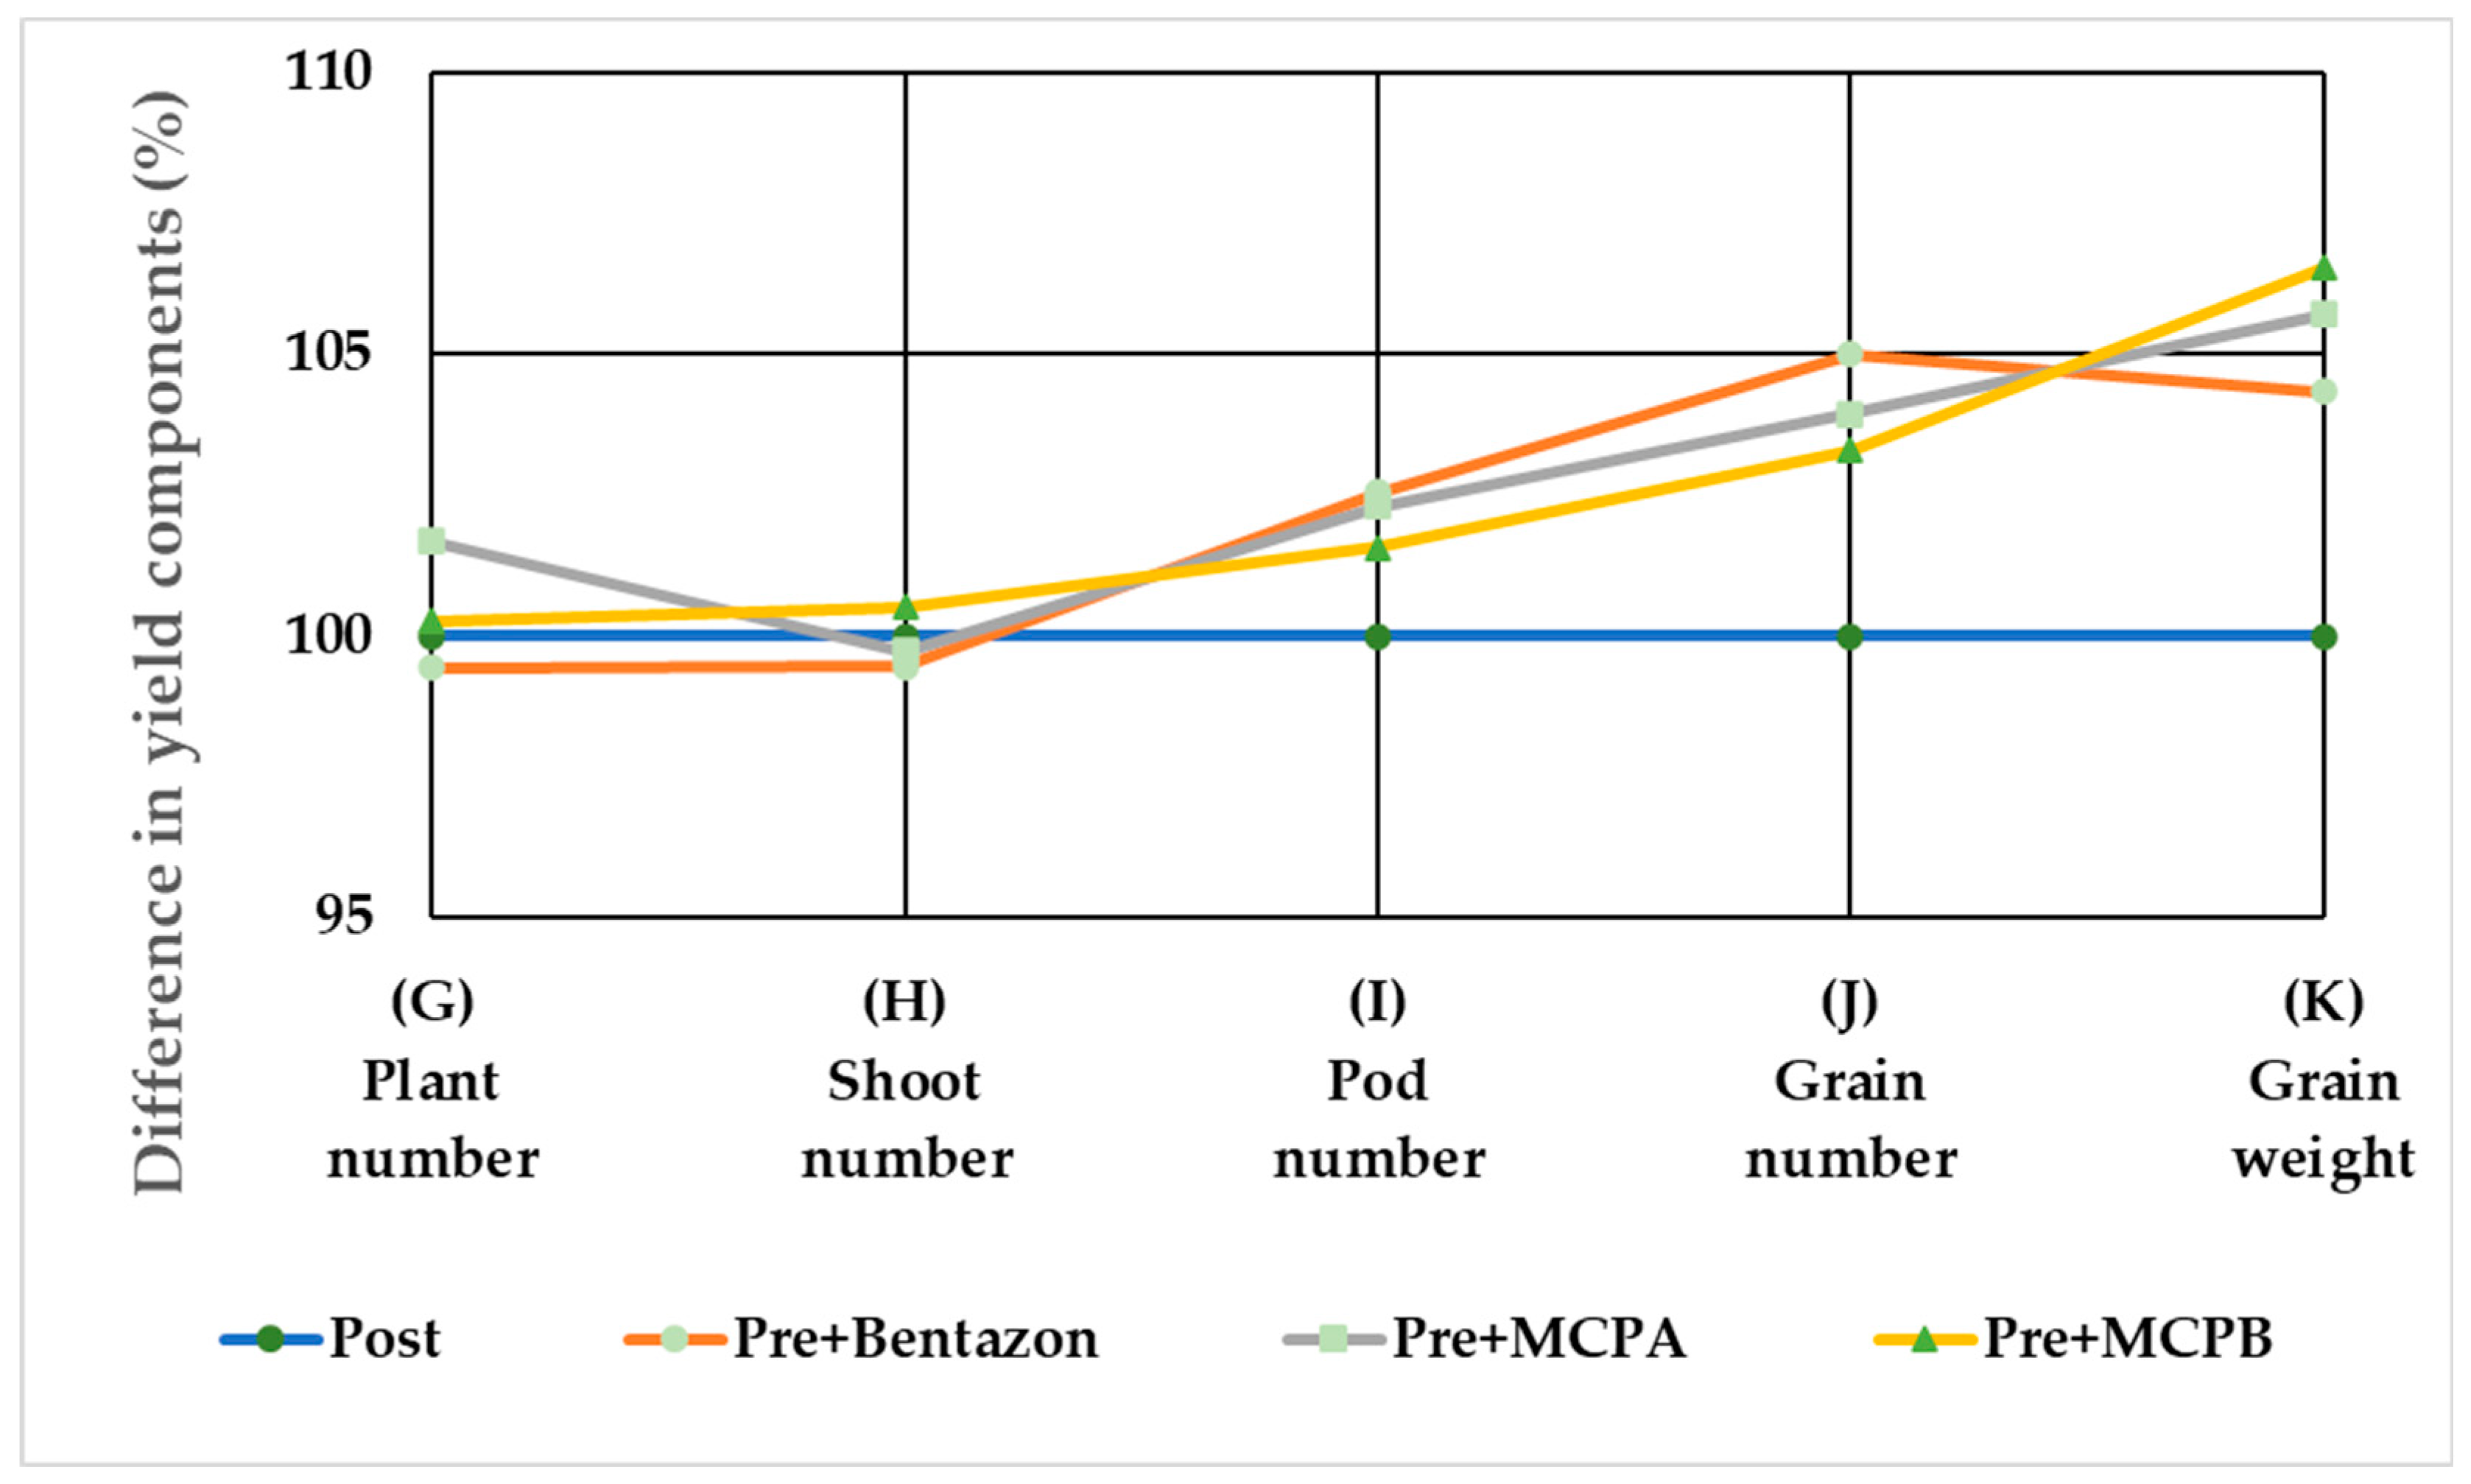
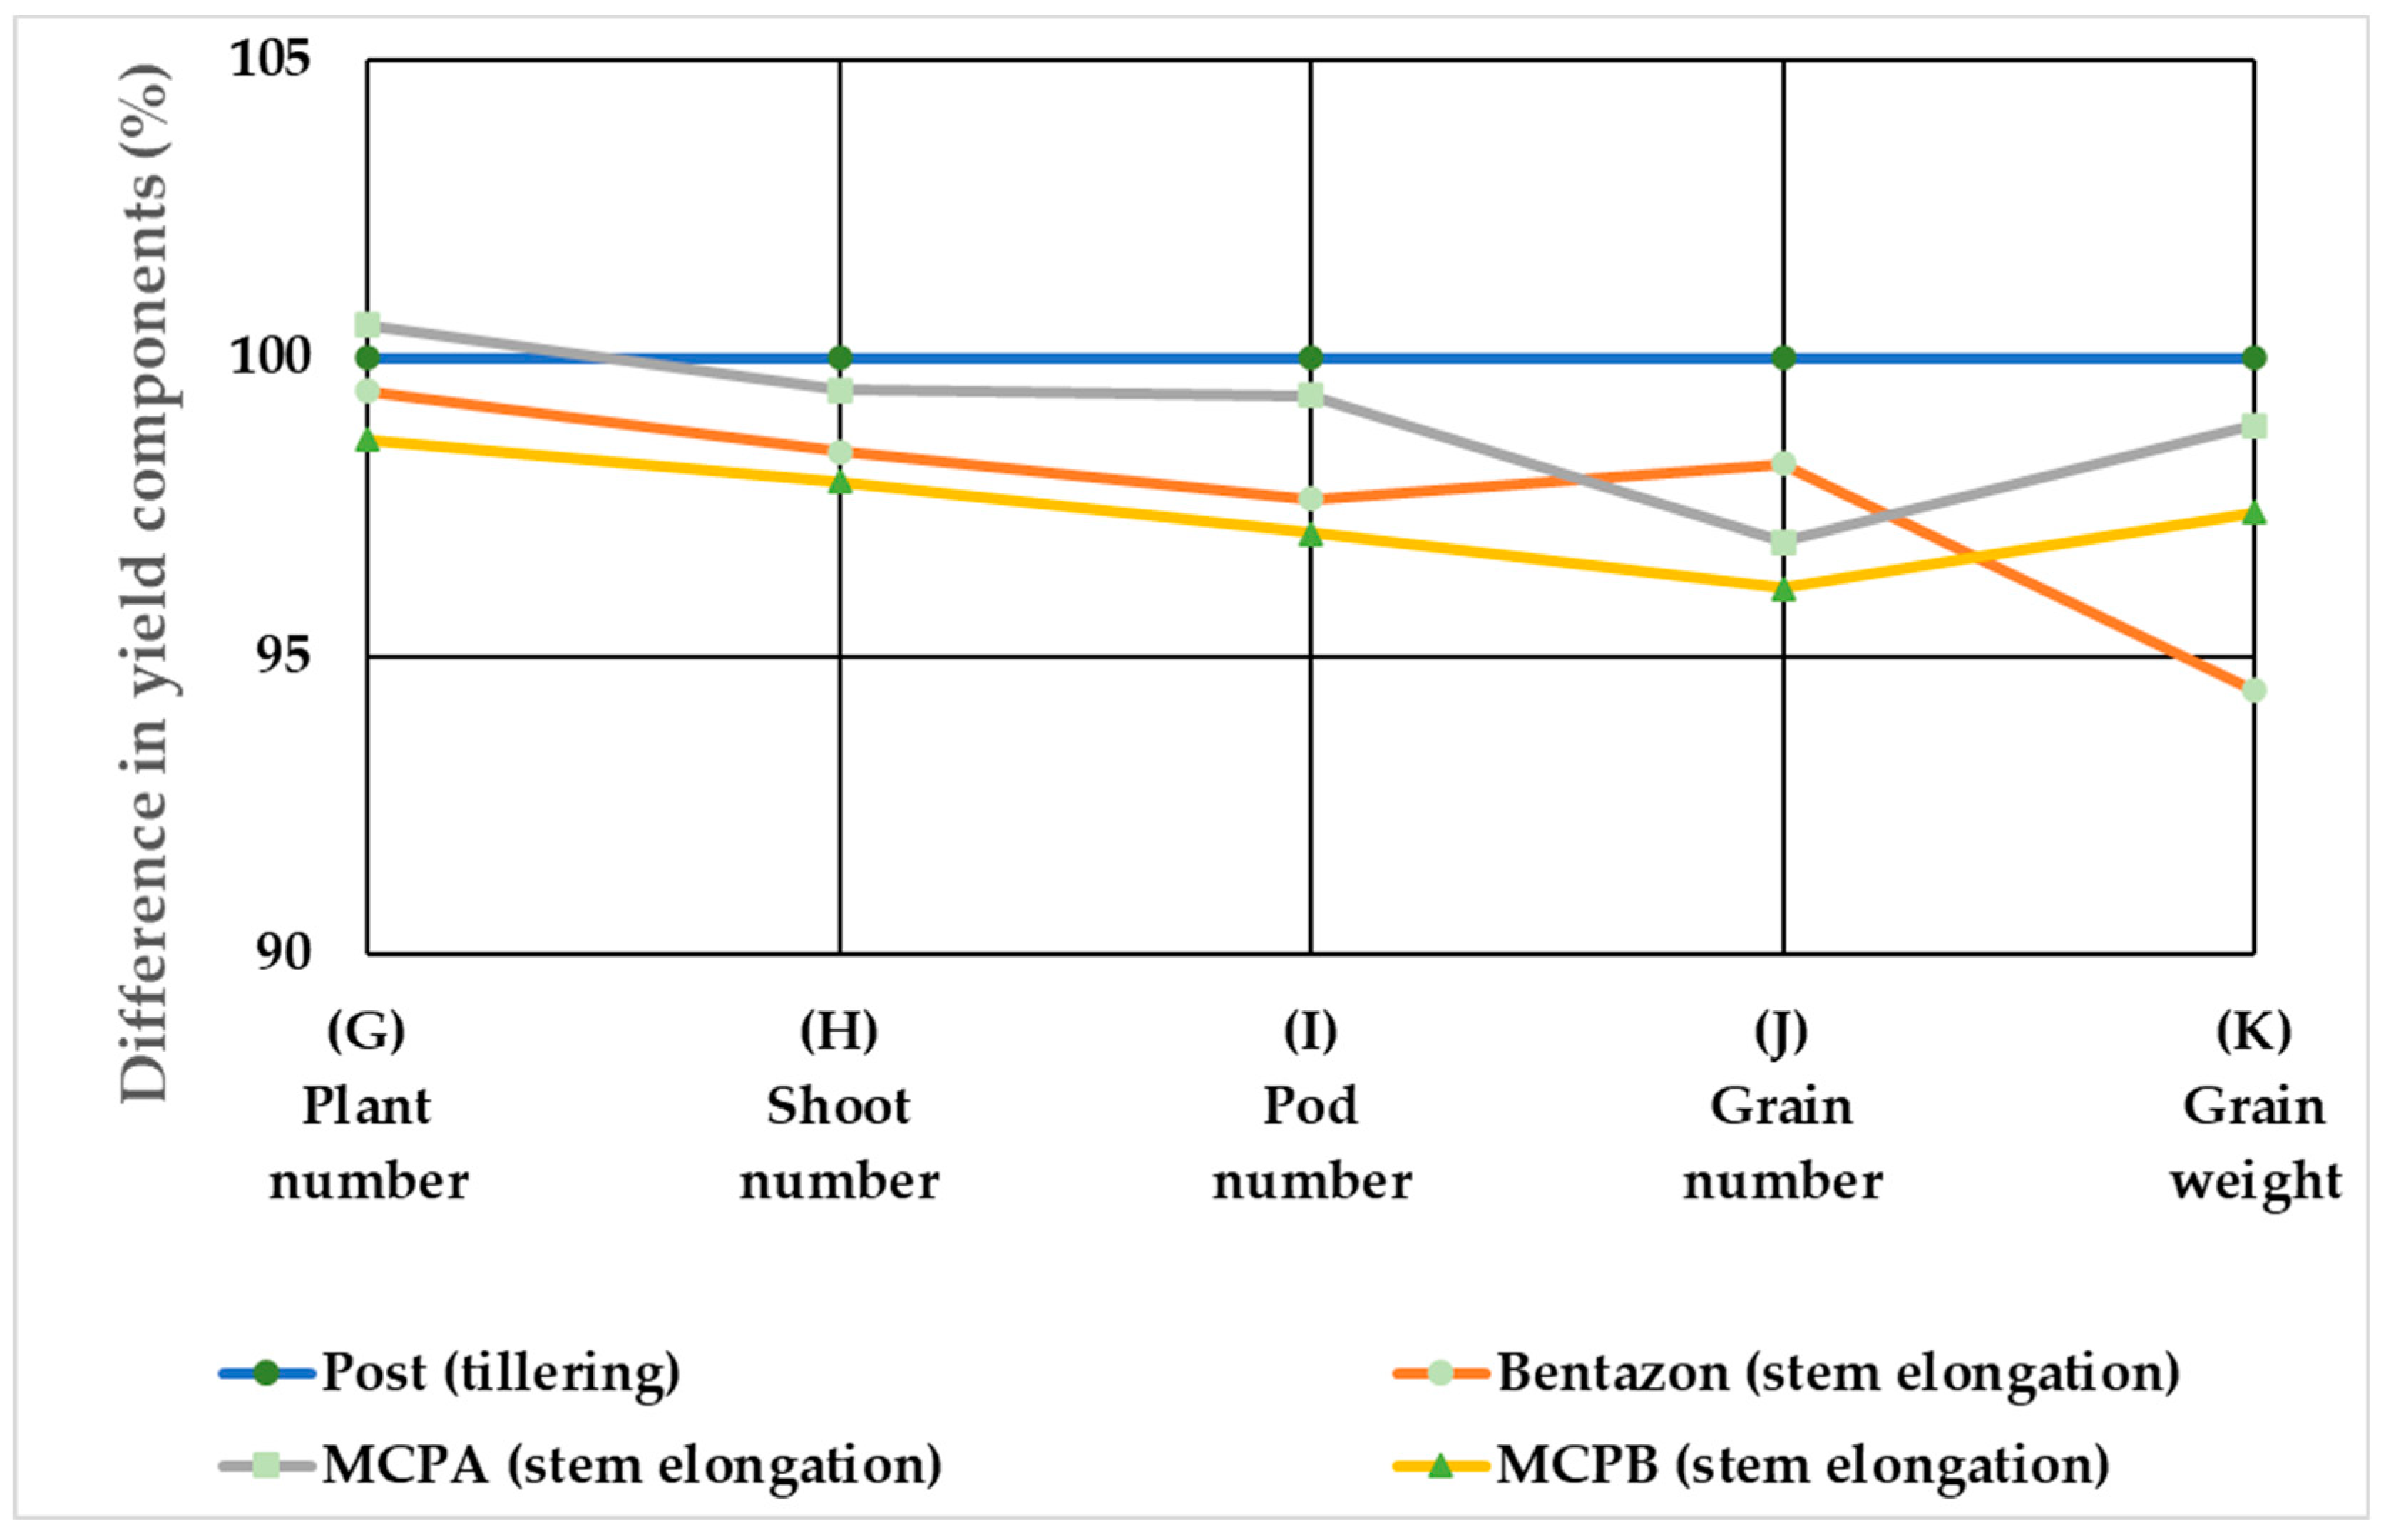
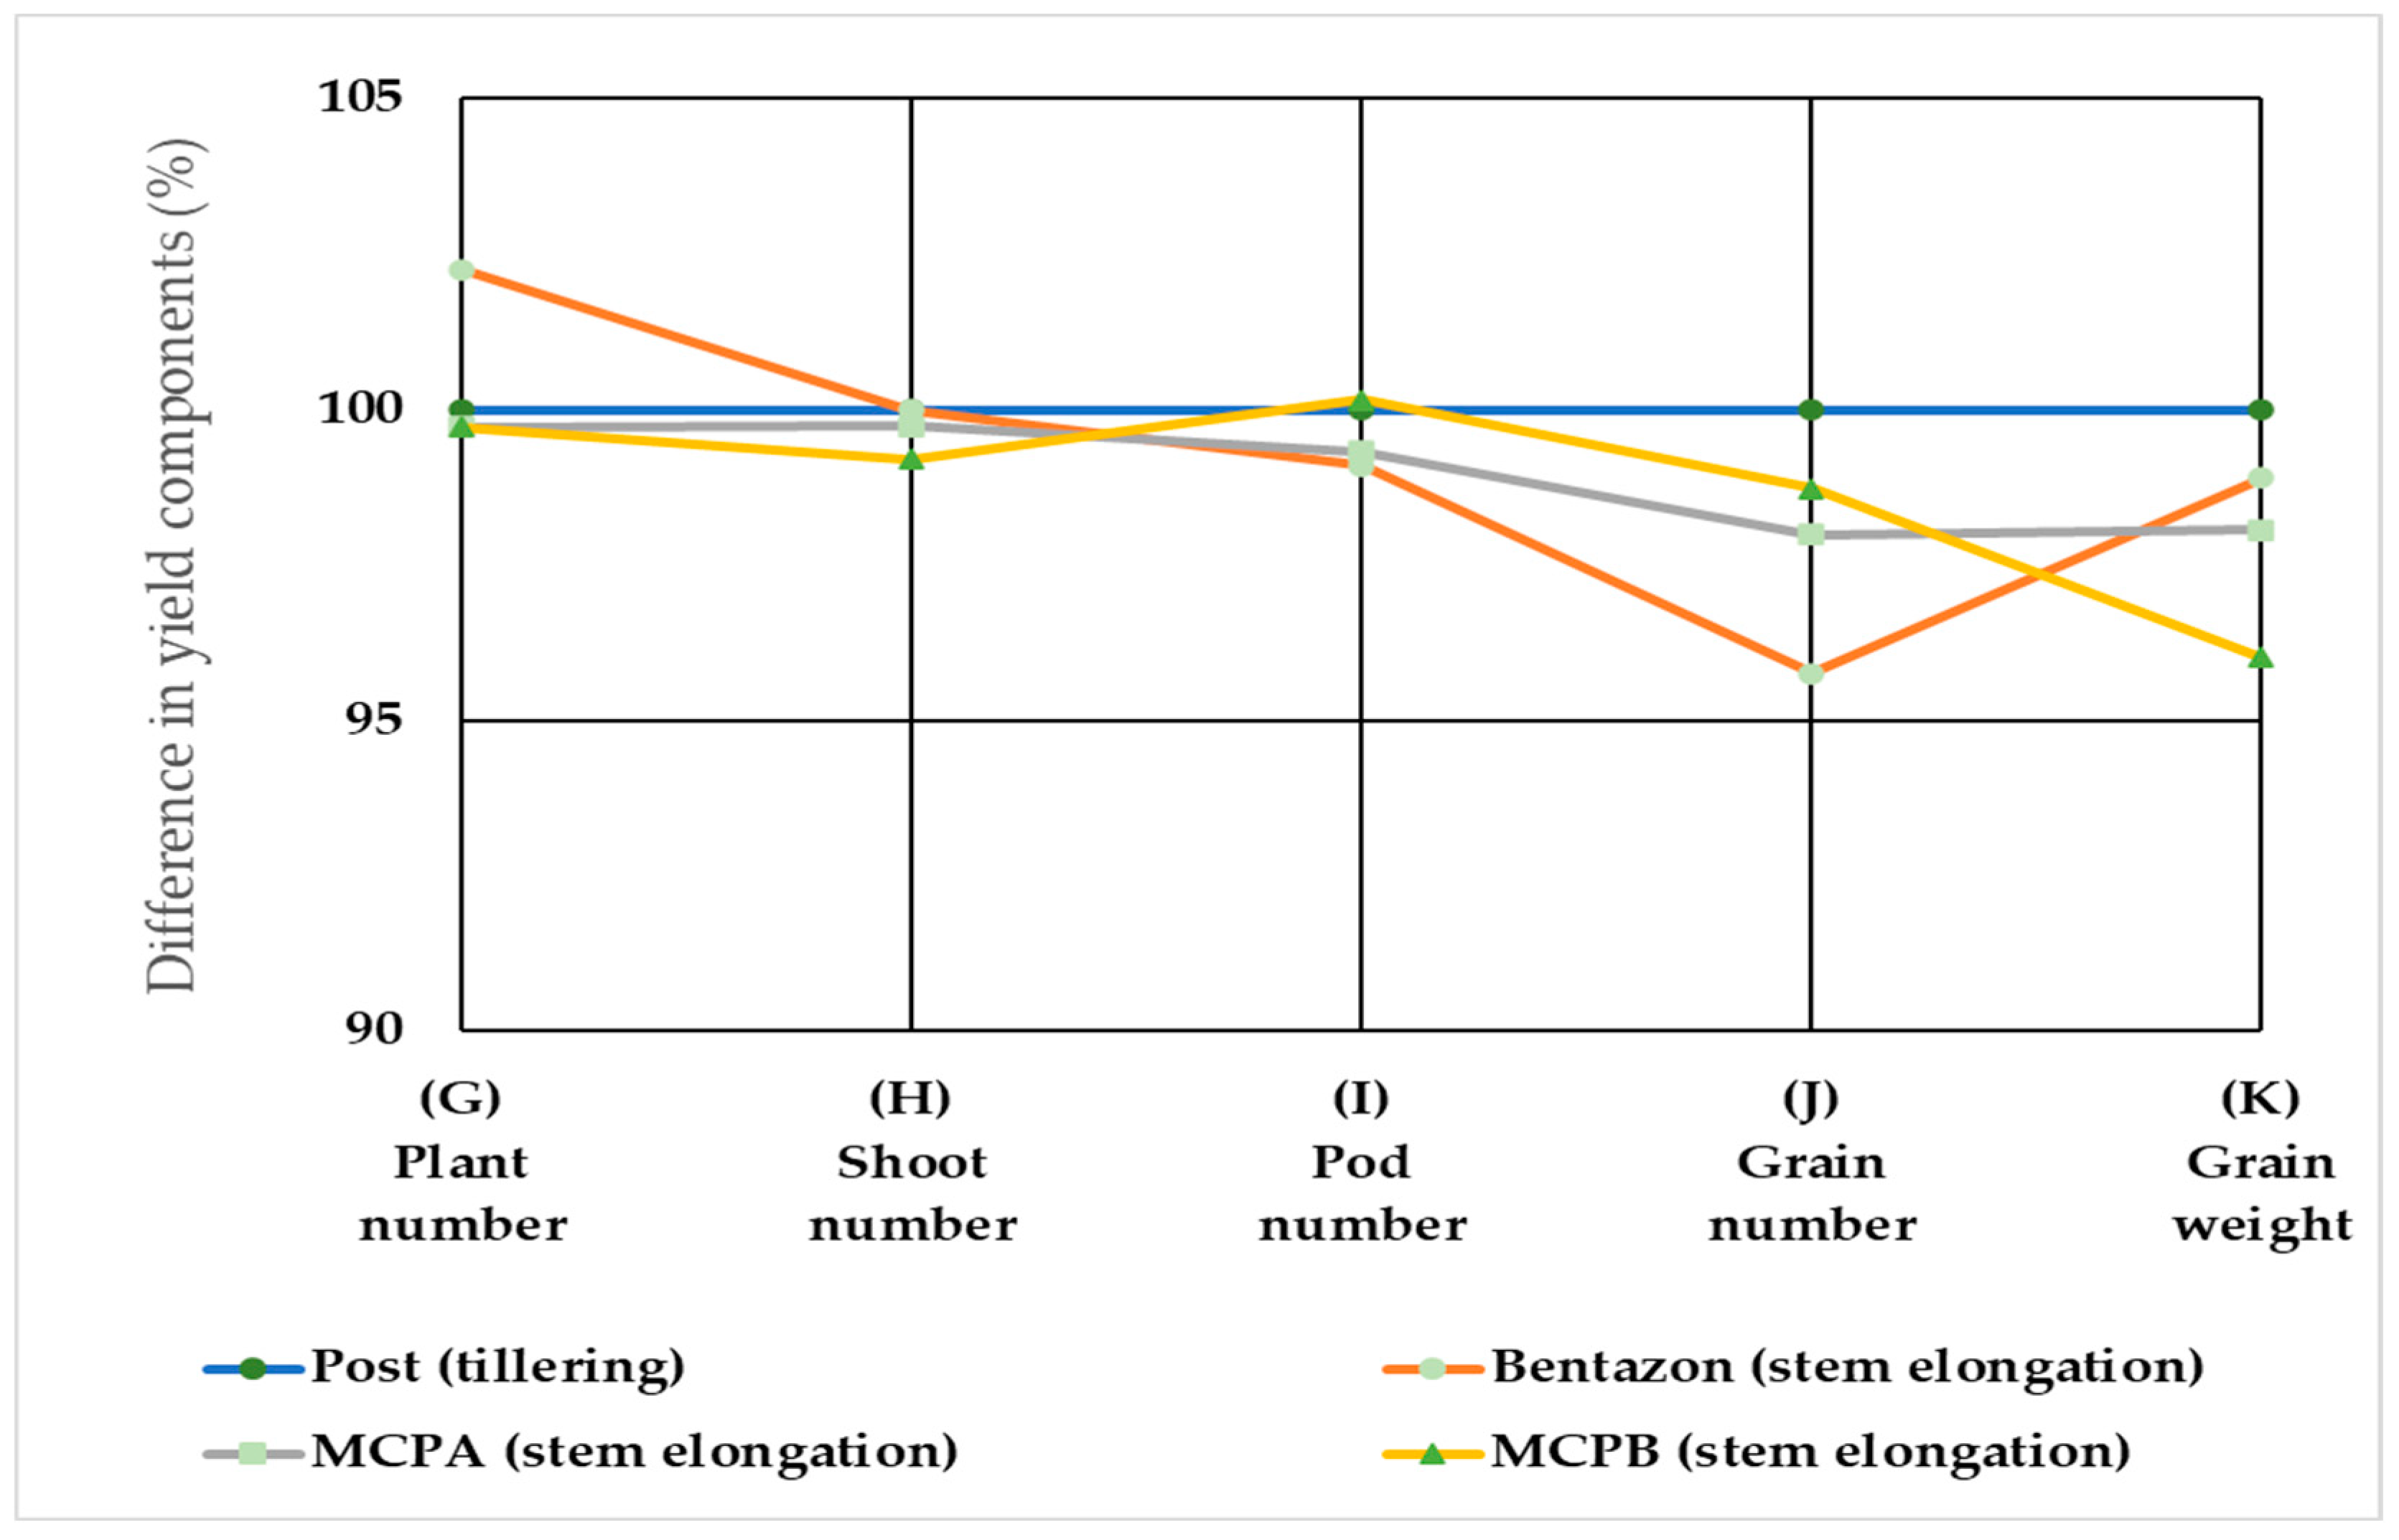
3.4. Development Lines of Winter Wheat and Winter Pea Depending on the Treatments
| (pcs/m2) | winter wheat |
| (pcs/m2) | winter wheat |
| (pcs/m2) | winter wheat |
| (pcs/m2) | winter wheat |
| (pcs/m2) | winter wheat |
| (g/m2) | winter wheat |
| (pcs/m2) | winter pea |
| (pcs/m2) | winter pea |
| (pcs/m2) | winter pea |
| (pcs/m2) | winter pea |
| (g/m2) | winter pea |
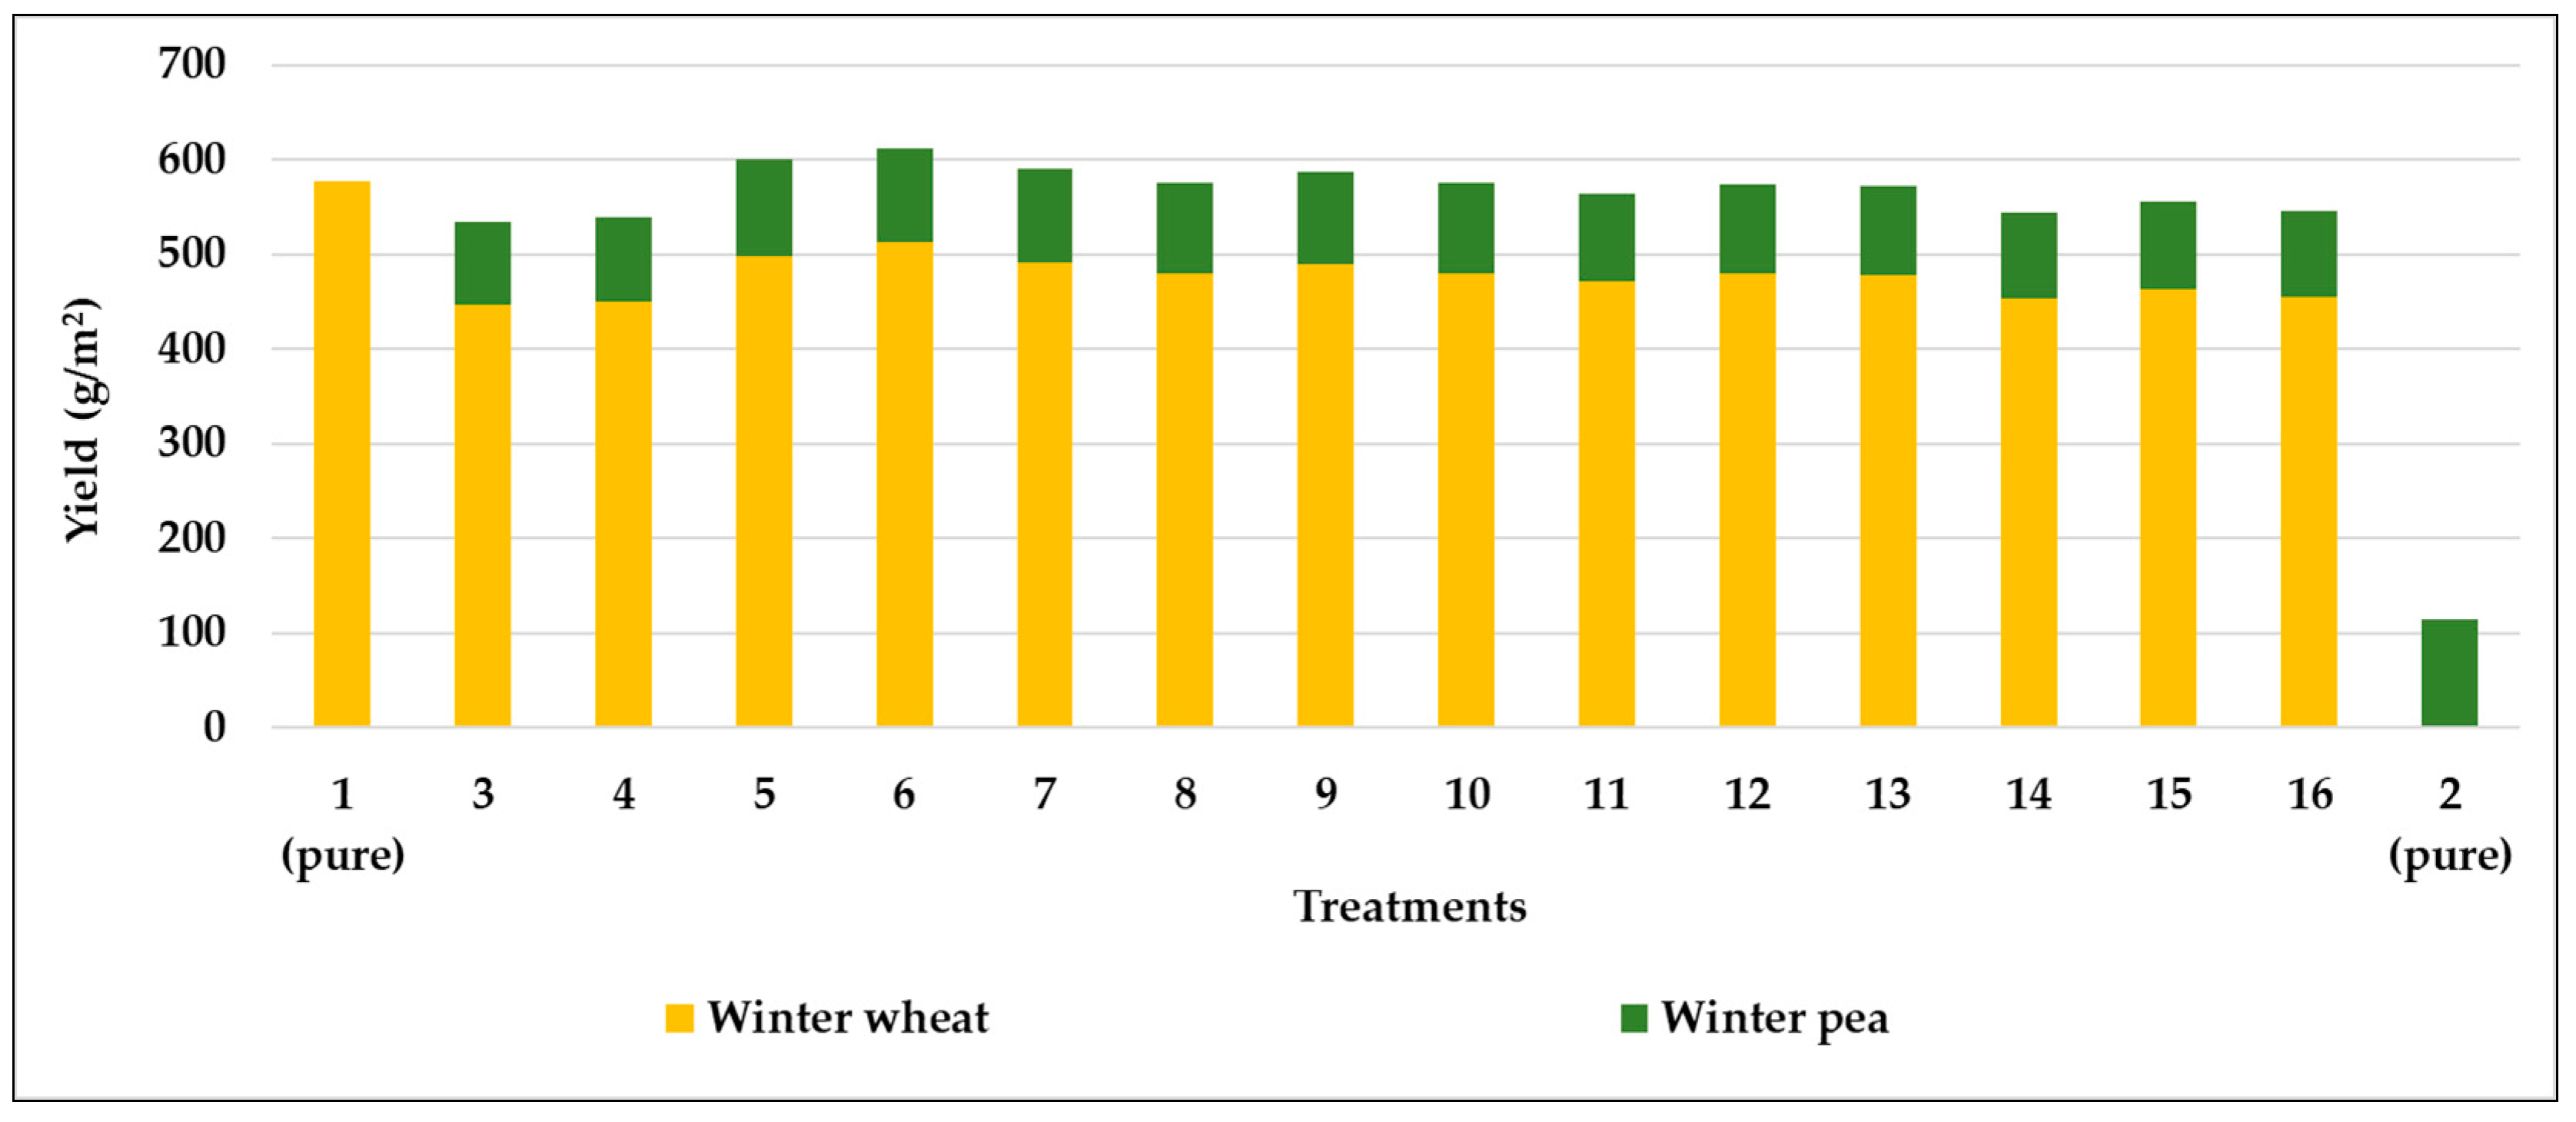
3.5. Total Yield in Different Treatments
4. Discussion
5. Conclusions
- The high weed suppression ability is one of the beneficial properties of plant associations. Lower weed cover was observed and the number of weed species was lower in the associated winter wheat–winter pea parcels compared to pure stands.
- The herbicide selection is considered challenging when two different species are combined in a plant association due to probable phytotoxicity and effectiveness. Nevertheless, the active ingredients—pendimethalin, bentazon, MCPA, and MCPB—Did not cause visually detectable crop damage in associated wheat and pea, but resulted in better yield component values compared to unweeded stands. The main reason for this is that weeds did not compete for available resources (light, water, and nutrients) with cultivated plants; thus, after successful weed control, the development of the yield components was not impeded.
- The effectiveness of weed control in plant association depends not only on the selection of the active ingredient, but also on the application time. Accordingly, pre-emergence and early post-emergence treatments, or pre-emergence and late post-emergence treatments, proved to be more effective than a single early or late herbicide application. Pre-emergence treatment in drought years has “bad” and “extremely weak” weed control effects, which can be improved by rainfall or irrigation after the application.
- Due to the high plant density in intercropping, the yield and yield components of the companion plants decreased, but the total yield in a given area (m2) was higher than in pure stands of the companion plants.
- The development of the associated plants, and thus the value of their yield components, largely depends on the growing season. Weather conditions influence the expansion and dominance of the participating species in intercropping. One year favors one companion plant, while another year favors the other companion plant. Thus, the application of plant association in crop rotation can provide yield stability for farmers, as total yield is more balanced.
Author Contributions
Funding
Institutional Review Board Statement
Informed Consent Statement
Data Availability Statement
Conflicts of Interest
References
- Mamine, F.; Farés, M. Barriers and Levers to Developing Wheat-Pea Intercropping in Europe. A Review. Sustainability 2020, 12, 6962. [Google Scholar] [CrossRef]
- Pankou, C.; Lithourgidis, A.; Dordas, C. Effect of Irrigation on Intercropping Systems of Wheat (Triticum aestivum L.) with Pea (Pisum sativum L.). Agronomy 2021, 11, 283. [Google Scholar] [CrossRef]
- Divéky-Ertsey, A.; Gál, I.; Madaras, K.; Pusztai, P.; Csambalik, L. Contribution of Pulses to Agrobiodiversity in the View of EU Protein Strategy. Stresses 2022, 2, 90–112. [Google Scholar] [CrossRef]
- Antal, J. Növénytermesztéstan 1; Mezőgazda Kiadó: Budapest, Hungary, 2005; pp. 180–188. ISBN 963-286-205-8. [Google Scholar]
- Bonnet, C.; Gaudio, N.; Alletto, L.; Raffaillac, D.; Bergez, J.-E.; Debaeke, P.; Gavaland, A.; Willaume, M.; Bedoussac, L.; Justes, E. Design and multicriteria assessment of low-input cropping systems based on plant diversification in southwestern France. Agron. Sustain. Dev. 2021, 41, 65. [Google Scholar] [CrossRef]
- Crews, T.E.; Peoples, M.B. Legume versus fertilizer sources of nitrogen: Ecological tradeoffs and human needs. Agric. Ecosyst. Environ. 2004, 102, 279–297. [Google Scholar] [CrossRef]
- Ketcheson, J.W. Long-range effects of intensive cultivation and monoculture on the quality of southern ontario soils. Can. J. Soil Sci. 1980, 60, 403–410. [Google Scholar] [CrossRef]
- Pepó, P.; Sárvári, M. Gabonanövények Termesztése. Az Agrármérnök MSc Szak Tananyagfejlesztése; Debreceni Egyetem: Debrecen, Hungary, 2011; p. 143. [Google Scholar]
- Eakin, H.; Webhe, M.; Ávila, C.; Torres, G.S.; Bojórquez-Tapia, L.A. A Comparison of the Social Vulnerability of Grain Farmers in Mexico and Argentina; Working Paper 29; Assessments of Impacts and Adaptations to Climate Change (AIACC): Washington, DC, USA, 2006. [Google Scholar]
- Fustec, J.; Lesuffleur, F.; Mahieu, S.; Cliquet, J.-B. Nitrogen rhizodeposition of legumes. A review. Agron. Sustain. Dev. 2010, 30, 57–66. [Google Scholar] [CrossRef]
- Vance, C.P. Symbiotic Nitrogen Fixation and Phosphorus Acquisition. Plant Nutrition in a World of Declining Renewable Resources. Plant Physiol. 2001, 127, 390–397. [Google Scholar] [CrossRef]
- Savci, S. Investigation of Effect of Chemical Fertilizers on Environment. APCBEE Procedia 2012, 1, 287–292. [Google Scholar] [CrossRef]
- Kumar, R.; Kumar, R.; Prakash, O. Chapter-5 the Impact of Chemical Fertilizers on Our Environment and Ecosystem. Chief Ed 2019, 35, 69–85. [Google Scholar]
- Kandpal, G. Review on impact of chemical fertilizers on environment. Int. J. Mod. Agric. Int. 2021, 10, 758–763. [Google Scholar]
- Naudin, C.; van der Werf, H.M.G.; Jeuffroy, M.-H.; Corre-Hellou, G. Life cycle assessment applied to pea-wheat intercrops: A new method for handling the impacts of co-products. J. Clean. Prod. 2014, 73, 80–87. [Google Scholar] [CrossRef]
- Hauggaard-Nielsen, H.; Jensen, E.S. Facilitative Root Interactions in Intercrops. Plant Soil 2005, 274, 237–250. [Google Scholar] [CrossRef]
- Abi-Ghanem, R.; Carpenter-Boggs, L.; Smith, J.L. Cultivar effects on nitrogen fixation in peas and lentils. Biol. Fertil. Soils 2011, 47, 115–120. [Google Scholar] [CrossRef]
- Bedoussac, L.; Justes, E. A comparison of commonly used indices for evaluating species interactions and intercrop efficiency: Application to durum wheat-winter pea intercrops. Field Crops Res. 2011, 124, 25–36. [Google Scholar] [CrossRef]
- Rácz, A.; Ujj, A.; Tar, M.; Vályi-Nagy, M.; Irmes, K.; Tóth, E.; Szentpéteri, L.; Kristó, I. Őszi kalászosok és őszi borsó társításának hatása a talaj teljes mikrobiális aktivitására. Acta Agron. Óváriensis 2021, 17, 142–158. [Google Scholar] [CrossRef]
- Bocz, E. Szántóföldi Növénytermesztés; Mezőgazda Kiadó: Budapest, Hungary, 1996; pp. 440–446. ISBN 963-286-081-0. [Google Scholar]
- Voisin, A.-S.; Guéguen, J.; Huyghe, C.; Jeuffroy, M.-H.; Magrini, M.-B.; Meynard, J.-M.; Mougel, C.; Pellerin, S.; Pelzer, E. Legumes for feed, food, biomaterials and bioenergy in Europe: A review. Agron. Sustain. Dev. 2014, 34, 361–380. [Google Scholar] [CrossRef]
- Gollner, G.; Starz, W.; Friedel, J.K. Crop performance, biological N fixation and pre-crop effect of pea ideotypes in an organic farming system. Nutr. Cycl. Agroecosyst. 2019, 115, 391–405. [Google Scholar] [CrossRef]
- Neugschwandtner, R.W.; Bernhuber, A.; Kammlander, S.; Wagentristl, H.; Klimek-Kopyra, A.; Losák, T.; Zholamanov, K.K.; Kaul, H.-P. Nitrogen Yields and Biological Nitrogen Fixation of Winter Grain Legumes. Agronomy 2021, 11, 681. [Google Scholar] [CrossRef]
- Naudin, C.; Corre-Hellou, G.; Pineau, S.; Crozat, Y.; Jeuffroy, M.-H. The effect of various dynamics of N availability on winter pea–wheat intercrops: Crop growth, N partitioning and symbiotic N2 fixation. Field Crops Res. 2010, 119, 2–11. [Google Scholar] [CrossRef]
- Vályi-Nagy, M.; Tar, M.; Irmes, K.; Rácz, A.; Kristó, I. Az őszi borsó hatása az őszi búza termésmennyiségére és fehérje hozamára együtt vetési kísérletben. Acta Agron. Óváriensis 2021, 15, 159–173. [Google Scholar] [CrossRef]
- Ghaley, B.B.; Hauggaard-Nielsen, H.; Jensen, H.H.; Jensen, E.S. Intercropping of Wheat and Pea as Influenced by Nitrogen Fertilization. Nutr. Cycl. Agroecosyst. 2005, 73, 201–212. [Google Scholar] [CrossRef]
- Neugschwandtner, R.W.; Kaul, H.-P.; Moitzi, G.; Klimek-Kopyra, A.; Losák, T.; Wagentristl, H. A low nitrogen fertiliser rate in oat–pea intercrops does not impair N2 fixation. Acta Agric. Scand. Sect. B-Soil Plant Sci. 2021, 71, 182–190. [Google Scholar] [CrossRef]
- Guinet, M.; Nicolardot, B.; Revellin, C.; Durey, V.; Carlsson, G.; Voisin, A.-S. Comparative effect of inorganic N on plant growth and N2 fixation of ten legume crops: Towards a better understanding of the differential response among species. Plant Soil 2018, 432, 207–227. [Google Scholar] [CrossRef]
- Jensen, E.S.; Hauggaard-Nielsen, H. How can increased use of biological N2 fixation in agriculture benefit the environment? Plant Soil 2003, 252, 177–186. [Google Scholar] [CrossRef]
- Fujita, K.; Ofosu-Budu, K.G.; Ogata, S. Biological nitrogen fixation in mixed legume-cereal cropping systems. Plant Soil 1992, 141, 155–175. [Google Scholar] [CrossRef]
- Corre-Hellou, G.; Fustec, J.; Crozat, Y. Interspecific Competition for Soil N and its Interaction with N2 Fixation, Leaf Expansion and Crop Growth in Pea-Barley Intercrops. Plant Soil 2006, 282, 195–208. [Google Scholar] [CrossRef]
- Bedoussac, L.; Justes, E. The efficiency of a durum wheat-winter pea intercrop to improve yield and wheat grain protein concentration depends on N availability during early growth. Plant Soil 2010, 330, 19–35. [Google Scholar] [CrossRef]
- Ofori, F.; Stern, W. Cereal-Legume Intercropping Systems. Adv. Agron. 1987, 41, 41–90. [Google Scholar] [CrossRef]
- Willey, R.W. Resource use in intercropping systems. Agric. Water Manag. 1990, 17, 215–231. [Google Scholar] [CrossRef]
- Pelzer, E.; Bazot, M.; Makowski, D.; Corre-Hellou, G.; Naudin, C.; Al Rifaï, M.; Baranger, E.; Bedoussac, L.; Biarnès, V.; Boucheny, P.; et al. Pea-wheat intercrops in low-input conditions combine high economic performances and low environmental impacts. Eur. J. Agron. 2012, 40, 39–53. [Google Scholar] [CrossRef]
- Lithourgidis, A.S.; Dordas, C.A.; Damalas, C.A.; Vlachostergios, D.N. Annual intercrops: An alternative pathway for sustainable agriculture. Aust. J. Crop Sci. 2011, 5, 396–410. [Google Scholar] [CrossRef]
- Vályi-Nagy, M.; Tar, M.; Irmes, K.; Rácz, A.; Kristó, I. Winter wheat and winter pea intercrop: An alternative technology of crop management preserves high yield quality and stability low input. Res. J. Agric. Sci. 2021, 53, 120–127. [Google Scholar]
- Kristó, I.; Tar, M.; Jakab, P.; Milánkovics, M.; Irmes, K.; Rácz, A.; Vályi-Nagy, M. The influence of winter wheat and winter pea intercrop on grain yield and profitability. Res. J. Agric. Sci. 2021, 53, 81–88. [Google Scholar]
- Bulson, H.A.J.; Snaydon, R.W.; Stopes, C.E. Effects of plant density on intercropped wheat and field beans in an organic farming system. J. Agric. Sci. 1997, 128, 59–71. [Google Scholar] [CrossRef]
- Hauggaard-Nielsen, H.; Jensen, E. Evaluating pea and barley cultivars for complementarity in intercropping at different levels of soil N availability. Field Crops Res. 2001, 72, 185–196. [Google Scholar] [CrossRef]
- Syrovy, L.D.; Banniza, S.; Shirtliffe, S.J. Yield and Agronomic Advantages of Pea Leaf Type Mixtures under Organic Management. Agron. J. 2014, 107, 113–120. [Google Scholar] [CrossRef]
- Bedoussac, L.; Journet, E.-P.; Hauggaard-Nielsen, H.; Naudin, C.; Corre-Hellou, G.; Jensen, E.S.; Prieur, L.; Justes, E. Ecological principles underlying the increase of productivity achieved by cereal-grain legume intercrops in organic farming. A review. Agron. Sustain. Dev. 2015, 35, 911–935. [Google Scholar] [CrossRef]
- Kristó, I.; Tar, M.; Irmes, K.; Vályi-Nagy, M.; Rácz, A.; Szalai, D. Effect of weed management practices on weed cover in field pea (pisum sativum L.). Rev. Agric. Rural Dev. 2020, 6, 9–14. [Google Scholar] [CrossRef]
- Harker, K.N.; Blackshaw, R.E.; Clayton, G.W. Timing weed removal in field pea (Pisum sativum). Weed Technol. 2001, 15, 277–283. [Google Scholar] [CrossRef]
- Lemerle, D.; Verbeek, B.; Diffey, S. Influences of field pea (Pisum sativum) density on grain yield and competitiveness with annual ryegrass (Lolium rigidum) in south-eastern Australia. Aust. J. Exp. Agric. 2006, 46, 1465–1472. [Google Scholar] [CrossRef]
- Karkanis, A.; Ntatsi, G.; Kontopoulou, C.-K.; Pristeri, A.; Bilalis, D.; Savvas, D. Field Pea in European Cropping Systems: Adaptability, Biological Nitrogen Fixation and Cultivation Practices. Not. Bot. Horti Agrobot. Cluj-Napoca 2016, 44, 325–336. [Google Scholar] [CrossRef]
- Mohler, C.L.; Liebman, M. Weed Productivity and Composition in Sole Crops and Intercrops of Barley and Field Pea. J. Appl. Ecol. 1987, 24, 685–699. [Google Scholar] [CrossRef]
- Andersen, M.K.; Hauggaard-Nielsen, H.; Ambus, P.; Jensen, E.S. Biomass production, symbiotic nitrogen fixation and inorganic N use in dual and tri-component annual intercrops. Plant Soil 2004, 266, 273–287. [Google Scholar] [CrossRef]
- Andersen, M.K.; Hauggaard-Nielsen, H.; Weiner, J.; Jensen, E.S. Competitive dynamics in two- and three-component intercrops. J. Appl. Ecol. 2007, 44, 545–551. [Google Scholar] [CrossRef]
- Poggio, S.L. Structure of weed communities occurring in monoculture and intercropping of field pea and barley. Agric. Ecosyst. Environ. 2005, 109, 48–58. [Google Scholar] [CrossRef]
- Banik, P.; Midya, A.; Sarkar, B.K.; Ghose, S.S. Wheat and chickpea intercropping systems in an additive series experiment: Advantages and weed smothering. Eur. J. Agron. 2006, 24, 325–332. [Google Scholar] [CrossRef]
- Kádár, A.; Benécsné Bárdi, G.; Doma, C.; Dorner, Z.; Gracza, L.; Gyulai, B.; Hódi, L.; Hornyák, A.; Litkei, L.; Molnár, F.; et al. Vegyszeres Gyomirtás és Termésszabályozás; Mezőgazda Kiadó: Budapest, Hungary, 2019; ISBN 978-615-00-6072-9. [Google Scholar]
- Ilina, S.; Ivanova, I.; Fadeev, A. Effectiveness of herbicide treatment on pea crops. Earth Environ. Sci. 2021, 839, 022030. [Google Scholar] [CrossRef]
- Lemerle, D.; Hinkley, R.B. Tolerances of canola, field pea, lupin and faba bean cultivars to herbicides. Aust. J. Exp. Agric. 1991, 31, 379–386. [Google Scholar] [CrossRef]
- Jensen, P.K. Tolerance to foliage-applied herbicides in combining peas: Effect of growth stage, cultivar type and herbicide. Crop Prot. 1993, 12, 214–218. [Google Scholar] [CrossRef]
- Vasilakoglou, I.; Vlachostergios, D.; Dhima, K.; Lithourgidis, A. Response of vetch, lentil, chickpea and red pea to pre- or post-emergence applied herbicides. Span. J. Agric. Res. 2013, 11, 1101. [Google Scholar] [CrossRef]
- Hanson, B.D.; Thill, D.C. Effects of Imazethapyr and Pendimethalin on Lentil (Lens culinaris), Pea (Pisum sativum), and subsequent Winter Wheat (Triticum aestivum) Crop. Weed Technol. 2001, 15, 190–194. [Google Scholar] [CrossRef]
- Miller, T.W. Effect of Several Herbicides on Green Pea (Pisum sativum) and Subsequent Crops. Weed Technol. 2003, 17, 731–737. [Google Scholar] [CrossRef]
- Harker, K.N.; Blackshaw, R.E.; Clayton, G.W. Wild Oat (Avena fatua) vs. Redstem Filaree (Erodium cicutarium) Interference in Dry Pea. Weed Technol. 2007, 21, 235–240. [Google Scholar] [CrossRef]
- Abdallah, I.S.; Abdelgawad, K.F.; El-Mogy, M.M.; El-Sawy, M.B.I.; Mahmoud, H.A.; Fahmy, M.A.M. Weed Control, Growth, Nodulation, Quality and Storability of Peas as Affected by Pre- and Postemergence Herbicides. Horticulturae 2021, 7, 307. [Google Scholar] [CrossRef]
- Weaver, M.L.; Nylund, R.E. Factors Influencing the Tolerance of Peas to MCPA. Weeds 1963, 11, 142–148. [Google Scholar] [CrossRef]
- Jensen, P.K. Split application of herbicides in peas. Weed Res. 1992, 32, 295–302. [Google Scholar] [CrossRef]
- Hunyadi, K.; Béres, I.; Kazinczi, G. Gyomnövények, Gyomirtás, Gyombiológia; Mezőgazda Kiadó: Budapest, Hungary, 2004; ISBN 2399992946976. [Google Scholar]
- Dancza, I.; Benécsné Bárdi, G.; Dellei, A.; Gara, S.; Hartmann, F.; Hódi, L.; Hoffmanné Pathy, Z.; Karamán, J.; Koroknai, B.; Nagy, M.; et al. Guidelines for Herbicide Trials, Standard Methods of Efficacy Trials for Authorization of Herbicide; Department for Plant Protection and Soil Conservation Ministry of Agriculture and Rural Development: Budapest, Hungary, 2004; pp. 39–48.
- Sváb, J.; Szabó, M. A búzatermesztés növekedésének vizsgálata terméselemzéssel 1954–1972 években. Növénytermelés 1973, 22, 289–300. [Google Scholar]
- Sváb, J. Trágyázási és egyéb agrotechnikai kísérletek értékelése kumulatív terméselemzéssel. Agrokém. És Talajt. 1962, 11, 219–236. [Google Scholar]
- Sváb, J. Új termesztési módszer a növényfajták fejlődésének jellemzésére. MTA Agrártud. Oszt. Közl. 1961, 19, 253–261. [Google Scholar]


| Number of Treatments | Date of Treatments in 2018 | Date of Treatments in 2019 | Growth Stages of Wheat | Growth Stages of Pea | Active Ingredient | Dose (g/ha) |
|---|---|---|---|---|---|---|
| 1 | pure winter wheat (Triticum aestivum L.), no weed control | |||||
| 2 | pure winter pea (Pisum sativum L.), no weed control | |||||
| 3 | winter wheat (Triticum aestivum L.) and winter pea (Pisum sativum L.) in intercropping system, no weed control | |||||
| 4 | 30 October | 18 October | germination | germination | pendimethalin | 1600 |
| 5 | 30 October | 18 October | germination | germination | pendimethalin | 1600 |
| 5 March | 17 March | tillering | 4–6 leaves stage | bentazon | 960 | |
| 6 | 30 October | 18 October | germination | germination | pendimethalin | 1600 |
| 5 March | 17 March | tillering | 4–6 leaves stage | MCPA | 750 | |
| 7 | 30 October | 18 October | germination | germination | pendimethalin | 1600 |
| 5 March | 17 March | tillering | 4–6 leaves stage | MCPB | 1752 | |
| 8 | 30 October | 18 October | germination | germination | pendimethalin | 1600 |
| 26 April | 23 April | stem elongation | beginning of flowering | bentazon | 960 | |
| 9 | 30 October | 18 October | germination | germination | pendimethalin | 1600 |
| 26 April | 23 April | stem elongation | beginning of flowering | MCPA | 750 | |
| 10 | 30 October | 18 October | germination | germination | pendimethalin | 1600 |
| 26 April | 23 April | stem elongation | beginning of flowering | MCPB | 1752 | |
| 11 | 5 March | 17 March | tillering | 4–6 leaves stage | bentazon | 960 |
| 12 | 5 March | 17 March | tillering | 4–6 leaves stage | MCPA | 750 |
| 13 | 5 March | 17 March | tillering | 4–6 leaves stage | MCPB | 1752 |
| 14 | 26 April | 23 April | stem elongation | beginning of flowering | bentazon | 960 |
| 15 | 26 April | 23 April | stem elongation | beginning of flowering | MCPA | 750 |
| 16 | 26 April | 23 April | stem elongation | beginning of flowering | MCPB | 1752 |
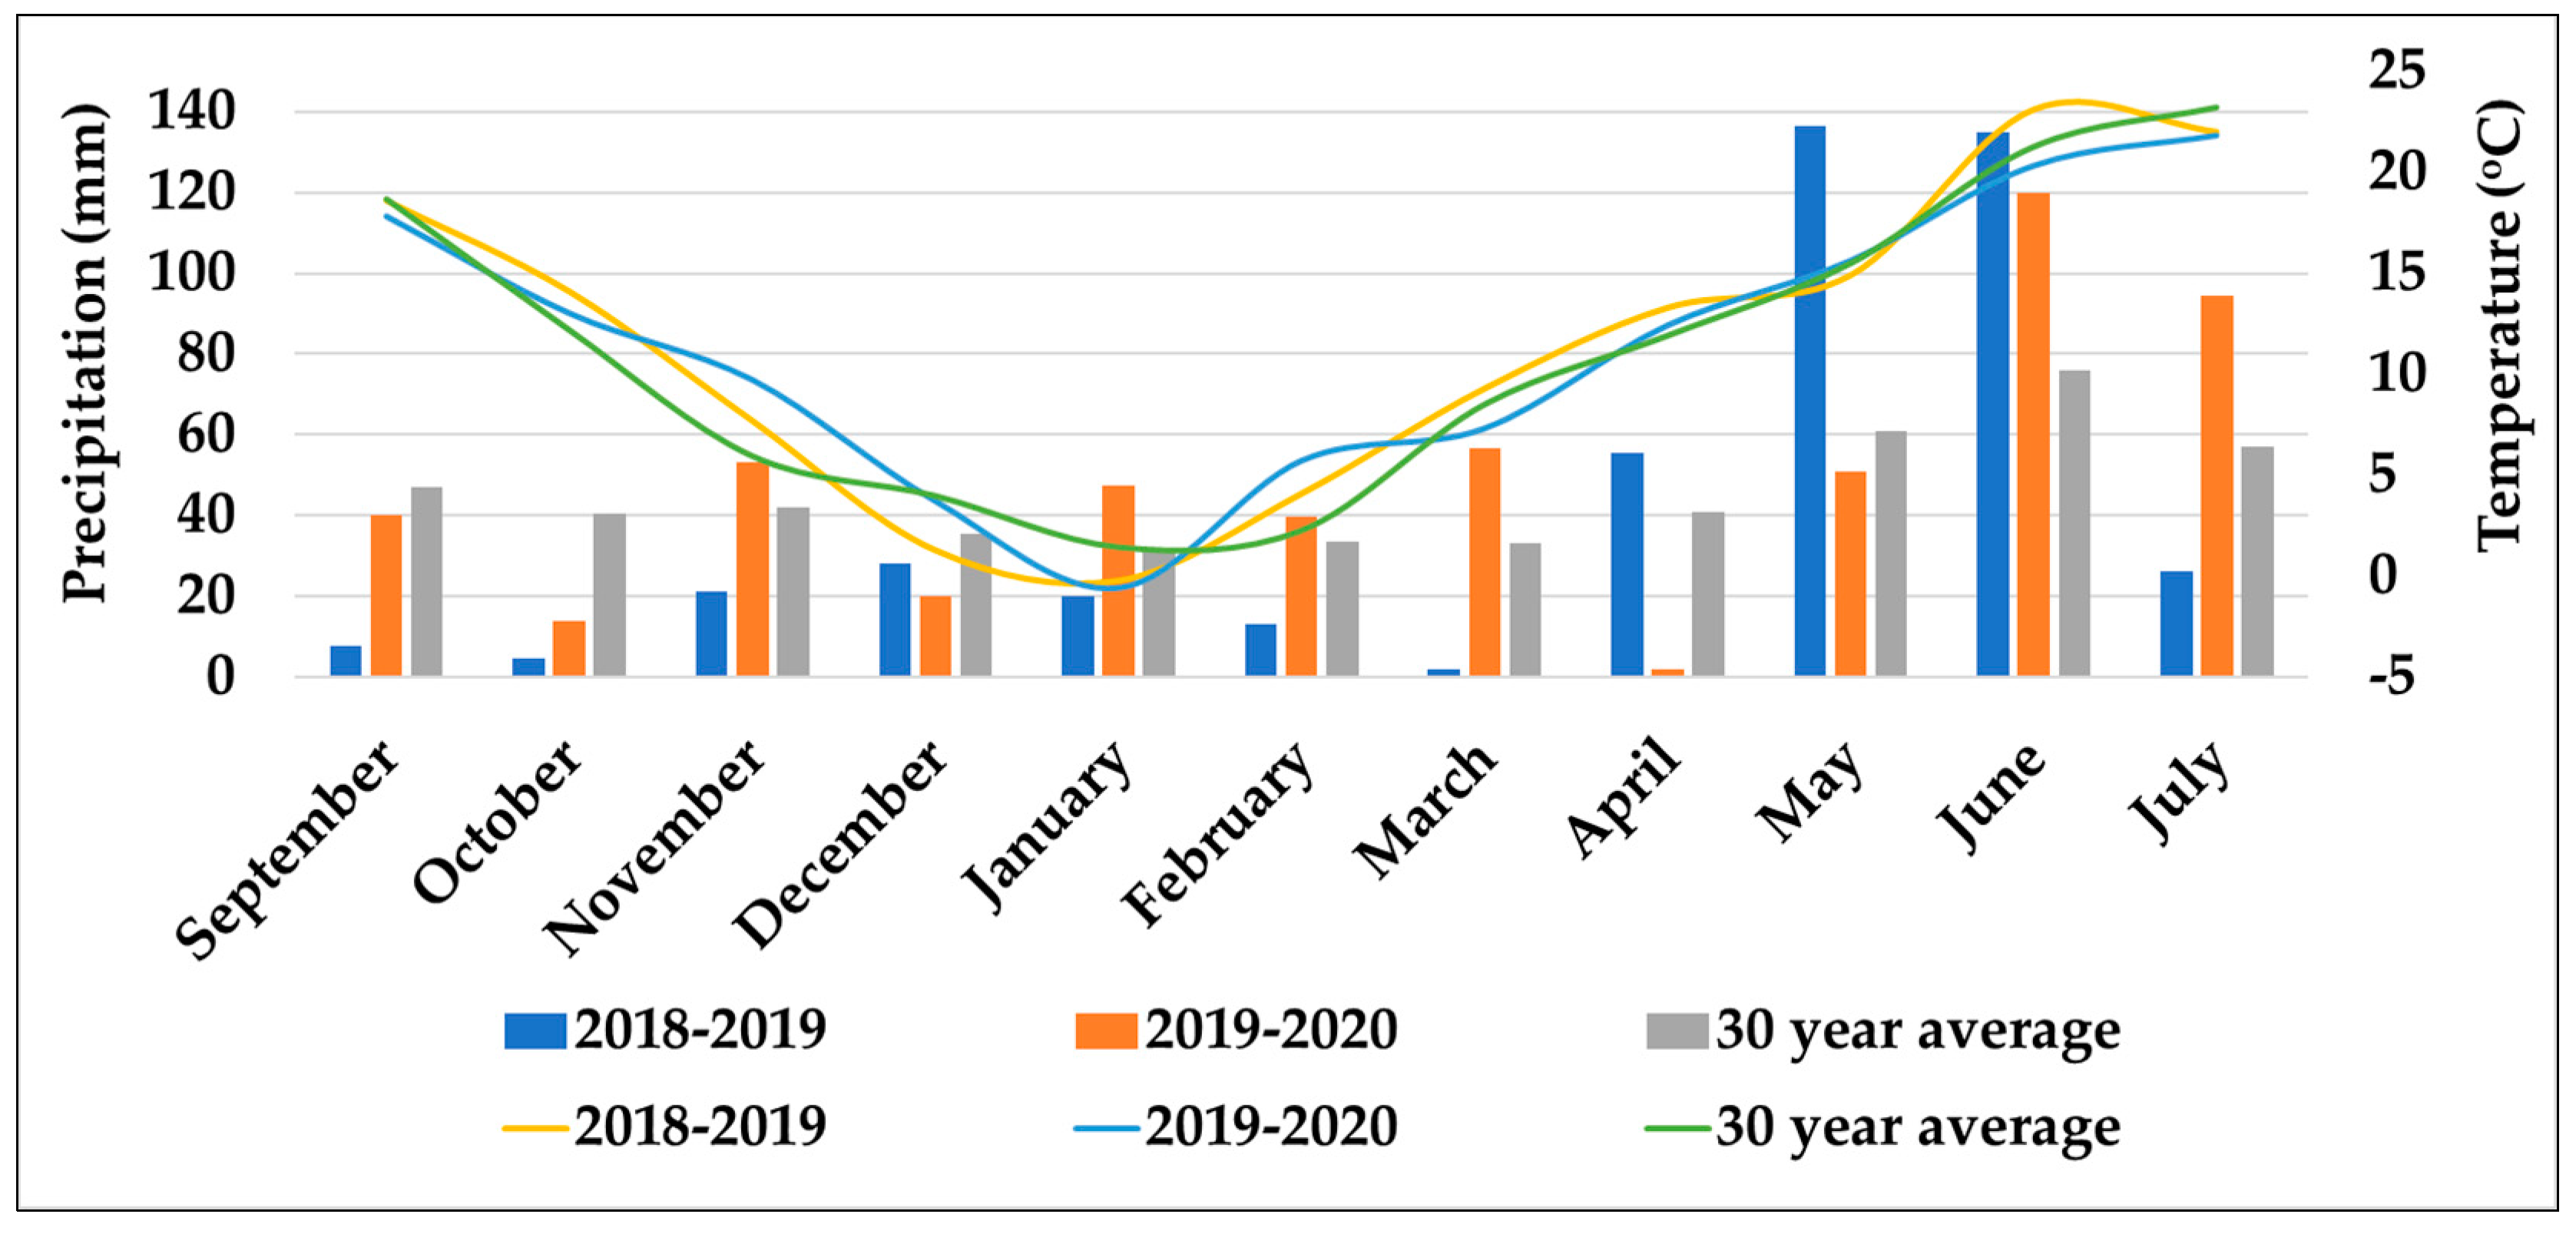
| Parameters | 2018–2019 | 2019–2020 | ||||
|---|---|---|---|---|---|---|
| 30 October | 5 March | 26 April | 18 October | 17 March | 23 April | |
| Temperature (°C) | 13.0 | 10.0 | 12.0 | 12.0 | 8.5 | 21.0 |
| Relative humidity (%) | 65.0 | 60.0 | 70.0 | 70.0 | 85.0 | 65.0 |
| Wind speed (m/s) | 2.0 | 3.0 | 5.0 | 3.0 | 3.0 | 4.0 |
| Cloud cover (%) | 30.0 | 20.0 | 50.0 | 50.0 | 30.0 | 40.0 |
| Precipitation (mm) 2 weeks before treatment | 4.7 | 0.0 | 15.0 | 24.0 | 39.5 | 2.0 |
| Precipitation (mm) 2 weeks after treatment | 6.0 | 12.0 | 28.4 | 18.0 | 11.0 | 19.0 |
| Weed Control Efficiency | |
|---|---|
| 98.1–100% | Excellent |
| 95.1–98% | Very good |
| 90.1–95% | Good |
| 82.1–90% | Acceptable |
| 70.1–82% | Uncertain |
| 50.1–70% | Weak |
| 30.1–50% | Extremely weak |
| 0.1–30% | Bad |
| 0% | Ineffective |
| English Name | Latin Name | EPPO Code | Winter Wheat 2018–2019 | Winter Wheat 2019–2020 | ||||||||||
|---|---|---|---|---|---|---|---|---|---|---|---|---|---|---|
| 15 November | 5 March | 19 March | 26 April | 10 May | 10 July | 8 November | 17 March | 31 March | 23 April | 8 May | 8 July | |||
| Ivy-leaved speedwell | Veronica hederifolia L. | VERHE | 0.10 | 1.00 | 3.00 | 4.00 | 0.00 | 0.00 | 0.10 | 2.50 | 5.00 | 7.00 | 3.00 | 0.00 |
| Common chickweed | Stellaria media (L.) Vill. | STEME | 0.10 | 1.00 | 1.75 | 1.00 | 0.80 | 0.00 | 0.20 | 2.50 | 4.00 | 1.00 | 0.20 | 0.00 |
| Shepherd’s purse | Capsella bursa-pastoris L. | CAPBP | 0.10 | 0.50 | 1.00 | 1.50 | 0.50 | 0.10 | 0.15 | 0.50 | 1.00 | 1.50 | 0.50 | 0.10 |
| Cleavers | Galium aparine L. | GALAP | 0.10 | 0.40 | 0.60 | 0.50 | 0.00 | 0.00 | 0.10 | 0.30 | 0.70 | 0.60 | 0.00 | 0.00 |
| Common poppy | Papaver rhoeas L. | PAPRH | 0.00 | 0.00 | 0.00 | 1.00 | 2.00 | 1.50 | 0.00 | 0.00 | 0.00 | 0.50 | 1.75 | 1.50 |
| Forking larkspur | Consolida regalis Gray | CNSRE | 0.00 | 0.00 | 0.20 | 1.00 | 1.50 | 0.00 | 0.00 | 0.00 | 0.20 | 1.00 | 1.50 | 0.00 |
| Schleicher’s fumitory | Fumaria schleicheri Soy.-Will. | FUMSC | 0.00 | 0.00 | 0.00 | 0.00 | 0.33 | 0.75 | 0.00 | 0.00 | 0.00 | 0.00 | 0.30 | 0.50 |
| Wild radish | Raphanus raphanistrum L. | RAPRA | 0.00 | 0.00 | 0.00 | 0.00 | 0.20 | 0.30 | 0.00 | 0.00 | 0.10 | 0.20 | 0.30 | 0.50 |
| Charlock | Sinapis arvensis L. | SINAR | 0.00 | 2.00 | 2.00 | 4.25 | 6.75 | 4.00 | 0.00 | 3.00 | 5.00 | 5.75 | 6.00 | 4.00 |
| Black bindweed | Fallopia convolvulus L. | POLCO | 0.00 | 0.00 | 0.00 | 0.00 | 0.40 | 0.50 | 0.00 | 0.00 | 0.00 | 0.00 | 0.50 | 0.70 |
| Common ragweed | Ambrosia artemisiifolia L. | AMBEL | 0.00 | 0.00 | 0.00 | 0.00 | 0.00 | 0.75 | 0.00 | 0.00 | 0.00 | 0.00 | 0.00 | 0.70 |
| Annual yellow woundwort | Stachys annua L. | STAAN | 0.00 | 0.00 | 0.00 | 0.00 | 0.20 | 0.30 | 0.00 | 0.00 | 0.00 | 0.00 | 0.20 | 0.30 |
| Fat hen | Chenopodium album L. | CHEAL | 0.00 | 0.00 | 0.00 | 0.00 | 0.30 | 0.50 | 0.00 | 0.00 | 0.00 | 0.10 | 0.50 | 0.75 |
| Johnsongrass | Sorghum halepense (L.) Pers. | SORHA | 0.00 | 0.00 | 0.00 | 0.00 | 0.00 | 1.00 | 0.00 | 0.00 | 0.00 | 0.00 | 0.00 | 1.00 |
| Field bindweed | Convolvulus arvensis L. | CONAR | 0.00 | 0.00 | 0.00 | 0.20 | 0.70 | 1.00 | 0.00 | 0.00 | 0.00 | 0.20 | 0.70 | 3.00 |
| Total | 0.40 | 4.90 | 8.55 | 13.45 | 13.68 | 10.70 | 0.55 | 8.80 | 16.00 | 17.85 | 15.45 | 13.05 | ||
| English Name | Latin Name | EPPO Code | Winter Pea 2018–2019 | Winter Pea 2019–2020 | ||||||||||
|---|---|---|---|---|---|---|---|---|---|---|---|---|---|---|
| 15 November | 5 March | 19 March | 26 April | 10 May | 10 July | 8 November | 17 March | 31 March | 23 April | 8 May | 8 July | |||
| Ivy-leaved speedwell | Veronica hederifolia L. | VERHE | 0.10 | 0.50 | 2.00 | 1.00 | 0.00 | 0.00 | 0.15 | 0.50 | 2.50 | 2.00 | 0.00 | 0.00 |
| Common chickweed | Stellaria media (L.) Vill. | STEME | 0.10 | 1.00 | 2.00 | 1.50 | 0.30 | 0.00 | 0.15 | 1.00 | 3.00 | 2.00 | 0.50 | 0.00 |
| Shepherd’s purse | Capsella bursa-pastoris L. | CAPBP | 0.10 | 0.50 | 1.00 | 1.50 | 0.50 | 0.10 | 0.15 | 0.50 | 1.00 | 1.50 | 0.50 | 0.10 |
| Cleavers | Galium aparine L. | GALAP | 0.00 | 0.30 | 0.86 | 0.50 | 0.00 | 0.00 | 0.10 | 0.30 | 0.86 | 0.50 | 0.00 | 0.00 |
| Common poppy | Papaver rhoeas L. | PAPRH | 0.10 | 0.30 | 0.50 | 1.00 | 2.75 | 2.00 | 0.10 | 0.50 | 0.80 | 1.50 | 3.00 | 2.00 |
| Forking larkspur | Consolida regalis Gray | CNSRE | 0.00 | 0.00 | 0.00 | 0.20 | 1.00 | 0.10 | 0.00 | 0.00 | 0.00 | 0.33 | 2.00 | 0.50 |
| Schleicher’s fumitory | Fumaria schleicheri Soy.-Will. | FUMSC | 0.00 | 0.00 | 0.00 | 0.00 | 0.50 | 0.70 | 0.00 | 0.00 | 0.00 | 0.00 | 0.50 | 1.00 |
| Wild radish | Raphanus raphanistrum L. | RAPRA | 0.00 | 0.00 | 0.00 | 0.00 | 0.35 | 0.50 | 0.00 | 0.00 | 0.00 | 0.00 | 0.45 | 1.00 |
| Charlock | Sinapis arvensis L. | SINAR | 0.00 | 3.00 | 3.86 | 7.00 | 10.00 | 5.00 | 0.00 | 3.00 | 3.86 | 8.75 | 11.00 | 4.00 |
| Black bindweed | Fallopia convolvulus L. | POLCO | 0.00 | 0.00 | 0.00 | 0.50 | 1.50 | 1.00 | 0.00 | 0.00 | 0.00 | 0.50 | 2.00 | 2.00 |
| Common ragweed | Ambrosia artemisiifolia L. | AMBEL | 0.00 | 0.00 | 0.00 | 0.00 | 0.00 | 1.00 | 0.00 | 0.00 | 0.00 | 0.00 | 0.00 | 3.00 |
| Annual yellow woundwort | Stachys annua L. | STAAN | 0.00 | 0.00 | 0.00 | 0.00 | 0.60 | 0.80 | 0.00 | 0.00 | 0.00 | 0.00 | 0.50 | 0.70 |
| Fat hen | Chenopodium album L. | CHEAL | 0.00 | 0.00 | 0.00 | 0.10 | 0.50 | 1.00 | 0.00 | 0.00 | 0.00 | 0.10 | 0.50 | 1.00 |
| Johnsongrass | Sorghum halepense (L.) Pers. | SORHA | 0.00 | 0.00 | 0.00 | 0.00 | 1.00 | 2.00 | 0.00 | 0.00 | 0.00 | 0.00 | 1.50 | 5.00 |
| Field bindweed | Convolvulus arvensis L. | CONAR | 0.00 | 0.00 | 0.00 | 0.50 | 1.00 | 2.00 | 0.00 | 0.00 | 0.00 | 0.50 | 2.00 | 3.00 |
| Total | 0.40 | 5.60 | 10.22 | 13.80 | 20.00 | 16.20 | 0.65 | 5.80 | 12.02 | 17.68 | 24.45 | 23.30 | ||
| English Name | Latin Name | EPPO Code | Wheat–Pea Association 2018/2019 | Wheat–Pea Association 2019/2020 | ||||||||||
|---|---|---|---|---|---|---|---|---|---|---|---|---|---|---|
| 15 November | 5 March | 19 March | 26 April | 10 May | 10 July | 8 November | 17 March | 31 March | 23 April | 8 May | 8 July | |||
| Ivy-leaved speedwell | Veronica hederifolia L. | VERHE | 0.15 | 0.50 | 1.00 | 0.50 | 0.00 | 0.00 | 0.20 | 0.60 | 1.50 | 0.50 | 0.00 | 0.00 |
| Common chickweed | Stellaria media (L.) Vill. | STEME | 0.10 | 1.00 | 1.75 | 1.00 | 0.20 | 0.00 | 0.10 | 1.00 | 1.50 | 1.00 | 0.30 | 0.00 |
| Shepherd’s purse | Capsella bursa-pastoris L. | CAPBP | 0.10 | 0.50 | 1.00 | 1.50 | 0.50 | 0.10 | 0.10 | 0.50 | 1.00 | 1.50 | 0.50 | 0.10 |
| Cleavers | Galium aparine L. | GALAP | 0.00 | 0.20 | 0.50 | 0.30 | 0.00 | 0.00 | 0.10 | 0.20 | 0.50 | 0.30 | 0.00 | 0.00 |
| Common poppy | Papaver rhoeas L. | PAPRH | 0.00 | 0.10 | 0.50 | 1.50 | 2.00 | 1.50 | 0.00 | 0.10 | 0.50 | 1.50 | 2.00 | 1.50 |
| Forking larkspur | Consolida regalis Gray | CNSRE | 0.00 | 0.00 | 0.10 | 0.70 | 1.00 | 1.00 | 0.00 | 0.00 | 0.10 | 0.70 | 1.75 | 1.00 |
| Schleicher’s fumitory | Fumaria schleicheri Soy.-Will. | FUMSC | 0.00 | 0.00 | 0.00 | 0.10 | 0.40 | 0.50 | 0.00 | 0.00 | 0.00 | 0.10 | 0.40 | 0.50 |
| Wild radish | Raphanus raphanistrum L. | RAPRA | 0.00 | 0.00 | 0.00 | 0.00 | 0.25 | 0.40 | 0.00 | 0.00 | 0.00 | 0.00 | 0.25 | 0.50 |
| Charlock | Sinapis arvensis L. | SINAR | 0.00 | 1.33 | 2.33 | 5.25 | 6.25 | 4.00 | 0.00 | 1.33 | 2.33 | 5.25 | 8.00 | 4.00 |
| Black bindweed | Fallopia convolvulus L. | POLCO | 0.00 | 0.00 | 0.00 | 0.10 | 0.20 | 0.00 | 0.00 | 0.00 | 0.00 | 0.10 | 0.20 | 0.00 |
| Common ragweed | Ambrosia artemisiifolia L. | AMBEL | 0.00 | 0.00 | 0.00 | 0.00 | 0.00 | 0.50 | 0.00 | 0.00 | 0.00 | 0.00 | 0.00 | 0.50 |
| Annual yellow woundwort | Stachys annua L. | STAAN | 0.00 | 0.00 | 0.00 | 0.00 | 0.50 | 0.60 | 0.00 | 0.00 | 0.00 | 0.00 | 0.50 | 0.60 |
| Fat hen | Chenopodium album L. | CHEAL | 0.00 | 0.00 | 0.00 | 0.00 | 0.75 | 0.75 | 0.00 | 0.00 | 0.00 | 0.00 | 0.75 | 1.00 |
| Johnsongrass | Sorghum halepense (L.) Pers. | SORHA | 0.00 | 0.00 | 0.00 | 0.00 | 0.00 | 0.00 | 0.00 | 0.00 | 0.00 | 0.00 | 0.00 | 0.00 |
| Field bindweed | Convolvulus arvensis L. | CONAR | 0.00 | 0.00 | 0.00 | 0.50 | 1.00 | 1.00 | 0.00 | 0.00 | 0.00 | 0.50 | 0.50 | 1.00 |
| Total | 0.35 | 3.63 | 7.18 | 11.45 | 13.05 | 10.35 | 0.50 | 3.73 | 7.43 | 11.45 | 15.15 | 10.70 | ||
| Treatment Number | Year | EPPO Code | |||||
|---|---|---|---|---|---|---|---|
| 2018–2019 | SINAR | PAPRH | VERHE | STEME | CAPBP | CONAR | |
| 4 | 15 November | - | - | 50.25 | 46.00 | 21.00 | - |
| 10 July | 0.00 | 0.00 | - | - | 60.00 | 0.00 | |
| 5 | 15 November | - | - | 50.00 | 46.50 | 22.50 | - |
| 19 March | 91.00 | 63.00 | 90.00 | 87.00 | 56.00 | - | |
| 10 July | 100.00 | 95.00 | - | - | 87.00 | 0.00 | |
| 6 | 15 November | - | - | 50.25 | 46.00 | 20.50 | - |
| 19 March | 90.00 | 92.00 | 25.00 | 50.00 | 92.00 | - | |
| 10 July | 95.00 | 97.00 | - | - | 100.00 | 0.00 | |
| 7 | 15 November | - | - | 49.75 | 45.75 | 20.75 | - |
| 19 March | 91.00 | 90.00 | 95.00 | 84.00 | 86.00 | - | |
| 10 July | 100.00 | 100.00 | - | - | 90.00 | 0.00 | |
| 8 | 15 November | - | - | 50.50 | 46.00 | 21.00 | - |
| 10 May | 90.00 | 65.00 | - | 83.00 | 52.00 | 52.00 | |
| 10 July | 100.00 | 98.00 | - | - | 82.00 | 45.00 | |
| 9 | 15 November | - | - | 49.50 | 45.75 | 23.50 | - |
| 10 May | 95.00 | 91.00 | - | 45.50 | 92.00 | 81.00 | |
| 10 July | 100.00 | 100.00 | - | - | 100.00 | 100.00 | |
| 10 | 15 November | - | - | 50.00 | 46.25 | 22.75 | - |
| 10 May | 97.00 | 93.00 | - | 85.00 | 87.00 | 81.00 | |
| 10 July | 100.00 | 98.00 | - | - | 92.00 | 78.00 | |
| 11 | 19 March | 92.00 | 67.00 | 90.00 | 85.00 | 56.00 | - |
| 10 July | 100.00 | 100.00 | - | - | 91.00 | 0.00 | |
| 12 | 19 March | 90.00 | 92.00 | 26.50 | 50.00 | 91.00 | - |
| 10 July | 100.00 | 98.00 | - | - | 100.00 | 0.00 | |
| 13 | 19 March | 95.00 | 94.00 | 95.00 | 87.00 | 83.00 | - |
| 10 July | 100.00 | 100.00 | - | - | 85.00 | 0.00 | |
| 14 | 10 May | 90.00 | 62.00 | - | 83.00 | 61.00 | 50.00 |
| 10 July | 100.00 | 90.00 | - | - | 87.00 | 40.00 | |
| 15 | 10 May | 94.50 | 92.00 | - | 46.00 | 93.00 | 87.00 |
| 10 July | 100.00 | 100.00 | - | - | 100.00 | 100.00 | |
| 16 | 10 May | 96.00 | 93.00 | - | 84.50 | 93.00 | 83.00 |
| 10 July | 100.00 | 100.00 | - | - | 95.00 | 80.00 | |
| Treatment Number | Year | EPPO Code | |||||
|---|---|---|---|---|---|---|---|
| 2019–2020 | SINAR | VERHE | STEME | PAPRH | CONAR | CAPBP | |
| 4 | 8 November | - | 65.00 | 51.50 | 82.00 | - | 25.50 |
| 8 July | 0.00 | - | - | 82.00 | 0.00 | 72.00 | |
| 5 | 8 November | - | 65.25 | 50.50 | 83.50 | - | 28.75 |
| 31 March | 92.00 | 93.00 | 83.00 | 61.00 | - | 55.00 | |
| 8 July | 100.00 | - | - | 90.00 | 0.00 | 86.00 | |
| 6 | 8 November | - | 64.75 | 52.00 | 80.75 | - | 25.50 |
| 31 March | 92.00 | 30.00 | 50.00 | 91.00 | - | 90.00 | |
| 8 July | 95.00 | - | - | 100.00 | 0.00 | 100.00 | |
| 7 | 8 November | - | 65.50 | 52.75 | 81.50 | - | 28.50 |
| 31 March | 95.00 | 97.00 | 83.00 | 92.00 | - | 94.00 | |
| 8 July | 100.00 | - | - | 100.00 | 0.00 | 97.00 | |
| 8 | 8 November | - | 63.75 | 50.50 | 81.00 | - | 25.75 |
| 8 May | 90.00 | 93.00 | 82.00 | 64.00 | 53.00 | 58.00 | |
| 8 July | 100.00 | - | - | 94.00 | 43.00 | 70.00 | |
| 9 | 8 November | - | 65.00 | 49.50 | 83.00 | - | 28.75 |
| 8 May | 95.00 | 32.50 | 45.00 | 92.00 | 82.50 | 93.00 | |
| 8 July | 100.00 | - | - | 100.00 | 100.00 | 100.00 | |
| 10 | 8 November | - | 65.50 | 50.50 | 83.00 | - | 29.00 |
| 8 May | 96.50 | 95.00 | 87.00 | 93.00 | 84.00 | 93.00 | |
| 8 July | 100.00 | - | - | 100.00 | 85.00 | 98.00 | |
| 11 | 31 March | 91.00 | 94.00 | 84.00 | 61.00 | - | 57.50 |
| 8 July | 100.00 | - | - | 95.00 | 0.00 | 80.00 | |
| 12 | 31 March | 92.00 | 27.00 | 50.00 | 90.00 | - | 92.00 |
| 8 July | 100.00 | - | - | 97.00 | 0.00 | 98.00 | |
| 13 | 31 March | 93.75 | 96.00 | 84.00 | 95.00 | - | 95.00 |
| 8 July | 100.00 | - | - | 100.00 | 0.00 | 99.00 | |
| 14 | 8 May | 92.00 | 90.00 | 85.00 | 63.00 | 52.00 | 58.75 |
| 8 July | 100.00 | - | - | 92.00 | 40.00 | 93.00 | |
| 15 | 8 May | 96.00 | 30.00 | 48.00 | 91.00 | 83.00 | 92.00 |
| 8 July | 100.00 | - | - | 100.00 | 80.00 | 97.00 | |
| 16 | 8 May | 92.25 | 96.00 | 84.75 | 93.00 | 86.00 | 93.00 |
| 8 July | 100.00 | - | - | 100.00 | 90.00 | 97.00 | |
| df | Plant Number | Shoot Number | Ear Number | Spikelet Number | Grain Number | Grain Weight | |
|---|---|---|---|---|---|---|---|
| Repeat | 3 | ||||||
| Corrected model | 29 | 86.226 *** | 26,119.047 *** | 13,249.454 *** | 3,330,609.868 *** | 2,757,015.267 *** | 5304.925 *** |
| Intercept | 1 | 9,613,510.208 *** | 44,999,152.13 *** | 27,823,959.07 *** | 5450058432 *** | 1.599 × 10¹⁰ *** | 27,789,704.31 *** |
| Treatment | 14 | 141.815 *** | 341.151 *** | 5298.075 *** | 1,133,855.754 *** | 4,656,496.312 *** | 8560.761 *** |
| Growing season | 1 | 304.008 *** | 746,709.633 *** | 267,246.408 *** | 73,788,515.01 *** | 9,768,101.408 *** | 17,374.689 *** |
| Treatment × Growing season | 14 | 15.080 ns | 426.187 *** | 3058.194 *** | 494,656.473 *** | 356,742.355 *** | 1186.963 ** |
| Error | 90 | 25.914 | 9.728 | 37.775 | 3181.408 | 33,207.281 | 511.186 |
| Total | 120 |
| df | Plant Number | Shoot Number | Pod Number | Seed Number | Seed Weight | |
|---|---|---|---|---|---|---|
| Repeat | 3 | |||||
| Corrected model | 29 | 8.727 *** | 8.132 ** | 11,761.386 *** | 276,874.232 *** | 5825.458 *** |
| Intercept | 1 | 246,522.675 *** | 271,986.408 *** | 12,523,356.30 *** | 90,826,260.01 *** | 1,109,922.976 *** |
| Treatment | 14 | 13.979 *** | 11.855 *** | 516.407 *** | 7993.776 *** | 307.454 *** |
| Growing season | 1 | 31.008 ** | 31.008 ** | 333,064.033 *** | 7,851,525.208 *** | 161,965.351 *** |
| Treatment × Growing season | 14 | 1.883 ns | 2.776 ns | 56.176 ns | 4708.190 *** | 190.612 *** |
| Error | 90 | 3.658 | 4.164 | 32.394 | 242.447 | 11.907 |
| Total | 120 |
| Average of Two Years | ||||||
|---|---|---|---|---|---|---|
| Treatment Number | Plant Number (A) (pcs/m2) | Shoot Number (B) (pcs/m2) | Ear Number (C) (pcs/m2) | Spikelet Number (D) (pcs/m2) | Grain Number (E) (pcs/m2) | Grain Weight (F) (g/m2) |
| 1 | 284.88 bcde | 628.88 i | 539.88 j | 7934.38 f | 13,600.00 i | 577.75 g |
| 3 | 282.75 bcd | 611.00 def | 443.13 a | 6462.13 a | 10,790.75 a | 445.75 a |
| 4 | 280.50 b | 608.75 cd | 449.50 b | 6903.13 e | 11,021.38 bcd | 450.25 ab |
| 5 | 279.88 b | 610.50 de | 495.00 g | 6900.38 e | 12,238.50 h | 498.17 ef |
| 6 | 285.88 cde | 609.88 de | 511.75 i | 6887.25 e | 12,141.38 h | 512.09 f |
| 7 | 285.88 cde | 614.13 g | 502.00 h | 6912.75 e | 12,201.00 h | 490.72 def |
| 8 | 272.75 a | 601.50 a | 482.75 de | 6711.13 d | 11,672.13 fg | 479.28 cde |
| 9 | 289.13 e | 604.88 b | 484.38 de | 6701.50 d | 11,785.13 g | 489.56 de |
| 10 | 282.25 bc | 606.50 bc | 489.13 fg | 6684.00 d | 11,591.75 ef | 478.72 cde |
| 11 | 287.63 de | 621.25 h | 481.00 d | 6591.13 c | 11,120.63 de | 470.81 bcd |
| 12 | 281.25 bc | 613.75 fg | 482.00 d | 6529.75 b | 11,091.13 cd | 478.72 cde |
| 13 | 288.88 e | 613.75 fg | 488.50 ef | 6468.13 a | 11,145.00 de | 477.50 cde |
| 14 | 280.88 bc | 614.25 g | 463.50 c | 6438.38 a | 10,860.88 abc | 452.20 ab |
| 15 | 280.75 b | 613.63 fg | 458.63 c | 6541.38 bc | 10,973.75 bcd | 462.20 abc |
| 16 | 282.38 bc | 612.88 efg | 451.75 b | 6423.00 a | 10,913.00 abc | 454.70 ab |
| Year | Plant Number (A) (pcs/m2) | Shoot Number (B) (pcs/m2) | Ear Number (C) (pcs/m2) | Spikelet Number (D) (pcs/m2) | Grain Number (E) (pcs/m2) | Grain Weight (F) (g/m2) |
|---|---|---|---|---|---|---|
| 2018/2019 | 281.45 a | 533.48 a | 434.33 a | 5955.07 a | 11257.78 a | 469.20 a |
| 2019/2020 | 284.63 b | 691.25 b | 528.72 b | 7523.38 b | 11828.40 b | 493.26 b |
| Average of Two Years | |||||
|---|---|---|---|---|---|
| Treatment Number | Plant Number (G) (pcs/m2) | Shoot Number (H) (pcs/m2) | Pod Number (I) (pcs/m2) | Grain Number (J) (pcs/m2) | Grain Weight (K) (g/m2) |
| 2 | 49.88 b | 51.50 c | 343.75 f | 938.88 i | 113.91 i |
| 3 | 45.25 a | 47.50 ab | 315.25 a | 827.88 a | 88.90 a |
| 4 | 44.13 a | 45.75 a | 317.13 ab | 843.38 bc | 89.35 a |
| 5 | 45.38 a | 47.63 ab | 333.25 e | 905.75 h | 101.95 h |
| 6 | 45.13 a | 47.63 ab | 324.75 d | 893.25 fgh | 99.21 h |
| 7 | 45.63 a | 48.50 b | 332.88 e | 901.75 gh | 99.38 h |
| 8 | 45.13 a | 46.88 ab | 325.38 d | 889.75 fg | 96.26 efgh |
| 9 | 45.38 a | 47.38 ab | 322.75 bcd | 865.63 e | 98.09 gh |
| 10 | 45.00 a | 47.50 ab | 323.13 cd | 867.00 e | 96.81 fgh |
| 11 | 44.38 a | 47.13 ab | 320.13 abcd | 884.88 f | 93.28 cd |
| 12 | 44.75 a | 47.63 ab | 317.63 a | 850.00 cd | 94.65 def |
| 13 | 45.00 a | 47.25 ab | 318.88 abc | 862.25 de | 94.87 defg |
| 14 | 45.38 a | 47.13 ab | 317.25 ab | 847.38 cd | 92.26 abcd |
| 15 | 44.63 a | 47.50 ab | 315.50 a | 832.88 ab | 92.81 bcd |
| 16 | 44.88 a | 47.25 ab | 318.13 abc | 839.25 abc | 90.87 abc |
| Year | Plant Number (G) (pcs/m2) | Shoot Number (H) (pcs/m2) | Pod Number (I) (pcs/m2) | Grain Number (J) (pcs/m2) | Grain Weight (K) (g/m2) |
|---|---|---|---|---|---|
| 2018–2019 | 45.83 b | 48.12 b | 375.73 b | 1125.78 b | 132.91 b |
| 2019–2020 | 44.82 a | 47.10 a | 270.37 a | 614.20 a | 59.44 a |
Publisher’s Note: MDPI stays neutral with regard to jurisdictional claims in published maps and institutional affiliations. |
© 2022 by the authors. Licensee MDPI, Basel, Switzerland. This article is an open access article distributed under the terms and conditions of the Creative Commons Attribution (CC BY) license (https://creativecommons.org/licenses/by/4.0/).
Share and Cite
Kristó, I.; Vályi-Nagy, M.; Rácz, A.; Tar, M.; Irmes, K.; Szentpéteri, L.; Ujj, A. Effects of Weed Control Treatments on Weed Composition and Yield Components of Winter Wheat (Triticum aestivum L.) and Winter Pea (Pisum sativum L.) Intercrops. Agronomy 2022, 12, 2590. https://doi.org/10.3390/agronomy12102590
Kristó I, Vályi-Nagy M, Rácz A, Tar M, Irmes K, Szentpéteri L, Ujj A. Effects of Weed Control Treatments on Weed Composition and Yield Components of Winter Wheat (Triticum aestivum L.) and Winter Pea (Pisum sativum L.) Intercrops. Agronomy. 2022; 12(10):2590. https://doi.org/10.3390/agronomy12102590
Chicago/Turabian StyleKristó, István, Marianna Vályi-Nagy, Attila Rácz, Melinda Tar, Katalin Irmes, Lajos Szentpéteri, and Apolka Ujj. 2022. "Effects of Weed Control Treatments on Weed Composition and Yield Components of Winter Wheat (Triticum aestivum L.) and Winter Pea (Pisum sativum L.) Intercrops" Agronomy 12, no. 10: 2590. https://doi.org/10.3390/agronomy12102590
APA StyleKristó, I., Vályi-Nagy, M., Rácz, A., Tar, M., Irmes, K., Szentpéteri, L., & Ujj, A. (2022). Effects of Weed Control Treatments on Weed Composition and Yield Components of Winter Wheat (Triticum aestivum L.) and Winter Pea (Pisum sativum L.) Intercrops. Agronomy, 12(10), 2590. https://doi.org/10.3390/agronomy12102590