Article

Diversity in Acidity between Core and Pulp of Asian Pear Fruit Is Mainly Regulated by the Collaborative Activity of PH8.1 and DIC2 Genes during Fruit Development

Key Laboratory of Horticultural Plant Biology, College of Horticulture & Forestry Sciences, Huazhong Agricultural University, Wuhan 430070, China
*
Author to whom correspondence should be addressed.
Agronomy 2022, 12(8), 1966; https://doi.org/10.3390/agronomy12081966
Submission received: 26 July 2022 / Revised: 12 August 2022 / Accepted: 19 August 2022 / Published: 20 August 2022
(This article belongs to the Special Issue Omics Approaches and Applications in Fruit Crops Improvement)

Abstract

:
The pear (Pyrus pyrifolia) is an important accessory fruit in which the pear core is tarter than the pear pulp. However, the reason for the acidic core and diversity in the taste of the same fruit is not clear. In this study, we observed that the citrate contents were three times higher in the core than in the pulp, while the malate content decreased along with fruit development and was significantly lower in the core than in the pulp at 110 days after flowering. Overall transcript levels for citrate-malate synthesis-related genes increased more in the pear core than the pulp at early fruit development, while degradation-related genes activity was nearly similar or non-significant between the core and pulp during fruit development. The lesser malate accumulation in the pear core compared to the pulp at 110 DAF was possibly due to the reduced activity of tDT2 gene. Regarding citrate accumulation, we identified five important p-type H+-ATPase genes in pear and found that the relative expression level of the PH8.1 gene was four-fold higher in the core than in the pulp during fruit development. Moreover, the expression level of di-carboxylate carrier gene 2 (DIC2) was constantly and significantly higher in the core than in the pulp. In addition, correlation analysis signified that the transcript levels of the two genes PH8.1 and DIC2 positively and significantly correlated with the citrate contents. These results suggested that the increased and collaborative activity of PH8.1 and DIC2 played a key role in the higher citrate accumulation in the core than the pulp, thus, with the help of molecular breeding tools, the citrate contents can be optimized in pear fruit for divers and improved fruit flavoring.

1. Introduction

Pear is a famous fruit throughout the world due to its sweet and juicy flavoring, comprised of a combination of higher total sugars and lesser acid contents. Meanwhile, variation in the sugar/acid composition greatly affects the sensory traits of fruits [1]. Among the organic acids, the accumulation of citrate, malate, and tartrate is the main reason for fruit sourness or tartness, but the sensation gets more intense with citrate [2]. On the other hand, the tarter taste of the fruit is normally less acceptable to consumers [3,4]. Except for the direct association with fruit taste, organic acids are also important substrates for the production of amino acids, aromatic compounds, and carotenoids; they are also linked with several cell regulatory processes such as redox balance, ATP metabolism, and the acidification of extracellular spaces [4,5].
In recent decades, several studies were undertaken to better understand the organic acid regulation amongst different species of pear [6,7,8,9,10,11]. Malic acid is identified as a predominant organic acid in Chinese sand pear (Pyrus pyrifolia) and most pear species [9,12]. It can be synthesized by malate synthase (MS) and cytosolic malate dehydrogenase (cMDH); moreover, cMDH effectively controls the cellular malic acid metabolism by catalyzing the reversible reaction between malate and oxaloacetate (OAA) in apple [13]. On the other hand, malate can be degraded by malate dehydrogenase (MDH) and the NAD-dependent malic enzyme (ME) [13]. The transportation of additional malate from the cytosol into the cell vacuole is an important step to maintain the cytosolic pH and prevent cellular damage, which is possibly controlled by two key genes named aluminum-activated malate transporter 9 (ALMT9) and tonoplast di-carboxylate transporter (tDT) in grapes, apples, and tomatoes [14,15,16]. Additionally, di-carboxylate transporter (DIT) is homologous to chloroplastic 2-oxoglutarate/malate transporter (OMT1) and is an important malate valve regulator to maintain redox balance and nitrogen assimilation in plant cells [17,18].
Citric acid is the second major organic acid found in pears, and it is the main product of the tricarboxylic acid (TCA) cycle which can be catalyzed from acetyl-CoA and OAA by the citrate synthase (CS) enzyme [19]; synthesized citrate can be further catabolized into isocitrate to continue the TCA cycle by mitochondrial aconitase (miACO) or moved to the cytosol by the mitochondrial di-carboxylate carrier 2 (DIC2) protein [20]. In the cytosol, citrate can be utilized by ATP-citrate lyase (ACL) [21] and cytosolic aconitase (cyACO) [22], or be transported to the vacuole mainly by a plasma membrane proton pump for storage [23,24]. Moreover, the plasma membrane-type H+-ATPase (P-type ATPase) gene family has been widely studied for its special role in vacuolar acidification and key genes were identified in different species to regulate organic acids in the cell vacuole, such as petunia PhPH5 [25], apple MdMa10 [26], pear PbPH5 [6], citrus CsPH8 [24], and CitPH5 [23].
Pear fruit (pome) is also called an accessory fruit, the fruit core is developed from the floral ovary while the flesh/pulp is developed from adjacent tissues of the receptacle [27,28]. Interestingly, sensory analysis at full maturity showed that the pear core has a significantly tarter taste than the pear pulp. Although organic acid regulation was broadly studied among different fruit species and cultivars [8,21,29], the knowledge of organic acid regulation within individual fruit such as accessory fruits (pear core and pear pulp) is still limited. We compared the citrate and malate profiles between the core and pulp of pear during fruit development, as well as the transcript activity of synthesis-, degradation-, and transportation-related genes. These results indicated that the higher acidity in the pear core than the pulp is due to the high accumulation of citrate, which is mainly decided by the increasing transcript levels of PH8.1 and DIC2.

2. Materials and Methods

2.1. Plant Material

Four uniform and healthy pear trees (Pyrus pyrifolia cv. Fengshui) were selected for fruit collection, located at Huazhong Agricultural University, Wuhan, China. Cultural practices for trees were conventional as the local management to maintain plant health. The tree height was 210 ± 15 cm and the tree canopy diameter was 185 ± 20 cm of the experimental pear plants. The flowering time starts around mid-to-late March and fruit matures around early July, according to Wuhan environmental conditions. A total of five uniform fruits at 60, 85, and 110 days after flowering (DAF), respectively, were collected from each tree in clear sunny days around 09:00. The tissues of pear core and pulp from each tree fruits were separately collected, mixed, and ground into powder using liquid nitrogen and stored at −80 °C for further analysis.

2.2. Fruit Physical, TSS, and TA Evaluation

Fruit length, width, and weight were measured by using vernier caliper and weighing machine, respectively. At ripening, average fruit weight was noticed as 324.6 ± 8.63 g, while horizontal and vertical measurements were 6.89 ± 0.27 cm and 5.83 ± 0.19 cm, respectively. For the collection of juice from pear core and pulp, tissue of core or pulp was squeezed with the help of a motor and pestle, then raw juice was collected in a 50 mL tube and centrifuged at 3000 rpm for 5 min. The clear juice supernatant was used for analyzing total soluble solids (TSS °Brix) with a pocket refractometer PAL-1, and titratable acidity (TA %) of juice was calculated by titration with sodium hydroxide (NaOH, 0.1 M) and phenolphthalein (1%) as a pH indicator.

2.3. Organic Acid Determination

Organic acid contents of fruit core and pulp tissues were analyzed by gas chromatograph-mass spectrometry (GC-MS), as described previously [30]. Three grams of fruit tissues were used for metabolite extraction which was analyzed with an Agilent 7890B gas chromatograph (Agilent Technologies, Santa Clara, CA, USA) equipped with a flame ionization detector and a non-polar HP-5MS phenylmethyl-siloxane column (30.0 m × 0.32 mm, 0.25 μm). Three independent extractions were performed for each sample.

2.4. Candidate Genes Selection and Sequence Analysis

The respective sequences of citrate accumulation-related genes were queried and confirmed from Orange Genome Annotation Project, Huazhong Agricultural University (http://citrus.hzau.edu.cn/) (accessed on 15 November 2021), while the respective sequences of malate accumulation-related genes were queried and confirmed from Genome Database for Rosacea (GDR) (https://www.rosaceae.org/) (accessed on 16 November 2021). The acquired sequences were then identified in pear by utilizing Nucleotide to Nucleotide BLAST (blastn) tools from a pear genome database accessible at GDR (https://www.rosaceae.org/blast/) (accessed on 20 November 2021) with default parameters and filter criteria, while Pyrus pyrifolia genome v1.0 transcript was selected as target sequence search species, and transcripts with the highest similarity were selected for analysis. Gene-specific primers and actin gene primers (Table S1) were designed by primer premier 5.0 (Premier Biosoft Company, Palo Alto, CA, USA) based on the queried genomic sequences.

2.5. Phylogenetic Analysis of P3A-ATPases Genes in Pear

Phylogenetic analyses were conducted by utilizing the computer program Molecular Evolutionary Genetics Analysis X (MEGA-X v10.2.2, Mega Limited, Auckland, New Zealand) [31]. Alignment of polypeptide coding sequences was completed with Multiple Sequence Comparison by Log-Expectation (MUSCLE) algorithm by using default parameters in MEGA-X, and the phylogenetic tree was then constructed by the neighbor-joining (NJ) bootstrap method (1000 replicates) with a p-distance and pairwise deletion using MEGA-X.

2.6. RNA Extraction and RT-qPCR

RNA isolation from the core and pulp of pear fruit was conducted by following the 2XCTAB method described by Chang et al. [32]. RNA quality was estimated by NanoDropTM 2000 (Thermo Fisher Scientific, Waltham, MA, USA) and 1 μg of high-quality RNA was taken for first-strand cDNA synthesis using a Transcript one-step gDNA removal super-mix (TransGen Biotech, Beijing, China). A total of 10 μL of reaction volume was created to perform RT-qPCR by following the manufacturer’s protocol with SYBR Premix Ex Taq (TaKaRa, Beijing, China) on a RT-qPCR system QuanStudio7 (Thermo Fisher Scientific, USA). Four technical replicates were used for each sample and arranged on a 384-well plate. The reactions were started with an initial incubation at 50 °C for 2 min, followed by 95 °C for 5 min, and then were subjected to 40 cycles of 95 °C for 10 s, 60 °C for 20 s, and 72 °C for 20 s. All RT-qPCRs were normalized using the Ct value corresponding to actin. Relative expression values were calculated using the 2−ΔΔCt method [33]. A heat map for relative expression was generated by using TBtools software (v1.098745) (South China Agricultural University, Guangdong, China) [34].

2.7. Statistical Analysis

The statistical software Statistix 8.1 (v8.1) (Analytical Software, Inc., Tallahassee, FL, USA) was used for data evaluation and significant differences among different experimental variables were found by All-Pairwise Comparisons Tukey’s HSD test at a significant difference p < 0.05. Excel (Microsoft Corp., Redmond, WA, USA) was used for finding the standard error and mean values. The Pearson correlation was calculated by using jamovi (v2.2.5) software (The jamovi project, retrieved from https://www.jamovi.org (accessed on 30 June 2022)) [35].

3. Results

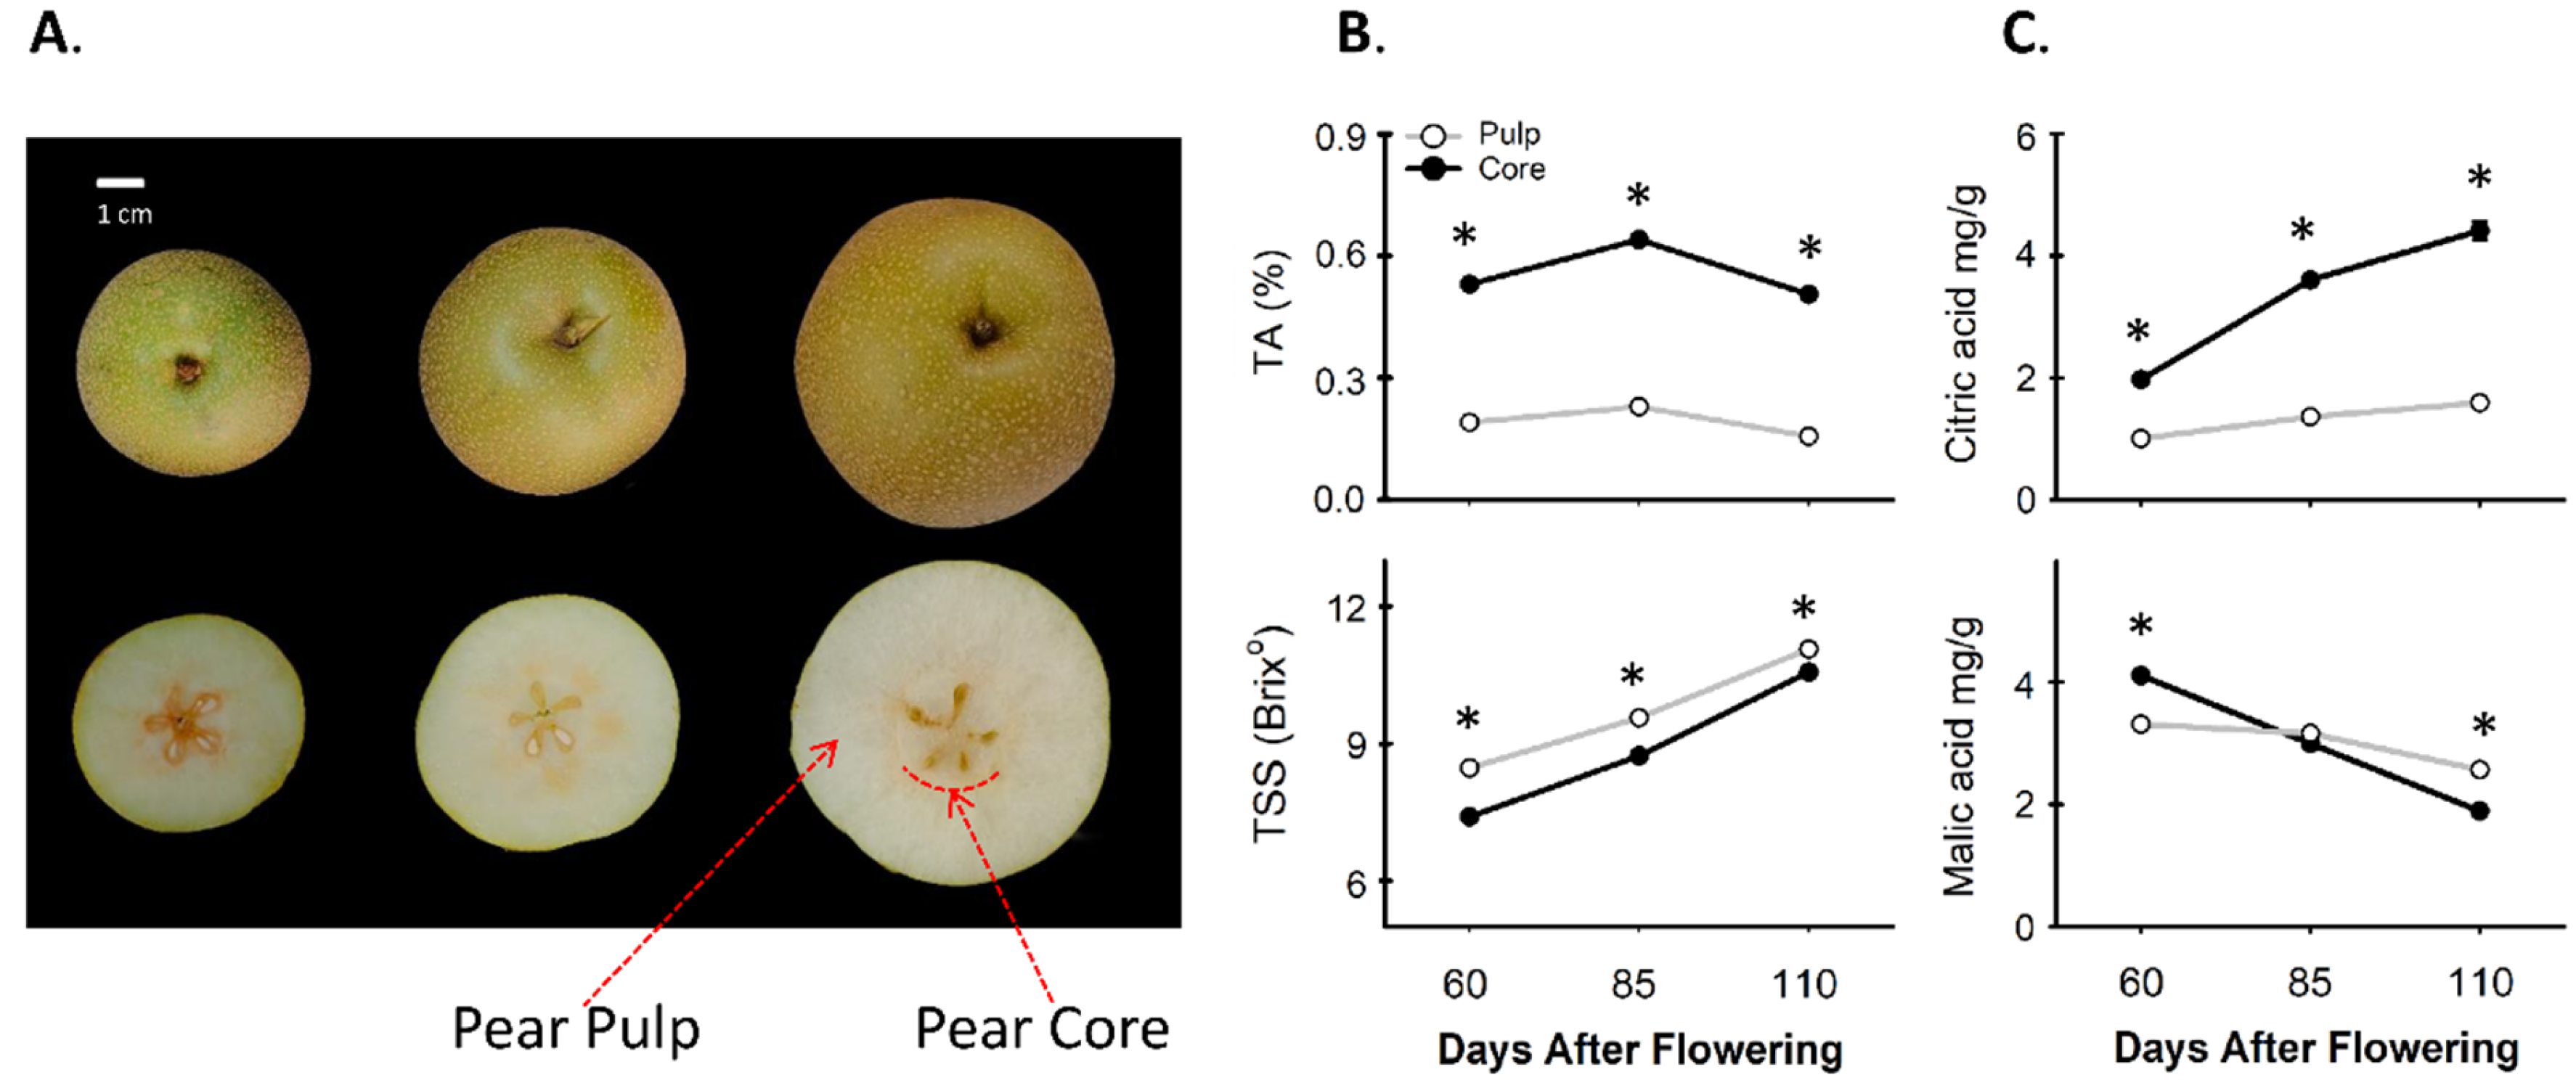
3.1. Comparing the Contents of Total Soluble Solids and Organic Acids between Pear Core and Pulp

Pear fruit of three developmental stages, specifically at 60, 85, and 110 DAF, were selected for initial quality comparison and Physico-chemical analysis between the core and pulp. The phenotypic traits of the fruit and separation of the core and pulp were shown in Figure 1A. The titratable acidity (TA %) in the core of the pear was always 3-folds higher than the fruit pulp and calculated as 0.5% for the core and 0.15% for the pulp at 110 DAF, while the total soluble solids (TSS) were witnessed to be lower in the core (10.5 °Brix) than in the pulp (11.1 °Brix) (Figure 1B).
In addition, the accumulation trend of citrate and malate was observed between the pear core and pulp. In the core, citrate increased significantly from 1.9 mg/g (60 DAF) to 4.4 mg/g (110 DAF), while in the pulp, citrate increased slightly from 1.0 mg/g (60 DAF) to 1.5 mg/g (110 DAF) during fruit development (Figure 1C). The accumulated citrate content in the core was always significantly higher than that in the pulp and it was three-fold higher at 110 DAF than that in the pulp. In addition, the malic acid content decreased along with fruit development in both the pear core and pulp; however, at 60 DAF the malate content in the core (4.2 mg/g) was noticed to be significantly higher than that in the pulp (3.3 mg/g), while at 110 DAF, it was slightly lower in core (2 mg/g) than that in the pulp (2.5 mg/g) (Figure 1C).

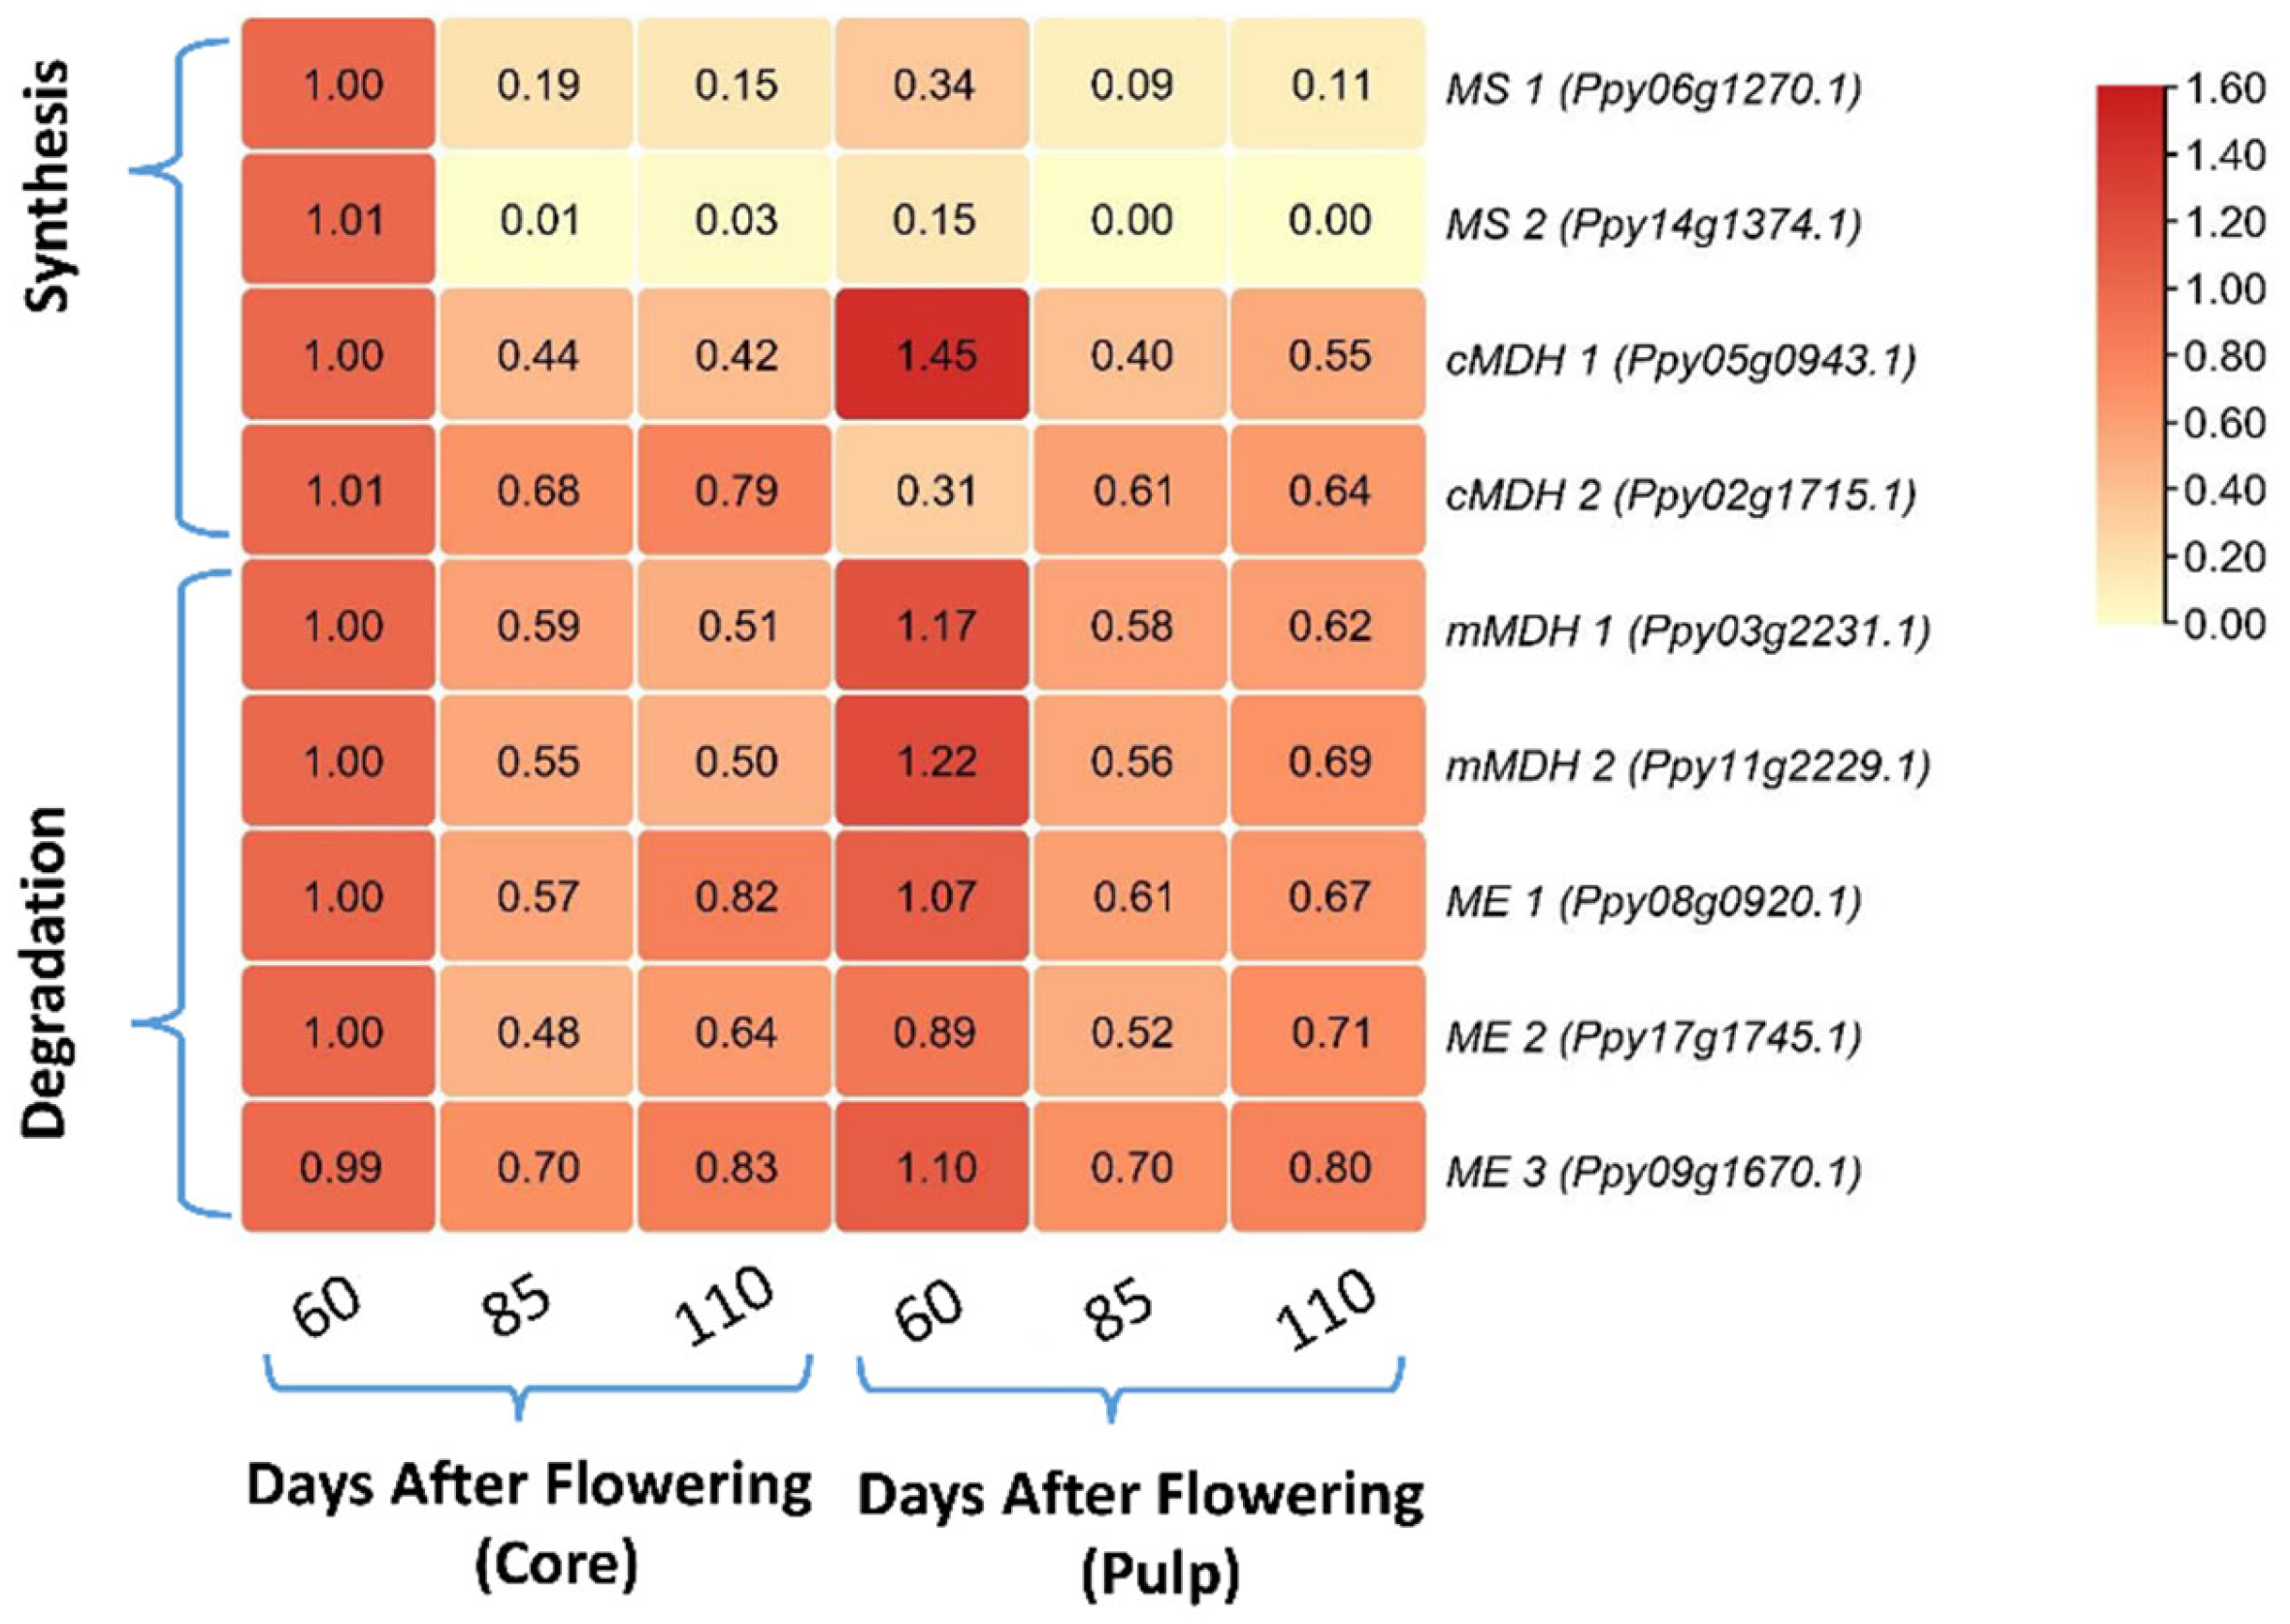
3.2. Comparing the Relative mRNA Levels of Malate Synthesis- and Degradation-Related Genes between Core and Pulp

Relative mRNA levels of malate synthesis- and degradation-related genes were assessed in the core and pulp of pear during fruit development by qPCR analysis and shown as a heat map in Figure 2. We observed that the expression levels of the synthesis-related genes MS1 and cMDH2 were 3-fold higher and MS2 was 6.7-fold higher in the core than in the pulp at 60 DAF, while at 85 and 110 DAF, no significant difference was observed between the pear core and pulp; cMDH1 showed a 1.5-fold lower expression in the core than the pulp at 60 DAF, with no significant difference at 85 and 110 DAF between them. In addition, degradation-related genes mMDH1 and mMDH2 showed a relatively lower expression in the core than in the pulp at 60 and 110 DAF, with no significant difference at 85 DAF between the pear core and pulp. Additionally, relative transcript levels of ME1, ME2, and ME3 did not show any significant difference between the pear core and pulp during fruit development (Figure 2).

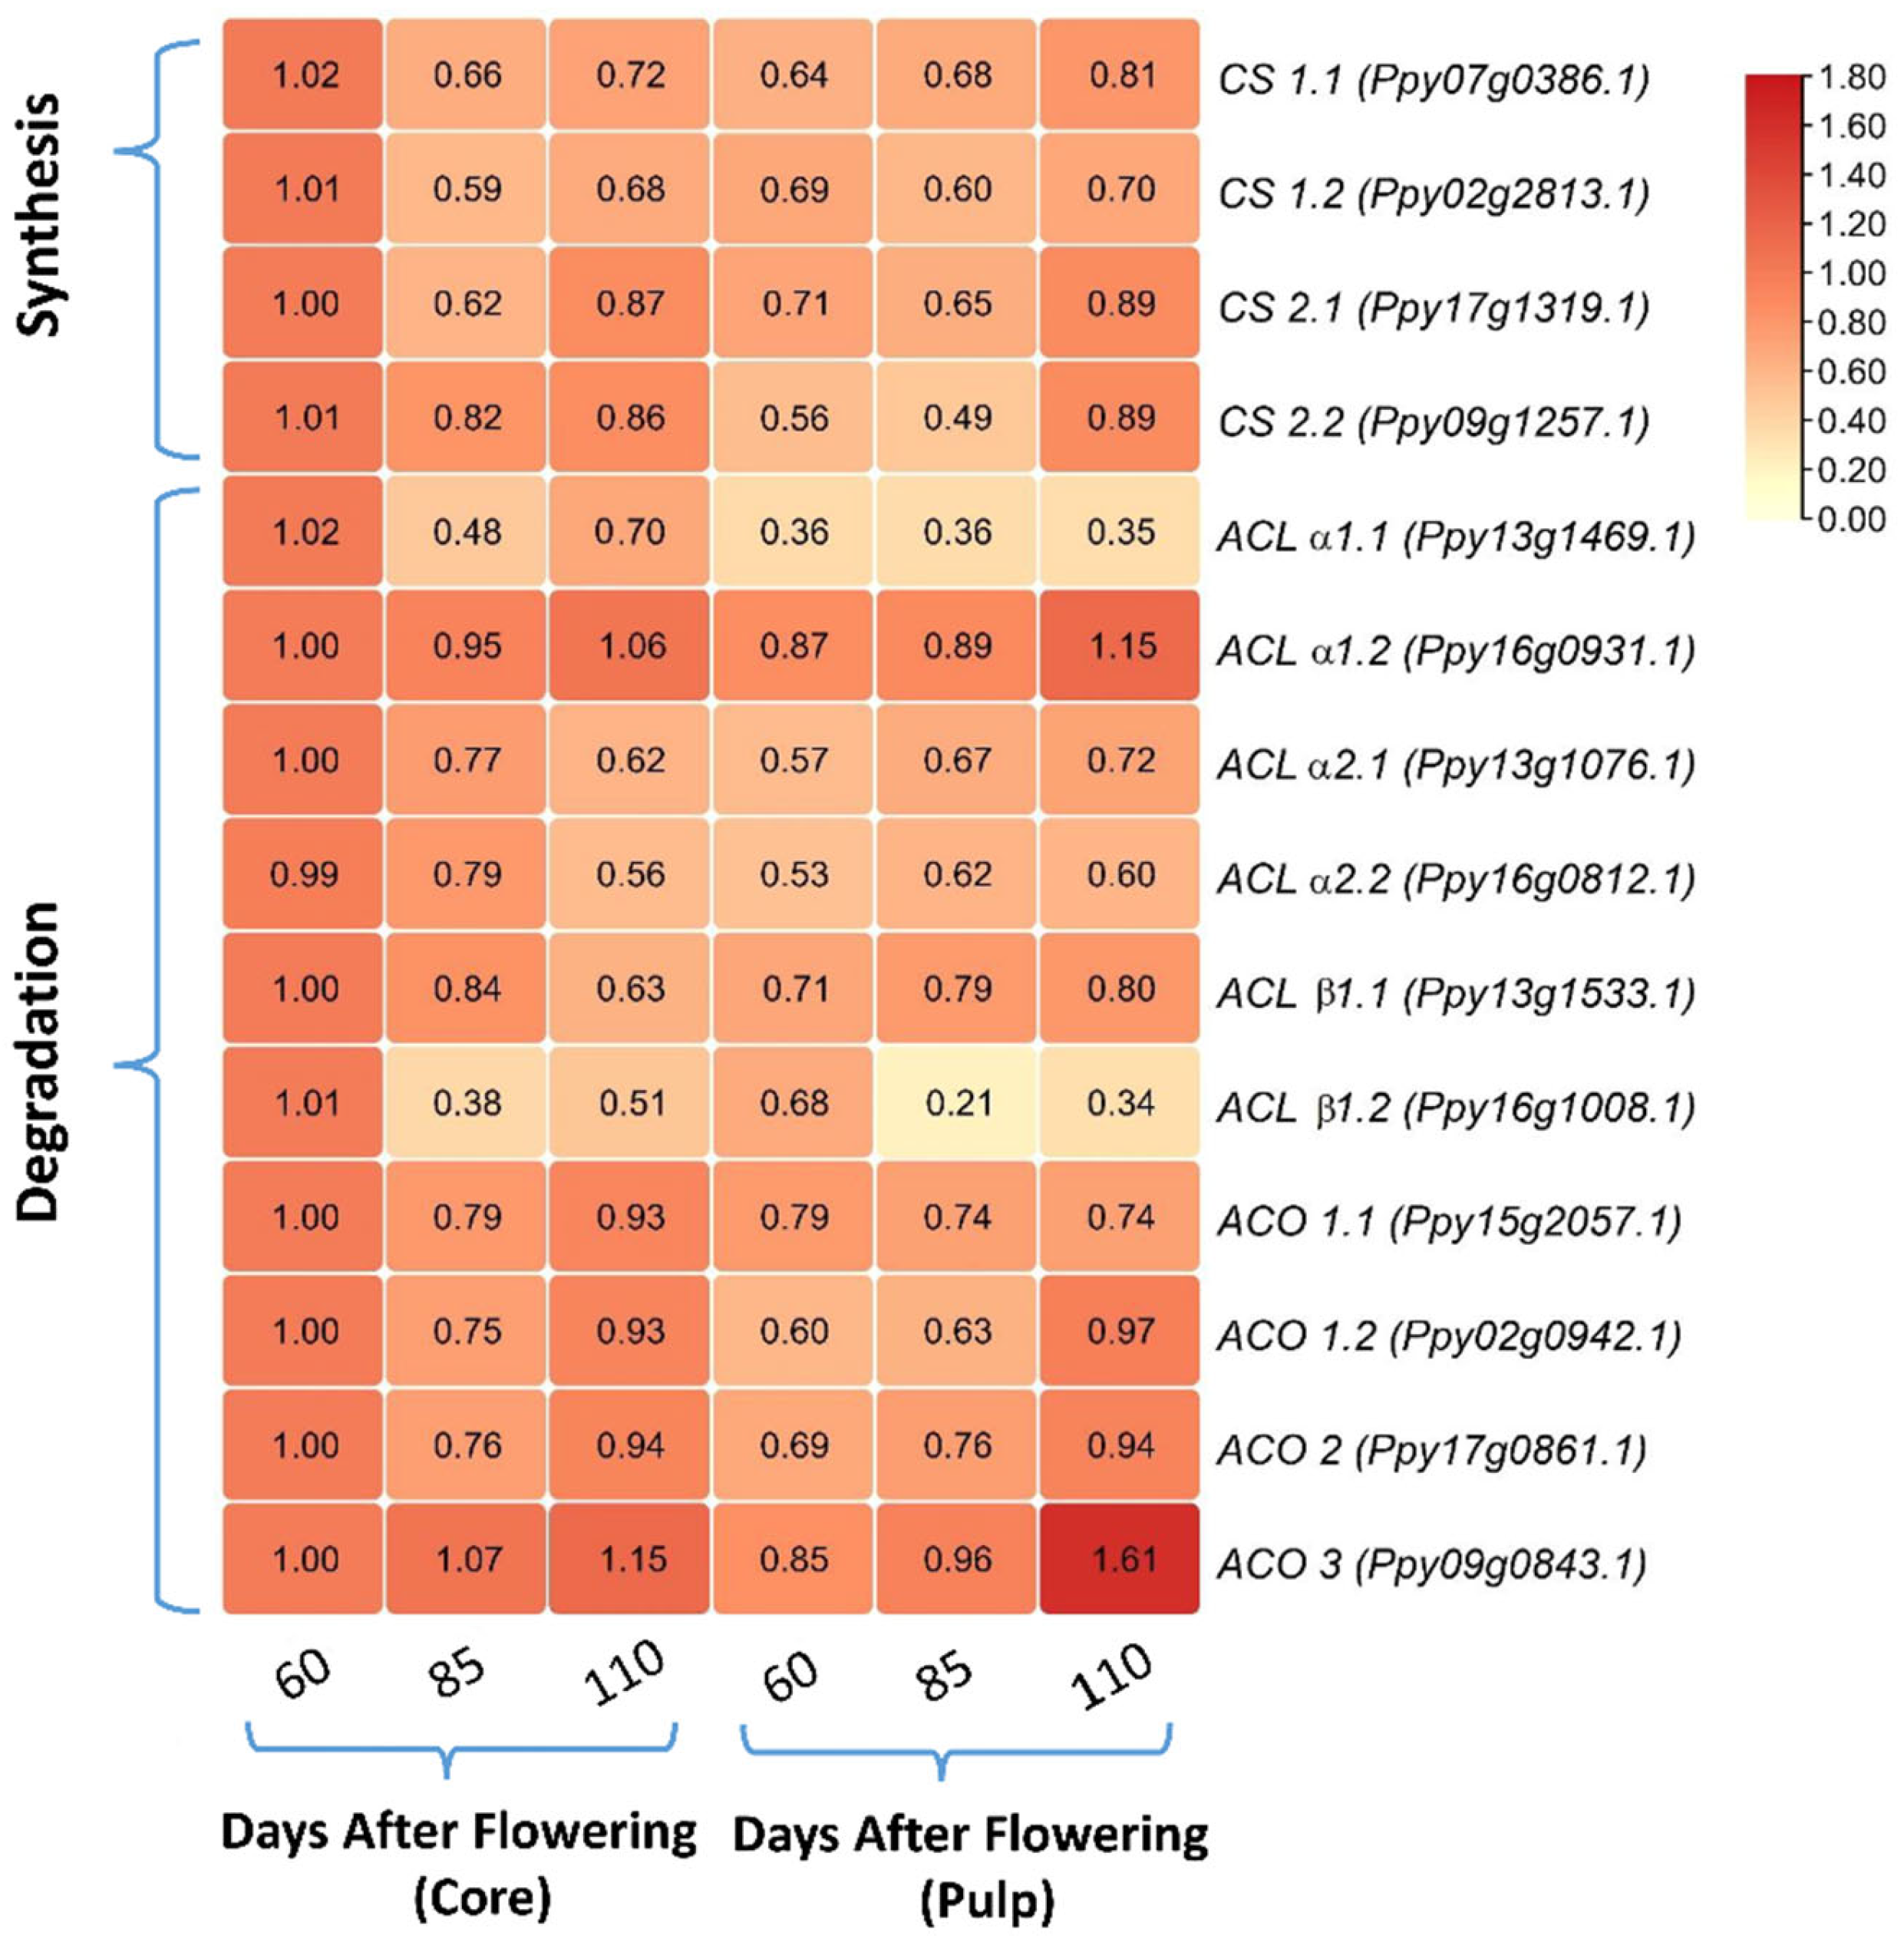
3.3. Comparing the Relative mRNA Levels of Citrate Synthesis- and Degradation-Related Genes between Core and Pulp

The relative mRNA expression levels of four key genes related to citrate synthesis (CS) and ten citrate degradation-related genes including ATP-citrate lyase (ACL) and aconitase (ACO) were compared between the pear core and pulp during fruit development (Figure 3). It was observed that three CS genes (CS1.1, CS1.2, CS2.1) showed relatively higher expressions in the core than the pulp at 60 DAF, while no significant difference in their transcript levels existed between the core and pulp at 85 or 110 DAF. Another CS gene, CS2.2 showed a nearly doubled mRNA level in the core than the pulp at 60 or 85 DAF, with no significant difference at 110 DAF between the core and pulp (Figure 3).
As for the most analyzed citrate degradation-related genes, their relative mRNA levels did not show any significant differences between the core and pulp of the pear during fruit development. However, two genes, ACLα1.1 and ACLβ1.2, showed higher relative mRNA levels in the core than in the pulp for all three fruit developmental stages. ACO genes, including ACO1.1, ACO1.2, and ACO2, showed higher relative mRNA levels at 60 DAF in the core than in the pulp, with no significant differences at 85 and 110 DAF. In addition, three genes, ACLα1.2, ACLβ1.1, and ACO3, showed lower relative mRNA levels at 110 DAF in the core as compared to the pulp (Figure 3).

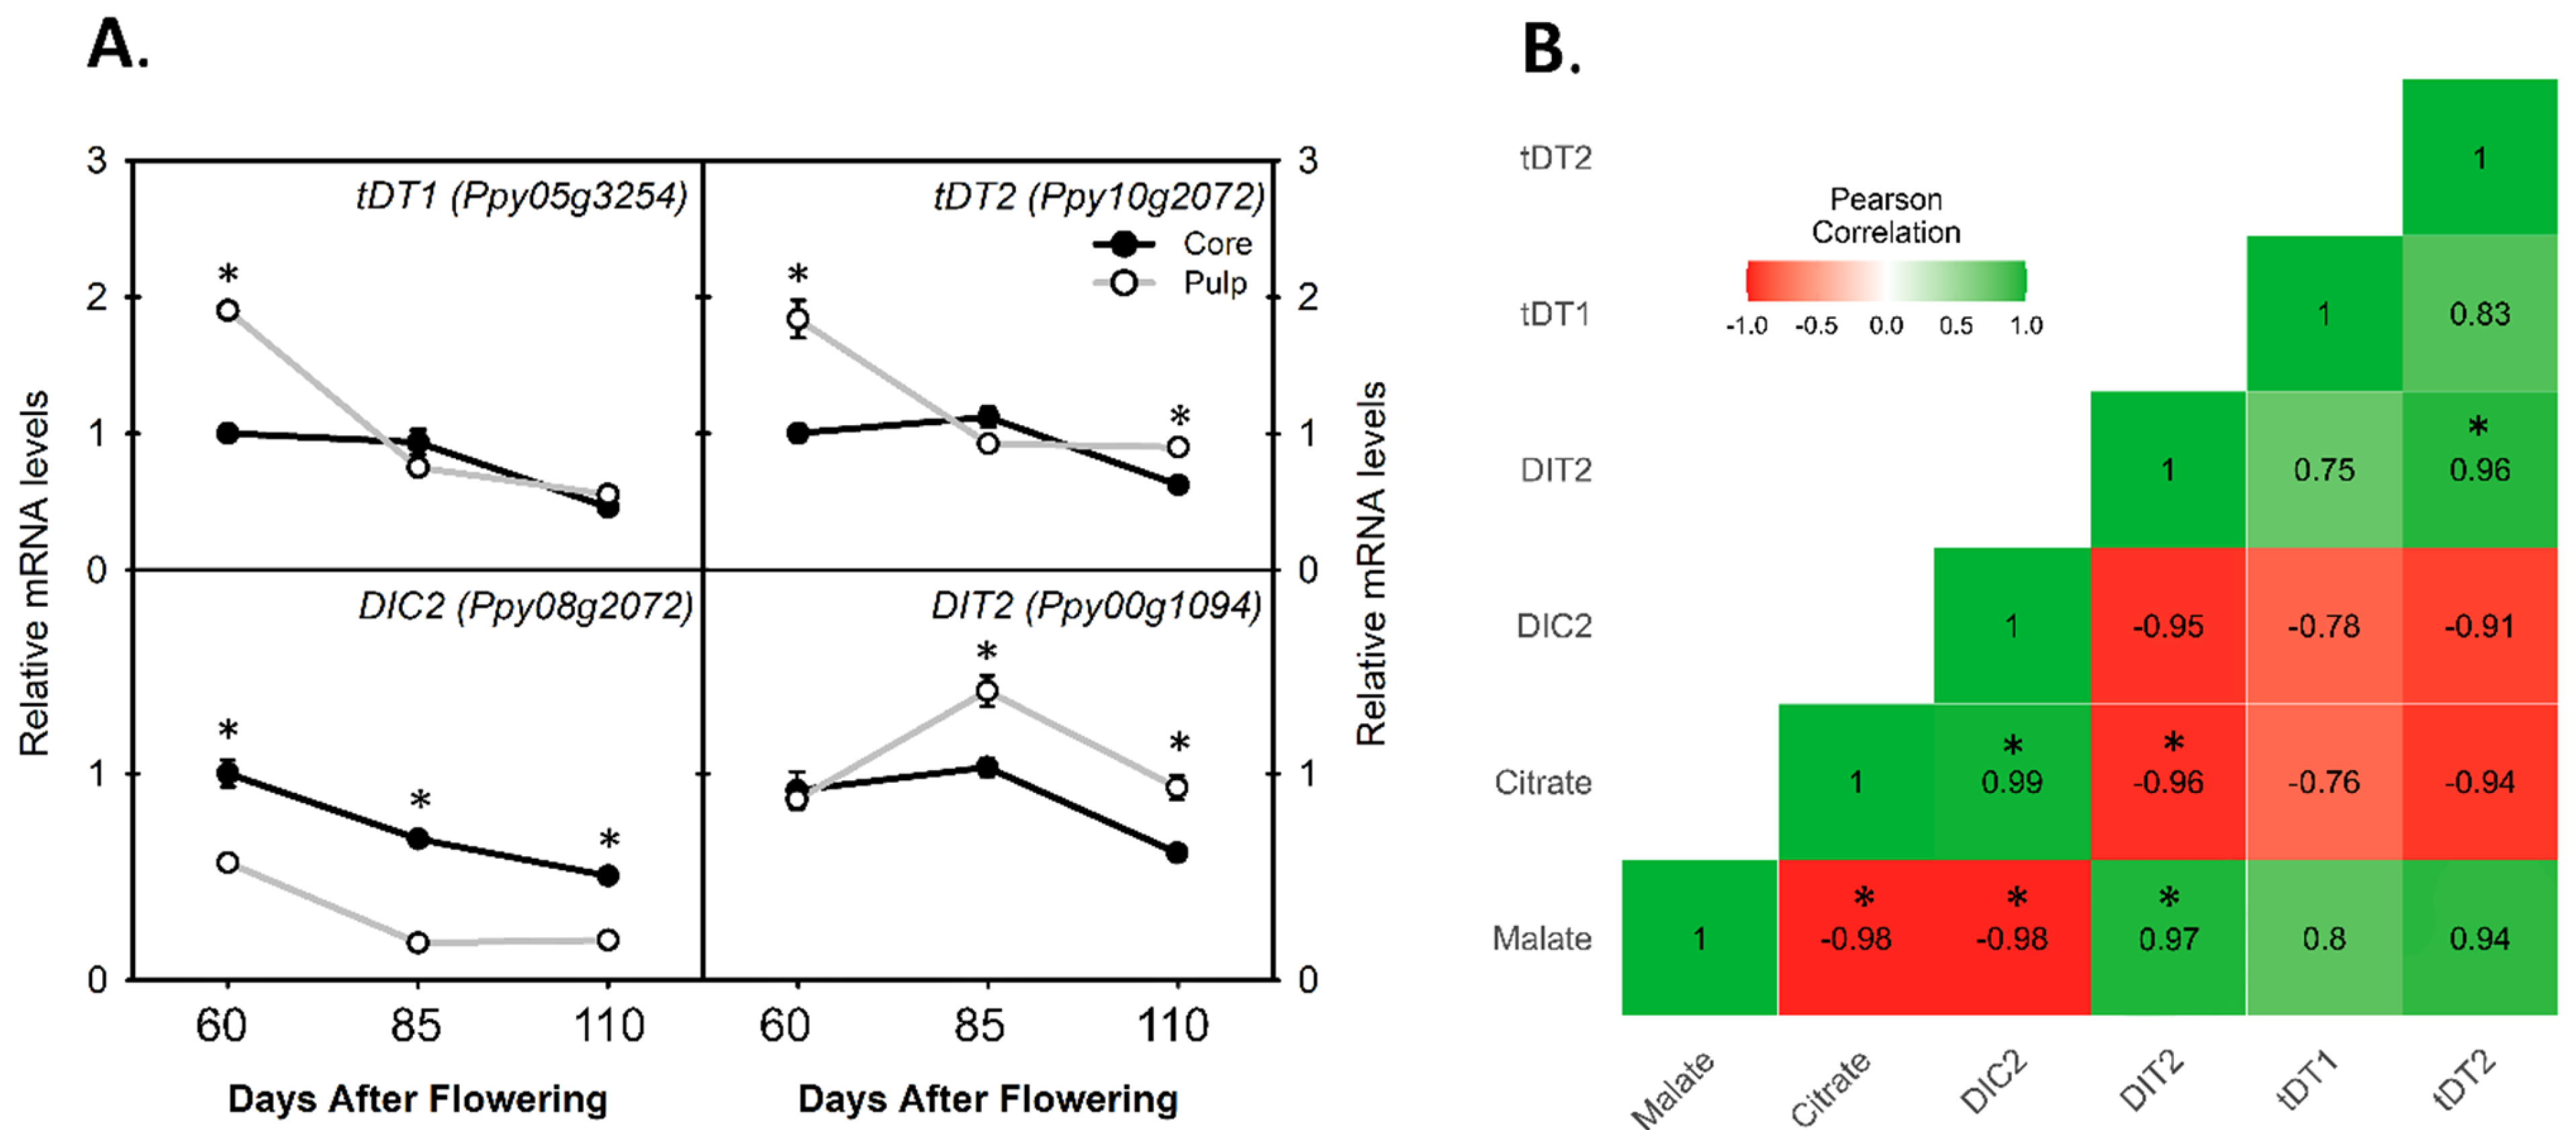
3.4. Comparing the Relative mRNA Levels of Di-Carboxylate Transporter Genes for Citrate and Malate Translocation between Core and Pulp

Two tonoplast di-carboxylate transporter genes (tDT1 and tDT2) showed similar expression profiles during fruit development. Their relative mRNA levels were reduced to half in the core compared to in the pulp at 60 DAF and did not show a significant difference at 85 and 110 DAF (Figure 4A). The relative mRNA levels of the mitochondrial di-carboxylate carrier 2 (DIC2) gene were always observed two-fold higher in the core than in the pulp during fruit development. Moreover, another di-carboxylate transporter (DIT2) gene showed significantly lower expression levels at 85 and 110 DAF in the core than in the pulp, while no significant difference was observed at 60 DAF between the core and pulp during the fruit development of pear (Figure 4A). In addition, we calculated the Pearson correlation between the citrate, malate, and di-carboxylate transporters genes, and we found that the relative mRNA levels of tDT2 and DIT2 were significantly and positively correlated with the malate contents, while the relative mRNA level of DIC2 was significantly and positively correlated with the citrate content (Figure 4B).

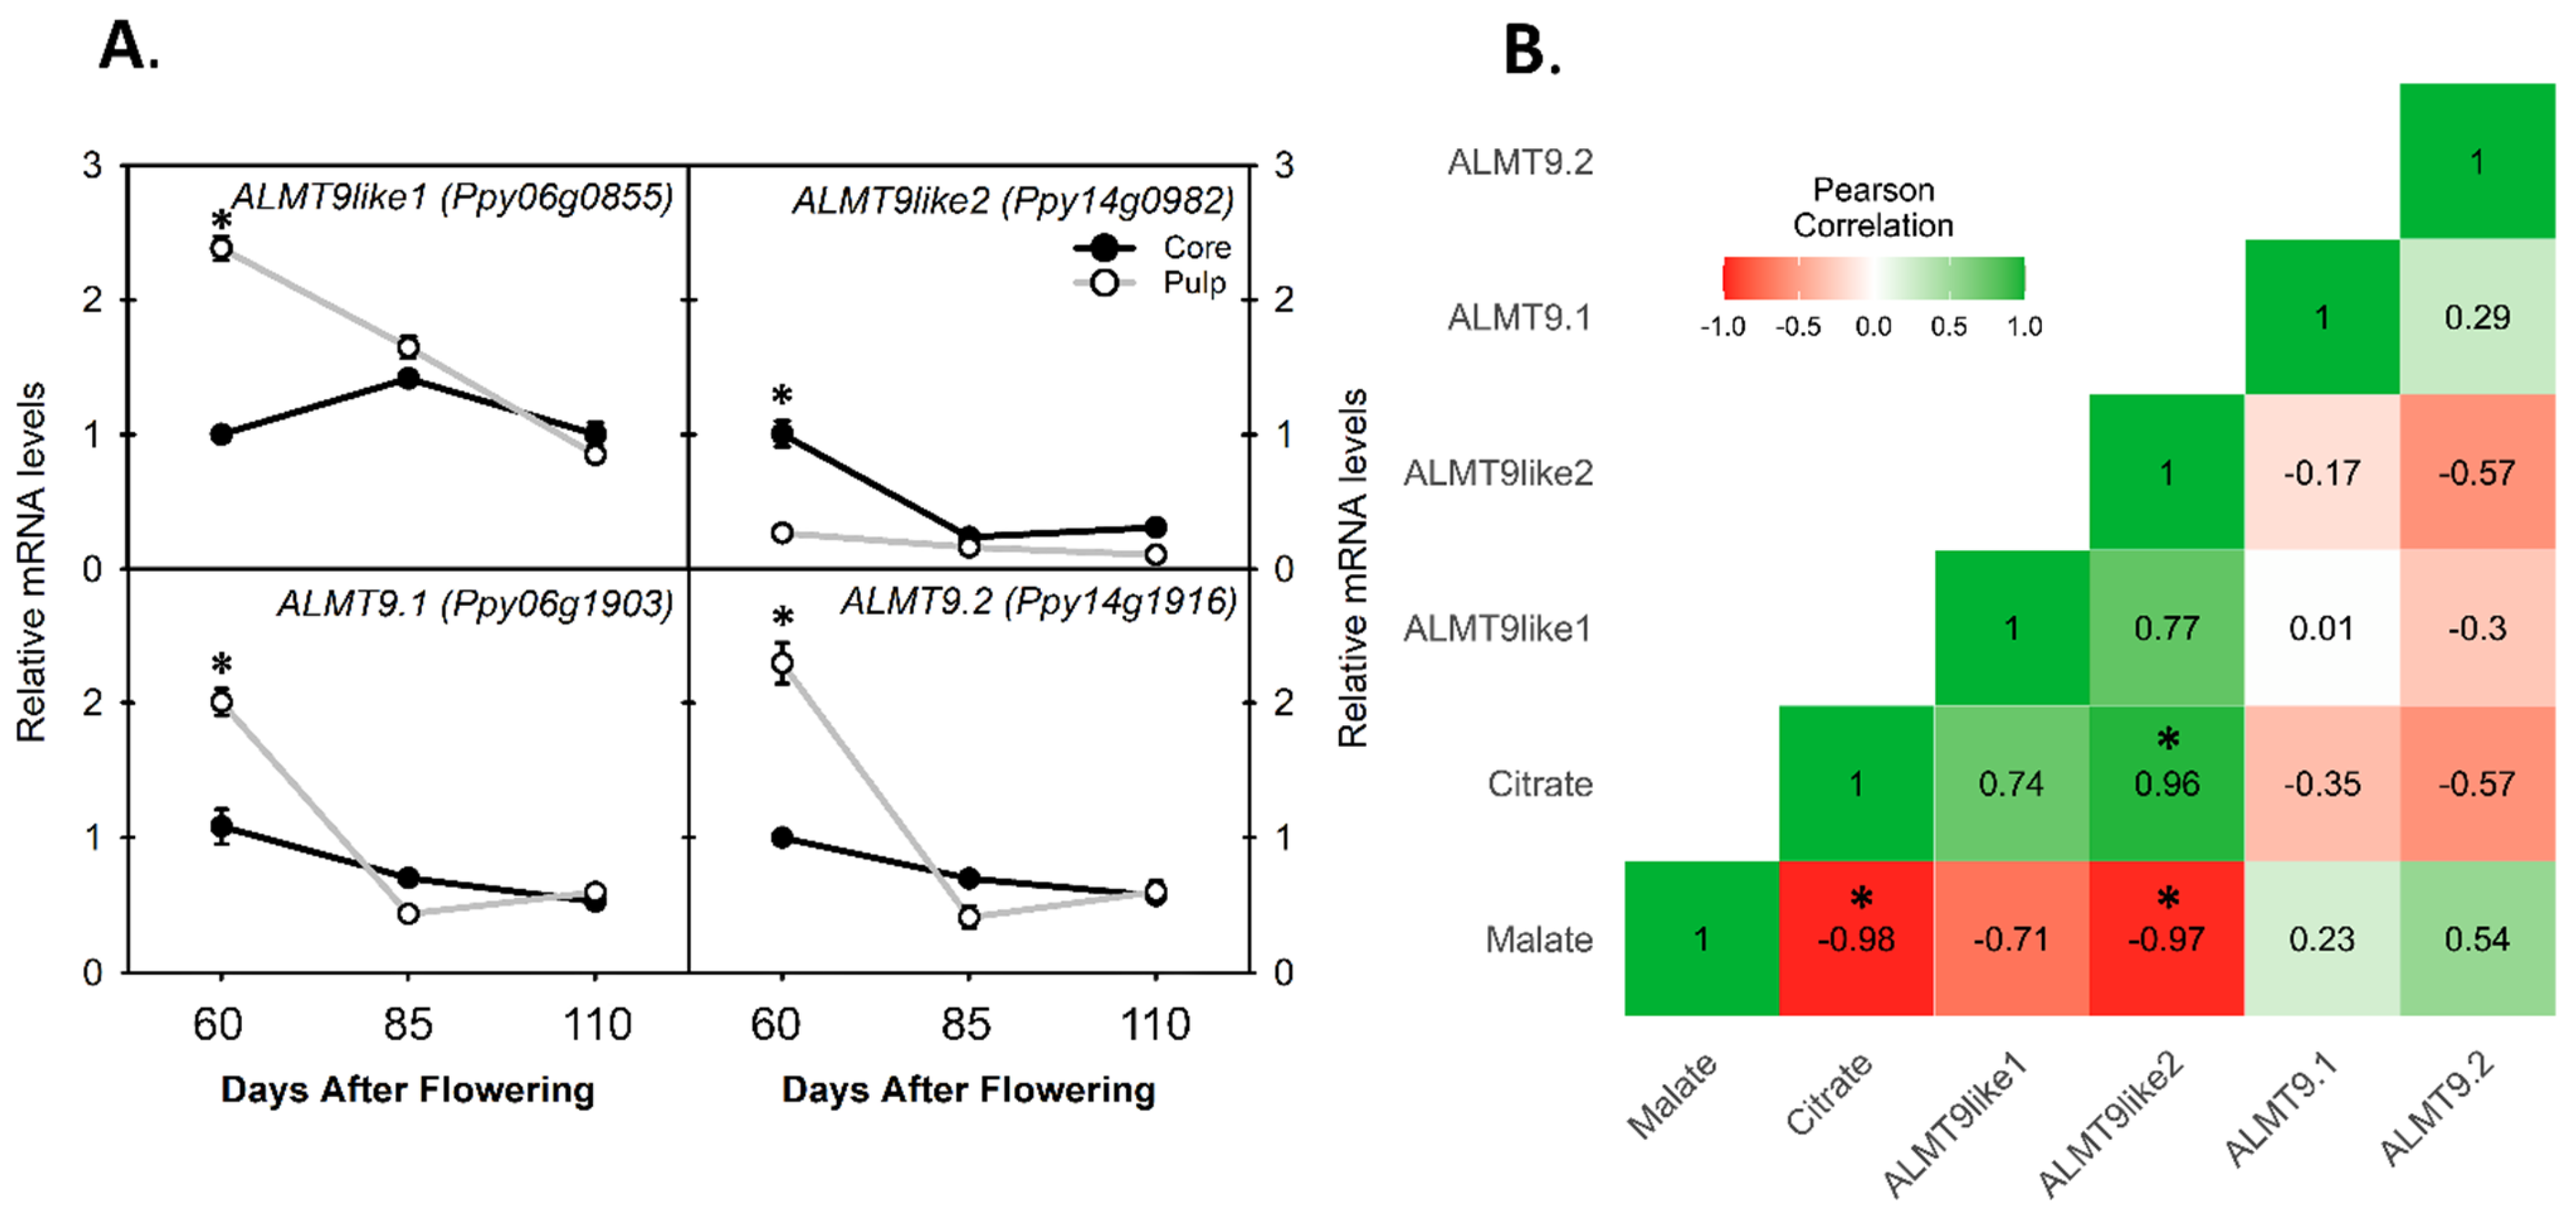
3.5. Comparing the Relative mRNA Levels of ALMT Genes for Malate Accumulation between Core and Pulp

The relative mRNA levels of the four aluminum-activated malate transporter (ALMT) genes were compared between the core and pulp of pear during fruit development (Figure 5). The relative mRNA levels of ALMT9.1, ALMT9.2, and ALMT9like1 showed a somewhat similar trend and exhibited 2-fold, 2.5-fold, and 2.5-fold lower levels in the core than in the pulp at 60 DAF, respectively, with no significant differences at 85 and 110 DAF. Another gene, ALMT9like2, was observed to have a three-fold higher relative mRNA level in the pear core than in the pulp at 60 DAF, and no significant difference was seen at 85 and 110 DAF (Figure 5A). Moreover, Pearson correlation analysis does not show a significant and positive correlation between the ALMT relative mRNA level and the malic acid content during fruit development (Figure 5B).

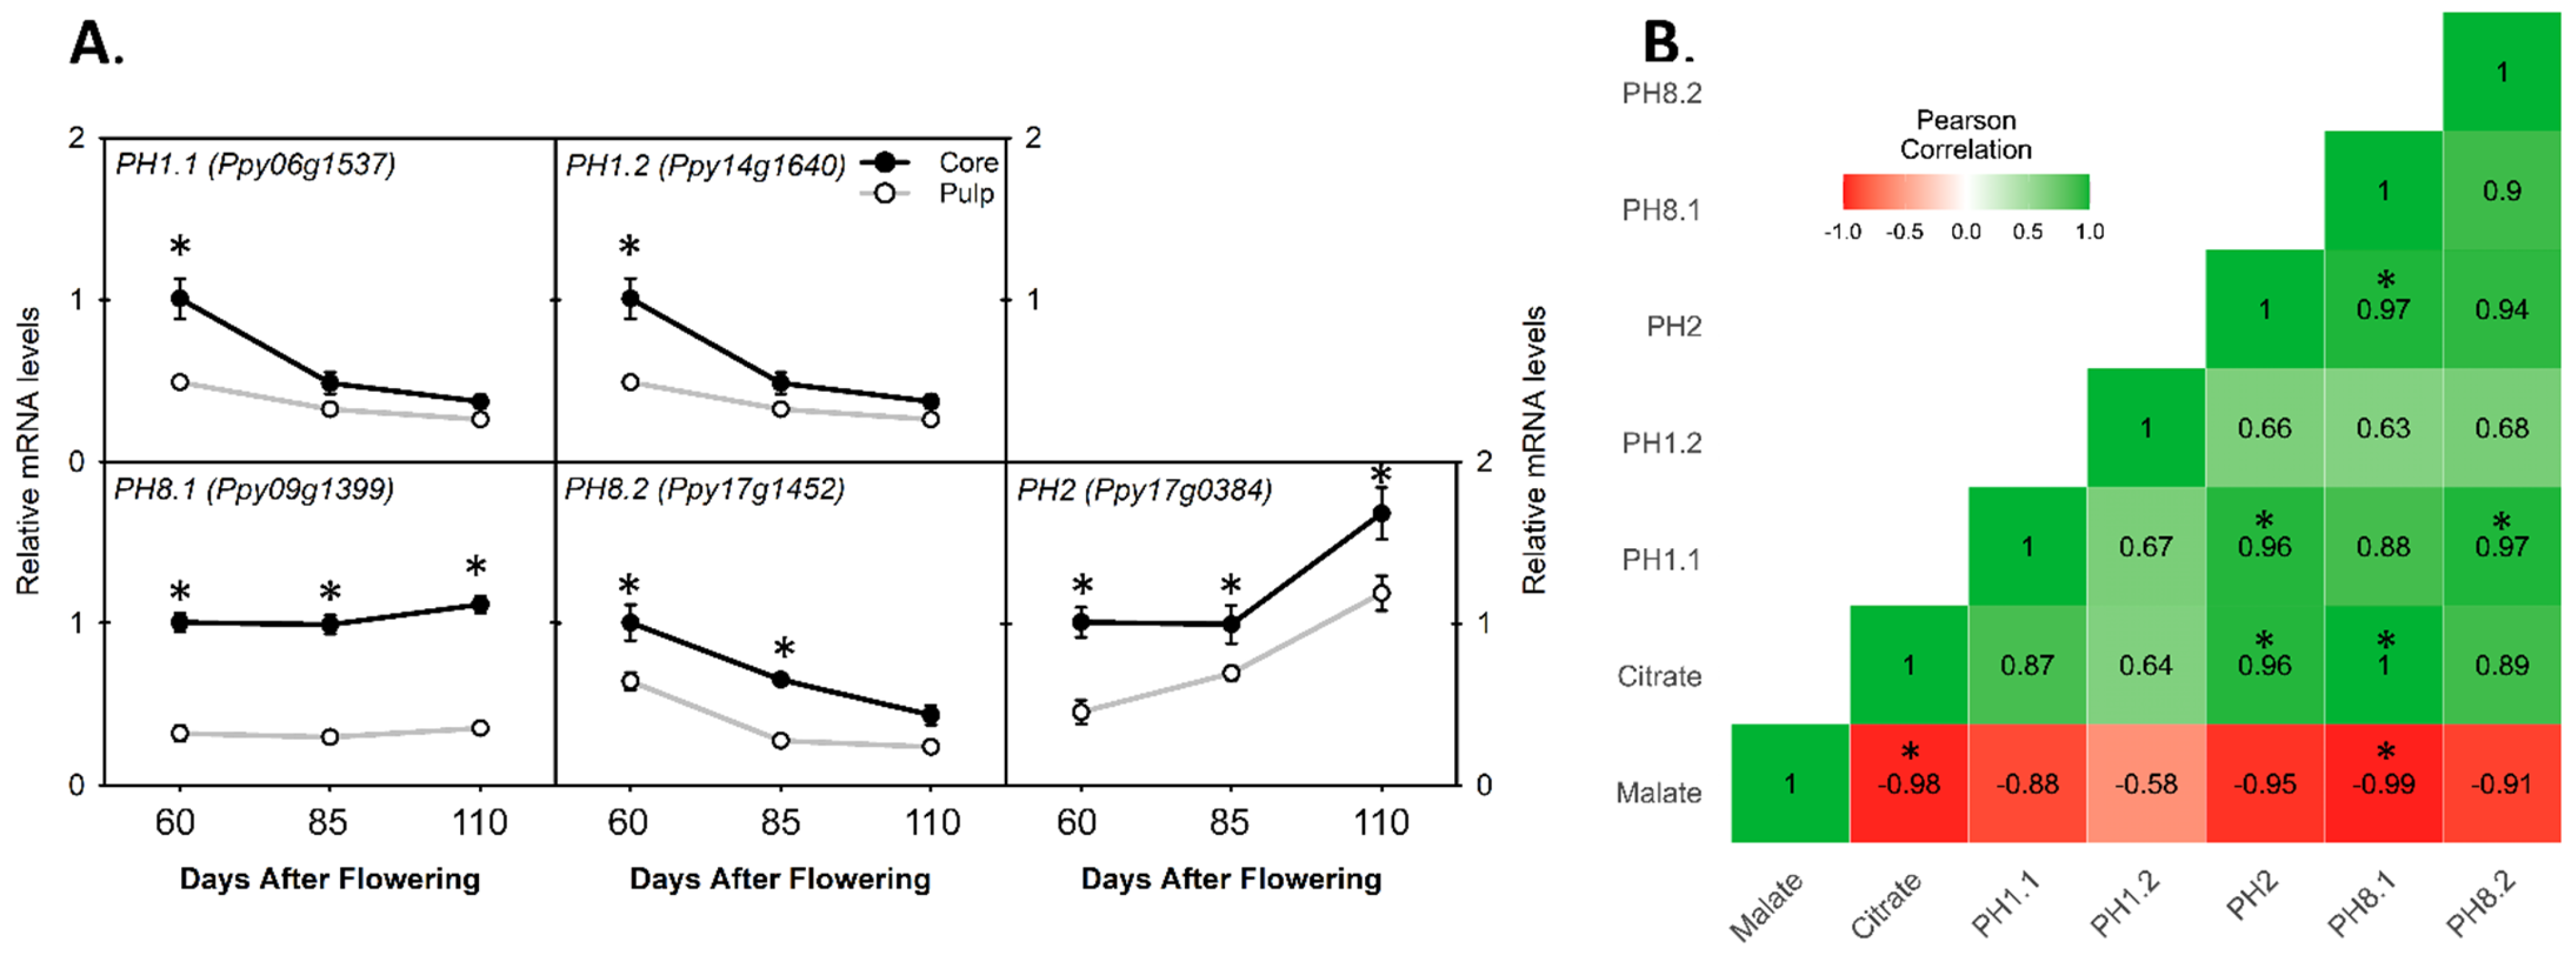
3.6. Comparing the Relative mRNA Levels of Plasma Membrane-Type Genes between Core and Pulp

By screening the pear genome database housed on GDR (https://www.rosaceae.org/) (accessed on 20 November 2021) with already-published P-type ATPase genes from citrus (CsPH8) and apple (MdMa10), and further by phylogenetic analysis, we identified five important PH genes in pear called PH1.1, PH1.2, PH2, PH8.1, and PH8.2. Of them, PH1.1, PH1.2, and PH2 were close to MdMA10, while PH8.1 and PH8.2 were clustered to CsPH8 (Figure S1). PH1.1 and PH1.2 had similar expression trends and had higher relative mRNA levels in the core as compared to the pulp at 60 DAF, while no significant differences were found at 85 and 110 DAF (Figure 6A). On the other hand, the relative mRNA levels of PH2 and PH8.2 showed significant differences with a significantly higher expression in the core than in the pulp during fruit development; PH8.1 always exhibited a three-fold higher relative mRNA level in the core than in the pulp during fruit development (Figure 6A). Additionally, by Pearson correlation analysis, it was seen that the relative mRNA level of PH2 or PH8.1 has a significant and positive correlation with the citrate content (Figure 6B).

4. Discussion

By the means of fruit biology, the pear is an exceptional fruit termed as pome and an accessory fruit. The ripe fruit can be visualized as two parts the core and the pulp; the core is developed from the ovary of a flower while the pulp is derived from adjacent tissues of a receptacle [27,28]. Recent studies on accessory fruits have determined that the metabolites can be differently accumulated among different parts of an individual fruit [36,37,38]. In the present study, we found that the two portions (core and pulp) from a pear fruit have significantly different fruit quality in terms of TA and TSS °Brix (Figure 1) which were consistent with previous findings in apples, pears, and strawberries [36,37,38]. Moreover, we observed the citrate contents were always higher during fruit development in the core and increased by up to three-fold more in the core than in pulp at the ripe stage, while the malate contents are slightly lower in the core than in the pulp at the ripening stage (Figure 1C). Hence, the sour taste of the pear core is ascribed to the higher accumulation ratio of citrate therein.
Malate is a predominant organic acid in pear species’ pulp [12]. Here we also found that the malate contents (2.5 mg/g) are higher than the citrate contents (1.5 mg/g) in the pulp of a ripe pear fruit (Figure 1C). In plants, malate regulation was also widely studied among different species of pear fruit [10,39,40]. For example, cMDH and MS are considered important enzymes to produce malic acid, while mMDH and ME are the key enzymes to degrade malate into oxaloacetate and pyruvate, respectively [11]. Our findings showed that the relative activity of MS1, MS2, and cMDH2 was 3- to 6.7-fold higher, while the relative mRNA levels of mMDH1 and mMDH2 were lower in the core than in the pulp at early fruit development (Figure 2), indicating that the higher malate contents at 60 DAF were possibly due to more synthesis- and less degradation-related genes activity in the core than in the pulp. Other than synthesis and degradation, the translocation of organic acids into a vacuole is an important step to maintain cell pH between different cell organelles [5]. Genes of aluminum-activated malate transporter 9 (ALMT9) and tonoplast di-carboxylate transporter (tDT) are localized on the tonoplast of cells and highly recognized for the transportation of malate into the fruit vacuole [10,14]. This study showed that the ALMT9like2 expression level was significantly higher at 60 DAF, while at 110 DAF, another gene tDT2 expression level was significantly lower in the core than in the pulp; moreover, the tDT2 relative mRNA level showed a positive correlation with the malate contents (Figure 4B). Likewise, in plants, a di-carboxylate transporter gene (DIT) is known to be an important malate valve regulator to maintain the redox balance [17,18]. This study showed that the relative expression level of DIT2 was significantly lower in the core than in the pulp at 85 and 110 DAF; Pearson correlation analysis also showed a significant and positive correlation between the DIT2 relative mRNA level and the malate content (Figure 4B). These findings implied that increased malate contents in the pear core at early fruit development were due to a higher expression of the ALMT9like2 gene, while, at the maturity stage, tDT2 and DIT2 activity was mainly responsible for the higher malate contents in the ripe pear pulp.
Citrate is another important organic acid in sand pear fruit pulp [12]. Here, we observed that the citrate contents were 1.6-fold lower than the malate contents in the pulp, and 2.3-fold higher than the malate contents in the core of the pear fruit at maturity (Figure 1C). Citrate is produced by the key enzyme CS in a TCA cycle. To date, it was described that the CS activity may not be the reason for higher citrate accumulation in the cell vacuole [19,41]. We identified four transcripts of the CS gene in the sand pear genome, out of which three genes, CS1.1, CS1.2, and CS2.1, showed higher expression levels in the core at 60 DAF, while CS2.2 exhibited a nearly doubled mRNA expression level in the core at 60 and 85 DAF, as compared to that in the pulp (Figure 3), indicating that citrate is more synthesized by CS genes in the core than in the pulp at early fruit development. Near the ripening stages, organic acid degradation should be initiated in fruits to produce sugars and other secondary metabolites [4]. Generally, citrate degradation was induced by ACO and ACL enzymes in the cytosol and is usually described to negatively regulate the citrate contents in citrus species [19,42]. We identified ten transcripts of ACO- and ACL-related genes in the pear genome database (Table S1); the transcript expression analysis showed that most ACL and ACO genes have little or no significant difference during fruit growth between the core and pulp, while three genes, ACLα1.2, ACLβ1.1, and ACO3, showed lower relative expression levels at 110 DAF in the core as compared to the pulp (Figure 3), indicating that in the pear core, the citrate was less degraded even at the ripening stage than the pulp and was actively stored in the pear core cell vacuole. Citrate storage in the vacuole is an essential step for maintaining the cellular pH [5]. Recently, a mitochondrial DIC2 gene was acknowledged as an important translocator of citrate from mitochondria into cytosol [20], our analysis showed that the relative expression level of the DIC2 gene was two-fold higher in the pear core than in the pear pulp during all fruit development stages (Figure 4A). Moreover, we observed that DIC2 has a significant and positive correlation with the citrate accumulation trend, indicating that in the core, more citrate was excreted from the mitochondria into the cytosol to be transferred into the cell vacuole. Furthermore, different genes from the plasma membrane H+-ATPase (P-type ATPase) family were known for their special role in the vacuolar acidification of fruit cells. In citrus species, CsPH8 and CitPH5 were recognized to mainly regulate citrate into the cell vacuole [23,24], while in apple, MdMa10 was reported to regulate malate into the cell vacuole [26]. We identified highly similar transcripts of previously reported PH genes in pears by phylogenetic analysis (Figure S1), and our qPCR analysis showed that three genes, PH8.1, PH8.2, and PH2, have higher expression levels in the core than in the pulp during all fruit developmental stages. Additionally, the PH8.1 gene always showed a three-fold higher relative expression in the pear core than the pulp (Figure 4A). Moreover, Pearson correlation analysis showed that only PH2 and PH8.1 have a significant correlation with the citrate contents (Figure 6B), implying that the increased expression of the PH2 or PH8.1 gene resulted in higher citrate storage in the pear core than in the pulp. Taken together, the increased citrate content in a ripe pear core is due to the amplified citrate transportation into the vacuole, which is induced by the collaborative and amplified activity of two genes, PH8.1 and DIC2.

5. Conclusions

We witnessed lower TSS (°Brix) and higher TA (%) in the ripe pear fruit core than in the pulp. The higher TA (%) in the pear core was ascribed to the three-fold increased citrate contents and relatively lower malate contents. The transcript activity of citrate-malate synthesis-related genes was higher in the core than in the pulp at early fruit growth, while the overall transcriptional activity of the degradation-related genes was nearly similar or non-significant between the core and pulp during fruit development. In comparison to the pear fruit pulp, the lesser malate content in ripe pear pulp was mainly due to the decreased vacuolar malate storage by the tDT2 gene, and a higher accumulation of citrate in the pear core is mainly due to the collaborative and higher expression of PH8.1 and DIC2 genes. Moreover, we propose that the proton pump (P3A-ATPases) genes are critical for citrate regulation and the acidification of fruit vacuoles. In future studies, with the help of molecular breeding tools, citrate-malate accumulation can be optimized in pears to improve fruit flavor and fruit quality.

Supplementary Materials

The following supporting information can be downloaded at: https://www.mdpi.com/article/10.3390/agronomy12081966/s1. Figure S1: Phylogenetic analysis of pear P3A-ATPases polypeptide sequences and other important PH proteins from Petunia (PhPH5), Arabidopsis (AtAHA10), Citrus (CsPH8), and Apple (MdMa10) marked with red circles. Underline shows the position of important and highly similar pear isoforms analyzed in the study. The tree was constructed using MEGA X program with neighbor-joining method, and bootstrap of 1000 replicates. Table S1: Putative genes for citrate and malate regulation in pear, and their corresponding primer information.

Author Contributions

S.M.A.: Data Visualization, Investigation, Formal analysis, Writing—original draft, Writing—review and editing. D.-H.L., H.H., H.C., Y.L., X.-L.C.: Investigation. M.A., M.A.K.: Writing—review and editing. Y.-Z.L.: Fund support, Data visualization, Writing—review and editing. All authors have read and agreed to the published version of the manuscript.

Funding

This research was funded by the earmarked fund for CARS26.

Data Availability Statement

Not applicable.

Conflicts of Interest

The authors declare no conflict of interest.

References

  1. Giné Bordonaba, J.; Terry, L. Manipulating the taste-related composition of strawberry fruits (Fragaria × ananassa) from different cultivars using deficit irrigation. Food Chem. 2010, 122, 1020–1026. [Google Scholar] [CrossRef] [Green Version]
  2. Ramos, D.C.; Neta, E.R.; Johanningsmeier, S.D.; McFeeters, R.F. The chemistry and physiology of sour taste—A review. J. Food Sci. 2007, 72, R33–R38. [Google Scholar]
  3. Baldwin, E.; Bai, J.; Plotto, A.; Ritenour, M. Citrus fruit quality assessment; producer and consumer perspectives. Stewart Postharvest Rev. 2014, 10, 408. [Google Scholar]
  4. Hussain, S.B.; Shi, C.-Y.; Guo, L.-X.; Kamran, H.M.; Sadka, A.; Liu, Y.-Z. Recent Advances in the Regulation of Citric Acid Metabolism in Citrus Fruit. Crit. Rev. Plant Sci. 2017, 36, 241–256. [Google Scholar] [CrossRef]
  5. Etienne, A.; Génard, M.; Lobit, P.; Mbeguié-A-Mbéguié, D.; Bugaud, C. What controls fleshy fruit acidity? A review of malate and citrate accumulation in fruit cells. J. Exp. Bot. 2013, 64, 1451–1469. [Google Scholar] [CrossRef] [Green Version]
  6. Song, J.-X.; Chen, Y.-C.; Lu, Z.-H.; Zhao, G.-P.; Wang, X.-L.; Zhai, R.; Wang, Z.-G.; Yang, C.-Q.; Xu, L.-F. PbPH5, an H+ P-ATPase on the tonoplast, is related to malic acid accumulation in pear fruit. J. Integr. Agric. 2022, 21, 1645–1657. [Google Scholar]
  7. Yao, G.-f.; Yang, Z.-j.; Shao-ling, Z.; Cao, Y.-f.; Liu, J.; Wu, J. Characteristics of Components and Contents of Organic Acid in Pear Fruits from Different Cultivated Species. Acta Hortic. Sin. 2014, 41, 755–765. [Google Scholar]
  8. Zhang, Y.; Li, Q.; Xu, L.; Qiao, X.; Liu, C.; Zhang, S. Comparative analysis of the P-type ATPase gene family in seven Rosaceae species and an expression analysis in pear (Pyrus bretschneideri Rehd.). Genomics 2020, 112, 2550–2563. [Google Scholar] [CrossRef]
  9. Liu, L.; Chen, C.-X.; Zhu, Y.-F.; Xue, L.; Liu, Q.-W.; Qi, K.-J.; Zhang, S.-L.; Wu, J. Maternal inheritance has impact on organic acid content in progeny of pear (Pyrus spp.) fruit. Euphytica 2016, 209, 305–321. [Google Scholar] [CrossRef]
  10. Linlin, X.; Xin, Q.; Mingyue, Z.; Shaoling, Z. Genome-Wide analysis of aluminum-activated malate transporter family genes in six rosaceae species, and expression analysis and functional characterization on malate accumulation in Chinese white pear. Plant Sci. 2018, 274, 451–465. [Google Scholar] [CrossRef]
  11. Wang, L.; Ma, M.; Zhang, Y.; Wu, Z.; Guo, L.; Luo, W.; Wang, L.; Zhang, Z.; Zhang, S. Characterization of the Genes Involved in Malic Acid Metabolism from Pear Fruit and Their Expression Profile after Postharvest 1-MCP/Ethrel Treatment. J. Agric. Food Chem. 2018, 66, 8772–8782. [Google Scholar] [CrossRef] [PubMed]
  12. Chen, J.; Wang, Z.; Wu, J.; Wang, Q.; Hu, X. Chemical compositional characterization of eight pear cultivars grown in China. Food Chem. 2007, 104, 268–275. [Google Scholar] [CrossRef]
  13. Yao, Y.-X.; Li, M.; Zhai, H.; You, C.-X.; Hao, Y.-J. Isolation and characterization of an apple cytosolic malate dehydrogenase gene reveal its function in malate synthesis. J. Plant Physiol. 2011, 168, 474–480. [Google Scholar] [CrossRef]
  14. Li, C.; Dougherty, L.; Coluccio, A.E.; Meng, D.; El-Sharkawy, I.; Borejsza-Wysocka, E.; Liang, D.; Piñeros, M.A.; Xu, K.; Cheng, L. Apple ALMT9 Requires a Conserved C-Terminal Domain for Malate Transport Underlying Fruit Acidity1 [OPEN]. Plant Physiol. 2019, 182, 992–1006. [Google Scholar] [CrossRef] [PubMed] [Green Version]
  15. Ye, J.; Wang, X.; Hu, T.; Zhang, F.; Wang, B.; Li, C.; Yang, T.; Li, H.; Lu, Y.; Giovannoni, J.J.; et al. An InDel in the Promoter of Al-ACTIVATED MALATE TRANSPORTER9 Selected during Tomato Domestication Determines Fruit Malate Contents and Aluminum Tolerance. Plant Cell 2017, 29, 2249–2268. [Google Scholar] [CrossRef] [Green Version]
  16. Bai, Y.; Dougherty, L.; Li, M.; Fazio, G.; Cheng, L.; Xu, K. A natural mutation-led truncation in one of the two aluminum-activated malate transporter-like genes at the Ma locus is associated with low fruit acidity in apple. Mol. Genet. Genom. 2012, 287, 663–678. [Google Scholar] [CrossRef] [Green Version]
  17. Zamani-Nour, S.; Lin, H.C.; Walker, B.J.; Mettler-Altmann, T.; Khoshravesh, R.; Karki, S.; Bagunu, E.; Sage, T.L.; Quick, W.P.; Weber, A.P.M. Overexpression of the chloroplastic 2-oxoglutarate/malate transporter disturbs carbon and nitrogen homeostasis in rice. J. Exp. Bot. 2021, 72, 137–152. [Google Scholar] [CrossRef]
  18. Kinoshita, H.; Nagasaki, J.; Yoshikawa, N.; Yamamoto, A.; Takito, S.; Kawasaki, M.; Sugiyama, T.; Miyake, H.; Weber, A.P.M.; Taniguchi, M. The chloroplastic 2-oxoglutarate/malate transporter has dual function as the malate valve and in carbon/nitrogen metabolism. Plant J. 2011, 65, 15–26. [Google Scholar] [CrossRef]
  19. Guo, L.X.; Shi, C.Y.; Liu, X.; Ning, D.Y.; Jing, L.F.; Yang, H.; Liu, Y.Z. Citrate Accumulation-Related Gene Expression and/or Enzyme Activity Analysis Combined With Metabolomics Provide a Novel Insight for an Orange Mutant. Sci. Rep. 2016, 6, 29343. [Google Scholar] [CrossRef] [Green Version]
  20. Lee, C.P.; Elsasser, M.; Fuchs, P.; Fenske, R.; Schwarzlander, M.; Millar, A.H. The versatility of plant organic acid metabolism in leaves is underpinned by mitochondrial malate-citrate exchange. Plant Cell 2021, 33, 3700–3720. [Google Scholar] [CrossRef]
  21. Hu, X.M.; Shi, C.Y.; Liu, X.; Jin, L.F.; Liu, Y.Z.; Peng, S.A. Genome-wide identification of citrus ATP-citrate lyase genes and their transcript analysis in fruits reveals their possible role in citrate utilization. Mol. Genet. Genom. 2015, 290, 29–38. [Google Scholar] [CrossRef] [PubMed]
  22. Degu, A.; Hatew, B.; Nunes-Nesi, A.; Shlizerman, L.; Zur, N.; Katz, E.; Fernie, A.R.; Blumwald, E.; Sadka, A. Inhibition of aconitase in citrus fruit callus results in a metabolic shift towards amino acid biosynthesis. Planta 2011, 234, 501–513. [Google Scholar] [CrossRef] [PubMed]
  23. Strazzer, P.; Spelt, C.E.; Li, S.; Bliek, M.; Federici, C.T.; Roose, M.L.; Koes, R.; Quattrocchio, F.M. Hyperacidification of Citrus fruits by a vacuolar proton-pumping P-ATPase complex. Nat. Commun. 2019, 10, 744. [Google Scholar] [CrossRef]
  24. Shi, C.Y.; Song, R.Q.; Hu, X.M.; Liu, X.; Jin, L.F.; Liu, Y.Z. Citrus PH5-like H(+)-ATPase genes: Identification and transcript analysis to investigate their possible relationship with citrate accumulation in fruits. Front. Plant Sci. 2015, 6, 135. [Google Scholar] [CrossRef] [Green Version]
  25. Faraco, M.; Spelt, C.; Bliek, M.; Verweij, W.; Hoshino, A.; Espen, L.; Prinsi, B.; Jaarsma, R.; Tarhan, E.; de Boer, A.H.; et al. Hyperacidification of Vacuoles by the Combined Action of Two Different P-ATPases in the Tonoplast Determines Flower Color. Cell Rep. 2014, 6, 32–43. [Google Scholar] [CrossRef] [PubMed] [Green Version]
  26. Ma, B.; Liao, L.; Fang, T.; Peng, Q.; Ogutu, C.; Zhou, H.; Ma, F.; Han, Y. A Ma10 gene encoding P-type ATP ase is involved in fruit organic acid accumulation in apple. Plant Biotechnol. J. 2019, 17, 674–686. [Google Scholar] [CrossRef] [Green Version]
  27. Hui, Y.H.; Chen, F.; Nollet, L.M.L.; Guiné, R.P.F.; Martín-Belloso, O.; Mínguez-Mosquera, M.I.; Paliyath, G.; Pessoa, F.L.P.; Quéré, J.L.L.; Sidhu, J.S. Handbook of Fruit and Vegetable Flavors; Wiley: New York, NY, USA, 2010. [Google Scholar]
  28. Roth, I. Fruits of Angiosperms; Schweizerbart Science Publishers: Stuttgart, Germany, 1977; Volume XVI, p. 675. [Google Scholar]
  29. Shi, C.Y.; Hussain, S.B.; Yang, H.; Bai, Y.X.; Khan, M.A.; Liu, Y.Z. CsPH8, a P-type proton pump gene, plays a key role in the diversity of citric acid accumulation in citrus fruits. Plant Sci. 2019, 289, 110288. [Google Scholar] [CrossRef]
  30. Bartolozzi, F.; Bertazza, G.; Bassi, D.; Cristoferi, G. Simultaneous determination of soluble sugars and organic acids as their trimethylsilyl derivatives in apricot fruits by gas-liquid chromatography. J. Chromatogr. A 1997, 758, 99–107. [Google Scholar] [CrossRef]
  31. Kumar, S.; Stecher, G.; Li, M.; Knyaz, C.; Tamura, K. MEGA X: Molecular Evolutionary Genetics Analysis across Computing Platforms. Mol. Biol. Evol. 2018, 35, 1547–1549. [Google Scholar] [CrossRef]
  32. Chang, S.; Puryear, J.; Cairney, J. A simple and efficient method for isolating RNA from pine trees. Plant Mol. Biol. Rep. 1993, 11, 113–116. [Google Scholar] [CrossRef]
  33. Livak, K.J.; Schmittgen, T.D. Analysis of Relative Gene Expression Data Using Real-Time Quantitative PCR and the 2−ΔΔCT Method. Methods 2001, 25, 402–408. [Google Scholar] [CrossRef] [PubMed]
  34. Chen, C.; Chen, H.; Zhang, Y.; Thomas, H.R.; Frank, M.H.; He, Y.; Xia, R. TBtools: An Integrative Toolkit Developed for Interactive Analyses of Big Biological Data. Mol. Plant 2020, 13, 1194–1202. [Google Scholar] [CrossRef] [PubMed]
  35. The-Jamovi-Project Jamovi (Version 2.2) Computer Software. Available online: https://www.jamovi.org (accessed on 30 June 2022).
  36. Ikegaya, A.; Toyoizumi, T.; Ohba, S.; Nakajima, T.; Kawata, T.; Ito, S.; Arai, E. Effects of distribution of sugars and organic acids on the taste of strawberries. Food Sci. Nutr. 2019, 7, 2419–2426. [Google Scholar] [CrossRef] [PubMed]
  37. Cebulj, A.; Cunja, V.; Mikulic-Petkovsek, M.; Veberic, R. Importance of metabolite distribution in apple fruit. Sci. Hortic. 2017, 214, 214–220. [Google Scholar] [CrossRef]
  38. Gao, Z.; Zhang, C.; Luo, M.; Wu, Y.; Duan, S.; Li, J.; Wang, L.; Song, S.; Xu, W.; Wang, S.; et al. Proteomic analysis of pear (Pyrus pyrifolia) ripening process provides new evidence for the sugar/acid metabolism difference between core and mesocarp. Proteomics 2016, 16, 3025–3041. [Google Scholar] [CrossRef]
  39. Sha, S.; Li, J.; Wu, J.; Zhang, S. Characteristics of organic acids in the fruit of different pear species. Afr. J. Agric. Res. 2011, 6, 2403–2410. [Google Scholar]
  40. Li, Q.; Qiao, X.; Jia, L.; Zhang, Y.; Zhang, S. Transcriptome and Resequencing Analyses Provide Insight into Differences in Organic Acid Accumulation in Two Pear Varieties. Int. J. Mol. Sci. 2021, 22, 9622. [Google Scholar] [CrossRef]
  41. Lu, X.; Cao, X.; Li, F.; Li, J.; Xiong, J.; Long, G.; Cao, S.; Xie, S. Comparative transcriptome analysis reveals a global insight into molecular processes regulating citrate accumulation in sweet orange (Citrus sinensis). Physiol. Plant. 2016, 158, 463–482. [Google Scholar] [CrossRef]
  42. Li, S.J.; Yin, X.R.; Wang, W.L.; Liu, X.F.; Zhang, B.; Chen, K.S. Citrus CitNAC62 cooperates with CitWRKY1 to participate in citric acid degradation via up-regulation of CitAco3. J. Exp. Bot. 2017, 68, 3419–3426. [Google Scholar] [CrossRef]
Figure 1. Comparison of fruit physical traits, total soluble solution (TSS), and titratable acidity (TA) between pear core and pulp during fruit development. (A) Pictorial view of pear fruit and identification of pear core and pear pulp. (B) Evaluation of TSS (°Brix) and TA (%) between core and pulp of pear fruit during development. (C) Organic acid contents between core and pulp of pear fruit. The asterisk denotes significant difference (p < 0.05) between core and pulp tissues of pear fruit; error bar determines ± SD of four replications.
Agronomy 12 01966 g001
Figure 2. Heatmap of relative mRNA level profiles for malate synthase- and degradation-related genes between core and pulp during fruit development. Maximum levels are denoted by red and minimum levels are denoted by yellow color boxes. Abbreviations: MS—Malate synthase; cMDH—cytosolic malate dehydrogenase; mMDH—mitochondrial malate dehydrogenase; ME—malic enzyme.
Agronomy 12 01966 g002
Figure 3. Heatmap of relative mRNA level profiles for citrate synthase- and degradation-related genes between core and pulp during fruit development. Maximum levels are denoted by red and minimum levels are denoted by yellow color boxes. Abbreviations: CS—Citrate synthase; ACL—ATP citrate lysase; ACO—aconitate hydrates.
Agronomy 12 01966 g003
Figure 4. Transcript comparison of di-carboxylate transporter genes for citrate and malate transport between pear core and pulp during pear fruit development. (A) Relative mRNA levels of genes related to di-carboxylate transporter (tDT), mitochondrial di-carboxylate carrier (DIC2), and di-carboxylate transporter (DIT2) in core and pulp. (B) Pearson correlation matrix between malate or citrate content and di-carboxylate transporter genes’ relative mRNA levels. The colored gradient legends represent coefficients of correlation r-values from +1.0 (dark green) to −1.0 (dark red). The asterisk denotes significant difference (p < 0.05); error bar determines ± SD of four replications.
Agronomy 12 01966 g004
Figure 5. Transcript comparison of aluminum-activated malate transporter genes (ALMTs) for citrate or malate accumulation between pear core and pulp during pear fruit development. (A) Relative mRNA levels of ALMT genes in core and pulp. (B) Pearson correlation matrix between malate or citrate content and ALMT genes’ relative mRNA levels. The colored gradient legends represent coefficients of correlation r-values from +1.0 (dark green) to −1.0 (dark red). The asterisk denotes significant difference (p < 0.05); error bar determines ± SD of four replications.
Agronomy 12 01966 g005
Figure 6. Transcript comparison of plasma membrane P3A-ATPases genes (PHs) for citrate or malate accumulation between pear core and pulp during pear fruit development. (A) Relative mRNA levels of PH genes in core and pulp. (B) Pearson correlation matrix between malate or citrate content and PH genes’ relative mRNA levels. The colored gradient legends represent coefficients of correlation r-values from +1.0 (dark green) to −1.0 (dark red). The asterisk denotes significant difference (p < 0.05); error bar determines ± SD of four replications.
Agronomy 12 01966 g006
Publisher’s Note: MDPI stays neutral with regard to jurisdictional claims in published maps and institutional affiliations.

