Article

Comparing Selection Criteria to Select Grapevine Clones by Water Use Efficiency

1
Departamento de Viticultura, Instituto de Ciencias de la Vid y del Vino (Gobierno de La Rioja, Universidad de La Rioja, CSIC), Finca La Grajera, Ctra. De Burgos Km 6, 26007 Logroño, Spain
2
INAGEA, Department of Biology, Universitat de les Illes Balears, cta. de Valldemossa Km 7.5, 07122 Palma de Mallorca, Spain
*
Author to whom correspondence should be addressed.
Agronomy 2022, 12(8), 1963; https://doi.org/10.3390/agronomy12081963
Submission received: 15 July 2022 / Revised: 5 August 2022 / Accepted: 13 August 2022 / Published: 19 August 2022
(This article belongs to the Special Issue Current Progress in Improving Water Use Efficiency of Vineyards)

Abstract

:
The current climate change is forcing growth-adapted genotypes with a higher water use efficiency (WUE). However, the evaluation of WUE is being made by different direct and indirect parameters such as the instantaneous leaf WUE (WUEi) and isotopic discrimination of carbon (δ13C) content of fruits. In the present work, WUE has been evaluated in these two ways in a wide collection of grapevine genotypes, including Tempranillo and Garnacha clones, and Tempranillo on different rootstocks (T-rootstocks). A total of 70 genotypes have been analysed in four experimental fields over two years. The parameters used to measure WUE were the bunch biomass isotopic discrimination (δ13C) and the intrinsic WUE (WUEi), defined as the ratio between net CO2 assimilation and stomatal conductance. The genotypes with the highest and lowest WUE were identified, differences between them being found to be of more than 10%. Generally, the two parameters showed coincidences in the clones with the highest and lowest WUE, suggesting that both are valuable tools to classify genotypes by their WUE in grapevine breeding programs. However, δ13C seemed to be a better indicator for determining WUE because it represents the integration over the synthesis time of the sample analysed (mainly sugars from ripening grapes), which coincides with the driest period for the crop. Moreover, the WUEi is a variable parameter in the plant and it is more dependent on the environmental conditions. The present work suggests that carbon isotopic discrimination could be an interesting parameter for the clonal selection criteria in grapevines by WUE. The main reasons were its better discrimination between clones, the fact that sampling is less time-consuming and easier to do than WUEi, and that the samples can be stored for late determinations, increasing the number of samples that can be analysed.

1. Introduction

Grapevine is a traditional Mediterranean crop with a long history that completes its biological cycle during the driest and warmest months of the year. Vine cultivation is mainly located in semi-arid areas with an irrigation water contribution that implies the over-exploitation of available water [1,2]. Furthermore, climate change is causing more frequent and longer droughts and heatwaves combined with increasingly unpredictable torrential rainfall that reduces the actual soil available for the vines [3,4]. These grounds lead to troubling situations of economic and environmental conflict.
Spain is the country with the largest viticulture area in the world and is the third-biggest wine producer [5], predominantly in a Mediterranean climate where the irrigated vineyard area was 41.5% in 2021, 0.3% higher than in the previous year [6]. Consequently, current data and future predictions point to the important need to optimise irrigation water use to improve environmental sustainability and the economic balance of the crop.
Water use efficiency (WUE) in grapevine is a major topic in applied and fundamental research [7]. The research for drought-adapted cultivars and clones will become an indispensable requirement in semi-arid conditions. Previous work demonstrated the variability of WUE between cultivars and clones [8,9,10,11,12,13].
The favourable results in classic genetic selection, the existence of a very wide diversity of cultivated grapevine varieties [14,15] and the continuous progress in genomics [16] offer the genus vitis a wider genetic range to adapt grapevines to situations of increased water stress [17]. This background, coupled with continuous technological progress, offers the necessary conditions to find more drought-adapted grapevine genotypes.
Nowadays, the application of genomic and genetic engineering tools makes it very attractive for grape breeding due to the long time needed with traditional methods [18]. The utilization of molecular markers can easily identify quantitative trait loci (QTL) that affect traits of interest to accelerate the introduction in host plants using the backcrossing method [19]. The breeding method is assisted by molecular markers. Genetic engineering could make it possible to obtain new varieties/clones with, for example, high yield, disease resistance, different sugar content, early maturity, or drought tolerance [20]. Until now, very little progress has been seen in new commercial varieties.
In recent decades, the main selection programs developed were focused on clonal selection inside the more commercial varieties because of the legal frameworks of wine protection. Breeding new varieties would require a long administrative process and acceptance by regulatory boards and consumers. In contrast, the selection of clones within an authorised variety was immediately accepted [14].
One of the problems in the selection of genotypes by WUE is how to estimate this parameter. Conceptually, WUE reflects the balance between carbon gains and water loss. This balance can be measured at different levels from leaf instantaneous gas fluxes to plant production [21]. At the leaf level, the ratios between CO2 assimilated (AN) and transpiration (E) or stomatal conductance (gs) determine the WUE of the plant. “Intrinsic water use efficiency” is determined by factors that the plant can control (AN/gs, WUEi), less influenced by environmental conditions than the “instantaneous water use efficiency” (AN/E, WUEinst) [22].
These leaf determinations should be taken as representative of the water efficiency over the plant cycle. It is a selection criterion with a clear physiological basis, even though the daily and seasonal measurements of WUEi are “instantaneous”. To overcome these limitations, biomass determination of stable carbon isotope abundance, in particular the 13C ratio, was proposed as a reliable indicator of WUE [23,24,25].
Photosynthetic processes discriminate between the 12C and 13C isotopes due to their different diffusion between the atmosphere and chloroplasts. This discrimination against 13C (δ13C) also occurs in the ribulose biphosphate carboxylase/oxidase (RuBisCo) reaction catalysed by the Rubisco enzyme and is attenuated when the CO2 concentration in chloroplasts decreases due to stomatal closure. In consequence, the differential proportion of carbon isotopes in plant dry matter results in an integrative estimate of the relationship between photosynthetic rate and stomatal aperture (WUEi) throughout the synthesis period of the analysed biomass [25].
Tempranillo and Garnacha are among the most widely cultivated varieties in Spain [14]. In addition, the use of drought-tolerant rootstocks in grapevine helps minimise the effect of water stress through improved water uptake and transport [26], also controlling plant transpiration through chemical response [27] and hydraulic signalling [28].
Measurements of δ13C and WUEi have been used in previous work as indicators of WUE in the grapevine [12,13,23,29]. In this context, the objectives of this work were: (i) Analyse the variability of WUE between clones of the Garnacha and Tempranillo cultivar and Tempranillo on different rootstocks (T-rootstocks), (ii) Evaluate the discrimination capacity of WUEi and 13C isotopic ratio in two years of field-growing vines data and, (iii) Compare both parameters as operative selection criteria by their interest in grapevine clone breeding.

2. Materials and Methods

2.1. Experimental Sites and Plant Material

The experiment was carried out in four experimental plots: two located in Logroño (La Rioja, Spain), one in Haro (La Rioja, Spain) and the last one in Miranda de Arga (Navarra, Spain). In total, 58 clones of two cultivars (Garnacha and Tempranillo) and 12 genotypes of rootstocks on Tempranillo (T-rootstocks) were measured over two years (2015 and 2018). Clone groups were randomly distributed in each experimental plot.
In each field, leaf gas exchange measurements (WUEi) were realised in August and berry samples (δ13C) were collected at maturity in September and October. The environmental conditions of the climatic stations closest to the experimental fields were described in the two years of study (Table 1). Data were collected and averaged by month from 1 April to 31 October. Growing degree days (in °C day−1) were calculated as daily Tmean – Tbase (only positive values, Tbase = 10 °C), and reference evapotranspiration (ET0) was calculated using the Penman–Monteith method [30,31].

2.2. Leaf Gas Exchange Measurements

Instantaneous leaf gas exchange measurements were done using an open infrared gas analyser system (Li-6400xt; Li-Cor, Inc. Lincoln, NE, USA). Leaf net photosynthesis (AN) and stomatal conductance (gs) were measured in a fully exposed mature leaf (one measure per plant and 4–6 plants per clone). The CO2 concentration reference was 400 µmol CO2 mol−1 air with a flow rate of 350 µmol (air) min−1. All the measurements were always taken above the 1500 µmol m2 s−1 active photosynthetic radiation (PAR) between 10:00 and 13:00 (local time) using a 6 cm2 chamber [13]. Intrinsic water use efficiency (WUEi) was calculated as the AN and gs ratio.

2.3. Carbon Isotope Ratios

The carbon isotope ratio (δ13C) was determined from samples of 30 berries/plants collected at harvest, at the same plants measured for WUEi (4–6 plants per clone). Berry samples were oven-dried (taking the seed out) and δ13C was analysed in 2 ± 0.1 mg aliquots of berry powder samples (Thermo Flash EA 1112 Series) [23]. Determinations of δ13C were carried out using an Elemental analyser (NC2500, Carlo Erba Reagents) coupled to an isotope ratio mass spectrometer (Thermoquest Delta Plus, ThermoFinnigan). The carbon isotope ratio was expressed as δ13C = [(Rs − Rb)/Rb] × 1000 [25], where Rs is the ratio 13C/12C of the sample. Rb is the 13C/12C of the PDB (PeeDee Belemnite) standard (0.0112372) and was measured every seven samples.

2.4. Statistical Analysis

Every cultivar and plot was analysed independently due to their differences in climate, soil, crop management, vine characteristics, etc. Two-way analysis of variance (ANOVA) was used to evaluate the effects of the factors and their interactions on all the variables measured and calculated (Table 2). Then, the WUEi–δ13C regressions obtained in each group were demonstrated. Seven separated (one per group) one-way ANOVAs were performed to check where the parameters were significant. Distribution and homoscedasticity were analysed using the Shapiro–Wilk test and Levene’s statistic. When differences were found, a post-hoc test (Duncan) was applied to determine which genotypes were different and estimate a ranking [32]. Data analyses were performed with SPSS 22.0 (IBM Corp., Armonk, NY, USA). Any differences were accepted with a p-value > 0.05.

3. Results

3.1. Comparison of Fields and Year Effect

The climatic data of the areas of the experimental plots were analysed: three fields located in the region of La Rioja and the other in the region of Navarra, both located in the north of Spain (Table 1). La Grajera and Vitis Provedo fields were located in Logroño (La Rioja), and the third one in Haro (West of La Rioja), near Roda’s winery. Vitis Navarra was located near Larraga, Navarra. All fields were characterised by a Mediterranean climate, with a warm and low rainfall in summer. Roda’s plot is characterised by a less warm summer, with a 10% lower accumulation of growing degrees. Generally, Vitis Navarra had less precipitation and drier climate conditions. In 2018, there was a precipitation increase of 129% in La Grajera and Vitis Provedo, 67% in Roda and 77% in Navarra fields (compared with 2015). Nevertheless, GDD, ET0 and temperatures remained very stable between the two years.
Stomatal conductance is determined by plant water status and, at the time, determines WUE [33]. For this reason, the water status was estimated as gs for all the plots and cultivars (Table 2). The La Grajera farm showed higher water stress (gs < 0.1 mol H2O m−2 s−1) in both years. Interestingly, the difference in rainfall does not determine the water status of the plants between plots in the same year. Roda’s field (2018) showed a higher stomatal conductance, reaching values close to 0.5 mol H2O m−2 s−1.
Significant differences in gs and WUEi were observed between fields, cultivars and years. Comparing the average water status between the two years, there was an increase (2018 reached 2015) in stomatal conductance (+87%) and, therefore, a significant decrease in WUEi (−59%).
Even though there was a large range of gs in the experimental fields, a good correlation (R2: 0.7686) was founded between ln WUEi and gs values in all groups, plots and years analysed (Figure 1).

3.2. Genotypic Characterisation of WUE

Due to the high variability in water status between plots and years (Table 2), an independent analysis was carried out for each field, year and cultivar. Table 3 shows the average WUEi data of the clones analysed by year, cultivar and plot. Letters represent significant differences between genotypes (p-value < 0.05). A total of seven independent analyses were carried out. Only Tempranillo’s cultivar in Vitis Provedo (2015) showed non-significant differences between clones in WUEi. For the WUEi, a maximum value of 143.1 mmol CO2 mol−1 H2O and a minimum of 40.8 mmol CO2 mol−1 H2O were obtained at 1048 clone (Tempranillo, La Grajera) in 2015 and 137 clone (Tempranillo, Roda) in 2018, respectively. Great variability was observed between clones of the same group, for example, between the genotype 140RU and RG9 (T-rootstocks, 2018), where the percentage increase was 91.55%.
The same statistical analysis was performed with the δ13C data (Table 4). Significant differences in 13C content between clones were observed in all groups. The mean values of 13C have a range of 8 ‰, including values between −21.5 ‰ (clone RG8, T-Rootstocks, 2018) and −29.4 ‰ (clone 807, Tempranillo, La Grajera, 2015).
Integrating both parameters, the high efficiency of Tempranillo clones 807 was clearly shown (La Grajera, 2015), as well as that of VN32 (Vitis Navarra, 2015), 1048 (La Grajera, 2018) and six (Roda, 2018), that of the Garnacha clone ENTAV 136 (Vitis Navarra, 2018) and the T-rootstock clone RG2 (Vitis Navarra, 2018). In addition, some genotypes stand out for their low WUE, including Tempranillo clones 1084 (La Grajera, 2015) and 137 (Roda, 2018), the Garnacha clone EV15 (Vitis Navarra, 2018) and the T-rootstock clone RG8 (Vitis Navarra, 2018).
An integrator value was obtained for the genotype in each group by adding the proportional distribution of the relative standard deviation of the values obtained in WUEi and δ13C. With this method, it was possible to define water efficiency for each clone according to the values obtained for both parameters. The clones were defined as very efficient (residual > 15%), efficient (15 to 5%), normal (5 to −5%), inefficient (−5 to −15%) or very inefficient (<−15%), depending on the values obtained of the calculated percentages. Of the 70 clones analysed, 14 showed to be very efficient and 21 to be very inefficient. 1048 genotype (Tempranillo) was defined as a very efficient genotype in both years. In the Tempranillo cultivar (largest number of clones analysed), very efficient genotypes in water use efficiency were 814 and 1048 (La Grajera, 2015), VN32 (Vitis Navarra, 2015), VP25 (Vitis Provedo, 2015), 1048 (La Grajera, 2018) and 6, 178, 203 and 336 (Roda, 2018). In contrast, genotypes defined as very inefficient were 1041, 1084, 1089 and RJ51 (La Grajera, 2015), VN33 and VN69 (Vitis Navarra, 2015), RJ43 and VP11 (Vitis Provedo, 2015), 1084 and 1371 (La Grajera, 2018) and 108, 137,156,166 and 243 (Roda, 2018). In the Garnacha cultivar (Vitis Navarra, 2018), the genotype defined as very efficient was ENTAV 136, and the very inefficient ones were ARA-24, EV15 and RJ21. The T-rootstock genotypes (Vitis Navarra, 2018), clones defined as very efficient were 1103P, RG2, RG7 and RG9. In contrast, the very inefficient ones were 140RU, RG3 and RG8.

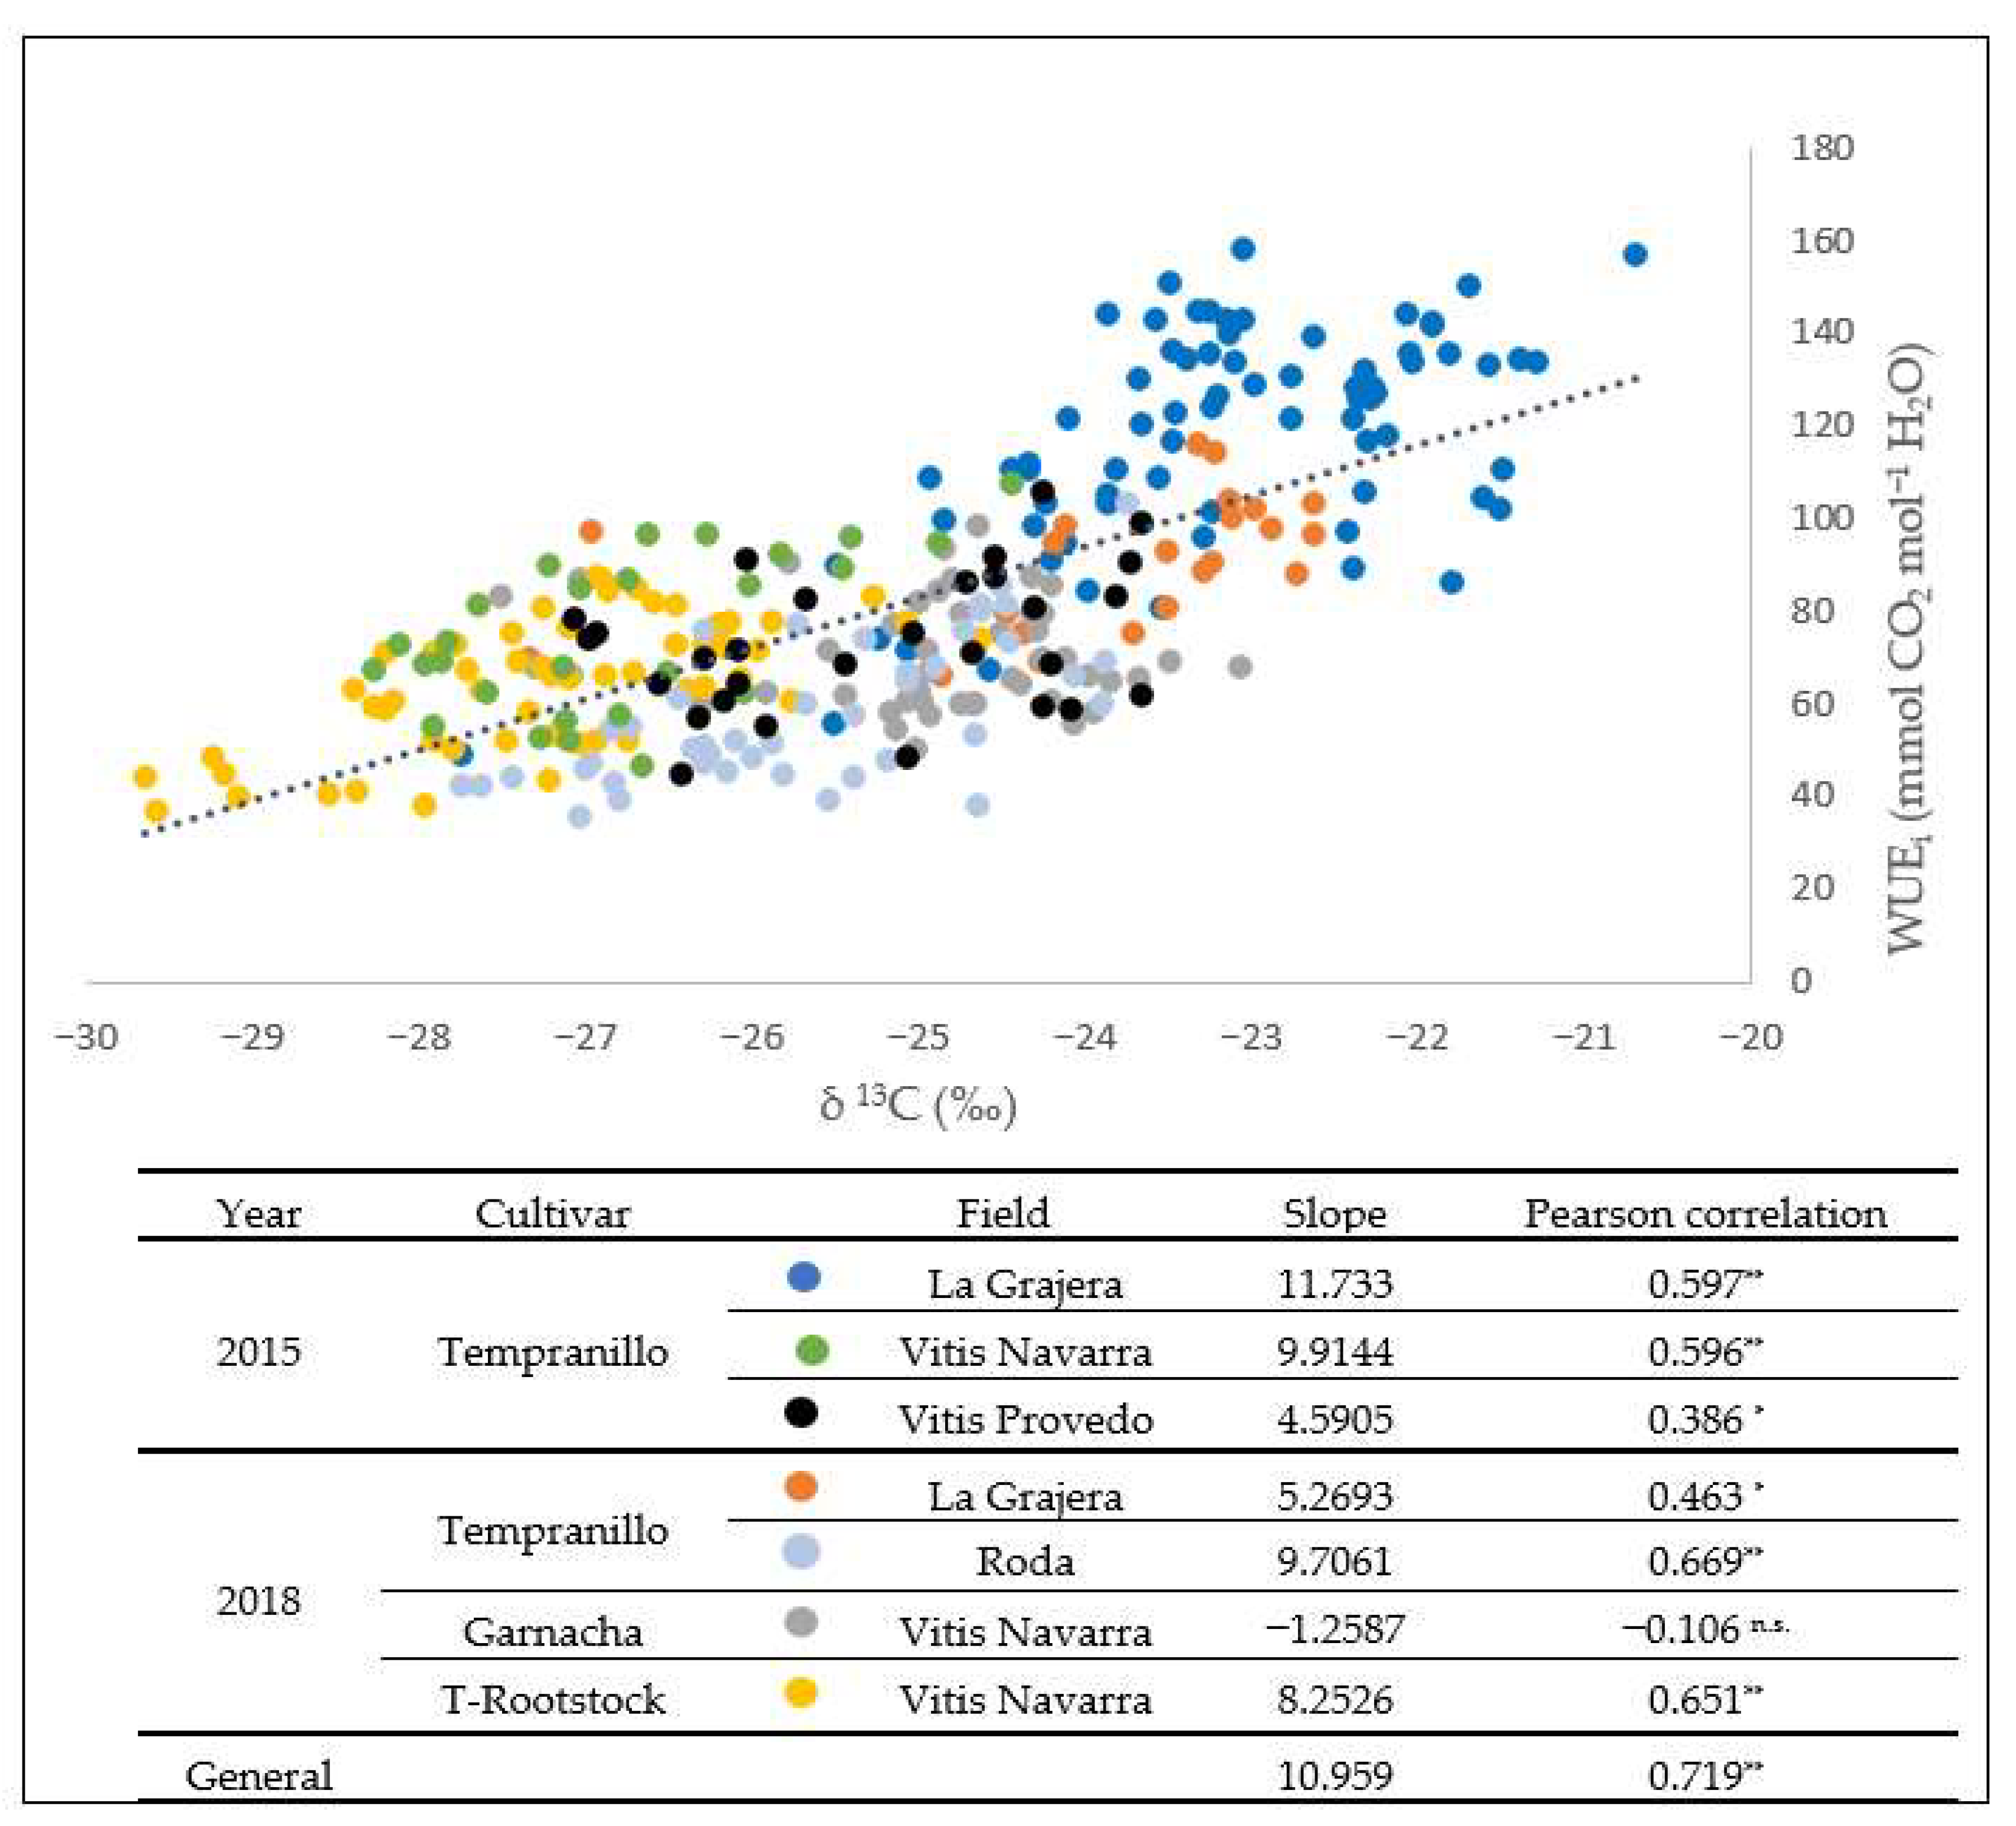
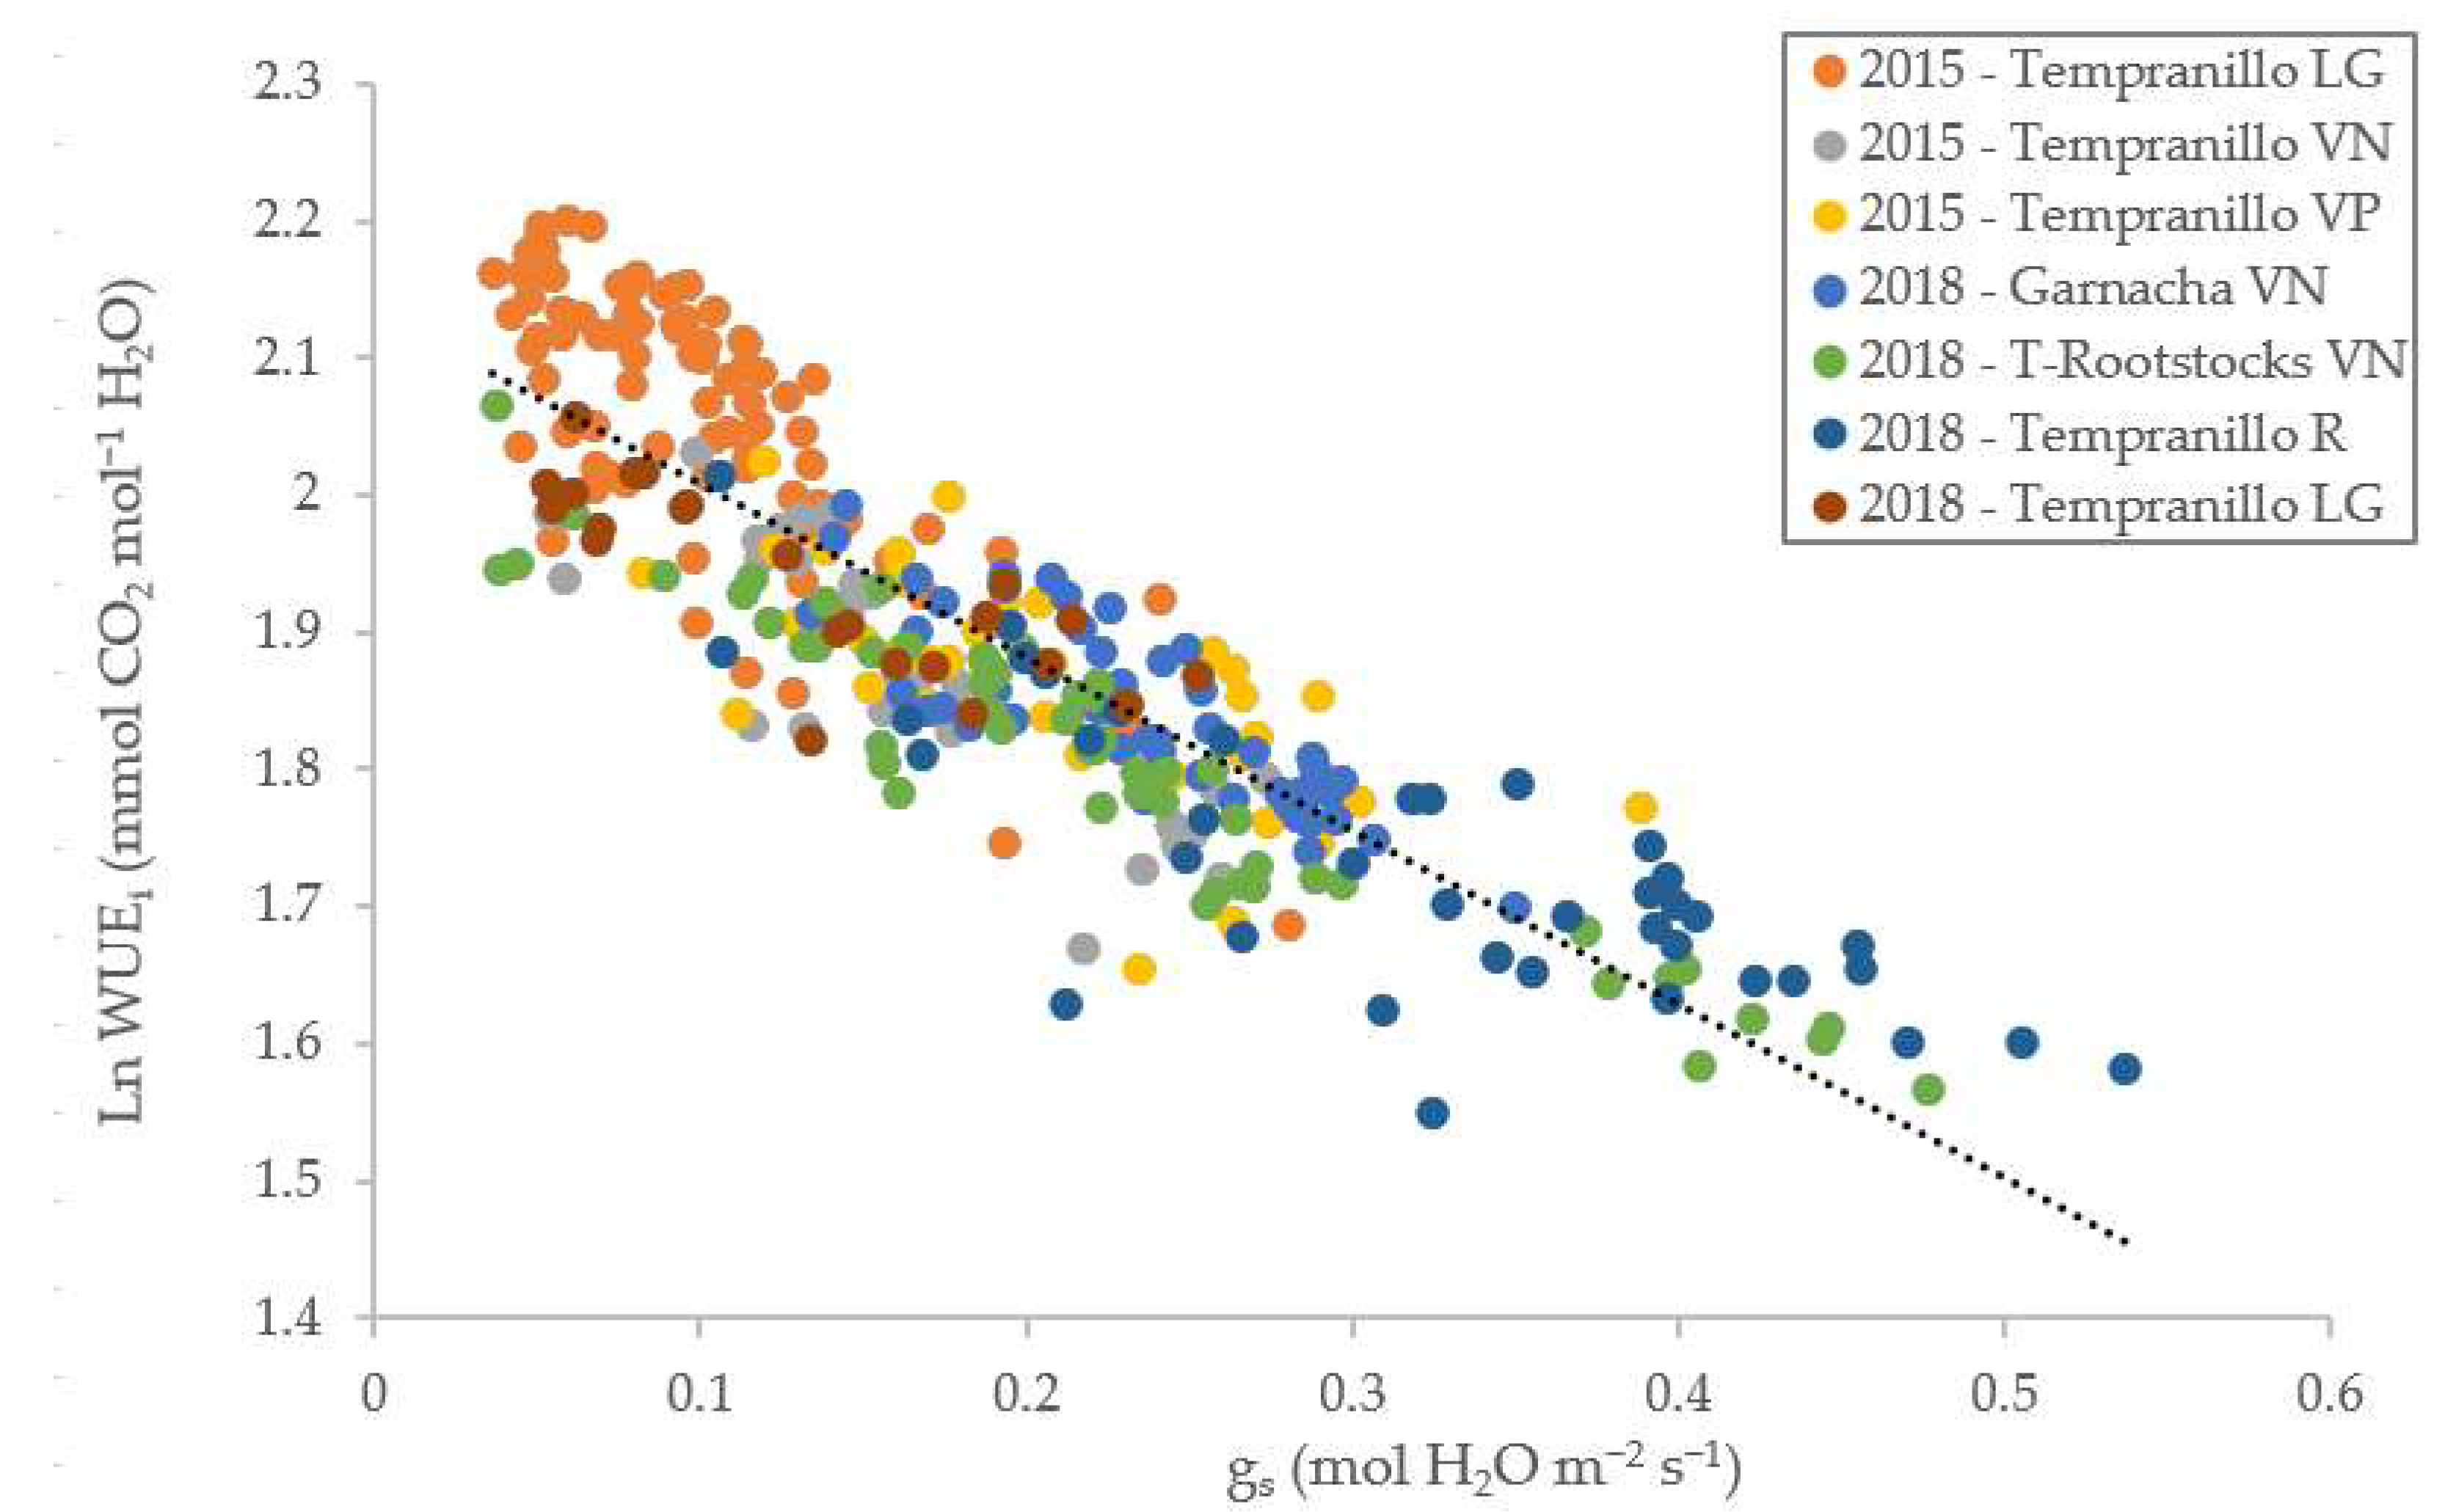
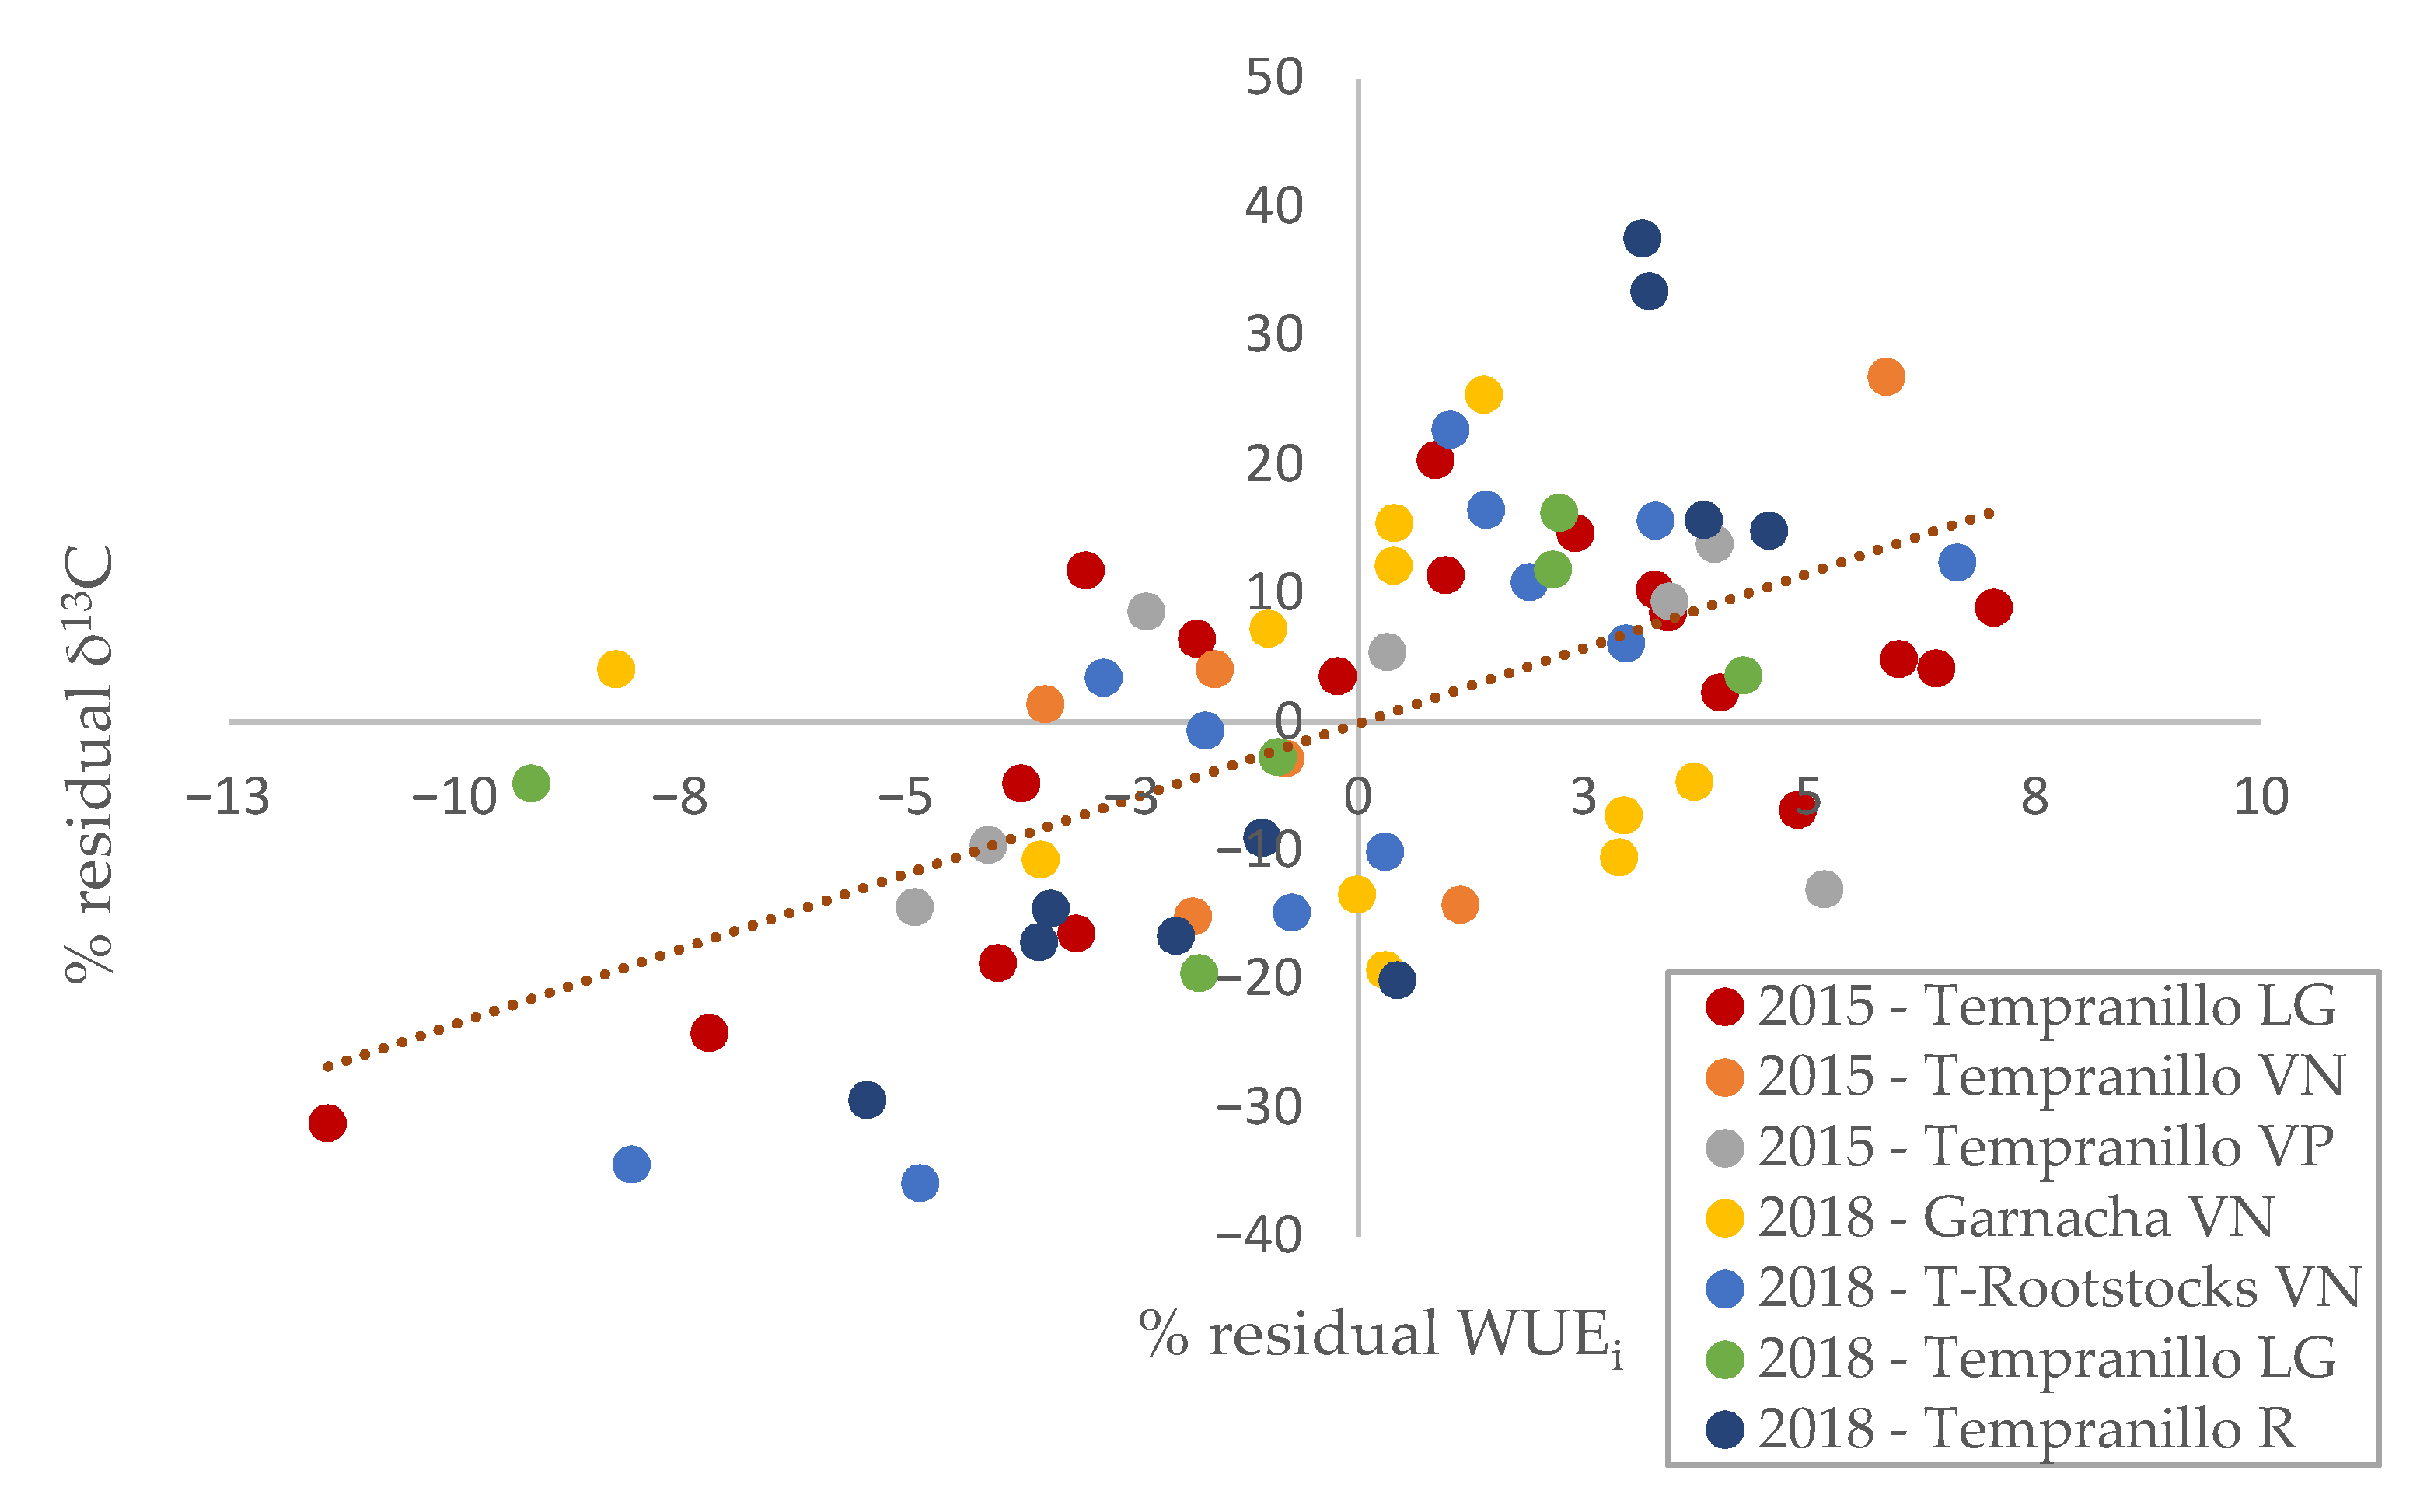
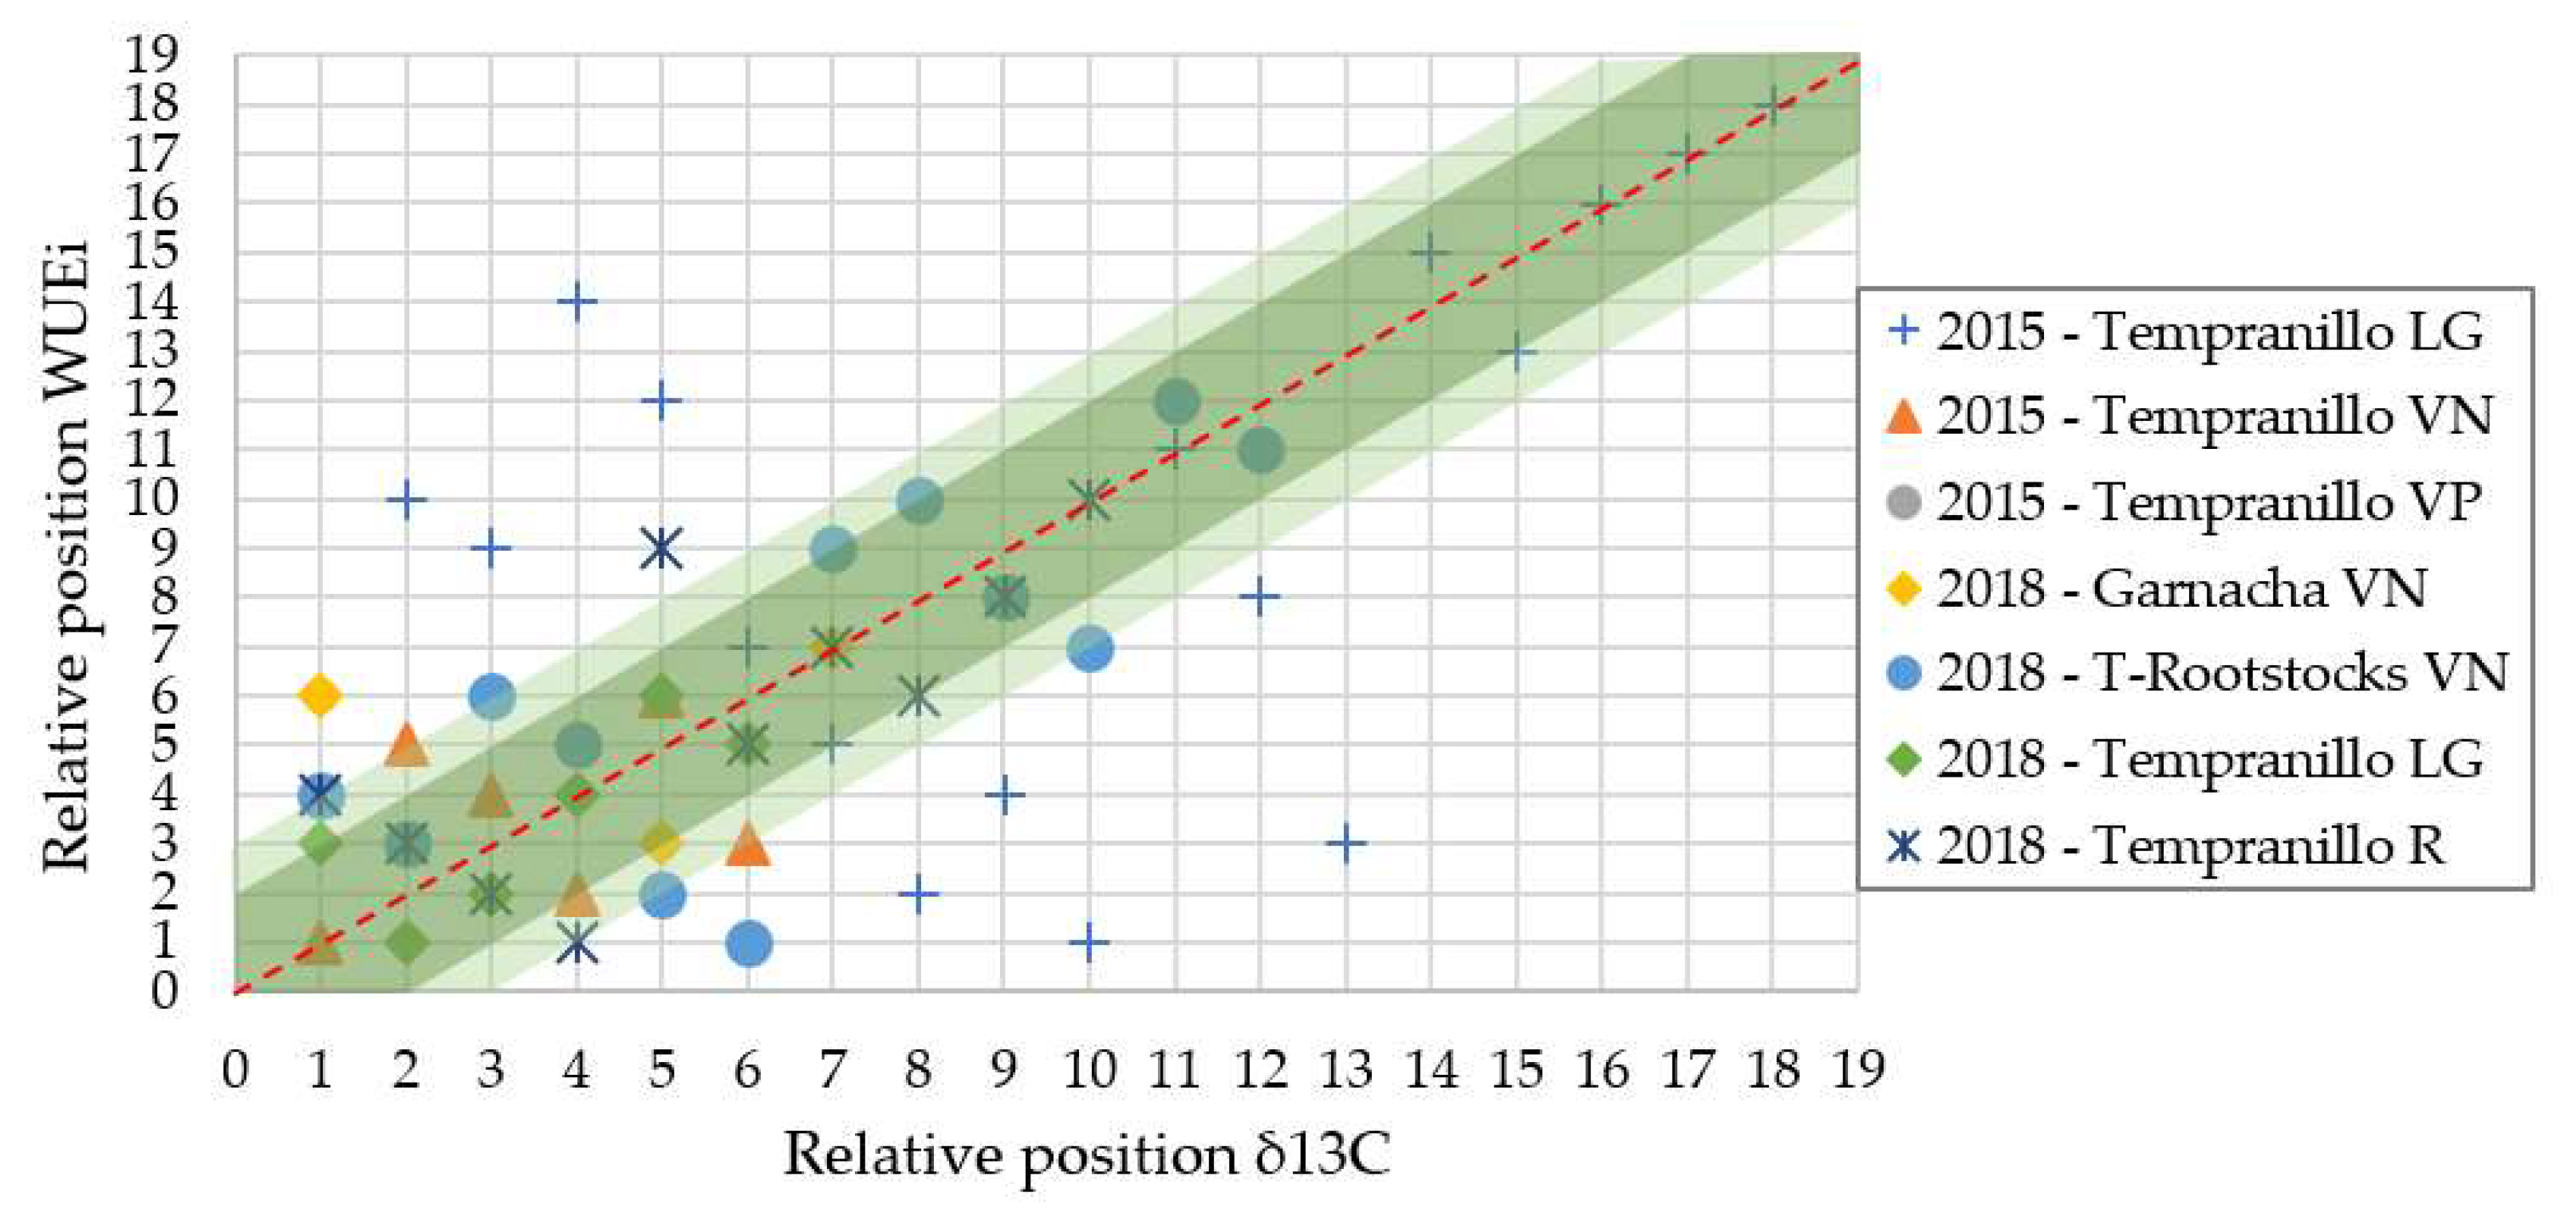
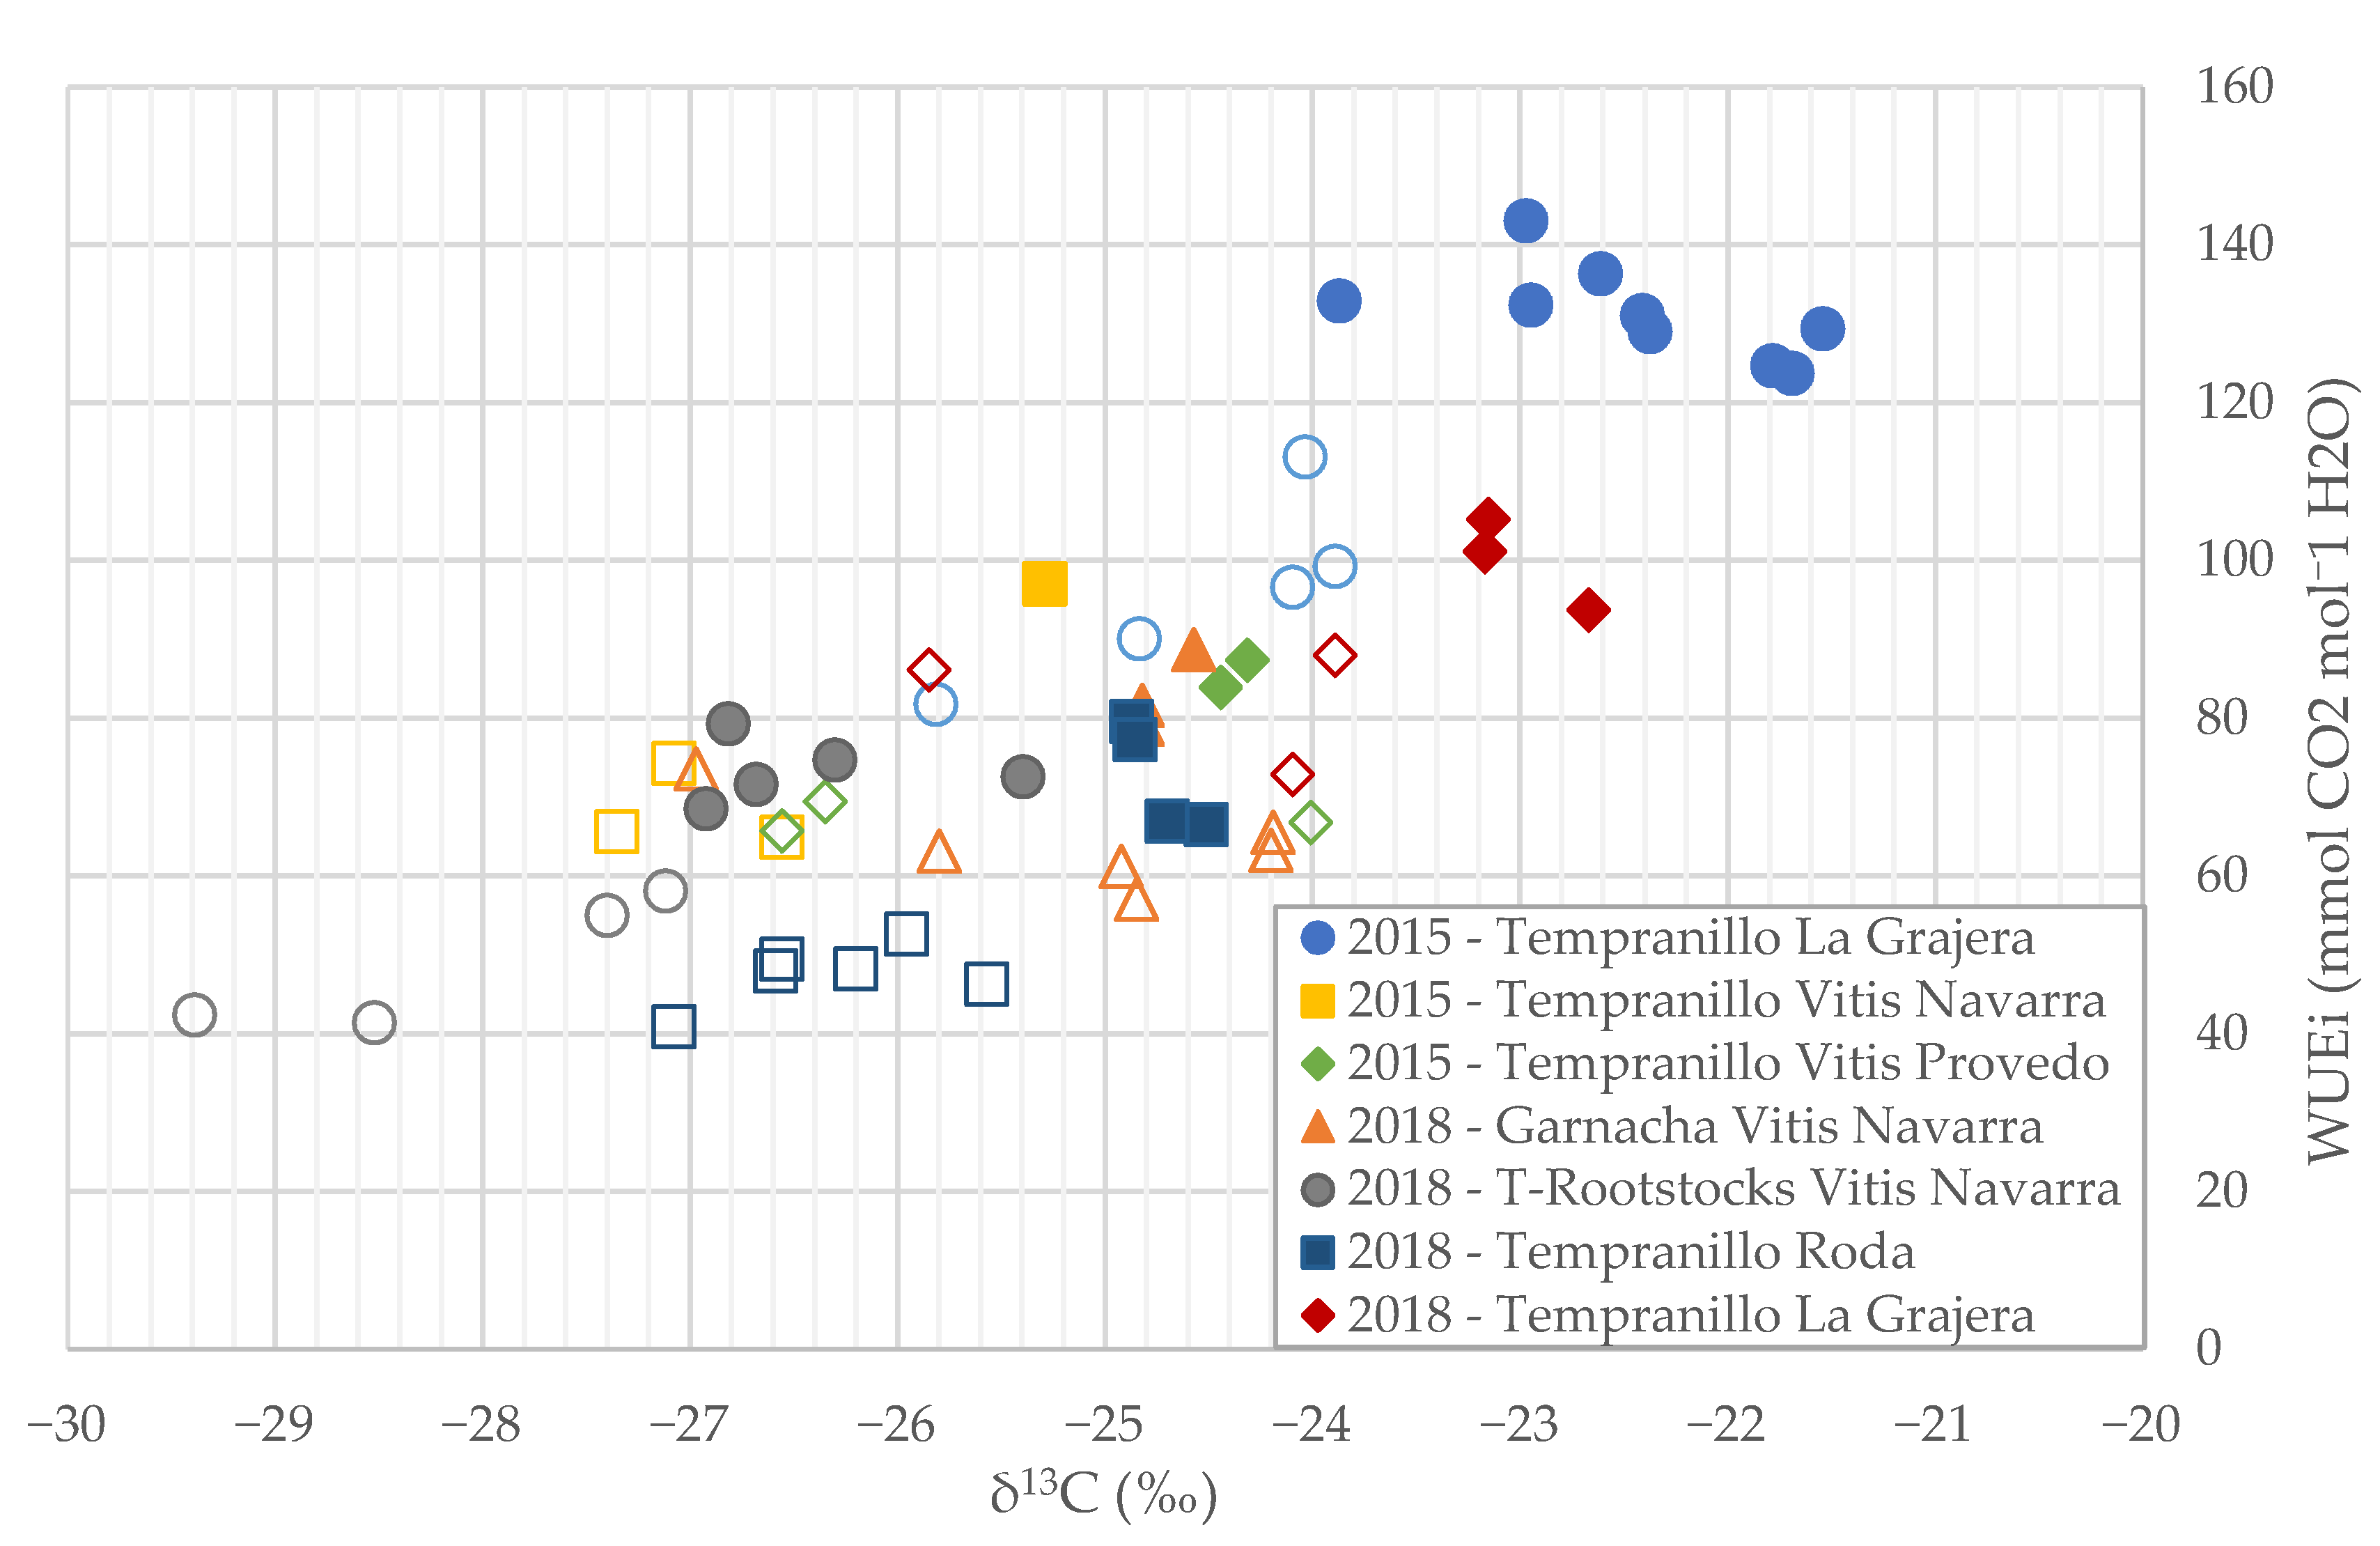
3.3. Ability of δ13C and Leaf Gas Exchange Values to Measure WUE

The relationship between values of the two estimates of the WUE was analysed in Figure 2 which represents the relationship between δ13C and WUEi values among the seven groups of genotypes analysed. A significant relationship (Pearson correlation of 0.699) was observed between both parameters (p-value < 0.05). Only in the Garnacha cultivar of Vitis Navarra (2018) was this relationship insignificant.
A good correlation was also shown for the values of the residual percentages between the δ13C and WUEi (Figure 3). The WUEi percentages have a larger range of oscillation, reaching 37.5% compared to 11.4% for δ13C. Of the 70 genotypes analysed, 17 did not match the trend of the mean values of the residual percentages. Interestingly, 6 of the 11 clones of the Garnacha cultivar (Vitis Navarra, 2018) did not follow the general trend. However, there was a great general relationship (Pearson correlation of 0.585; p-value < 0.01) between the residual percentages of the parameters.
Once the genotypes were ranked by WUEi or δ13C, their relative position was quite coincident for both parameters. As shown in (Figure 4), each genotype value was correlated according to its value in both parameters (WUEi and δ13C). Interestingly, 83% of the genotypes were positioned in close to three positions in both parameters and 71% of genotypes in less than two positions. In general, there was a good correlation in the relative position of genotypes classified as best and worst according to the WUE.
The correspondence between the δ13C and WUEi values was also analysed for the values of the genotypes defined according to their efficiency (Figure 5). The clones defined as efficient (formed by the very efficient and efficient genotypes) were located in areas with lower 13C discrimination and higher WUEi than the inefficient ones (formed by the very inefficient and inefficient genotypes). In general, in each subgroup, the 13C discrimination values showed a greater range of values for very similar WUEi values. This fact induces a better identification of better and poorer clones in WUE.

4. Discussion

The genotype selection by WUE presents crucial limitations due to the difficulties of estimating the WUE of the whole plant. This difficulty has been reflected in other works with other grapevine cultivars and treatments [7,8,10,34,35].
Nevertheless, previous work demonstrated the existence of genetic variability in WUE determined as instantaneous values of WUEi between vine varieties and between clones of the Tempranillo cultivar [8,12,36]. The demonstration of this variability opens the way to initiate a breeding program to identify genotypes with higher (or lower) WUE. In this sense, recent works found differences in clones by WUE belonging to different years and locations [13,36].
The δ13C is a reputed parameter which enables to scale up from the water status of the plant [37,38]. At least conceptually, it shows the advantage of providing an overall WUE to be an integrator value over the synthesis period of the analysed biomass [23,25,29,39]. Nevertheless, their representativeness sometimes seemed to be questionable [10,40].
The present study analyses the relationship between δ13C and WUEi values of each genotype and evaluates whether each parameter was representative of the WUE. The values of both parameters were in the same range as those obtained in different previous research [10,12,13,29,36].
The relationship between the conductance and logarithm of WUEi (Figure 1) followed the expected distribution according to Tortosa et al. [36]. The genotypes analysed in 2015 had moderate (gs < 0.15) and severe water stress (gs < 0.05) caused by low precipitation (Table 1) in the summer months [41]. This fact causes a high WUEi value due to the strong association between gs and WUEi [8,33]. The high variability between the strains and fields led to a high correlation (R2 = 0.77) between the values.
The results obtained between clones have the same ranges of values as those obtained in the work of Buesa et al. [13] and Tortosa et al. [36]. As expected, the same high and low WUE genotypes were identified in both parameters.
This study is pioneering in carrying out a detailed comparison of the two parameters for measuring the discriminative ability of the WUE. A good relationship (Pearson correlation = 0.719) between δ13C and WUEi was found (Figure 2) in consensus with previous works [23,42,43]. The represented points did not fit the line more closely due to the differences between the different conditions of the experimental years and the differences in field management. The wide range in water status (gs: <0.05 to >0.5) was reflected in a large range of δ13C values (−20.7‰ to −29.7‰). Differences between cultivars in the same plot (Garnacha and T-rootstock) and intra-cultivar in other plots (Tempranillo in Roda and La Grajera) were greater in δ13C values. The Garnacha genotypes (2018) did not show the relation between parameters, obtaining a cloud of points with less variation in the WUEi range (60–80 mmol CO2 mol−1 H2O) than in δ13C values (from −27‰ to −23.5‰). WUEi does not always reflect the WUE of the whole plant [10,44].
The residual rate of WUEi tends to have a higher error (Figure 3) due to the high variability mentioned [44]. This fact may be due to the unique characteristics of each sampled plant within the crop [45,46], which results in a bigger oscillation in WUEi values. For this reason, a single sampling of leaf gas exchange may be insufficient to define the WUE of the plant.
In this study, the δ13C data showed differences in WUE between plots and cultivars that had not been observed in WUEi (Figure 2 and Table 3 and Table 4). WUEi data were representative of the time of measurement and, therefore, of the environmental conditions and plant water status at the measurement time. In contrast, 13C isotopic discrimination was an accumulative parameter over the time of formation of the dry mass analysed [39,47]. For this reason, the analyses of the berries in the ripening phase (synthesis and accumulation of sugars) resulted in a good estimation of WUE because they reflected the plant water deficit during the driest period [23,48].
WUEi and δ13C methods can discriminate between the best and worse genotypes in WUE (Figure 5) [13]. Nevertheless, 13C discrimination analyses showed a better resolution for WUE clone identification, which could be related to a wider range of its values among the efficient and inefficient genotypes. Consequently, this parameter allowed a better clone identification of WUE in breeding programs.
Moreover, the choice of analysing grape samples for δ13C could be an interesting alternative for clone selection programmes because it reflects the average economy of the water use during the synthesis process of the dry mass analysed [13,23]. Furthermore, 13C isotope discrimination analysis is much easier to carry out under field conditions, because it only required a representative sampling of berries and provided an integrated WUE value over 1–2 months of berry filling that coincided with the water stress moment [24,49].
Moreover, the measurement of WUEi has some technical inconveniences: specialised instrumentation, a longer time-consuming measurement which was limited to certain hours of the day, dependent on environmental conditions [36], and large differences rates in the plant [44,45,46]. These reasons make data collection somewhat difficult and limit the number of samples that could be collected in a day. In contrast, the δ13C parameter shows the advantage that the number of collected samples can be much higher. Moreover, the sample collection was easier and was not dependent on environmental conditions.

5. Conclusions

The analytical methodology used allowed a fair evaluation of WUE in 70 genotypes of two cultivars (Tempranillo and Garnacha) and a collection of T-rootstock clones. The field experiment was based on 13C discrimination and leaf gas exchange (WUEi) values. Clones with high and low WUE were defined based on both parameters. Furthermore, a good correlation between the two parameters was obtained, indicating that both parameters were good indicators to define WUE.
This work provides results to estimate that carbon isotopic discrimination was a more interesting parameter than WUEi. The main reason was that the δ13C found differences in the groups that the WUEi values could not. In addition, this parameter had a high resolution defining WUE among clones of the same group and between different groups.
In addition, the analysis of 13C berry samples offers other technical advantages such as the possibility to collect a larger number of samples in one day, which can be stored for later measurements, avoiding the problems derived from the instantaneous measurement, the independence of environmental and day conditions, and the integration of the WUE over the berry filling period.

Author Contributions

Data curation, I.T., C.D., A.P. and A.M.; formal analysis, I.T., C.D.; funding acquisition, J.M.E. and H.M.; methodology, J.M.E. and H.M.; project administration, J.M.E.; writing—original draft, A.M. and H.M.; writing—review and editing, A.M., H.M. and A.P. All authors have read and agreed to the published version of the manuscript.

Funding

This work was carried out with financial support from the Spanish Ministry of Science and Technology (FEDER/Ministerio de Ciencia, Innovación y Universidades–Agencia Estatal de Investigación/_AGL2017-83738-C3-1-R) and a pre-doctoral fellowship (PRE2019-089110) with a narrow collaboration inside the Associated Unit ICVV-INAGEA.UIB.

Data Availability Statement

Not applicable.

Acknowledgments

The authors would like to thank M. Ribas-Carbó and collaborators of the UIB for their support in δ13C measurements. We also want to thank the collaboration of the Instituto de las Ciencias de la Vid y el Vino (ICVV) and Viveros Provedo S.A, Bodegas Roda S.A. y Vitis Navarra Seleccion S.I. for providing us the plant material.

Conflicts of Interest

The authors declare no conflict of interest. The funders had no role in the design of the study; in the collection, analyses, or interpretation of data; in the writing of the manuscript, or in the decision to publish the results.

References

  1. Medrano, H.; Tomás, M.; Martorell, S.; Escalona, J.M.; Pou, A.; Fuentes, S.; Jaume, F.; Bota, J. Improving water use efficiency of vineyards in semi-arid regions. Agron. Sustain. Dev. 2015, 35, 499–517. [Google Scholar]
  2. Flexas, J.; Galmés, J.; Gallé, A.; Gulías, J.; Pou, A.; Ribas-Carbó, M.; Medrano, H. Improving water use efficiency in grapevines: Potential physiological targets for biotechnological improvement. Aust. J. Grape Wine Res. 2010, 16, 106–121. [Google Scholar]
  3. Jones, G.V.; Reid, R.; Vilks, A. Climate, Grapes, and Wine: Structure and Suitability in a Variable and Changing Climate; The Geography of Wine, Ed.; Academic Press, Springer: Dordrecht, The Netherlands, 2012; pp. 109–133. [Google Scholar]
  4. Collins, M.; Knutti, R.; Arblaster, J.; Dufresne, J.L.; Fichefet, T.; Friedlingstein, P.; Gao, X.; Gutowski, W.J.; Johns, T.; Krinner, G.; et al. Long-term Climate Change: Projections, Commitments and Irreversibility. In Climate Change 2013—The Physical Science Basis: Contribution of Working Group I to the Fifth Assessment Report of the Intergovernmental Panel on Climate Change; Stocker, T.F., Qin, D., Plattner, G.-K., Tignor, M.M.B., Allen, S.K., Boschung, J., Nauels, A., Xia, Y., Bex, V., Midgley, P.M., Eds.; Cambridge University Press: New York, NY, USA, 2013; pp. 1029–1136. [Google Scholar]
  5. OIV (International Organisation of Vine and Wine). State of the World Vitivinicultural Sector in 2020. 2020. Available online: https://www.oiv.int/public/medias/8731/oiv-state-of-the-world-vitivinicultural-sector-in-2020.pdf (accessed on 6 April 2022).
  6. Encuesta Sobre Superficies y Rendimientos Cultivos (ESYRCE). Available online: https://www.mapa.gob.es/es/estadistica/temas/estadisticas-agrarias/agricultura/esyrce/ (accessed on 1 April 2022).
  7. Medrano, H.; Pou, A.; Tomàs, M.; Martorell, S.; Escalona, J.M.; Gulias, J.; Flexas, J. Improving water use efficiency in grapevines: Agronomic and biotechnological approaches. Acta Hortic. 2012, 931, 97–107. [Google Scholar]
  8. Bota, J.; Tomás, M.; Flexas, J.; Medrano, H.; Escalona, J.M. Differences among grapevine cultivars in their stomatal behavior and water use efficiency under progressive water stress. Agric. Water Manag. 2016, 164, 91–99. [Google Scholar]
  9. Romero, P.; Navarro, J.M.; Ordaz, P.B. Towards a sustainable viticulture: The combination of deficit irrigation strategies and agroecological practices in Mediterranean vineyards. Agric. Water Manag. 2022, 259, 107216. [Google Scholar]
  10. Tomás, M.; Medrano, H.; Escalona, J.M.; Martorell, S.; Pou, A.; Ribas-Carbó, M.; Flexas, J. Variability of water use efficiency in grapevines. Environ. Exp. Bot. 2014, 103, 148–157. [Google Scholar]
  11. Van Leeuwen, C.; Roby, J.P.; Alonso-Villaverde, V.; Gindro, K. Impact of clonal variability in Vitis vinifera Cabernet franc on grape composition, wine 33 quality, leaf blade stilbene content, and downy mildew resistance. J. Agric. Food Chem. 2012, 61, 19–24. [Google Scholar]
  12. Tortosa, I.; Escalona, J.M.; Bota, J.; Tomas, M.; Hernandez, E.; Escudero, E.G.; Medrano, H. Exploring the genetic variability in water use efficiency: Evaluation of inter and intra cultivar genetic diversity in grapevines. Plant Sci. 2016, 251, 35–43. [Google Scholar]
  13. Buesa, I.; Escalona, J.M.; Tortosa, I.; Marín, D.; Loidi, M.; Santesteban, L.G.; Medrano, H. Intracultivar genetic diversity in grapevine: Water use efficiency variability within cv. Grenache. Physiol. Plant. 2021, 173, 2226–2237. [Google Scholar]
  14. Ibáñez, J.; Carreño, J.; Yuste, J.; Martínez-Zapater, J.M. Grapevine breeding and clonal selection programmes in Spain. In Grapevine Breeding Programs for the Wine Industry; Elsevier: Amsterdam, The Netherlands, 2015; pp. 183–209. [Google Scholar]
  15. Guo, D.; Zhang, J.; Liu, C.; Zhang, G.; Li, M.; Zhang, Q. Genetic variability and relationships between and within grape cultivated varieties and wild species based on SRAP markers. Tree Genet. Genomes 2012, 8, 789–800. [Google Scholar]
  16. Laucou, V.; Lacombe, T.; Dechesne, F.; Siret, R.; Bruno, J.P.; Dessup, M.; Santoni, S. High throughput analysis of grape genetic diversity as a tool for germplasm collection management. Theor. Appl. Genet. 2011, 122, 1233–1245. [Google Scholar] [PubMed]
  17. Carbonell-Bejerano, P.; Santa María, E.; Torres-Pérez, R.; Royo, C.; Lijavetzky, D.; Bravo, G.; Martínez-Zapater, J.M. Thermotolerance responses in ripening berries of Vitis vinifera L. cv Muscat Hamburg. Plant and Cell Physiology. Plant Cell Physiol. 2013, 54, 1200–1216. [Google Scholar] [PubMed] [Green Version]
  18. Mwamahonje, A.; Maseta, Z.; Mlalila, F.; Feyissa, T. Application of genomic and genetic engineering tools for improvement of grapevines. J. Anim. Plant Sci. 2020, 30, 1058–1070. [Google Scholar]
  19. Migicovsky, Z.; Myles, S. Exploiting wild relatives for genomics-assisted breeding of perennial crops. Front. Plant Sci. 2017, 8, 460. [Google Scholar] [PubMed] [Green Version]
  20. Laimer, M. Transgenic grapevines. Transgenic Plant J. 2007, 1, 219–227. [Google Scholar]
  21. Pou, A.; Gulías, J.; Moreno, M.; Tomàs, M.; Medrano, H.; Cifre, J. Cover cropping in Vitis vinifera L. cv. Manto Negro vineyards under Mediterranean conditions: Effects on plant vigour, yield and grape quality. Oeno One 2011, 45, 223–234. [Google Scholar]
  22. Fischer, R.A.; Turner, N.C. Plant productivity in the arid and semiarid zones. Annu. Rev. Plant Physiol. 1978, 29, 277–317. [Google Scholar]
  23. Bchir, A.; Escalona, J.M.; Gallé, A.; Hernández-Montes, E.; Tortosa, I.; Braham, M.; Medrano, H. Carbon isotope discrimination (δ13C) as an indicator of vine water status and water use efficiency (WUE): Looking for the most representative sample and sampling time. Agric. Water Manag. 2016, 167, 11–20. [Google Scholar]
  24. De Souza, C.R.; Maroco, J.P.; dos Santos, T.P.; Rodrigues, M.L.; Lopes, C.M.; Pereira, J.S.; Chaves, M.M. Impact of deficit irrigation on water use 29 efficiency and carbon isotope composition (δ13C) of field-grown grapevines under Mediterranean climate. J. Exp. Bot. 2005, 56, 2163–2172. [Google Scholar]
  25. Farquhar, G.D.; Richards, R.A. Isotopic composition of plant carbon correlates with water-use efficiency of wheat genotypes. Funct. Plant Biol. 1984, 11, 539–552. [Google Scholar]
  26. Soar, C.J.; Dry, P.R.; Loveys, B.R. Scion photosynthesis and leaf gas exchange in Vitis vinifera L. cv. Shiraz: Mediation of rootstock effects via xylem sap ABA. Aust. J. Grape Wine Res. 2006, 12, 82–96. [Google Scholar]
  27. Stoll, M.; Loveys, B.; Dry, P. Hormonal changes induced by partial rootzone drying of irrigated grapevine. J. Exp. Bot. 2000, 51, 1627–1634. [Google Scholar] [PubMed] [Green Version]
  28. Vandeleur, R.K.; Mayo, G.; Shelden, M.C.; Gilliham, M.; Kaiser, B.N.; Tyerman, S.D. The role of plasma membrane intrinsic protein aquaporins in water transport through roots: Diurnal and drought stress responses reveal different strategies between isohydric and anisohydric cultivars of grapevine. Plant Physiol. 2009, 149, 445–460. [Google Scholar] [PubMed] [Green Version]
  29. Gaudillère, J.P.; Van Leeuwen, C.; Ollat, N. Carbon isotope composition of sugars in grapevine, an integrated indicator of vineyard water status. J. Exp. Bot. 2002, 53, 757–763. [Google Scholar]
  30. Gobierno de la Rioja. Available online: https://www.larioja.org/agricultura/es/informacion-agroclimatica/red-estaciones-agroclimaticas-siar (accessed on 10 May 2022).
  31. Agencia Estatal de Meteorologia (AEMET). Available online: http://www.aemet.es/es/portada (accessed on 10 May 2022).
  32. Tortosa, I.; Escalona, J.M.; Toro, G.; Douthe, C.; Medrano, H. Clonal behavior in response to soil water availability in Tempranillo grapevine cv: From plant growth to water use efficiency. Agronomy 2020, 10, 862. [Google Scholar]
  33. Flexas, J.; Medrano, H. Drought-inhibition of photosynthesis in C3 plants: Stomatal and non-stomatal limitations revisited. Ann. Bot. 2002, 89, 183–189. [Google Scholar]
  34. Tomás, M.; Medrano, H.; Pou, A.; Escalona, J.M.; Martorell, S.; Ribas-Carbó, M.; Flexas, J. Water-use efficiency in grapevine cultivars grown under controlled conditions: Effects of water stress at the leaf and whole-plant level. Aust. J. Grape Wine Res. 2012, 18, 164–172. [Google Scholar]
  35. Bavestrello-Riquelme, C.; Cavieres, L.; Gallardo, J.; Ibacache, A.; Franck, N.; Zurita-Silva, A. Evaluation of drought stress tolerance in four naturalized grapevine genotypes (Vitis vinifera) from northern Chile. IDESIA 2012, 30, 83–92. [Google Scholar]
  36. Tortosa, I.; Douthe, C.; Pou, A.; Balda, P.; Hernandez-Montes, E.; Toro, G.; Escalona, J.M.; Medrano, H. Variability in water use efficiency of grapevine Tempranillo clones and stability over years at field conditions. Agronomy 2019, 9, 701. [Google Scholar]
  37. Yu, R.; Zaccaria, D.; Kisekka, I.; Kurtural, S.K. Soil apparent electrical conductivity and must carbon isotope ratio provide indication of plant water status in wine grape vineyards. Precis. Agric. 2021, 22, 1333–1352. [Google Scholar]
  38. Zufferey, V.; Verdenal, T.; Dienes, A.; Belcher, S.; Lorenzini, F.; Koestel, C.; Blackford, M.; Bourdin, G.; Gindro, K.; Spangenberg, J.E.; et al. The influence of vine water regime on the leaf gas exchange, berry composition and wine quality of Arvine grapes in Switzerland. Oeno One 2020, 54, 553–568. [Google Scholar] [CrossRef]
  39. Santesteban, L.G.; Miranda, C.; Barbarin, I.; Royo, J.B. Application of the measurement of the natural abundance of stable isotopes in viticulture: A review. Aust. J. Grape Wine Res. 2015, 21, 157–167. [Google Scholar] [CrossRef]
  40. Poni, S.; Bernizzoni, F.; Civardi, S.; Gatti, M.; Porro, D.; Camin, F. Performance and water-use efficiency (single-leaf vs. whole-canopy) of well-watered and half-stressed split-root Lambrusco grapevines grown in Po Valley (Italy). Agric. Ecosyst. Environ. 2009, 129, 97–106. [Google Scholar] [CrossRef]
  41. Medrano, H.; Escalona, J.M.; Bota, J.; Gulias, J.; Flexas, J. Regulation of photosynthesis of C3 plants in response to progressive drought: Stomatal conductance as a reference parameter. Ann. Bot. 2002, 89, 895–905. [Google Scholar] [CrossRef] [PubMed]
  42. Koundouras, S.; Tsialtas, I.T.; Zioziou, E.; Nikolaou, N. Rootstock effects on the adaptive strategies of grapevine (Vitis vinifera L. cv. Cabernet–Sauvignon) under contrasting water status: Leaf physiological and structural responses. Agric. Ecosyst. Environ. 2008, 128, 86–96. [Google Scholar] [CrossRef]
  43. Zufferey, V.; Spring, J.L.; Verdenal, T.; Dienes, A.; Belcher, S.; Lorenzini, F.; Koestel, C.; Rösti, J.; Gindro, K.; Spangenberg, J.; et al. The influence of water stress on plant hydraulics, gas exchange, berry composition and quality of Pinot Noir wines in Switzerland. Oeno One 2017, 51, 17–27. [Google Scholar] [CrossRef]
  44. Medrano, H.; Tomás, M.; Martorell, S.; Flexas, J.; Hernández, E.; Rosselló, J.; Pou, A.; Escalona, J.M.; Bota, J. From leaf to whole-plant water use efficiency (WUE) in complex canopies: Limitations of leaf WUE as a selection target. Crop J. 2015, 3, 220–228. [Google Scholar] [CrossRef] [Green Version]
  45. Martorell, S.; Diaz-Espejo, A.; Tomàs, M.; Pou, A.; El Aou-ouad, H.; Escalona, J.M.; Vadell, J.; Ribas-Carbó, M.; Flexas, J.; Medrano, H. Differences in water-use-efficiency between two Vitis vinifera cultivars (Grenache and Tempranillo) explained by the combined response of stomata to hydraulic and chemical signals during water stress. Agric. Water Manag. 2015, 156, 1–9. [Google Scholar] [CrossRef] [Green Version]
  46. Chaves, M.M.; Zarrouk, O.; Francisco, R.; Costa, J.M.; Santos, T.; Regalado, A.P.; Rodrigues, M.L.; Lopes, C.M. Grapevine under deficit irrigation: Hints from physiological and molecular data. Ann. Bot. 2010, 105, 661–676. [Google Scholar] [CrossRef] [Green Version]
  47. Chaves, M.M.; Santos, T.P.; Souza, C.D.; Ortuño, M.F.; Rodrigues, M.L.; Lopes, C.M.; Maroco, J.P.; Pereira, J.S. Deficit irrigation in grapevine improves water-use efficiency while controlling vigour and production quality. Ann. Appl. Biol. 2007, 150, 237–252. [Google Scholar] [CrossRef]
  48. Gómez-Alonso, S.; García-Romero, E. Effect of irrigation and variety on oxygen (δ18O) and carbon (δ13C) stable isotope composition of grapes cultivated in a warm climate. Aust. J. Grape Wine Res. 2010, 16, 283–289. [Google Scholar] [CrossRef]
  49. Santesteban, L.G.; Miranda, C.; Urretavizcaya, I.; Royo, J.B. Carbon isotope ratio of whole berries as an estimator of plant water status in grapevine (Vitis vinifera L.) cv.‘Tempranillo’. Sci. Hortic. 2012, 146, 7–13. [Google Scholar]
Figure 1. Linear regression between the natural logarithm intrinsic water use efficiency (WUEi, AN/gs) and stomatal conductance (gs) representing the clonal groupings analysed (LG: La Grajera; VN: Vitis Navarra; VP: Vitis Provedo; R: Roda).
Agronomy 12 01963 g001
Figure 2. Linear regression between carbon isotopic discrimination (13C) and WUEi of the data set grouped in the clone sets analysed (LG: La Grajera; VN: Vitis Navarra; VP: Vitis Provedo; R: Roda). ** p-value < 0.01; * p-value < 0.05; n.s: not significant.
Agronomy 12 01963 g002
Figure 3. Residual percentages relationship of intrinsic water use efficiency (WUEi) and carbon isotopic discrimination (13C) in the clonal groupings analysed (LG: La Grajera; VN: Vitis Navarra; VP: Vitis Provedo; R: Roda).
Agronomy 12 01963 g003
Figure 4. Relative position based on the residual percentage value of carbon isotopic discrimination (13C) and intrinsic water use efficiency (WUEi) in each group of clones and genotypes analysed (LG: La Grajera; VN: Vitis Navarra; VP: Vitis Provedo; R: Roda).
Agronomy 12 01963 g004
Figure 5. Linear regression between carbon isotopic discrimination (13C) and WUEi of the analysed groups separating efficient and very efficient genotypes (filled mark) and very inefficient genotypes (empty mark).
Agronomy 12 01963 g005
Table 1. Climatic conditions of the three experimental sites. The values are the average of the maximum (Tmax) and minimum temperature (Tmin) and the sum of the cumulative precipitation (P), the reference evapotranspiration (ET0) and the growing degree days (GDD) accumulative by months from April to October in 2015 and 2018 [30,31].
YearT max (°C)T min (°C)P (L m−2)ET0 (mm Month−1)GDD (°C Month−1)
Roda
April201518.16.916.2113.172.7
May21.810.07.2144.6169.7
June26.612.363.8158.6268.9
July30.615.210.7190.1370.6
August28.514.137.1167.8339.3
September22.110.526.898.8170.1
October18.18.658.865.996.9
23.711.1220.6938.91488.2
April201817.17.697.797.876.0
May19.98.551.3111.4120.2
June25.012.833.3134.6249.6
July28.415.678.9156.3347.7
August29.614.70.0157.2356.4
September27.413.641.4113.8287.3
October19.08.366.065.0115.3
23.811.6368.6836.11552.5
La Grajera–Vitis Provedo
April201518.77.321.0105.081.7
May22.610.82.6142.5196.0
June27.714.142.8170.7307.5
July31.517.034.9197.8410.1
August29.015.319.1163.9364.0
September23.011.613.3100.7204.6
October18.59.133.262.9111.4
24.412.2166.9943.51675.3
April201817.37.586.190.676.7
May19.99.865.6112.7138.4
June25.213.939.3137.4272.0
July28.916.7117.6168.7371.3
August30.016.40.0167.2386.1
September27.314.545.4113.1302.0
October19.59.328.370.7132.4
24.012.6382.3860.41678.9
Vitis Navarra
April201519.86.011.9101.185.3
May23.510.22.4148.9206.7
June28.313.470.7165.9317.7
July30.916.00.3184.2395.9
August28.814.210.3142.7350.4
September23.510.412.995.2202.6
October19.98.524.157.0116.8
24.911.3132.6895.01675.4
April201818.36.561.393.180.3
May21.09.029.2119.4149.3
June25.812.948.6145.8275.9
July30.215.756.3174.8386.9
August29.814.96.3159.4372.4
September28.012.916.2113.3300.4
October20.78.416.672.6141.1
24.811.5234.5878.41706.3
Table 2. gs and intrinsic water use efficiency (WUEi) average and their standard deviations in Tempranillo, Garnacha and rootstock cultivars in the different fields and years analysed.
20152018
gs
(mol H2O m−2 s−1)
WUEi
(mmol CO2 mol−1 H2O)
gs
(mol H2O m−2 s−1)
WUEi
(mmol CO2 mol−1 H2O)
TempranilloRoda 0.311 ± 0.108 a57.8 ± 15.5 c
La Grajera0.097 ± 0.045 c118.9 ± 23.6 a0.098 ± 0.054 c90.5 ± 14.1 a
Vitis Provedo0.198 ± 0.072 a76.7 ± 17 b
Vitis
Navarra
0.164 ± 0.063 b76.5 ± 16.5 b
GarnachaVitis
Navarra
0.236 ± 0.048 b70.6 ± 11.3 b
T-RootstockVitis
Navarra
0.233 ± 0.095 b64.6 ± 13.9 bc
General0.126 ± 0.069 B103.2 ± 29.1 A0.236 ± 0.104 A68 ± 16.8 B
Gs: Two-way ANOVA: Year **, Field ***, Year × Field **
EUAi: Two-way ANOVA: Year ***, Field ***, Year × Field ***
Different lower case letters indicate a difference between groups of the same year with Duncan’s test (p < 0.05). *** p-value < 0.001; ** p-value < 0.01.
Table 3. Mean values and standard deviations of WUEi (AN/gs) in the genotypes and clones studied.
2015
Tempranillo
La GrajeraVitis NavarraVitis Provedo
86110.7 ± 19.8 bcdefVN174.3 ± 9.5 bRJ4369.4 ± 6.8 n.s.
232123.7 ± 18.8 abcdVN3177.5 ± 8.5 bRJ7883.3 ± 27.4 n.s.
260131 ± 2.6 abVN3297 ± 6.5 aVP1165.6 ± 9.3 n.s.
280121.5 ± 15.2 abcdVN3364.9 ± 12.7 bVP2483.9 ± 9.8 n.s.
518132.4 ± 9.3 abVN4279.6 ± 22.2 abVP2587.3 ± 13.6 n.s.
560124.7 ± 34 abcdVN6965.6 ± 16.3 bVP2866.7 ± 10.2 n.s.
807129.4 ± 26.8 ab VP880.9 ± 23.6 n.s.
814136.3 ± 10.6 ab
843129 ± 5.5 abc
104190.1 ± 24.8 ef
1048143.1 ± 8.9 a
108481.7 ± 18.8 f
108996.6 ± 25 def
RJ26132.9 ± 22.8 ab
RJ43113.1 ± 15.4 abcde
RJ5199.3 ± 18.5 cdef
RJ78126.5 ± 14.5 abcd
RJ79123.1 ± 18 abcd
2018
GarnachaT -RootstockTempranillo
Vitis NavarraVitis NavarraLa GrajeraRoda
ARA-279.2 ± 8.2 ab1103P74.7 ± 5 ab23293.7 ± 14.2 ab679.6 ± 5 a
ARA-2457 ± 4.7 e110R66.8 ± 6.2 abcd1048105.1 ± 6.4 a10849.4 ± 9 c
ARA-481.6 ± 7.9 ab140RU41.4 ± 2.8 e1052101.1 ± 3.3 ab13740.8 ± 3.4 c
ENTAV 13688.6 ± 5.7 a420A64.1 ± 8.2 bcd107888 ± 10 abc15647.9 ± 4.8 c
ENTAV 14173.5 ± 10.9 bcdRG272.6 ± 8 ab108472.8 ± 6.4 c16648.2 ± 1.1 c
EV1167.3 ± 1.8 cdeRG355 ± 11.8 d137186.1 ± 14.2 bc17877.2 ± 16.3 ab
EV1365.5 ± 9.4 deRG458.1 ± 6.1 cd 20366.4 ± 9.3 b
EV1463.2 ± 5.6 eRG671.6 ± 5.4 ab 21552.6 ± 4.6 c
EV1563.1 ± 6.7 eRG775.2 ± 9.9 ab 24346.2 ± 5.8 c
RJ2161.1 ± 1.5 eRG842.4 ± 4.9 e 33666.9 ± 7.1 b
VNQ75.7 ± 5.1 bcRG979.3 ± 11.9 a
SO468.5 ± 11.8 abc
Different letters indicate statistical differences within each group by Duncan test (p < 0.05).
Table 4. Mean values and standard deviations of 13C isotopic discrimination (δ13C ‰) in the genotypes and clones studied.
2015
Tempranillo
La GrajeraVitis NavarraVitis Provedo
86−22 ± 0.8 abcVN1−27.1 ± 0.7 bcRJ43−26.3 ± 0.4 a
232−21.7 ± 0.2 aVN31−27.8 ± 0.4 cRJ78−25.9 ± 0.5 a
260−22.4 ± 0.4 abcdVN32−25.3 ± 0.7 aVP11−26.6 ± 0.4 a
280−22.2 ± 0.2 abcdVN33−27.4 ± 0.5 bcVP24−24.4 ± 0.6 c
518−22.9 ± 0.5 bcdefVN42−27.3 ± 0.8 bcVP25−24.3 ± 0.4 c
560−21.8 ± 0.9 abVN69−26.6 ± 0.6 bVP28−24 ± 0.3 c
807−21.5 ± 0.2 a VP8−25.2 ± 0.6 b
814−22.6 ± 0.6 abcde
843−22.4 ± 0.4 abcd
1041−24.8 ± 0.5 gh
1048−23 ± 0.5 cdef
1084−25.8 ± 1.8 h
1089−24.1 ± 0.5 fg
RJ26−23.9 ± 0.7 fg
RJ43−24 ± 0.3 fg
RJ51−23.9 ± 0.7 fg
RJ78−23.6 ± 0.4 ef
RJ79−23.2 ± 0.5 def
2018
GarnachaT -RootstockTempranillo
Vitis NavarraVitis NavarraLa GrajeraRoda
ARA-2−24.8 ± 0.7 bc1103P−26.3 ± 0.3 b232−22.7 ± 0.8 a6−24.9 ± 0.8 ab
ARA-24−24.8 ± 0.1 bc110R−28 ± 0.4 ef1048−23.2 ± 0.1 a108−26.6 ± 0.3 de
ARA-4−24.8 ± 0.4 bc140RU−28.5 ± 0.5 f1052−23.2 ± 0.8 a137−27.1 ± 0.9 e
ENTAV 136−24.6 ± 0.3 abc420A−27.7 ± 0.3 de1078−23.9 ± 0.7 a156−26.6 ± 0.4 de
ENTAV 141−27 ± 0.6 eRG2−25.4 ± 0.7 a1084−24.1 ± 0.6 a166−26.2 ± 0.2 cde
EV11−24 ± 0.7 aRG3−27.4 ± 0.4 cde1371−25.8 ± 2.3 b178−24.9 ± 0.7 ab
EV13−24.2 ± 0.2 abRG4−27.1 ± 0.9 bcd 203−24.5 ± 0.5 a
EV14−24.2 ± 0.6 abRG6−26.7 ± 0.4 bc 215−26 ± 0.8 cd
EV15−25.8 ± 0.6 deRG7−26.8 ± 0.4 bc 243−25.6 ± 0.6 bc
RJ21−24.9 ± 0.2 bcRG8−29.4 ± 0.3 g 336−24.7 ± 0.9 ab
VNQ−25.2 ± 0.3 cdRG9−26.9 ± 0.8 bcd
SO4−26.4 ± 0.7 b
Different letters indicate statistical differences within each group by Duncan test (p < 0.05).
Publisher’s Note: MDPI stays neutral with regard to jurisdictional claims in published maps and institutional affiliations.

