Article

Simulation Parameter Calibration and Test of Typical Pear Varieties Based on Discrete Element Method

1
College of Mechanical and Electronic Engineering, Shandong Agricultural University, Taian 271018, China
2
Shandong Provincial Key Laboratory of Horticultural Machinery and Equipment, Shandong Agricultural University, Taian 271018, China
3
Shandong Agricultural Equipment Intelligent Engineering Laboratory, Shandong Agricultural University, Taian 271018, China
*
Author to whom correspondence should be addressed.
Agronomy 2022, 12(7), 1720; https://doi.org/10.3390/agronomy12071720
Submission received: 28 June 2022 / Revised: 16 July 2022 / Accepted: 20 July 2022 / Published: 21 July 2022
(This article belongs to the Special Issue Advances in Modelling Cropping Systems to Improve Yield and Quality)

Abstract

:
To improve the accuracy of discrete element simulation parameters for the mechanized picking and collection of pears, the study calibrated the simulation parameters of pears by the method of combining a physical experiment and simulation. Based on the intrinsic parameters of four kinds of pears (Snow pears, Crisp pears, Huangguan pears and Qiuyue pears), their simulation models were constructed by the Hertz-Mindlin with a bonding model. The simulation parameters between pears and the contact material (PVC, EVA foam material) were calibrated by the methods of free fall collision, inclined sliding and rolling, respectively. The experiments of pear accumulation angle were carried out. It was obtained to process the image of pears with Matrix Laboratory software. In order to determine the optimal value interval of influencing factors of the pear accumulation angle, the steepest ascent experiment was carried out. Considering the coefficient of collision recovery, the coefficient of static friction and the coefficient of rolling friction between pears, five-level simulation experiments of the pear accumulation angle were designed for each factor by the method of orthogonal rotation combination. The regression model of the error between the measured value and the simulated value of the pear accumulation angle was established, and the influence of three factors on the pear accumulation angle was analyzed. The results showed that the static friction coefficient and rolling friction coefficient between pears have significant effects on the pear accumulation angle. Therefore, the optimal model of minimum error was constructed according to constraint condition, and the coefficient of collision recovery, coefficient of static friction and coefficient of rolling friction between pears were obtained. The accumulation angle verification experiments were carried out by the method of bottomless barrel lifting. The results showed that the relative error between the simulated and measured accumulation angle of four kinds of pears were 1.42%, 1.68%, 2.19% and 1.83%, respectively, which indicated that the calibrated simulation parameters were reliable. The research can provide a basis for the design and parameters optimization of harvesting machinery of pears.

1. Introduction

Pears, as one of the main fruits in the world, have a huge market demand and high economic value [1,2]. In recent years, with the increase in pear planting area, the yield has increased year by year [3,4]. Due to the short harvest period and strong harvest seasonality, harvesting machinery is necessary to improve the harvest efficiency of pears [5,6]. However, because pears’ skin is thin and their meat is crisp and juicy, it is very easily damaged in the process of mechanized harvesting, which reduces the edible and storage properties of pears, and directly affects the quality and economic benefits of pears [7,8]. Therefore, in order to improve the harvesting efficiency and to reduce the damage rate of pears, lower damage technologies and machines are an inexorable trend for the development of pear industry in China in the future.
In recent years, EDEM, a numerical simulation software based on discrete element method, has been more and more widely used in agricultural equipment research [9,10]. The method can effectively and intuitively simulate the mechanism of “crop-crop” and “crop-machinery” to realize optimize the structure or working parameters of machinery [11,12]. In discrete element simulation, the intrinsic parameters (such as density, shear modulus, Poisson’s ratio, etc.) and contact parameters (such as “particle-particle”, “particle-material” collision recovery coefficient, static friction coefficient, rolling friction coefficient, etc.) of the simulation model should be defined [13,14]. Among them, the intrinsic parameters are particle attribute parameters, which are basically consistent with the real values. However, the difference between the simulation model and the real particle geometry makes it difficult to measure some contact parameters. Therefore, virtual calibration of contact parameters is necessary [15,16,17].
At present, relevant scholars have conducted a lot of research on the calibration of grain crops simulation parameters based on discrete element method (DEM) [18,19,20]. Li Xiaoyu et al. [21] constructed a mathematical model of the corn-mechanical interaction system based on the Hertz-Mindlin, and proposed a new DEM construction method of the corn ear through filling and splicing particles. Thiet Xuan Nguyen et al. [22] analyzed the shape and the physical characteristics of soybeans, and measured the coefficient of static friction between soybeans and materials, and calibrated the DEM input parameters by the combination method of experiment and simulation. Liu Wenzheng et al. [23] calibrated contacting parameters of particle discrete simulation, which were consistent with the experimental conditions. Liu Yan et al. [24] used the method of combining physical experiment and virtual calibration to determine the DEM parameters of adzuki bean seeds, and the relative error between simulated and measured values of AOR (angle of repose) was 0.67%, which indicated that the determined DEM parameters were accurate and reliable.
In addition, there are some research on other crops. Using 3D scanning, Hao Jianjun et al. [25] established the simulation of oil sunflower seeds by DEM, and bottomless barrel lifting experiments were carried out and the error between experimental and simulation accumulation angle was only 0.24%. By the method of orthogonal rotating combination, Yu Qingxu et al. [26] determined the optimal contact parameters between the Panax notoginseng seeds in EDEM simulation experiment. Bai Shenghe et al. [27] calibrated the contact parameters between “cotton seeds-cotton seeds”, “cotton seeds-stainless steel” and “cottonseed-nylon”, and carried out physical and simulation experiments to obtain the inter species collision recovery coefficient. Using the Plackett-Burman experiment, Hou Zhanfeng et al. [28] analyzed the significance of simulation parameters of agropyron seeds, and constructed the second-order regression equation of the repose angle and the significant parameter to determine the simulated parameters of agropyron seeds.
In summary, it is accurate and feasible to use the combination method of physical experiment and DEM simulation to calibrate the discrete element parameters of material particles. However, there are few studies on the calibration of simulation parameters of pears. Compared with corn, rice and wheat, the size of pears is larger, which requires a lot of relevant experiments to explore more complex movement characteristics. There are various pears in China, including, Snow pear, Crisp pear, Huangguan pear and Qiuyue pear and more. So in the paper, the intrinsic parameters of the four kinds of pears were measured, and their simulation models were constructed by the Hertz-Mindlin with bonding model. The simulation parameters between pears and the contact material (PVC, EVA foam material) were calibrated by the methods of free fall collision, inclined sliding and rolling, respectively. Carrying out the experiments of pear accumulation angle and the steepest ascent experiment, the optimal value interval of influencing factors of the pear accumulation angle was determined. Using orthogonal rotation combination and considering the coefficient of collision recovery, the coefficient of static friction and the coefficient of rolling friction between pears, five-level simulation experiments of the pear accumulation angle were designed for each factor. The influence of three factors on the pear accumulation angle was analyzed, and the optimal model of minimum error between the measured value and the simulated value of the pear accumulation angle was constructed according to constraint condition. Thus the coefficient of collision recovery, coefficient of static friction and coefficient of rolling friction between pears were obtained. In order to indicate that the calibrated simulation parameters are reliable, the accumulation angle verification experiments were carried out. The research can provide a basis for the design and parameters optimization of harvesting machinery of pears.

2. Materials and Methods

2.1. Model Establishment

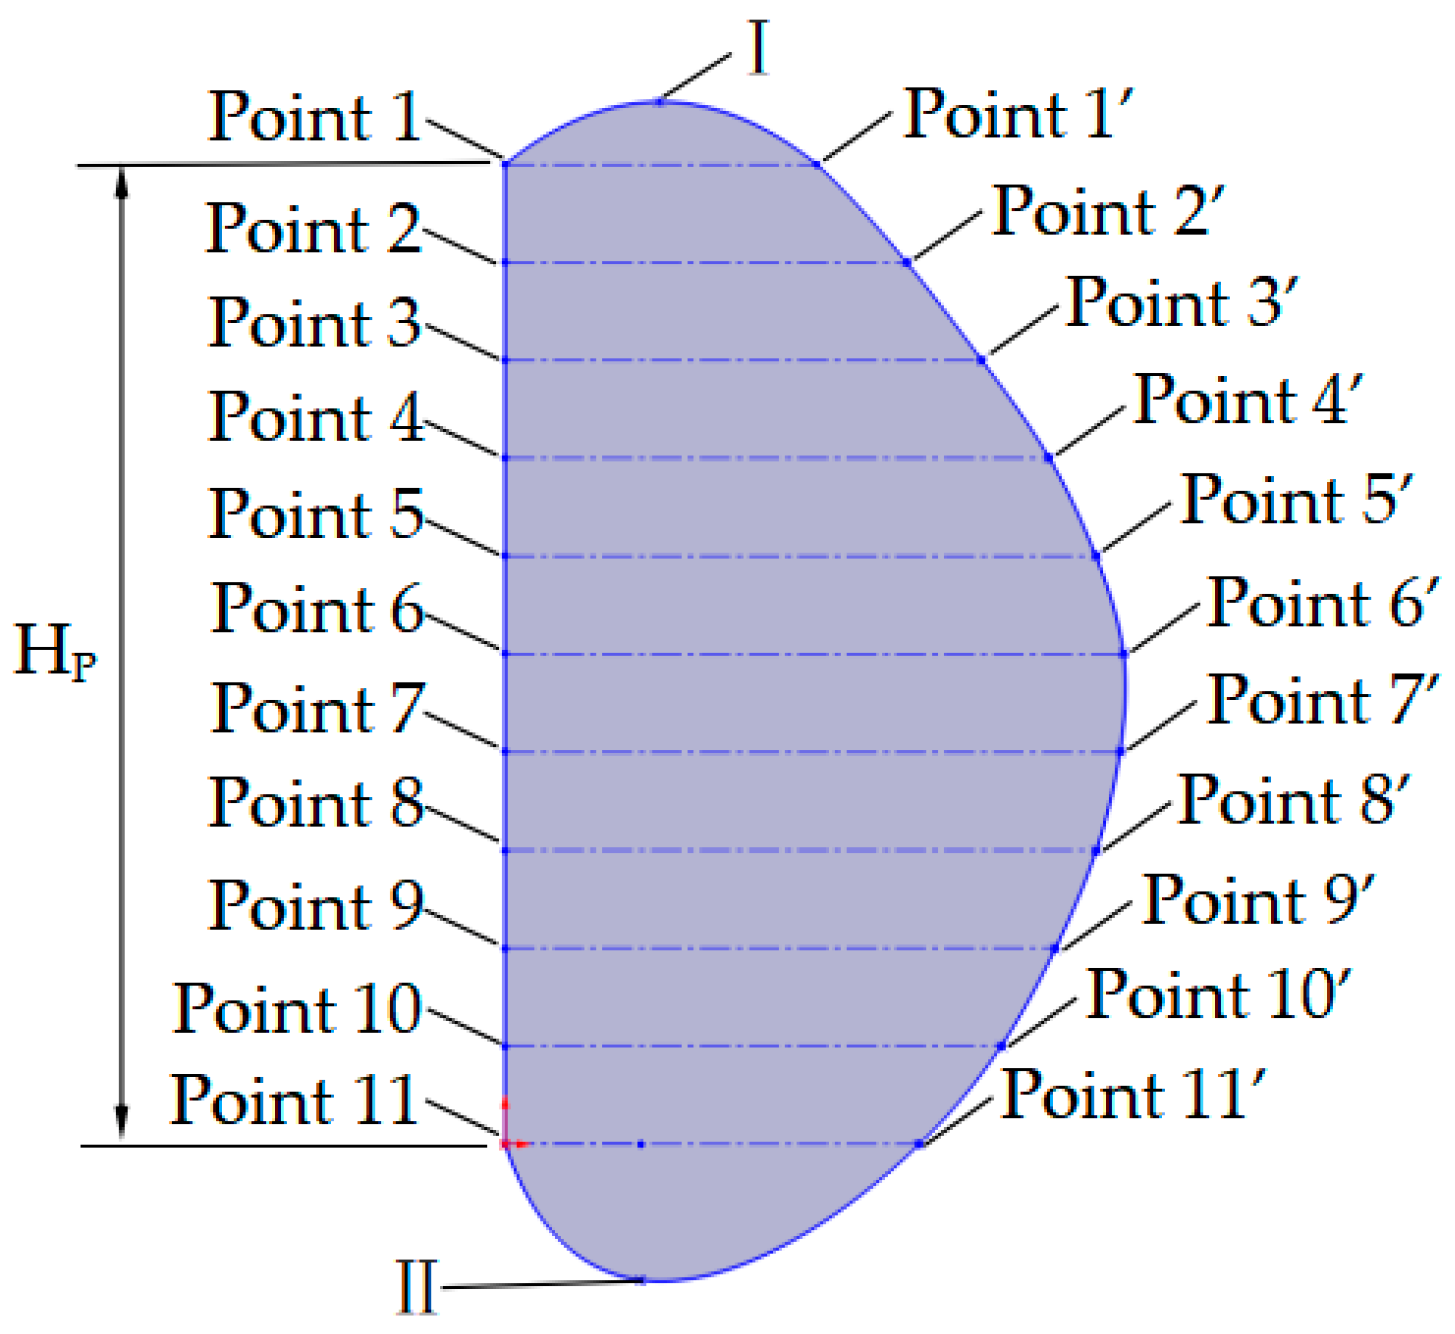
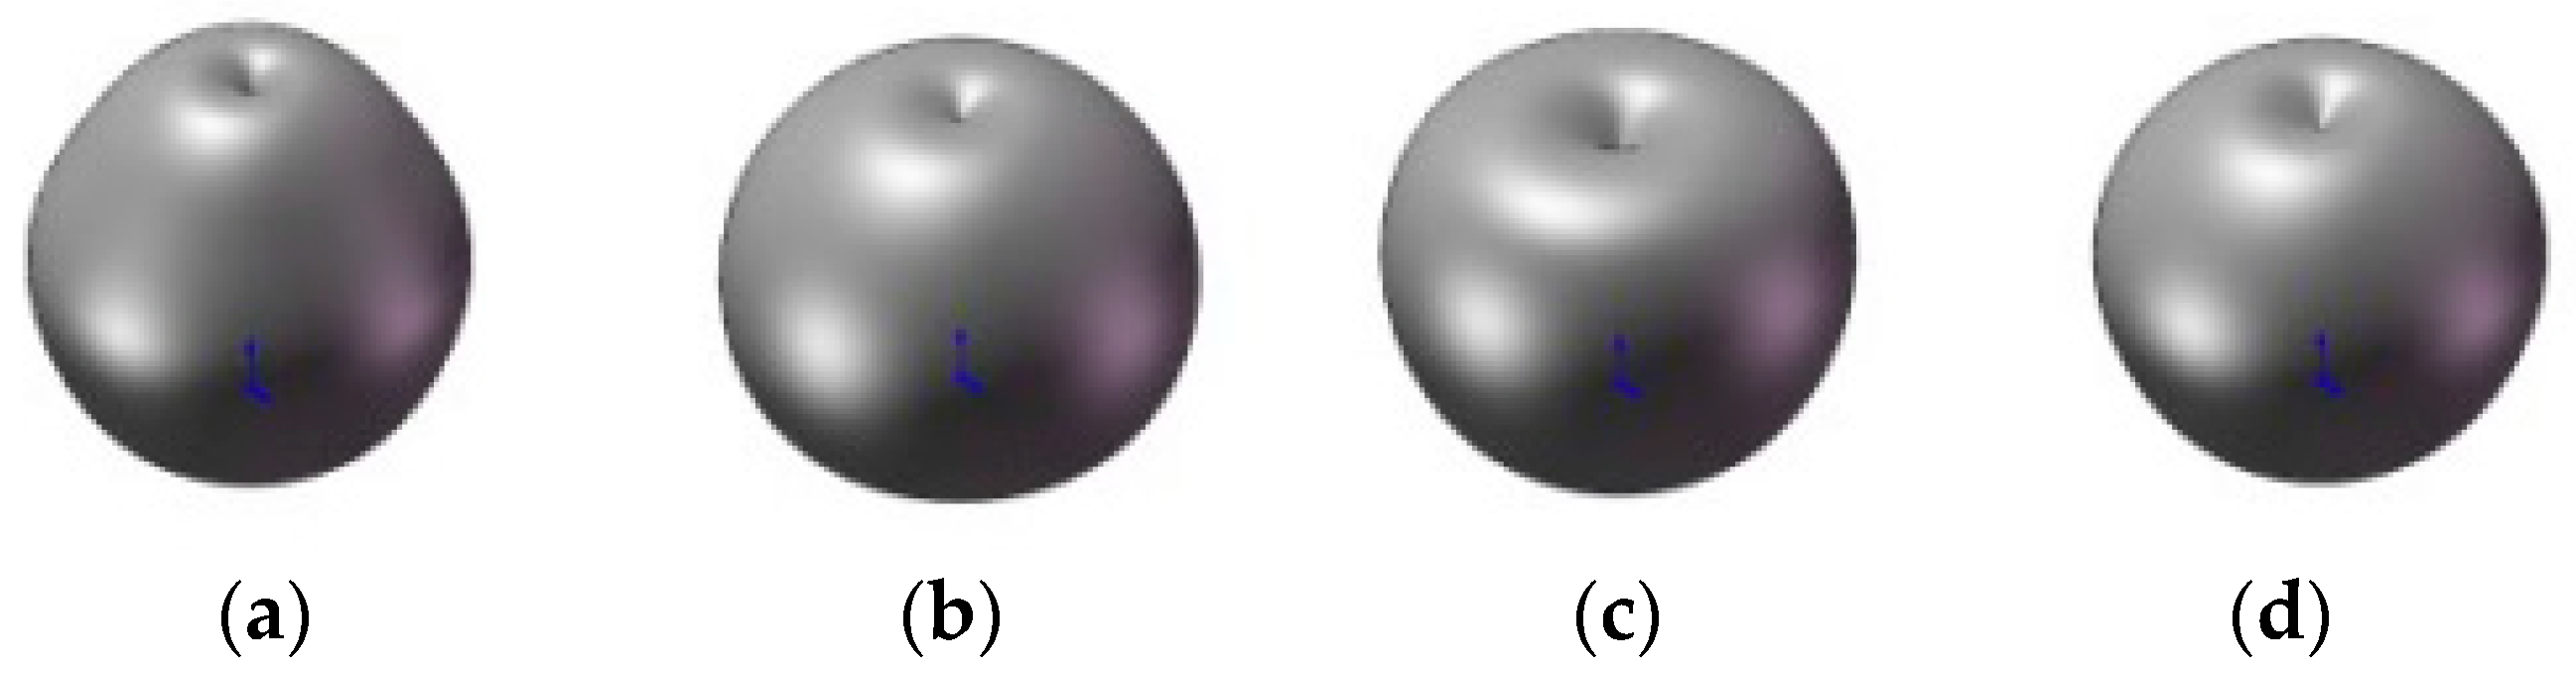
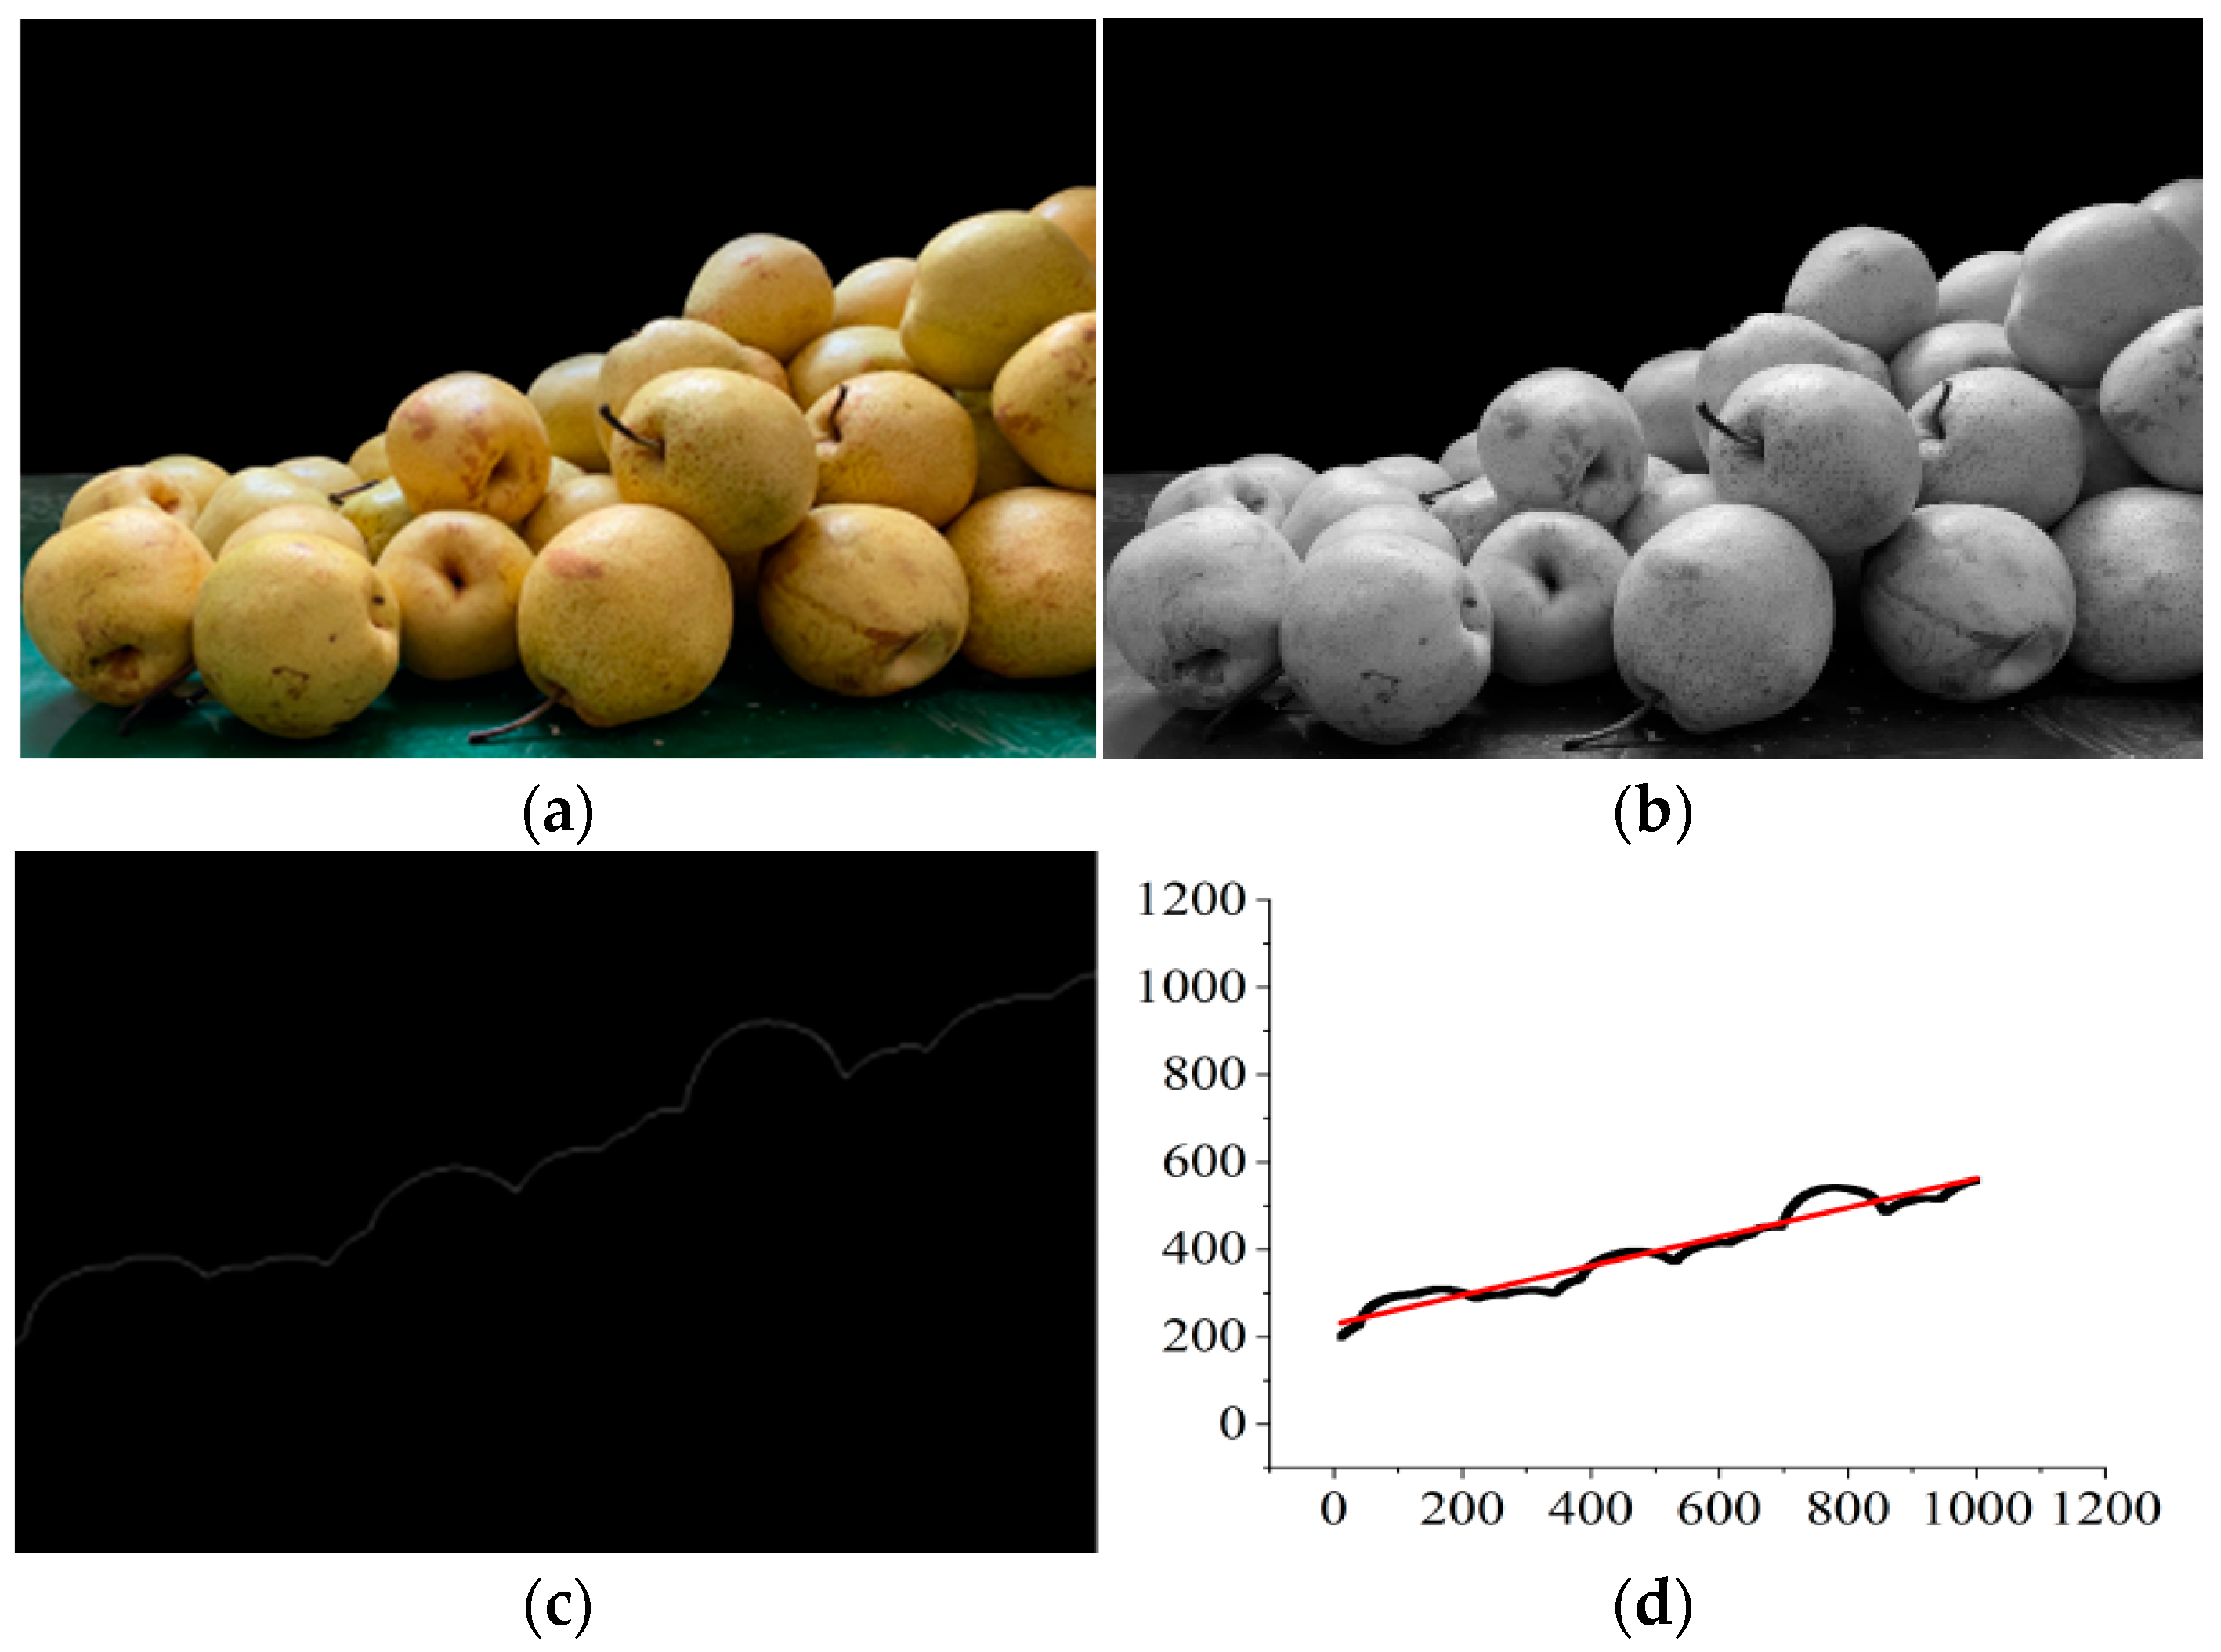
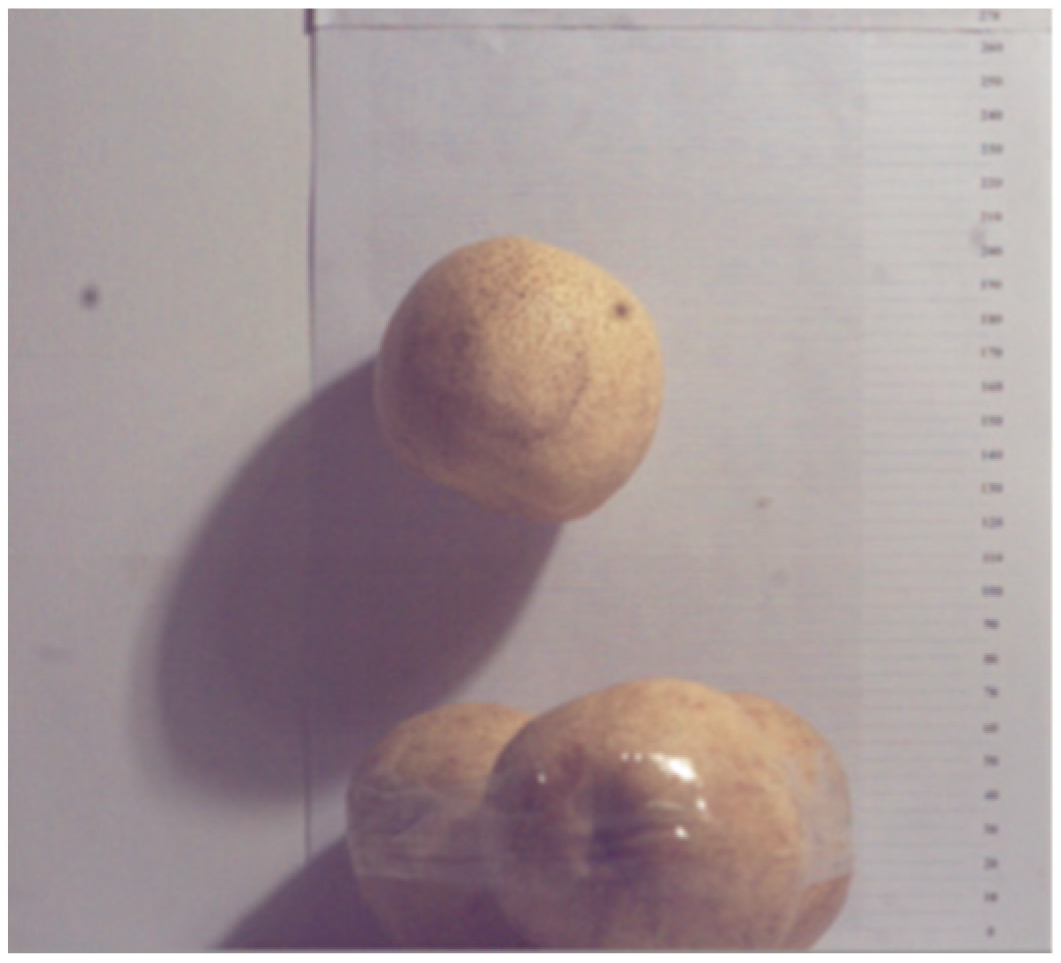
2.1.1. Physical Model of Pears

Snow pear, Crisp pear, Huangguan pear and Qiuyue pear were planted in China. 100 mature pears of each variety were selected, and they were divided into 5 groups on average. According to the method of [27,28,29], the intrinsic parameters were measured, and the results were shown in Table 1.
Because the shape of pears is irregular, it is impossible to simulate directly with a single spherical discrete element model. According to the intrinsic parameters of pears, a center line with the same height as the pear was drawn in SolidWorks, which was divided into 10 parts in the height direction. The outer contour points of the same width as the corresponding positions of the pears were cut out, and these points (including the peak and the bottom) were connected with curves in sequence (Figure 1), the geometric models of pears fruit each variety were constructed, as shown in Figure 2.
The “.stp” format of these models was imported into EDEM. Using the pear contour as a spherical particle production plant, the Hertz-Mindlin non-slip model was used as a particle contact model, and the EDEM simulation models of pears were constructed by the Multi-sphere method (MSM), as shown in Figure 3.

2.1.2. Selection of Contact Model

In the process of the mechanized picking and collection of pears, except for the contact between pear fruit particles, there is contact with other materials during the buffer collection. In this paper, the materials in contact with pear fruit were PVC and EVA foaming materials [30,31], and their parameters were shown in Table 2 [32,33]. During the collection process, the surface of pear fruit and material was smooth and almost had no adhesion, so the Hertz-Mindlin non-slip contact model was selected for discrete element simulation.

2.2. Calibration of Contact Parameters between Typical Pears and Materials

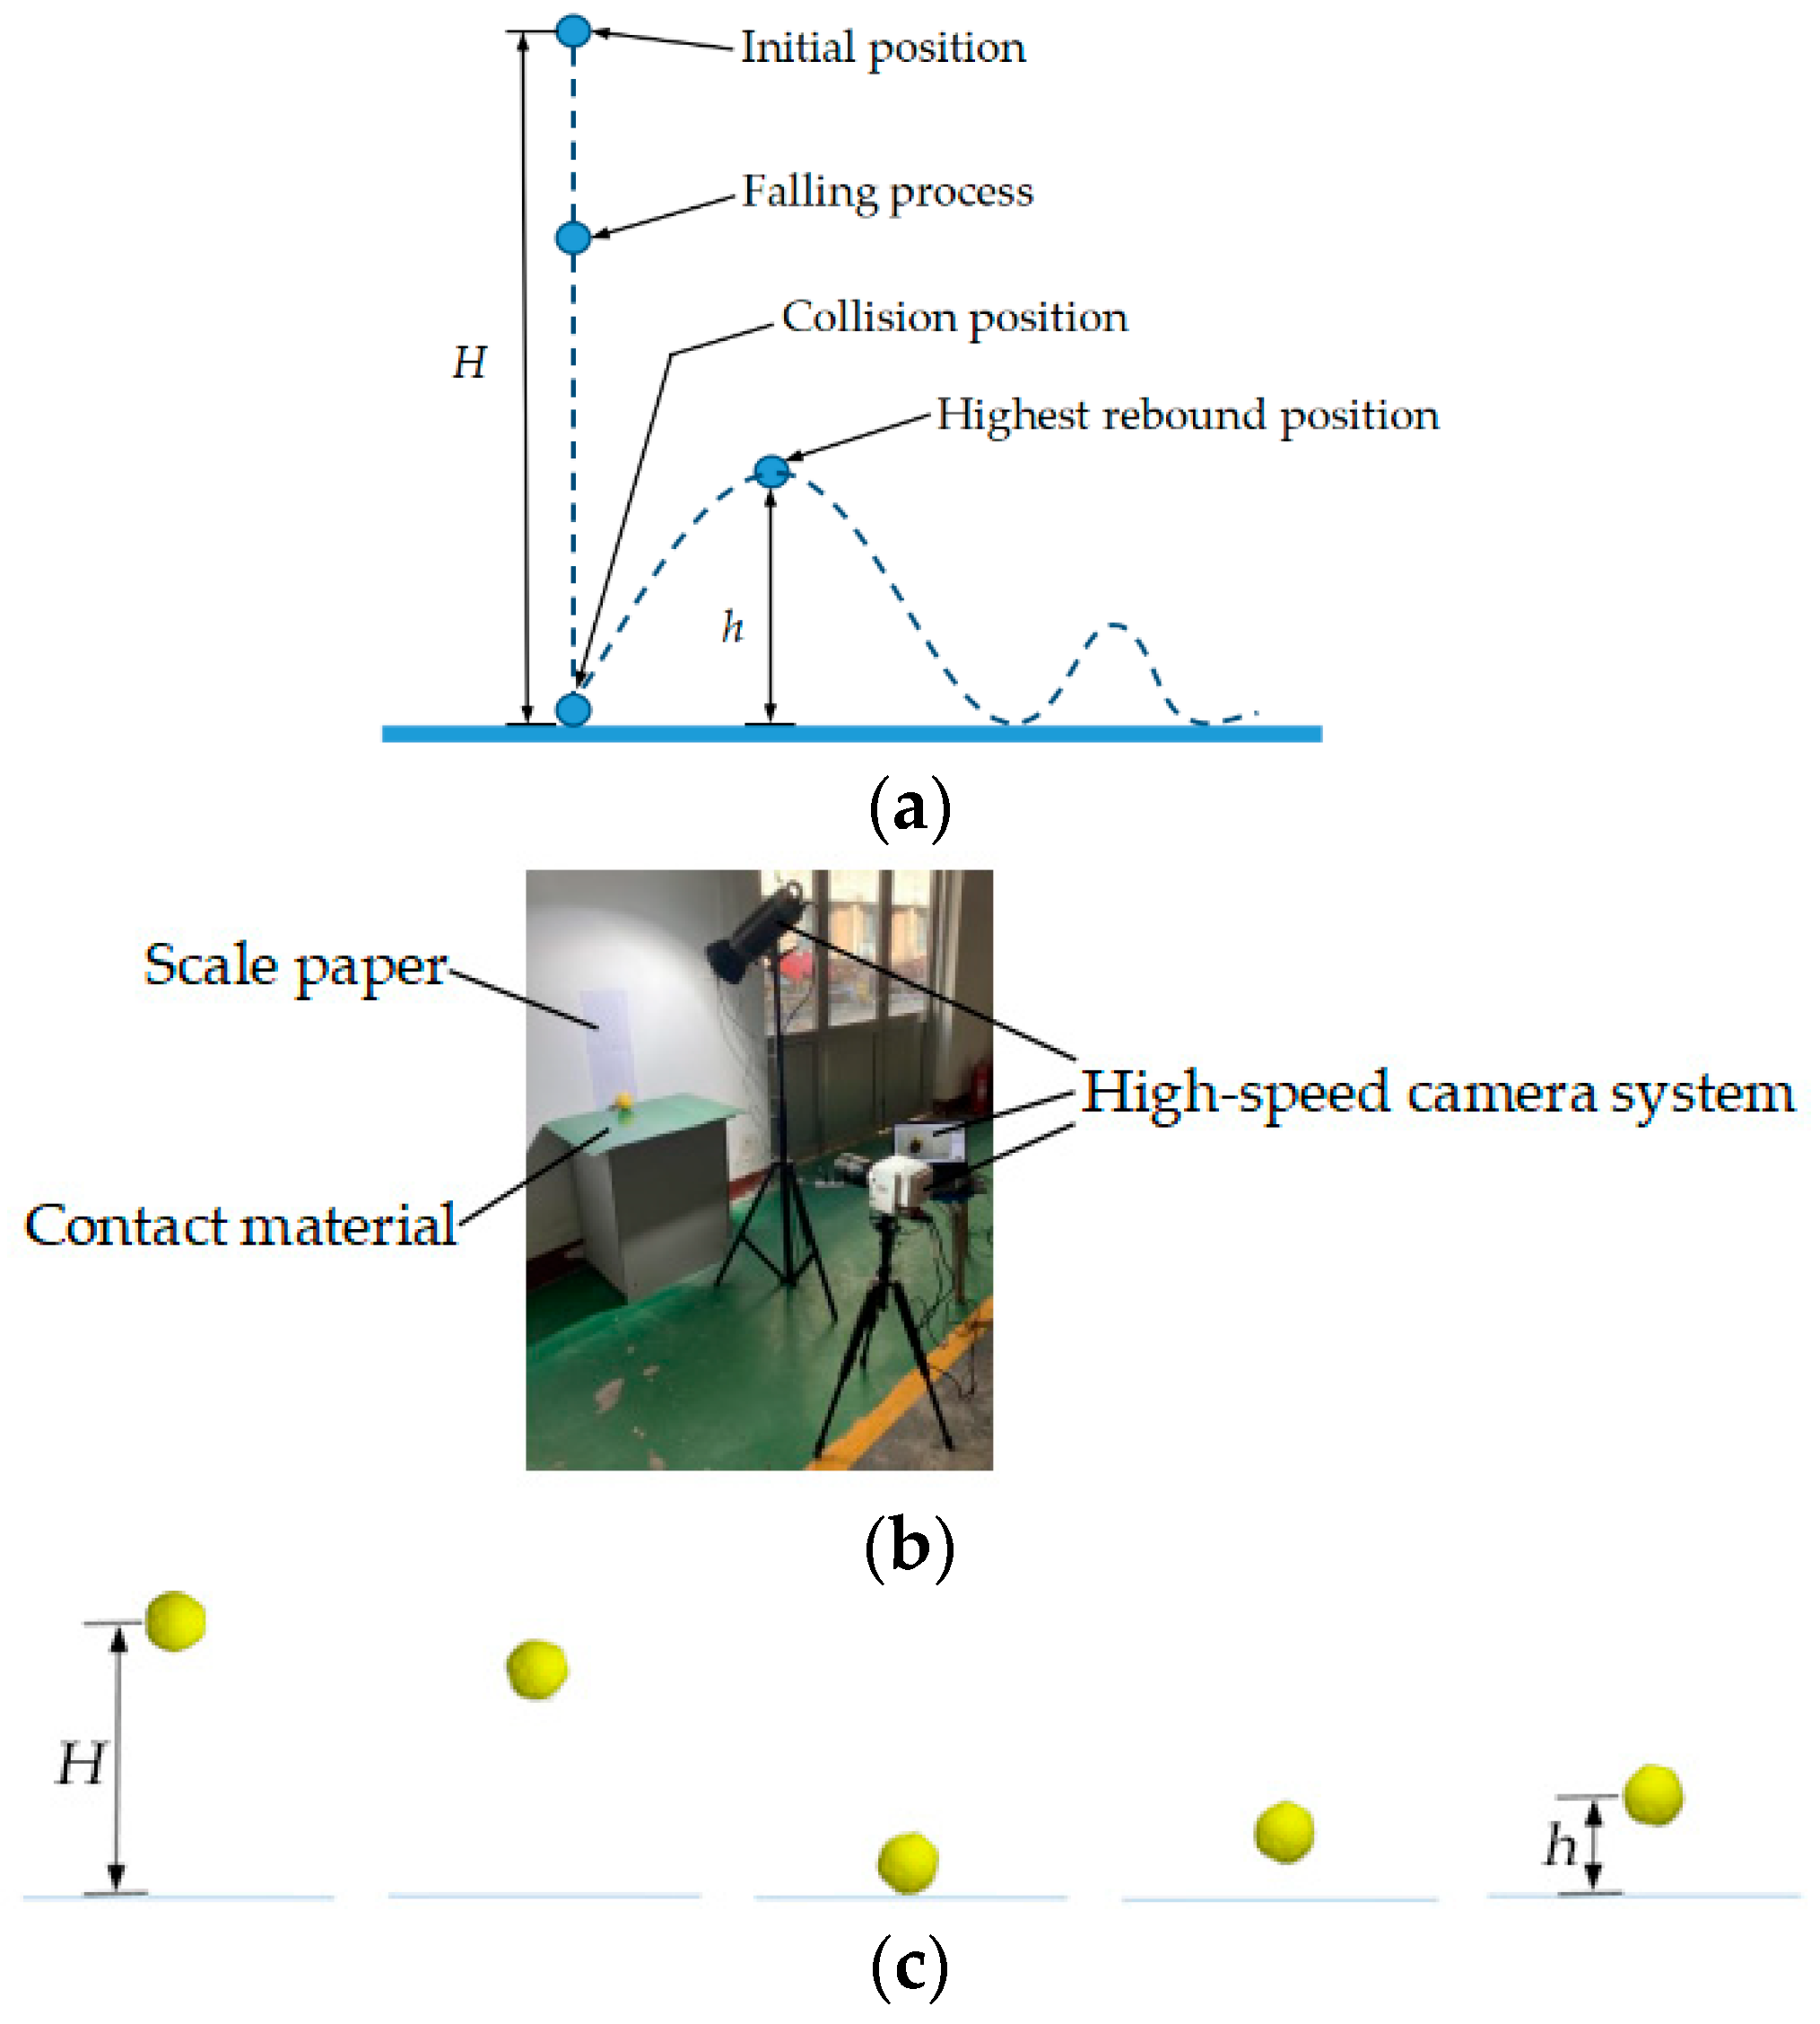
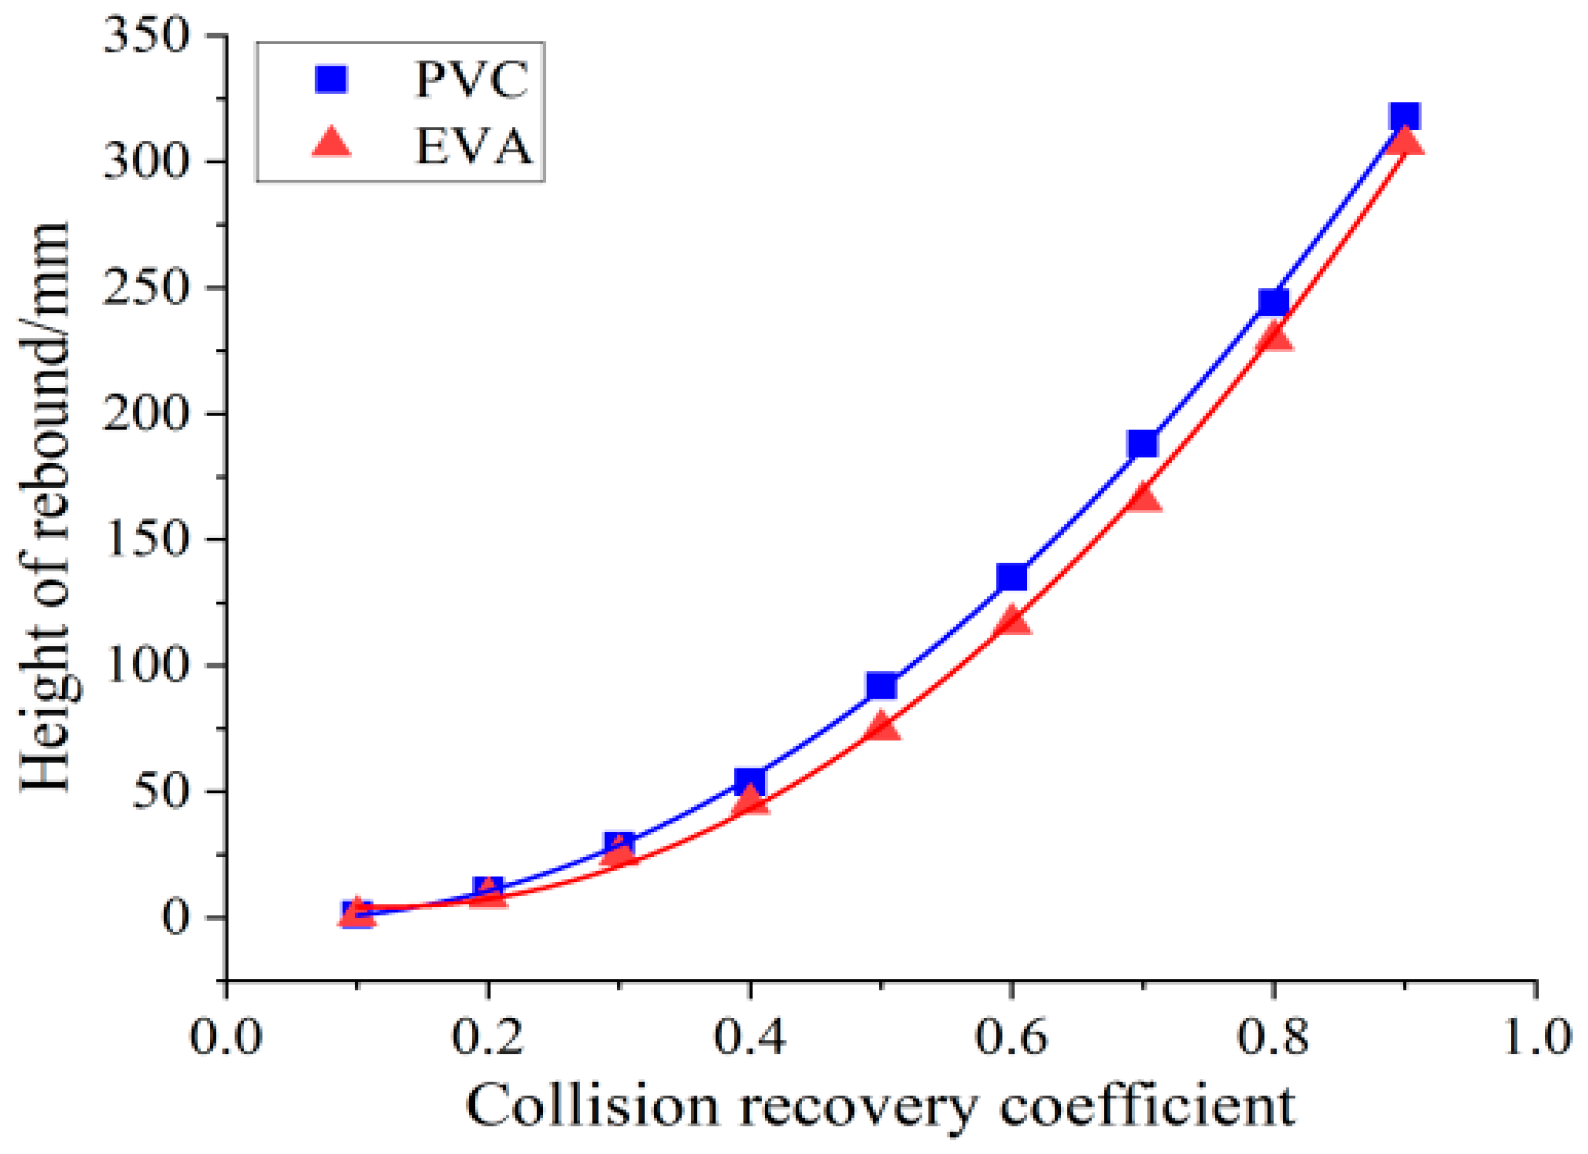
2.2.1. Calibration of Collision Recovery Coefficient between Typical Pears and Materials

As shown in Figure 4a, the collision recovery coefficients between “pear-PVC material” and “pear-EVA foaming material” were calibrated by the method of free fall collision. A pear was released at a height of H = 400 mm from the contact material plate, and it was rebounded when it hit the material plate. The highest rebound height h was measured by the high-speed camera system (Figure 4b). The collision recovery coefficient ex is the ratio of normal instantaneous separation velocity v1 to instantaneous contact velocity v0 at the collision contact point before and after the collision between pears and materials, and it is as follows:
e x = v 1 v 0 = 2 g h 2 g H = h H
According to Table 1 and Table 2, simulation experiments were carried out by EDEM (Figure 4c). H and h were recorded, respectively.

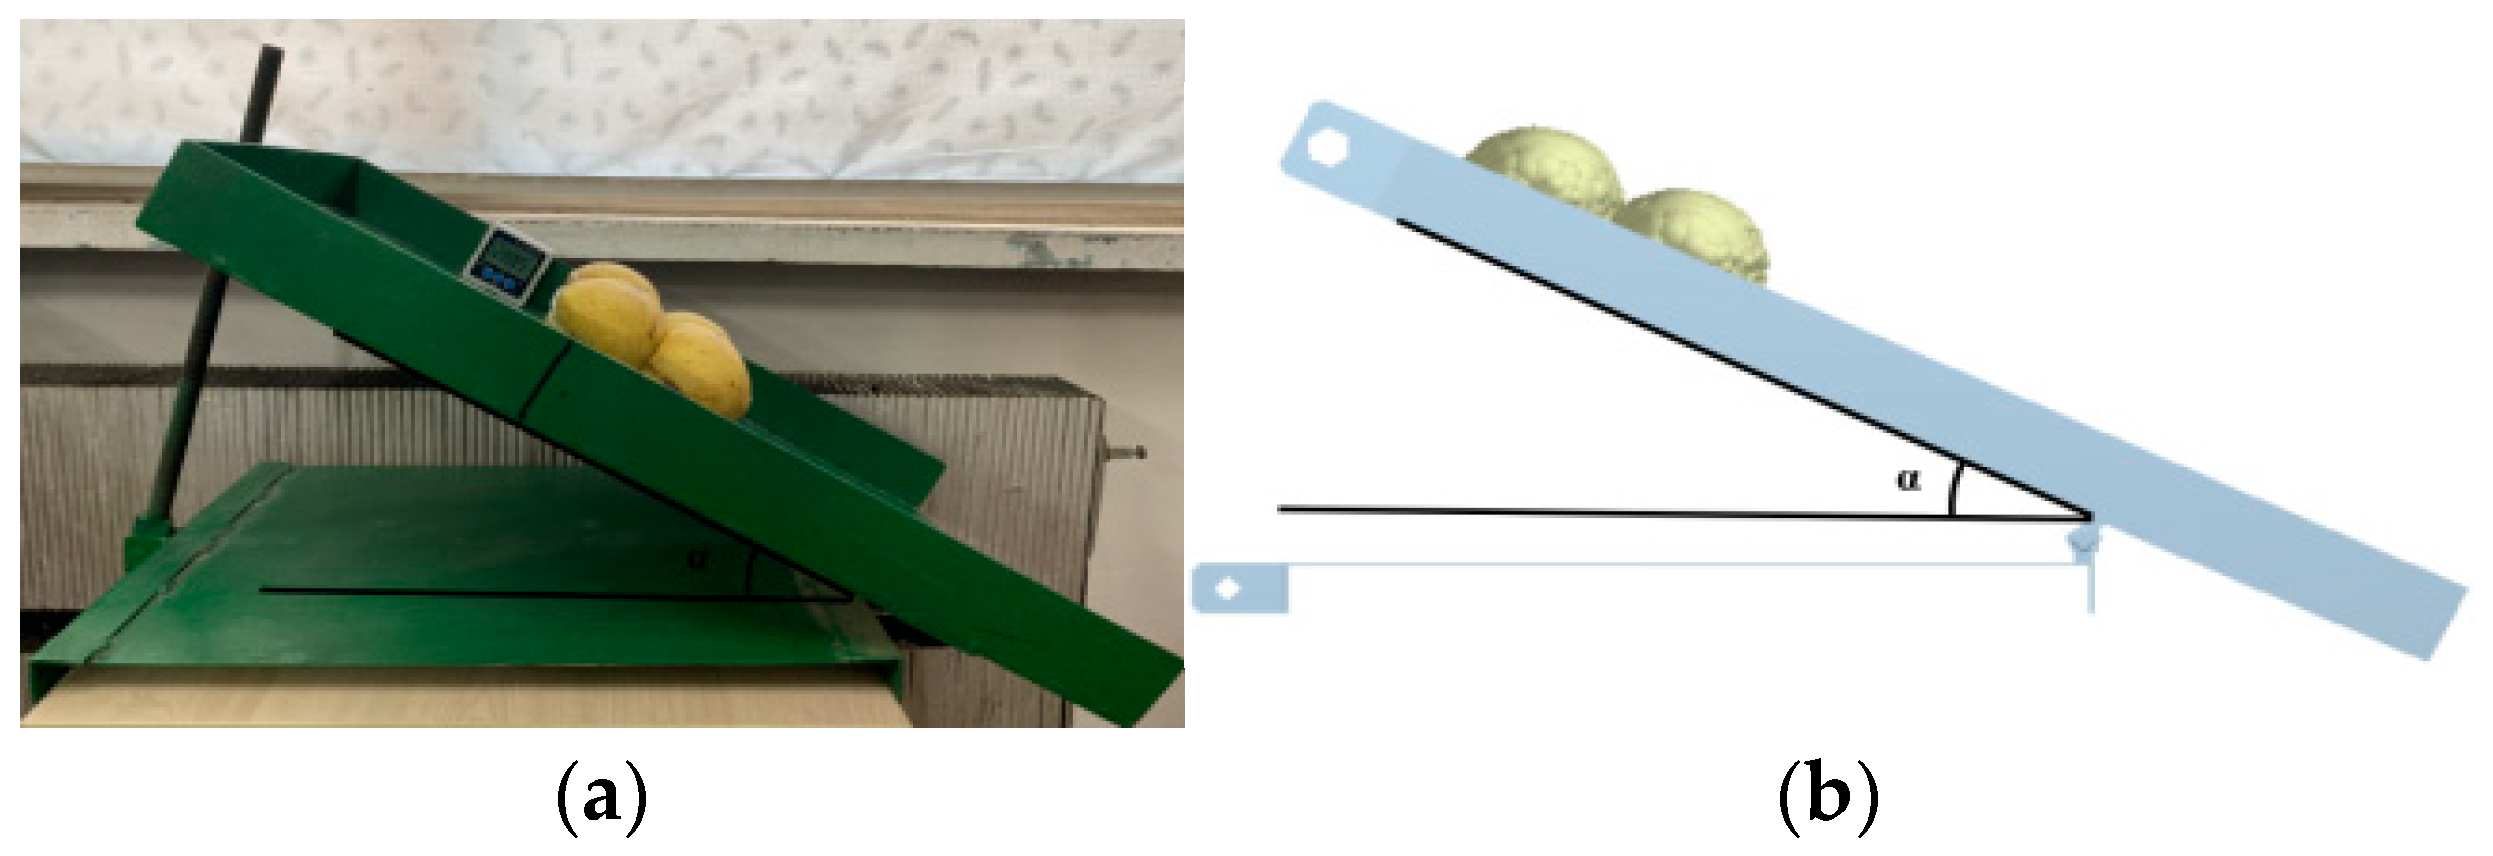
2.2.2. Calibration of Static Friction Coefficient between Typical Pears and Materials

The static friction coefficient between pears and materials was calibrated by the method of inclined sliding. The relationship between the static friction coefficient μs and the inclined plane angle α was as follows:
μ s = tan α
The measuring instrument of static friction coefficient was shown in Figure 5, which mainly included an inclined plate and a digital display inclinometer (resolution: 0.05°, accuracy: ±0.2°, range: 0°~90°).
The digital display inclinometer was placed on one end of the inclined plate, and the PVC and EVA foam material were fixed on the inclined plate in turn. In order to prevent a pear rolling, four pears with similar sizes were bonded into one group. Placing a pear on the left end of the contact material on the inclined plate and raising it slowly and uniformly, the angle α of the digital display inclinometer when the pear began to slide was recorded.

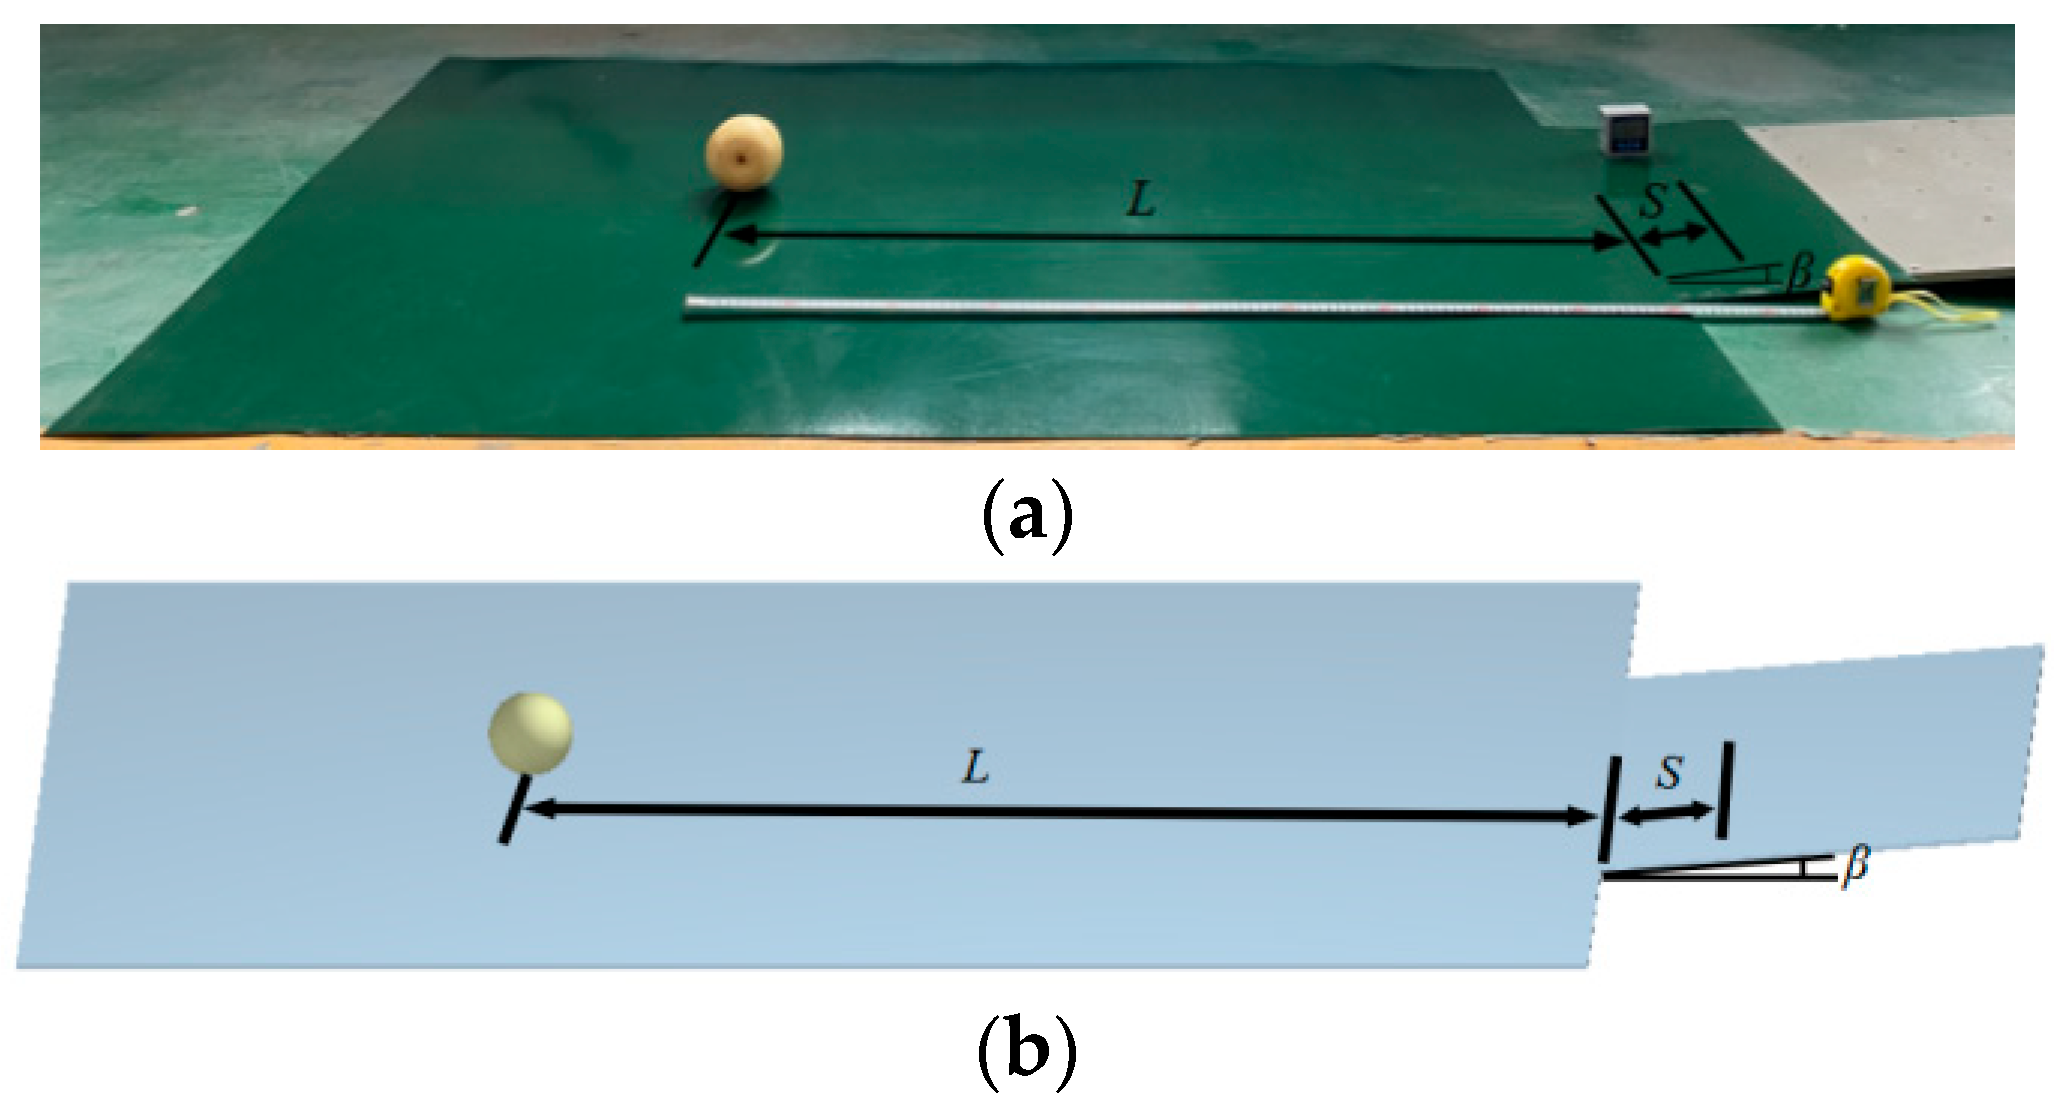
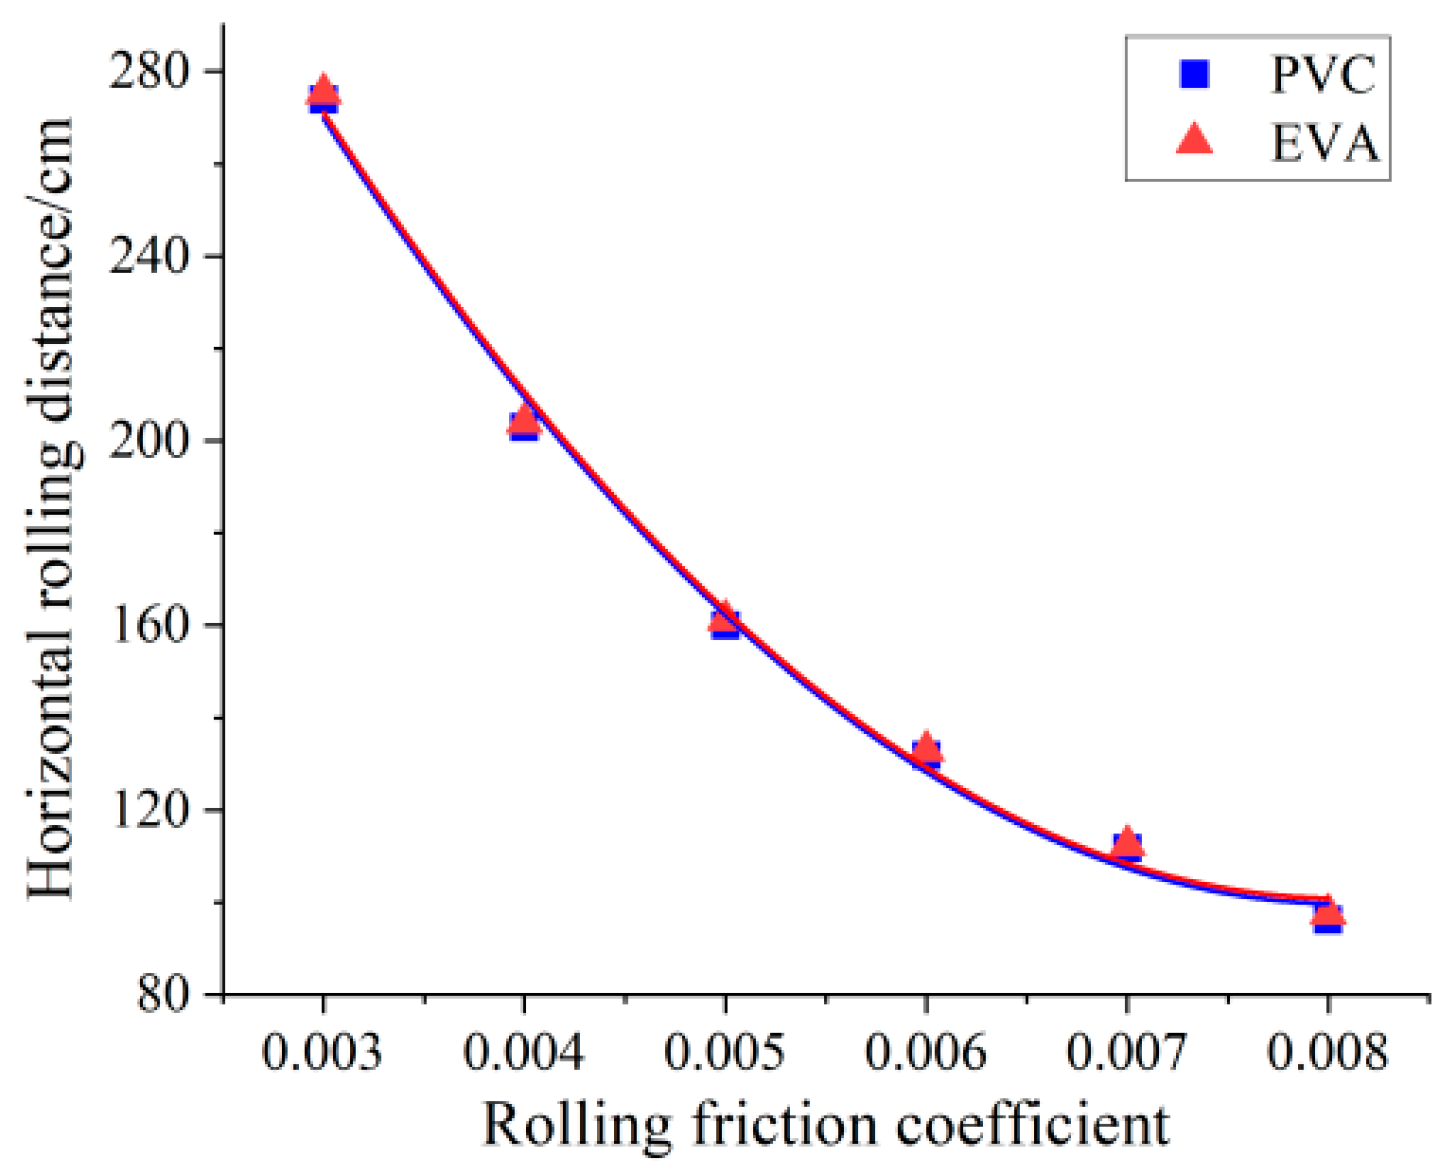
2.2.3. Calibration of Rolling Friction Coefficient between Typical Pears and Materials

The rolling friction coefficient between pears and materials was calibrated by the method of inclined plane rolling, as shown in Figure 6. According to the law of conservation of energy, there was as follows:
m g S sin β = μ r m g ( S cos β + L )
where μr is rolling friction coefficient; m was the fruit mass of pear, g; g is gravity acceleration, 9.8 m/s2; S is the rolling distance of the inclined plane, mm; β is the inclination angle of the inclined plane, °; L is the rolling distance, cm.
Because of the big size of pears, the rolling distance was longer if β and S were bigger, which had caused deviation from the straight line, If β and S were smaller, the rolling distance was smaller, and it was difficult to measure. Therefore, after a lot of rolling experiments, β was 5°, and S was 100 mm.

2.3. Calibration of Contact Parameters between Typical Pears

2.3.1. Calibration of Collision Recovery Coefficient between Typical Pears

In order to reduce the influence of the shape and quality of pears, the pears with a similar size and quality were selected when collision recovery coefficient between pears was measured. As shown in Figure 7, several pears with similar shape were bonded together, and a single pear was released at the height of 400 mm. If it collided with one of the pears, the highest rebound height was measured by the high-speed camera system. If it fell into the space between pears, the experiment had to be repeated.

2.3.2. Calibration of Pear Accumulation Angle

(1)
Experiment of Pear Accumulation Angle
As shown in Figure 8, the experiment device was composed of a box body (length 400 mm, width is 300 mm, height 600 mm), baffle plate (length 400 mm, height 600 mm) and bottom plate (length 1500 mm, width 1500 mm). The inner wall materials of the box body were PVC and EVA in turn. By the method of extracting the baffle on one side of the box at a constant speed upward (0.05 m/s) [23], the experiments were carried out, and the results showed that the inner wall material of the box body had no significant difference on the accumulation angle. Therefore, PVC material was used. After the pear group was stable, the angle between the inclined plane formed by the pear group and the horizontal floor plane was the pear accumulation angle.
(2)
Experiment of the steepest ascent
In order to determine the optimal value of influencing factors of the pear accumulation angle, the steepest ascent experiment was carried out. Considering the coefficient of collision recovery, the coefficient of static friction and the coefficient of rolling friction between pears, the accumulation angle error between the experiment and simulation value was calculated. When the pear accumulation angle was simulated by EDEM, the radius of the pear was 0.8–1.2 times that of the physical model because pears varied in size and the contact parameters were set according to their calibration values.
(3)
Experiment of horizontal rotation combinations
According to the optimal value interval of the coefficient of collision recovery (e), the coefficient of static friction (μn) and the coefficient of rolling friction (μf) between pears, five-level simulation experiments of the pear accumulation angle were designed for each factor by the method of orthogonal rotation combination, whose codes were shown in Table 3.
(4)
Experiment of verification
In order to verify the above simulation parameters, the experiment was carried out by the method of lifting bottomless barrel. As shown in Figure 9, lifting the barrel upward at the speed of 0.05 m/s, after the pear group was stable, the angle between the inclined plane formed by the pear group and the horizontal floor plane was the pear accumulation angle.

3. Results and Discussion

3.1. Contact Parameters between Typical Pears and Materials

3.1.1. Collision Recovery Coefficient between Typical Pears and Materials

According to the Section 2.2.1, when selecting pears of similar size and quality, the experiments for each variety were carried out five times. The average of the maximum rebound height was substituted into Formula (1), and collision recovery coefficient between typical pears and materials was obtained. The results were shown in Table 4.
In order to reduce the interference factors, the static friction coefficient and rolling friction coefficient between the pear and material were set as 0, and the collision recovery coefficient was from 0.1 to 0.9 at an equal interval of 0.1 in EDEM. The experiments for each variety were carried out five times, and the average of the maximum rebound height was recorded. Taking Snow pear as an example, the relationship between the collision recovery coefficient and the maximum rebound height was shown in Figure 10.
Thus, by the method of origin, the fitting equations were shown as follows:
h 1 = 425.40 e x 1 2 30.80 e x 1 0.17 ,   ( R 2 = 0.99 )
h 2 = 488.05 e x 2 2 114.60 e x 2 + 10.93 ,   ( R 2 = 0.99 )
The rebound height between Snow pear and contact material in Table 4 was substituted into Equations (4) and (5), and ex1 was 0.542, and ex2 was 0.652. The collision recovery coefficients were set as the above parameters in EDEM, the maximum simulated rebound height of Snow pear and contact materials were 143.71 mm and 145.87 mm, respectively, which were consistent with measured values. The errors between simulated values and measured value were 1.72% and 1.57%, respectively, which indicated that ex1 and ex2 were accurate and reliable.
Thus, the simulated values of collision recovery coefficients between other pear varieties and materials were shown in Table 5.

3.1.2. Static Friction Coefficient between Typical Pears and Materials

According to the Section 2.2.2, the experiments for each variety were carried out five times. The average of the maximum inclination angle was substituted into Formula (2), and static friction coefficient between typical pears and materials was obtained. The results were shown in Table 6.
According to Table 5, the collision recovery coefficient was set, and the rolling friction coefficient was set as 0, the static friction coefficient was from 0.1 to 0.9 at an equal interval of 0.1 in EDEM. The experiments for each variety were carried out five times, and the average of the maximum inclination angle was recorded. Taking Snow pear as an example, the relationship between the static friction coefficient and the maximum inclination angle was shown in Figure 11.
Thus, by the method of origin, the fitting equations were shown as follows:
α 1 = 14.91 μ s 1 2 + 60.34 μ s 1 0.12 ,   ( R 2 = 0.99 )
α 2 = 24.79 μ s 2 2 + 64.78 μ s 2 0.52 ,   ( R 2 = 0.99 )
where, α1, α2 is inclination angle of Snow pears and PVC and EVA foam materials, respectively; μs1, μs2 is static friction coefficient between Snow pears and PVC and EVA foam materials, respectively.
The inclination angle of Snow pears and materials in Table 6 was substituted into Equations (6) and (7), and μs1 was 0.686, and μs2 was 0.472. The static friction coefficients were set as the above parameters in EDEM, the maximum simulated inclination angle of Snow pear and materials were 33.58° and 23.98°, respectively, which were consistent with measured values. The errors between simulated values and measured value were 1.98% and 2.28%, respectively, which indicated that μs1 and μs2 were accurate and reliable.
Thus, the simulated values of static friction coefficient between other pear varieties and contact materials were shown in Table 7.

3.1.3. Rolling Friction Coefficient between Typical Pears and Materials

According to the Section 2.2.3, the experiments for each variety were carried out 30 times. The average of the maximum rolling distance was substituted into Formula (3), and rolling friction coefficient between typical pears and materials was obtained. The results were shown in Table 8.
According to Table 5 and Table 7, the collision recovery coefficient and the static friction coefficient were set, and the rolling friction coefficient was from 0.003 to 0.008 at an equal interval of 0.001 in EDEM. The experiments for each variety were carried out 30 times, and the average of the maximum rolling distance was recorded. Taking Snow pear as an example, the relationship between the rolling friction coefficient and the maximum rolling distance was shown in Figure 12.
Thus, by the method of origin, the fitting equations were shown as follows:
L 1 = 659017857 μ r 1 2 10650682 μ r 1 + 529.98 ,   ( R 2 = 0.99 )
L 2 = 662982143 μ r 2 2 10697546 μ r 2 + 532.38 ,   ( R 2 = 0.99 )
where, μr1, μr2 is rolling friction coefficient between Snow pears and PVC and EVA foam materials, respectively; L1, L2 is rolling distance of Snow pears and PVC and EVA foam materials, respectively, in cm.
The rolling distance of Snow pears and materials in Table 8 was substituted into Equations (8) and (9), and μr1 was 0.00597, and μr2 was 0.00706. The rolling friction coefficient were set as the above parameters in EDEM, the simulated inclination angle of Snow pear and materials were 130.24 cm and 108.97 cm, respectively, which were consistent with measured values. The errors between simulated values and measured value were 1.06% and 1.36%, respectively, which indicated that μr1 and μr2 were accurate and reliable.
Thus, the simulated values of static friction coefficient between other pear varieties and contact materials were shown in Table 9.

3.2. Calibration of Contact Parameters between Typical Pears

3.2.1. Calibration of Collision Recovery Coefficient between Typical Pears

According to the Section 2.3.1, selecting pears of similar size and quality, the experiments for each variety were carried out five times. The average of the maximum rebound height was substituted into Formula (1), and collision recovery coefficient between typical pears was obtained. The results were shown in Table 10.

3.2.2. Pear Accumulation Angle

According to the Section 2.3.2 (1), the experiments of pear accumulation angle was carried out. It was obtained to process the image of pears with Matrix Laboratory software. There were four steps. The first one was to read the original image (Figure 13a), and the second one was to process gray scale and binarization (Figure 13b), and the third one was to extract the image boundary contour (Figure 13c), and the last one was linear fitting (Figure 13d). The angle between the fitting line and the horizontal plane was the measured pear accumulation angle.
The average values were taken 10 times for each variety. The measured pear accumulation angle was obtained. The accumulation angles of Snow pear, Crisp pear, Huangguan pear and Qiuyue pear were 18.45°, 17.93°, 18.26° and 18.09°, respectively.

3.2.3. Optimal Value of Influencing Factors of the Pear Accumulation Angle

Considering the coefficient of collision recovery (e), the coefficient of static friction (μn) and the coefficient of rolling friction between pears (μf), the steepest ascent experiment was carried out to determine the optimal value of influencing factors of the pear accumulation angle. The collision recovery coefficient between pears was from 0.50 to 0.70 according to Table 10. The static friction coefficient of most agricultural materials is from 0.20 to 0.50 [34,35], and the rolling friction coefficient is from 0.01 to 0.05 [36,37]. Therefore, the design and the results of steepest ascent experiment were shown in Table 11. Among them, θ, was the simulated value of the pear accumulation angle, and σ was the error between the simulated value and the measured value.
As shown in Table 11, with the improvement of the static friction coefficient and rolling friction coefficient between pears, σ decreased first and then increased. When the simulated parameters were the second combination, σ is the smallest, at only 1.69%. Therefore, the optimal values of influencing factors of the pear accumulation angle was obtained, which were the first, the second and the third combination.

3.2.4. Error Optimization Model of the Pear Accumulation Angle

According to the above analysis, the coefficient of collision recovery (e), the coefficient of static friction (μn) and the coefficient of rolling friction between pears affected the pear accumulation angle. By the method of orthogonal rotation combination, five-level simulation experiments of the pear accumulation angle were designed for each factor. The codes were shown in Table 12, and the results were shown in Table 13.
Using Design-Expert 8.0.6 to analyze the experimental data, the error regression model of the pear accumulation angle was as follows:
Y = 1.46 + 0.46 A 2.10 B 0.84 C + 0.13 A B + 0.14 A C + 1.23 B C + 0.48 A 2 + 1.52 B 2 + 0.53 C 2
According to the model, the p value was calculated by the F-test and the influence of each factor on the error of accumulation angle was analyzed, which was shown in Table 14.
As shown in Table 14, p < 0.01 showed that the error regression model of the pear accumulation angle was extremely significant. The fitting coefficient is 0.9306, which indicated the model had a high fitting degree. The static friction coefficient and rolling friction coefficient between pears had significant influence on the pear accumulation angle, while the collision recovery coefficient between pears had little influence. The main reason was that the pear’s size was bigger, which had caused the bigger voids and a rapid dissipation of energy. Therefore, the error model of pear accumulation angle can be simplified as follows:
Y = 1.46 2.10 B 0.84 C + 1.23 B C + 1.52 B 2
According to the above analysis, the collision recovery coefficient was set as intermediate level. In order to determine the optimal simulation parameters of, static friction coefficient and rolling friction coefficient between pears, the error optimization model of the pear accumulation angle was as follows:
min Y ( B , C ) s . t . A = 0.54 1.682 B 1.682 1.682 C 1.682
When the collision recovery coefficient between pears was 0.54, and the static friction coefficient was 0.27, and rolling friction coefficient was 0.020, the error between the measured value and simulation value of accumulation angle was 0.73%. The same parameters were set in EDEM, the accumulation angle was 18.32°, which was consistent with the measured value. Using the method of combining direct measurement and virtual calibration, Mu Guizhi [38] determined the simulation parameters of sweet potato leaves, the error between the measured value and simulation value of accumulation angle was 0.972%. It was obvious that the error between the measured value and simulation value of pear accumulation angle was smaller than that of sweet potato leaves.
In the same way, the simulation parameters of other pear variety were obtained. The results were shown in Table 15.
According to [26], the collision recovery coefficient, the static friction coefficient and the rolling friction coefficient between Panax notoginseng seeds were 0.492, 0.202 and 0.083, respectively. In [27], the three coefficients between cotton seeds were 0.413, 0.695 and 0.214, respectively. Compared with them, the collision recovery coefficient between pears was similar, and the static friction coefficient and the rolling friction coefficient between pears were smaller because the pears’ surface was smooth. So these results indicated the simulation parameters of pears were accurate and reliable.

3.2.5. Verification of Simulation Parameters between Pears

According to the Section 2.3.2 (4), the experiment was carried out by the method of lifting bottomless barrel to verify the simulation parameters between pears. The average values were taken 10 times for each variety. The measured and simulated pear accumulation angles were obtained. The results were shown in Table 16.
According to [39], the error of the accumulation angle of potato minituber between the physical experiment and the simulation experiment was about 2.06%, the errors of pears between the measured value and simulated value were all less than 2.5% as shown in Table 16, which indicated that the simulation parameters calibration based on DEM was accurate and reliable.

4. Conclusions

(1)
Based on the intrinsic parameters of four kinds of pears (Snow pear, Crisp pear, Huangguan pear and Qiuyue pear), their simulation models were constructed by the method of DEM. The simulation parameters between pears and the contact material (PVC, EVA foam material) were calibrated by the methods of free fall collision, inclined sliding and rolling, respectively. The collision recovery coefficients of Snow pear, Crisp pear, Huangguan pear and Qiuyue pear with PVC material were 0.542, 0.516, 0.624 and 0.573, respectively; and the static friction coefficients were 0.686, 0.651, 0.627 and 0.661, respectively; and the rolling friction coefficients were 0.00597, 0.00602, 0.00323 and 0.00627, respectively. The collision recovery coefficients between Snow pear, Crisp pear, Huangguan pear and Qiuyue pear wih EVA foam material were 0.652, 0.608, 0.678 and 0.641, respectively; and the static friction coefficients were 0.472, 0.491, 0.394 and 0.574, respectively; and the rolling friction coefficients were 0.00706, 0.00735, 0.00638 and 0.00714, respectively.
(2)
The pear accumulation angle was obtained by experimental measurement. The steepest ascent experiment was carried out to determine the optimal value of influencing factors of the pear accumulation angle. Considering the coefficient of collision recovery, the coefficient of static friction and the coefficient of rolling friction between pears, five-level simulation experiments of the pear accumulation angle were designed for each factor by the method of orthogonal rotation combination. The regression model of the error between the measured value and the simulated value of the pear accumulation angle was established, and the influence of three factors on the pear accumulation angle was analyzed. The results showed that the collision recovery coefficients of Snow pear, Crisp pear, Huangguan pear and Qiuyue pear were 0.54, 0.44, 0.51, and 0.48, respectively; and the coefficients of static friction were 0.27, 0.24, 0.31, and 0.28, respectively; and the coefficients of rolling friction were 0.020, 0.024, 0.018, and 0.027, respectively.
(3)
The accumulation angle verification experiments were carried out by the method of bottomless barrel lifting. The results showed that the relative error between the simulated and measured accumulation angle of four kinds of pears were 1.42%, 1.68%, 2.19% and 1.83%, respectively, which indicated that the calibrated simulation parameters were reliable. The research can provide a basis for the design and parameter optimization of harvesting machinery of pears.

Author Contributions

Conceptualization, G.F. and M.G.; methodology, G.F. and S.W.; validation, S.W. and Z.G.; datacuration, W.S.; writing—original draft preparation, G.F.; writing—review and editing, M.G. All authors have read and agreed to the published version of the manuscript.

Funding

This research was supported by Shandong Provincial Natural Science Foundation (Grant No. ZR2018MC017), Shandong Key Laboratory of Horticultural Machinery and Equipment Project (Grant No. YYJX-2019-07), Technical Innovation Guide Plan of Shandong Province: Shandong-Chongqing Total Cooperation Project (Grant No. 2020LYXZ021) and the Natural Science Foundation of Tianjin (Grant No. 19JCYBJC19100).

Institutional Review Board Statement

Not applicable.

Informed Consent Statement

Not applicable.

Conflicts of Interest

The authors declare no conflict of interest.

References

  1. Wang, G.M.; Gu, C.; Qiao, X.; Zhao, B.Y.; Ke, Y.Q.; Guo, B.B.; Hao, P.P.; Qi, K.J.; Zhang, S.L. Characteristic of pollen tube that grew into self style in pear cultivar and parent assignment for cross-pollination. Sci. Hortic. 2017, 216, 226–233. [Google Scholar] [CrossRef]
  2. Zhang, J.; Li, J.; Xue, C.; Wang, R.; Zhang, M.; Qi, K.; Fan, J.; Hu, H.; Zhang, S.; Wu, J. The variation of stone cell content in 236 germplasms of sand pear (Pyrus pyrifolia) and identification of related candidate genes. Hortic. Plant J. 2021, 7, 108–116. [Google Scholar] [CrossRef]
  3. Winzer, F.; Kraska, T.; Elsenberger, C.; Kötter, T.; Pude, R. Biomass from fruit trees for combined energy and food production. Biomass Bioenerg. 2017, 107, 279–286. [Google Scholar] [CrossRef]
  4. Musacchi, S.; Iglesias, I.; Neri, D. Training Systems and Sustainable Orchard Management for European Pear (Pyrus communis L.) in the Mediterranean Area: A Review. Agronomy 2021, 11, 1765. [Google Scholar] [CrossRef]
  5. Seo, H.J.; Chen, P.A.; Song, J. Model based on temperature parameters predicts optimal harvest date for ‘Whasan’ Asian pear. Hortic. Env. Biotechnol. 2020, 61, 807–814. [Google Scholar] [CrossRef]
  6. Zicheng, G.; Guoyou, P.; Lijun, L.; Kaijie, Z.; Xiaochen, W.; Chengcai, J. Design of hand-operated piggyback jaw gripper type simplified picker for pear. Trans. Chin. Soc. Agric. Eng. 2019, 35, 39–45. (In Chinese) [Google Scholar]
  7. Kim, S.; Yang, S.; Cho, M.S.; Chung, S.J. Understanding the drivers of liking for fresh pears: A cross-cultural investigation of Chinese and Korean panels and consumers. J. Sci. Food Agric. 2019, 99, 5092–5101. [Google Scholar] [CrossRef]
  8. Liu, X.; Tian, D.; Song, M.; Geng, D.; Zhao, Y. Design and Experiment on Pneumatic Flexible Gripper for Picking Globose Fruit. Trans. Chin. Soc. Agric. Mach. 2021, 52, 30–43. (In Chinese) [Google Scholar]
  9. Kong, X.; Liu, J.; Yang, T.; Su, Y.; Geng, J.; Niu, Z. Numerical simulation of feed pellet breakage in pneumatic conveying. Biosyst. Eng. 2022, 218, 31–42. [Google Scholar] [CrossRef]
  10. Wang, X.; Zhang, S.; Pan, H.; Zheng, Z.; Huang, Y.; Zhu, R. Effect of soil particle size on soil-subsoiler interactions using the discrete element method simulations. Biosyst. Eng. 2019, 182, 138–150. [Google Scholar] [CrossRef]
  11. Zeng, Z.; Chen, Y. Simulation of straw movement by discrete element modelling of straw-sweep-soil interaction. Biosyst. Eng. 2019, 180, 25–35. [Google Scholar] [CrossRef]
  12. Ding, X.; Wei, Y.; Yan, Z.; Zhu, Y.; Cao, D.; Li, K.; He, Z.; Cui, Y. Simulation and Experiment of the Spiral Digging End-Effector for Hole Digging in Plug Tray Seedling Substrate. Agronomy 2022, 12, 779. [Google Scholar] [CrossRef]
  13. Wang, X.; Yu, J.; Lv, F.; Wang, Y.; Fu, H. A multi-sphere based modelling method for maize grain assemblies. Adv. Powder Technol. 2017, 28, 584–595. [Google Scholar] [CrossRef]
  14. Adilet, S.; Zhao, J.; Sayakhat, N.; Chen, J.; Nikolay, Z.; Bu, L.; Sugirbayeva, Z.; Hu, G.; Marat, M.; Wang, Z. Calibration Strategy to Determine the Interaction Properties of Fertilizer Particles Using Two Laboratory experiments and DEM. Agriculture 2021, 11, 592. [Google Scholar] [CrossRef]
  15. Zhou, H.; Hu, Z.; Chen, J.; Lv, X.; Xie, N. Calibration of DEM models for irregular particles based on experimental design method and bulk experiments. Powder Technol. 2018, 332, 210–223. [Google Scholar] [CrossRef]
  16. Coetzee, C.J. Calibration of the discrete element method and the effect of particle shape. Powder Technol. 2016, 297, 50–70. [Google Scholar] [CrossRef]
  17. Liu, F.; Li, D.; Zhang, T.; Lin, Z. Analysis and calibration of quinoa grain parameters used in a discrete element method based on the repose angle of the particle heap. INMATEH-Agric. Eng. 2020, 61, 77–86. [Google Scholar] [CrossRef]
  18. Zeng, Z.W.; Ma, X.; Cao, X.L.; Li, Z.H.; Wang, X.C. Critical Review of Applications of Discrete Element Method in Agricultural Engineering. Trans. Chin. Soc. Agric. Mach. 2021, 52, 1–20. (In Chinese) [Google Scholar]
  19. Chen, Z.; Wassgren, C.; Veikle, E.; Ambrose, K. Determination of material and interaction properties of maize and wheat kernels for DEM simulation. Biosyst. Eng. 2020, 195, 208–226. [Google Scholar] [CrossRef]
  20. Zhang, S.; Tekeste, M.Z.; Li, Y.; Gaul, A.; Zhu, D.; Liao, J. Scaled-up rice grain modelling for DEM calibration and the validation of hopper flow. Biosyst. Eng. 2020, 194, 196–212. [Google Scholar] [CrossRef]
  21. Li, X.; Du, Y.; Liu, L.; Mao, E.; Yang, F.; Wu, J.; Wang, L. Research on the constitutive model of low-damage corn threshing based on DEM. Comput. Electron. Agric. 2022, 194, 106722. [Google Scholar] [CrossRef]
  22. Nguyen, T.X.; Le, L.M.; Nguyen, T.C.; Nguyen, N.T.H.; Le, T.T.; Pham, B.T.; Le, V.M.; Ly, H.B. Characterization of soybeans and calibration of their DEM input parameters. Part. Sci. Technol. 2020, 39, 530–548. [Google Scholar] [CrossRef]
  23. Wenzheng, L.; Jin, H.; Hongwen, L.; Xueqiang, L.I.; Kan, Z.H.E.N.G.; Zhongcai, W.E.I. Calibration of Simulation Parameters for Potato Minituber Based on EDEM. Trans. Chin. Soc. Agric. Mach. 2018, 49, 125–135. (In Chinese) [Google Scholar]
  24. Liu, Y.; Mi, G.; Zhang, S.; Li, P.; Huang, Y. Determination of Discrete Element Modelling Parameters of Adzuki Bean Seeds. Agriculture 2022, 12, 626. [Google Scholar] [CrossRef]
  25. Hao, J.J.; Wei, W.B.; Huang, P.C.; Qin, J.H.; Zhao, J.G. Calibration and experimental verification of discrete element parameters of oil sunflower seeds. Trans. Chin. Soc. Agric. Eng. 2021, 37, 36–44. (In Chinese) [Google Scholar]
  26. Yu, Q.X.; Liu, Y.; Chen, X.B.; Sun, K.; Lai, Q.H. Calibration and Experiment of Simulation Parameters for Panax notoginseng Seeds Based on DEM. Trans. Chin. Soc. Agric. Mach. 2020, 51, 123–132. (In Chinese) [Google Scholar]
  27. Bai, S.; Yuan, Y.; Niu, K.; Zhou, L.; Zhao, B.; Wei, L.; Liu, L.; Xiong, S.; Shi, Z.; Ma, Y.; et al. Simulation Parameter Calibration and Experimental Study of a Discrete Element Model of Cotton Precision Seed Metering. Agriculture 2022, 12, 870. [Google Scholar] [CrossRef]
  28. Hou, Z.F.; Dai, N.; Chen, Z.; Qiu, Y.; Zhang, X.W. Measurement and calibration of physical property parameters for Agropyron seeds in a discrete element simulation. Trans. Chin. Soc. Agric. Eng. 2020, 36, 46–54. (In Chinese) [Google Scholar]
  29. Hao, J.J.; Long, S.F.; Li, H.; Jia, Y.L.; Ma, Z.K.; Zhao, J.G. Development of discrete element model and calibration of simulation parameters for mechanically-harvested yam. Trans. Chin. Soc. Agric. Eng. 2019, 35, 34–42. (In Chinese) [Google Scholar]
  30. Yu, F.H.; Zhou, C.Q.; Yang, X.; Guo, Z.H.; Chen, C.L. Design and Experiment of Tomato Picking Robot in Solar Greenhouse. Trans. Chin. Soc. Agric. Mach. 2022, 53, 41–49. (In Chinese) [Google Scholar]
  31. JIANG, K.; Liping, C.E.H.N.; ZHANG, Q. Design and Experiment on Flexible Clamping and Conveying Mechanism of Vegetable Grafting Robot. Trans. Chin. Soc. Agric. Mach. 2020, 51, 63–71. (In Chinese) [Google Scholar]
  32. Wen, X.; Yuan, H.; Wang, G.; Jia, H. Calibration Method of Friction Coefficient of Granular Fertilizer by Discrete Element Simulation. Trans. Chin. Soc. Agric. Mach. 2020, 51, 115–122. (In Chinese) [Google Scholar]
  33. Wang, Z.; Lin, S. Tests and FE analysis for dynamic responses of packaged products underrandom vibration environment. J. Vib. Shock. 2017, 36, 223–229. (In Chinese) [Google Scholar]
  34. Shi, L.; Sun, W.; Zhao, W.; Yang, X.; Feng, B. Parameter determination and validation of discrete element model of seed potato mechanical seeding. Trans. Chin. Soc. Agric. Eng. 2018, 34, 35–42. (In Chinese) [Google Scholar]
  35. Zhang, S.; Zhang, R.; Chen, T.; Fu, J.; Yuan, H. Calibration of Simulation Parameters of Mung Bean Seeds Using Discrete Element Method and Verification of Seed-metering experiment. Trans. Chin. Soc. Agric. Mach. 2022, 53, 71–79. (In Chinese) [Google Scholar]
  36. Scheffler, O.C.; Coetzee, C.J.; Opara, U.L. A discrete element model (DEM) for predicting apple damage during handling. Biosyst. Eng. 2018, 172, 29–48. [Google Scholar] [CrossRef] [Green Version]
  37. Kafashan, J.; Wiacek, J.; Ramon, H.; Mouazen, A.M. Modelling and simulation of fruit drop experiments by discrete element method. Biosyst. Eng. 2021, 212, 228–240. [Google Scholar] [CrossRef]
  38. Guizhi, M.; Xieteng, Q.; Wanzhi, Z.; Zhaoqin, L.; Tingting, Z.; Shuwen, W. Parameter Measurement and Calibration in Discrete Element Simulation of Broken Sweet Potato Seedlings. Am. J. Biochem. Biotechnol. 2021, 17, 256–266. [Google Scholar]
  39. Yu, C.; Duan, H.; Cai, X.; Xu, T.; Yao, F.; Chen, Z.; Yan, F. Discrete element simulation parameters-based measurement of materials for potato minituber. J. Huazhong Agric. Univ. 2021, 40, 210–217. (In Chinese) [Google Scholar]
Figure 1. Outer contour curve of Snow pear.
Agronomy 12 01720 g001
Figure 2. Geometric models of typical pears. Snow pear (a); Crisp pear (b); Qiuyue pear (c); Huangguan pear (d). Note: Blue is the origin of the coordinate system for the pear geometric model.
Agronomy 12 01720 g002
Figure 3. EDEM simulation models of typical pears. Snow pear (a); Crisp pear (b); Qiuyue pear (c); Huangguan pear (d).
Agronomy 12 01720 g003
Figure 4. Calibration experiment of collision recovery coefficient between pears and materials. Experiment principle (a); Physical experiment (b); Simulation experiment (c).
Agronomy 12 01720 g004
Figure 5. Calibration experiment of static friction coefficient between pears and materials. Physical experiment (a); Simulation experiment (b).
Agronomy 12 01720 g005
Figure 6. Calibration experiment of rolling friction coefficient between pears and materials. Physical experiment (a); Simulation experiment (b).
Agronomy 12 01720 g006
Figure 7. Calibration experiment of collision recovery coefficient between typical pears.
Agronomy 12 01720 g007
Figure 8. Experiment of pear accumulation angle. Physical experiment (a); Simulation experiment (b).
Agronomy 12 01720 g008
Figure 9. Experiment of simulation parameters verification. Physical experiment (a); Simulation experiment (b).
Agronomy 12 01720 g009
Figure 10. Fitting curve of the collision recovery coefficient and the maximum rebound height.
Agronomy 12 01720 g010
Figure 11. Fitting curve of static friction coefficient and inclination angle.
Agronomy 12 01720 g011
Figure 12. Fitting curve of rolling friction coefficient and rolling distance.
Agronomy 12 01720 g012
Figure 13. Processing the image of pears with Matrix Laboratory software. Original image (a); Grayscale processing (b); Boundary outline (c); Linear fitting (d). Note: The black line is the contour boundary of the pear accumulation angle, and the red line is the fitting line.
Agronomy 12 01720 g013
Table 1. Intrinsic parameters of typical pears.
VarietySnow PearCrisp PearHuangguan PearQiuyue Pear
Transverse diameter D/mm79.61 ± 4.876.81 ± 4.677.39 ± 3.970.69 ± 2.7
Longitudinal height H/mm88.38 ± 4.569.14 ± 4.473.74 ± 4.261.77 ± 2.5
Mass/g381.95 ± 50.11272.87 ± 43.89301.56 ± 37.52207.59 ± 26.04
Density/(kg·m−3)985.07 ± 17.35944.64 ± 54.931049.30 ± 45.611012.80 ± 40.77
Moisture content/%89.28 ± 4.8587.14 ± 2.7887.53 ± 0.2789.56 ± 0.15
Poisson’s ratio0.480.360.400.24
Young’s modulus/MPa3.162.692.180.84
Shear modulus/MPa1.070.990.780.34
Table 2. Simulation parameters of contact materials.
MaterialParameterValue
PVCPoisson’s ratio0.47
Shear modulus/MPa2.00
Density/(kg·m−3)1282.00
EVAPoisson’s ratio0.30
Shear modulus/MPa0.46
Density/(kg·m−3)79.09
Table 3. Codes of simulation experiment factors.
CodeExperiment Factors
eμnμf
−1.682111
−1222
0333
1444
1.682555
Table 4. Measured values of collision recovery coefficients between typical pears and materials.
VarietyContact MaterialMaximum Rebound Height/mmValue of Collision
Recovery Coefficient
Snow pearPVC141.280.594
EVA143.620.599
Crisp pearPVC96.140.490
EVA120.800.550
Huangguan pearPVC138.580.589
EVA152.180.617
Qiuyue pearPVC105.050.512
EVA131.240.573
Table 5. Simulated values of collision recovery coefficients between typical pears and materials.
VarietyContact MaterialCollision Recovery Coefficient
Snow pearPVC0.542
EVA0.652
Crisp pearPVC0.516
EVA0.608
Huangguan pearPVC0.624
EVA0.678
Qiuyue pearPVC0.573
EVA0.641
Table 6. Measured values of static friction coefficient between typical pears and materials.
VarietyContact MaterialInclination AngleStatic Friction Coefficient
Snow pearPVC34.26°0.681
EVA24.54°0.457
Crisp pearPVC33.21°0.655
EVA22.78°0.420
Huangguan pearPVC32.06°0.626
EVA21.60°0.396
Qiuyue pearPVC33.43°0.660
EVA29.90°0.575
Table 7. Simulated values of static friction coefficient between typical pears and materials.
VarietyContact MaterialStatic Friction Coefficient
Snow pearPVC0.686
EVA0.472
Crisp pearPVC0.651
EVA0.491
Huangguan pearPVC0.627
EVA0.394
Qiuyue pearPVC0.661
EVA0.574
Table 8. Measured values of rolling friction coefficient between typical pears and materials.
VarietyContact MaterialRolling Distance/cmRolling Friction
Coefficient
Snow pearPVC128.880.00629
EVA107.510.00742
Crisp pearPVC128.270.00631
EVA103.910.00766
Huangguan pearPVC125.090.00336
EVA119.790.00674
Qiuyue pearPVC122.290.00666
EVA106.660.00748
Table 9. Simulated values of static friction coefficient between other pear varieties and contact materials.
VarietyContact MaterialRolling Friction Coefficient
Snow pearPVC0.00597
EVA0.00706
Crisp pearPVC0.00602
EVA0.00735
Huangguan pearPVC0.00323
EVA0.00638
Qiuyue pearPVC0.00627
EVA0.00714
Table 10. Measured values of collision recovery coefficients between typical pears.
VarietyValue of Maximum Rebound Height/mmValue of Collision Recovery Coefficient
Snow pear100.40~194.880.501~0.698
Crisp pear71.57~106.500.423~0.516
Huangguan pear93.70~132.250.484~0.575
Qiuyue pear76.39~119.250.437~0.546
Table 11. Design and results of the steepest ascent experiment.
NumberExperiment FactorsExperiment Results
eμnμfθ,/(°)σ/%
10.500.100.0116.987.97
20.540.200.0218.141.69
30.580.300.0319.354.88
40.620.400.0420.5211.22
50.660.500.0522.7523.31
60.700.600.0623.4326.99
Table 12. Codes of simulation experiment factors.
CodeExperiment Factors
eμnμf
−1.6820.470.030.003
−10.500.10.01
00.540.20.02
10.580.30.03
1.6820.610.370.037
Table 13. Results of orthogonal rotation combination experiment.
NumberParameterθ,/(°)Y(σ)/%
A (e)B(μn)C(μf)
11−1117.465.37
2−11118.952.71
300018.131.73
401.682018.651.08
500018.002.44
61.6820017.942.76
7−11−118.231.19
811119.093.47
911−117.912.93
1000018.261.03
11−1.6820018.191.41
1200018.121.79
131−1−116.948.18
14001.68218.350.54
15−1−1117.793.58
1600018.241.14
1700018.290.87
180−1.682016.799.00
1900−1.68217.723.96
20−1−1−116.888.51
Table 14. Analysis of Variance.
SourceSum of SquaresDegree of FreedomMean SquareF-Valuep-Value
Model121.46913.5014.900.0001 **
A2.8512.853.140.1067
B60.09160.0966.33<0.0001 **
C9.5719.5710.570.0087 **
AB0.1310.130.150.7101
AC0.1610.160.180.6814
BC12.03112.0313.280.0045 **
A23.2513.253.590.0873
B233.27133.2736.730.0001 **
C24.0914.094.510.0596
Residual9.06100.91
Lack of Fit7.2951.464.110.0734
Pure error1.7750.35
Sum130.5219
Note: ** indicates extremely significant difference (p < 0.01).
Table 15. Simulation parameters of pears.
VarietyCollision Recovery CoefficientStatic Friction CoefficientRolling Friction Coefficient
Snow pear0.540.270.020
Crisp pear0.440.240.024
Huangguan pear0.510.310.018
Qiuyue pear0.480.280.027
Table 16. Verification of the pear accumulation angles.
VarietyMeasured ValueSimulated ValueError/%
Snow pear15.5315.751.42
Crisp pear15.0415.291.68
Huangguan pear15.3115.652.19
Qiuyue pear15.4915.771.83
Publisher’s Note: MDPI stays neutral with regard to jurisdictional claims in published maps and institutional affiliations.

