Article

The Course of Physiological Processes, Yielding, and Grain Quality of Hybrid and Population Wheat as Affected by Integrated and Conventional Cropping Systems

by
Marta Jańczak-Pieniążek
1,*,
Jan Buczek
1,
Cezary A. Kwiatkowski
2 and
Elżbieta Harasim
2
1
Department of Crop Production, University of Rzeszow, Zelwerowicza 4, 35-601 Rzeszow, Poland
2
Department of Herbology and Plant Cultivation Techniques, University of Life Sciences, Akademicka 13, 20-950 Lublin, Poland
*
Author to whom correspondence should be addressed.
Agronomy 2022, 12(6), 1345; https://doi.org/10.3390/agronomy12061345
Submission received: 8 May 2022 / Revised: 27 May 2022 / Accepted: 29 May 2022 / Published: 31 May 2022
(This article belongs to the Special Issue Wheat Agronomic and Quality Responses to Environmental Impacts)

Abstract

:
At present, under the conditions of climate change, for mainly environmental but also economic reasons, especially in the case of new wheat genotypes, alternative cropping systems are recommended in addition to the common conventional system. The aim of this study was to determine the effect of the integrated system (INTEG) and conventional system (CONV) on the physiological parameters, yield, and mineral composition of the grain, as well as the amount and quality of protein of winter wheat Hymalaya (hybrid cv.) and Formacja (population cv.) against the background of changing hydrothermal conditions in the years of the study. The field experiment was carried out in 2016–2019 in Przecław (50°11′00″ N, 21°29′00″ E), Poland. More favorable values of physiological parameters and grain yield were found in the CONV system than in the INTEG system. A more efficient course of the photosynthesis process in cv. Hymalaya effected a higher grain yield, which was similar in the INTEG system to that of cv. Formacja from the CONV system. The use of the CONV system effected an increase in the grain quality traits as well as the sum of gliadins and glutenins, including the subunits γ gliadins, LMW glutenins, and HMW glutenins. Grain of cv. Hymalaya from the INTEG system had higher contents of Fe, Mn, and Mg and more favorable composition of glutenin proteins and their HMW/LMW ratio than cv. Formacja. Higher values of quality traits and gluten protein fractions and subunits, along with a reduction in the grain yield of wheat cultivars, were favored by periods with rainfall deficit in the wheat ripening period, where low hydrothermal coefficients were recorded.

1. Introduction

Agriculture plays a significant role in the development of the economy, and agricultural practices greatly affect the state of the environment [1]. The decreasing area of arable land and the growing number of people necessitates the use of intensive crop production systems to prevent a reduction in crop yields under unfavorable growing conditions [2]. The conventional cultivation system (CONV) aimed at maximizing profits is associated with an increase in the use of means of production [3]. However, higher amounts of fertilizers and pesticides used in intensive cropping systems can increase the levels of nutrients and toxins in groundwater and surface water, thereby increasing healthcare and water treatment costs. Intensive agricultural practices in which high rates of nitrogen fertilization are used also have a negative effect on the soil environment, leading to an increase in the carbon footprint [4] and eutrophication of aquatic habitats, which results in a change in species composition and a reduction in the biodiversity of non-agricultural areas [1]. The integrated cropping system (INTEG) can be an alternative to the intensive, conventional crop production system. In the integrated system, the whole cultivation technology is skillfully linked with the limited consumption of industrial means of production, which results in an increase in the efficiency of the inputs and minimization of the negative impact on the natural environment. In the integrated system, the use of pesticides is limited to the necessary minimum, while the rates of mineral fertilizers are determined based on the soil’s nutrient content and the assessment of the plant’s nutritional status [3,5,6]. Expenses and inputs for agriculture can be minimized by optimizing production and selecting the right means of production [7]. According to Tuomisto et al. [5], the integrated cropping system aims for sustainability based on the natural processes of the organic system (ORG) and on modern technologies of the conventional system.
Cereals are the staple food of humanity and are used as the main source of calories. The fats, carbohydrates, and proteins contained in kernels play an essential role in the nutrition of people all over the world. Wheat, on the other hand, is a species that, among all cereals, has special flour strength, and the demand for it is still high due to its baking properties and the possibility of processing it into various food products [8]. This is possible due to the presence of storage proteins contained in the grains, which affect the viscoelasticity and extensibility to a dough. Based on their solubility, they can be divided into albumins, globulins, gliadins, and glutenins. Gliadins and glutenins are gluten proteins and are involved in building the gluten polymer and determining the baking properties of wheat [9]. Wheat is one of the most important species of arable crops, its cultivation area around the world is 216 million hectares, and its production is 766 million tons [10]. Wheat provides one-fifth of the world’s food protein and calories; thus, with the ever-growing human population and the need to provide these nutrients, it is imperative to increase world wheat production [8]. Hybrid breeding provides a chance to achieve this goal due to the greater resistance of plants to unfavorable environmental conditions and higher yield [11,12]. Better yield of hybrid wheat is the result of even plant growth and tolerance to frost, lodging, and diseases [13]. Hybrid breeding of wheat allows for a significant increase in yield, which is essential for food security and its cultivation in sustainable conditions. Such cultivation, however, requires the development of a simplified, sustainable hybridization process. Hybrid cultivars are therefore more productive in terms of yielding with additional higher tolerance to disease and environmental and agrotechnical stresses. The higher resistance and adaptability demonstrated by hybrid wheat for marginal land allows for more predictable yields in a wider range of environmental conditions. The higher yields obtained as a result of growing hybrid cultivars also compensate for the higher costs of producing their seeds compared to the population cultivars [14].
Choosing the right crop production system, which involves, inter alia, properly balanced fertilization, can positively affect the efficiency of the photosynthesis process, favoring the increase in chlorophyll fluorescence parameters and gas exchange, which in turn contributes to obtaining a higher grain yield [15,16]. The main purpose of wheat cultivation is to obtain raw material with appropriate quality properties, meeting the technological requirements, which is related to its further use. It is therefore important to apply the appropriate intensity of the cropping system, without unnecessarily burdening the natural resources of the environment. There is no sufficient information in the literature on the comparison of the photosynthesis process as well as the quality and fractional composition of protein in grain, especially of hybrid wheat cultivars grown in different cropping systems. Therefore, the aim of this study is to determine the effect of the integrated and conventional cropping systems on the value of physiological indices (chlorophyll content and fluorescence, gas exchange), yield, and quality parameters, including the quantity and quality of protein in the grain of a hybrid cultivar in relation to a population wheat cultivar.

2. Materials and Methods

2.1. Site and Experimental Set-Up

The two-factor field experiment was carried out in 2016/2017, 2017/2018, and 2018/2019 seasons at the Variety Assessment Research Station in Przecław, (50°11′00″ N, 21°29′00″ E), south-eastern Poland. The experiment was conducted in 3 replications and arranged in randomly selected blocks (6 m wide × 70 m long), which were each divided into 3 sub-blocks, and the plot area for harvest was 20 m2.
The experimental factors were:
-
Factor I—two cropping systems (CS): integrated (INTEG) and conventional (CONV) (Table 1),
-
Factor II—two winter wheat cultivars (C): hybrid Hymalaya and population Formacja.
Table 1. Agricultural practices depending on experimental treatment.
SpecificationCropping System (CS)
INTEGCONV
Previous croppeaspring wheat
Harvest
previous crop
straw chopped
and incorporated
straw baled
Tillagedisk harrow (12 cm),
plowing (20 cm)
shallow plowing (12 cm) + harrowing, plowing (25 cm)
N (ammonium nitrate)90 kg·ha−1
(three applications: 40 + 30 + 20)
180 kg·ha−1
(four applications: 60 + 60 + 40 + 20)
P (superphosphate)50 kg·ha−190 kg·ha−1
K (potassium salt)70 kg·ha−1140 kg·ha−1
Weed controlpendimethalin + isoproturon
(2.0 dm3·ha−1, direct after sowing), mechanical 2× (after starting the growth)
pendimethalin + isoproturon
(4.0 dm3·ha−1),
2,4-dichlorophenoxyacetic acid (3.0 dm3·ha−1)
Fungicidespropiconazole + fenpropidin
(1.0 dm3·ha−1)
propiconazole + fenpropidin
(1.0 dm3·ha−1),
propiconazole + cyproconazole
(0.5 dm3·ha−1)
Insecticidesdimethoate (0.5 dm3·ha−1)
Growth regulatortrinexapac-ethyl (0.2 dm3·ha−1)trinexapac-ethyl (0.4 dm3·ha−1)
INTEG—integrated cropping system, CONV—conventional cropping system.
Cv. Hymalaya (breeder Saaten-Union GmbH, Estrées-Saint-Denis, France) is a bread variety (quality class A), with good baking quality, medium–early maturity, good tolerance to diseases of the ear and root base, and cultivation on less fertile (poorer) soils. Cv. Formacja (breeder Poznańska Hodowla Roślin, Poland) is also a bread variety (quality class A), with high grain quality, medium maturity, high yielding potential and frost hardiness, and very good resistance to cereal diseases.
In all study years, wheat was sown during the period between 21 and 30 September, at a sowing density of 180 (cv. Hymalaya) and 360 (cv. Formacja) seeds·m2 with a row spacing of 14–15 cm, to a depth of 3–4 cm.
Both fertilizers and plant protection products in both cropping systems were used in the development stages of wheat according to the BBCH scale [17]. Fertilization with nitrogen in INTEG and CONV cropping systems was carried out first in spring (after starting the growth) and during the growing period; the second rate was supplied at the shooting stage (32–33 BBCH) and the third one at the heading stage (54–56 BBCH). As for the nitrogen fertilization in CONV cropping systems (180 N kg·ha−1), the third rate was applied at the flag leaf stage (39 BBCH) and the fourth one at the heading stage (54–56 BBCH). In the INTEG and CONV systems, phosphorus and potassium fertilization were applied once in the autumn. Herbicides were applied at the tillering stage of wheat (21–22 BBCH) and fungicides at the shooting (32–33 BBCH) and heading (54–56 BBCH) stages. An insecticide was used at the heading stage (54–56 BBCH) and a growth retardant at the shooting stage (32–33 BBCH). Cultivation practices were performed according to the methods of the Research Centre for Cultivar Testing w Słupia Wielka, Poland.

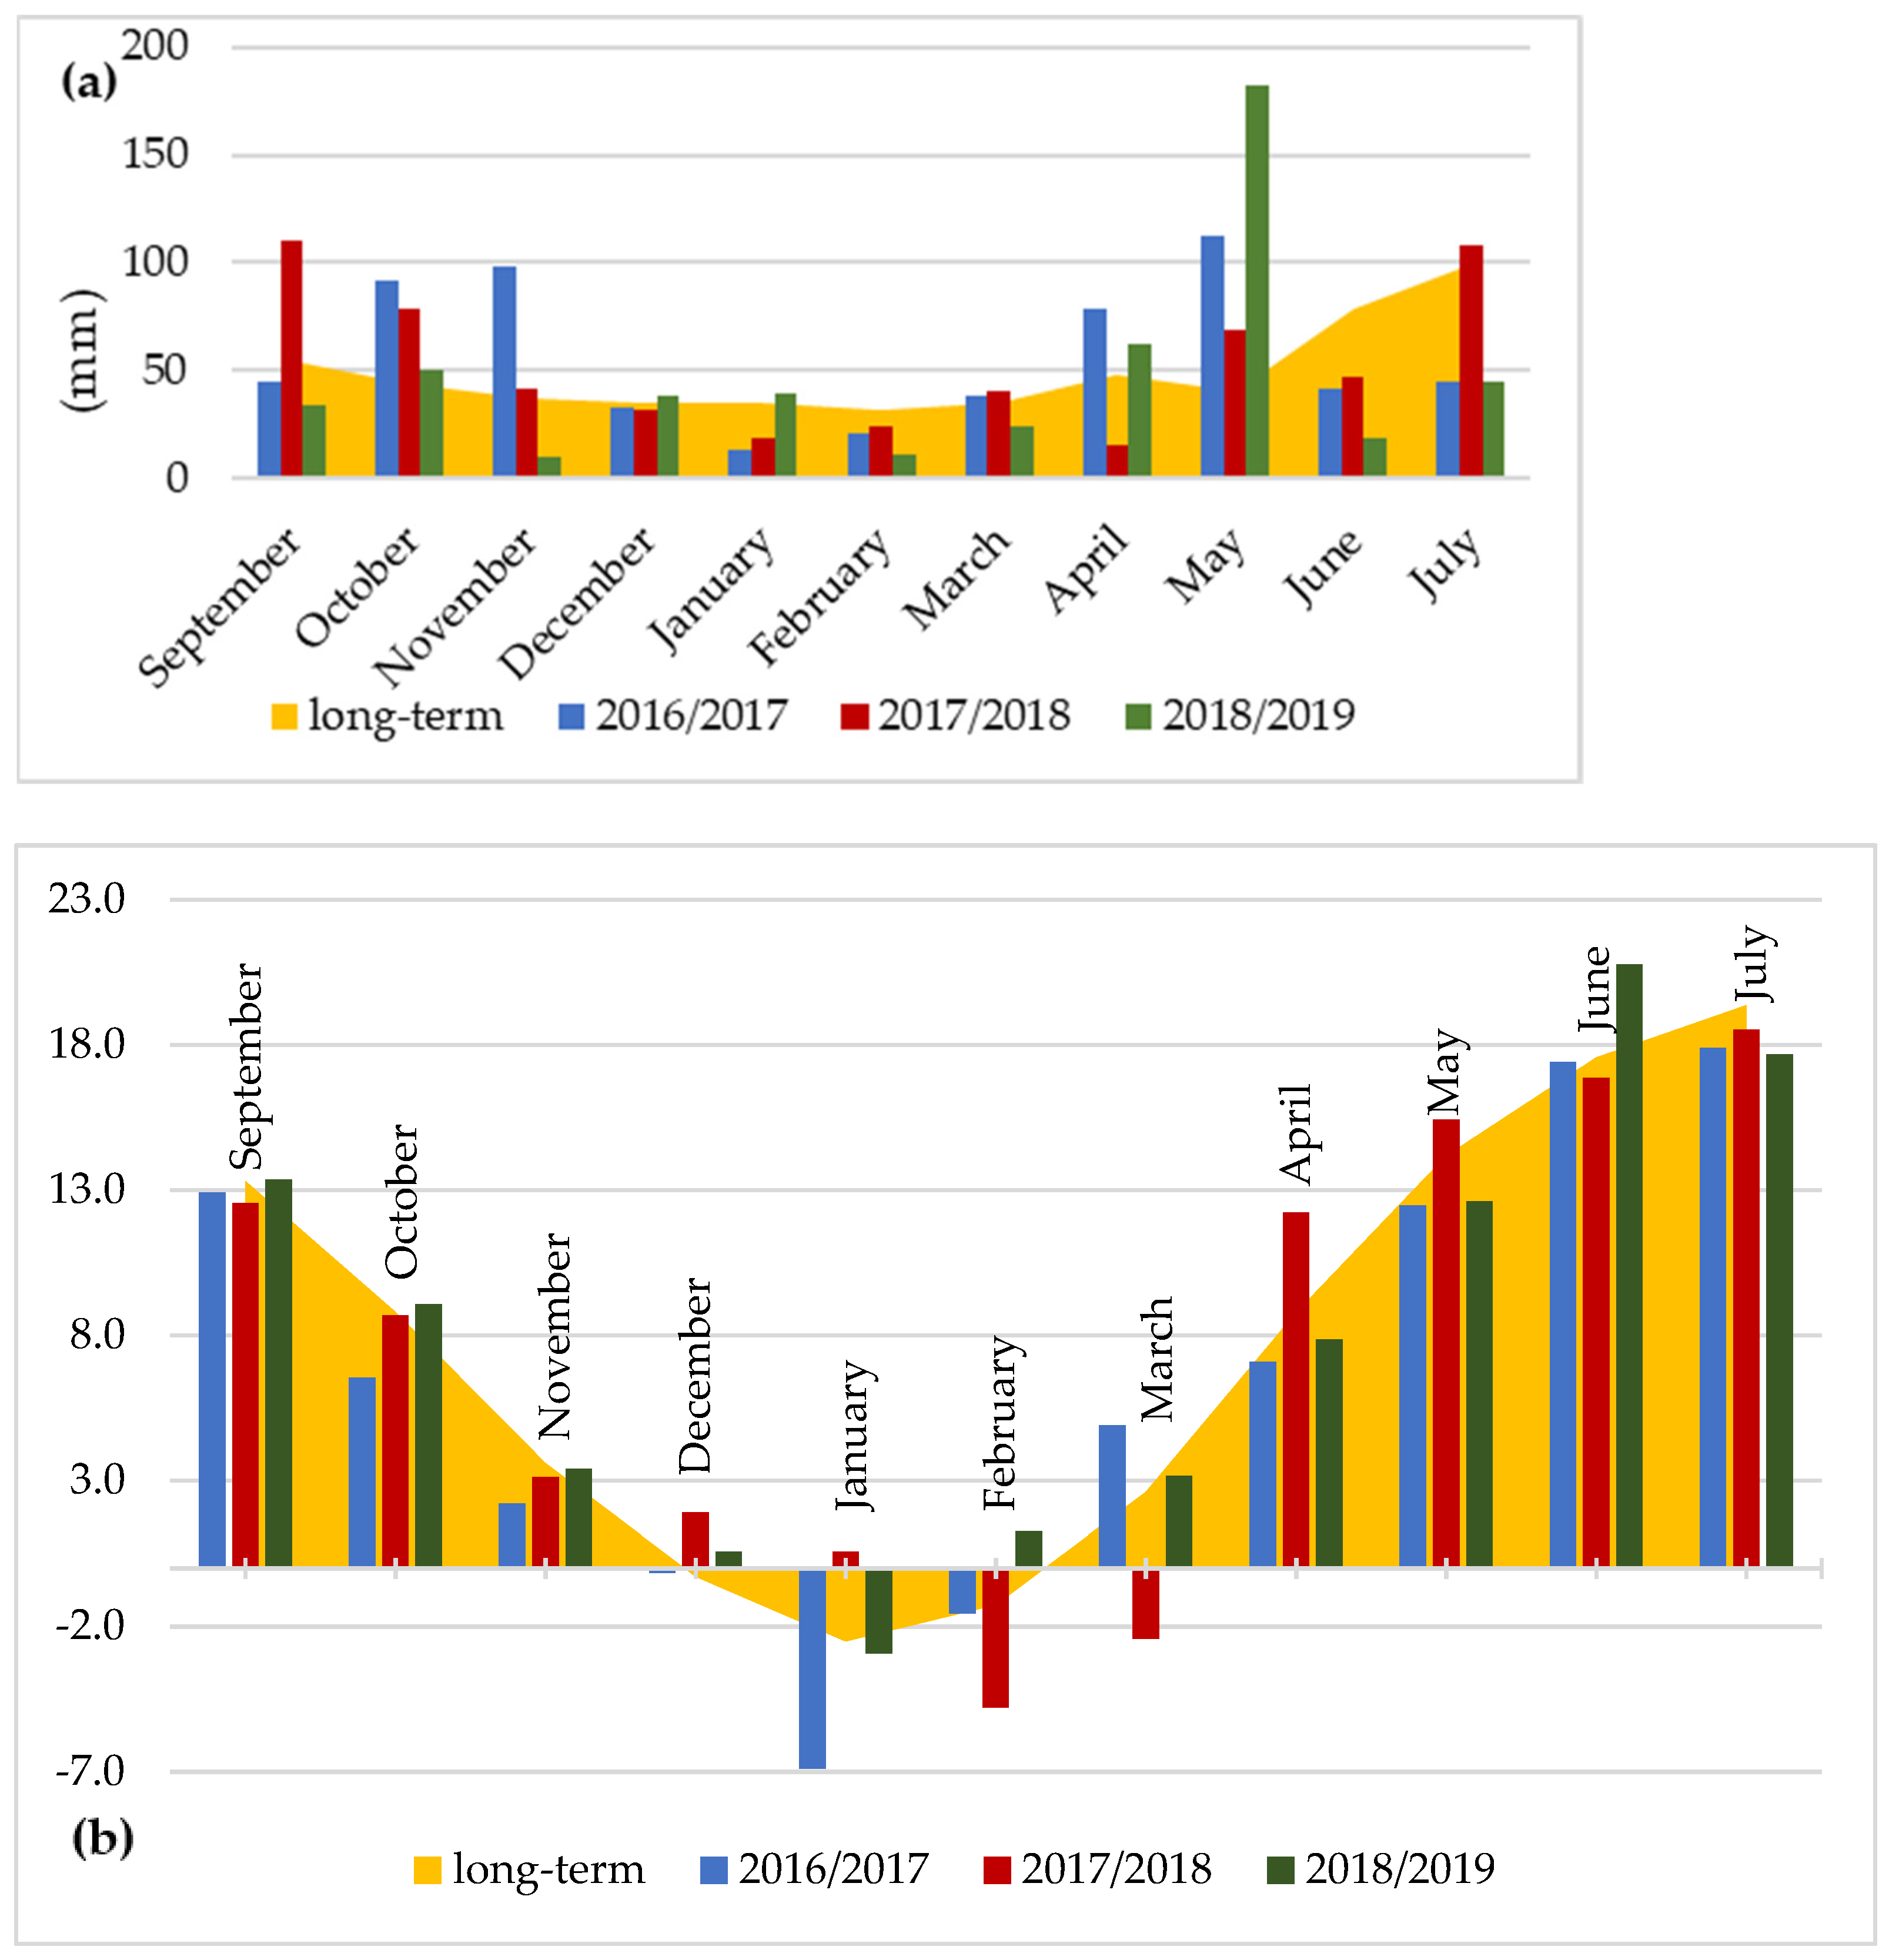
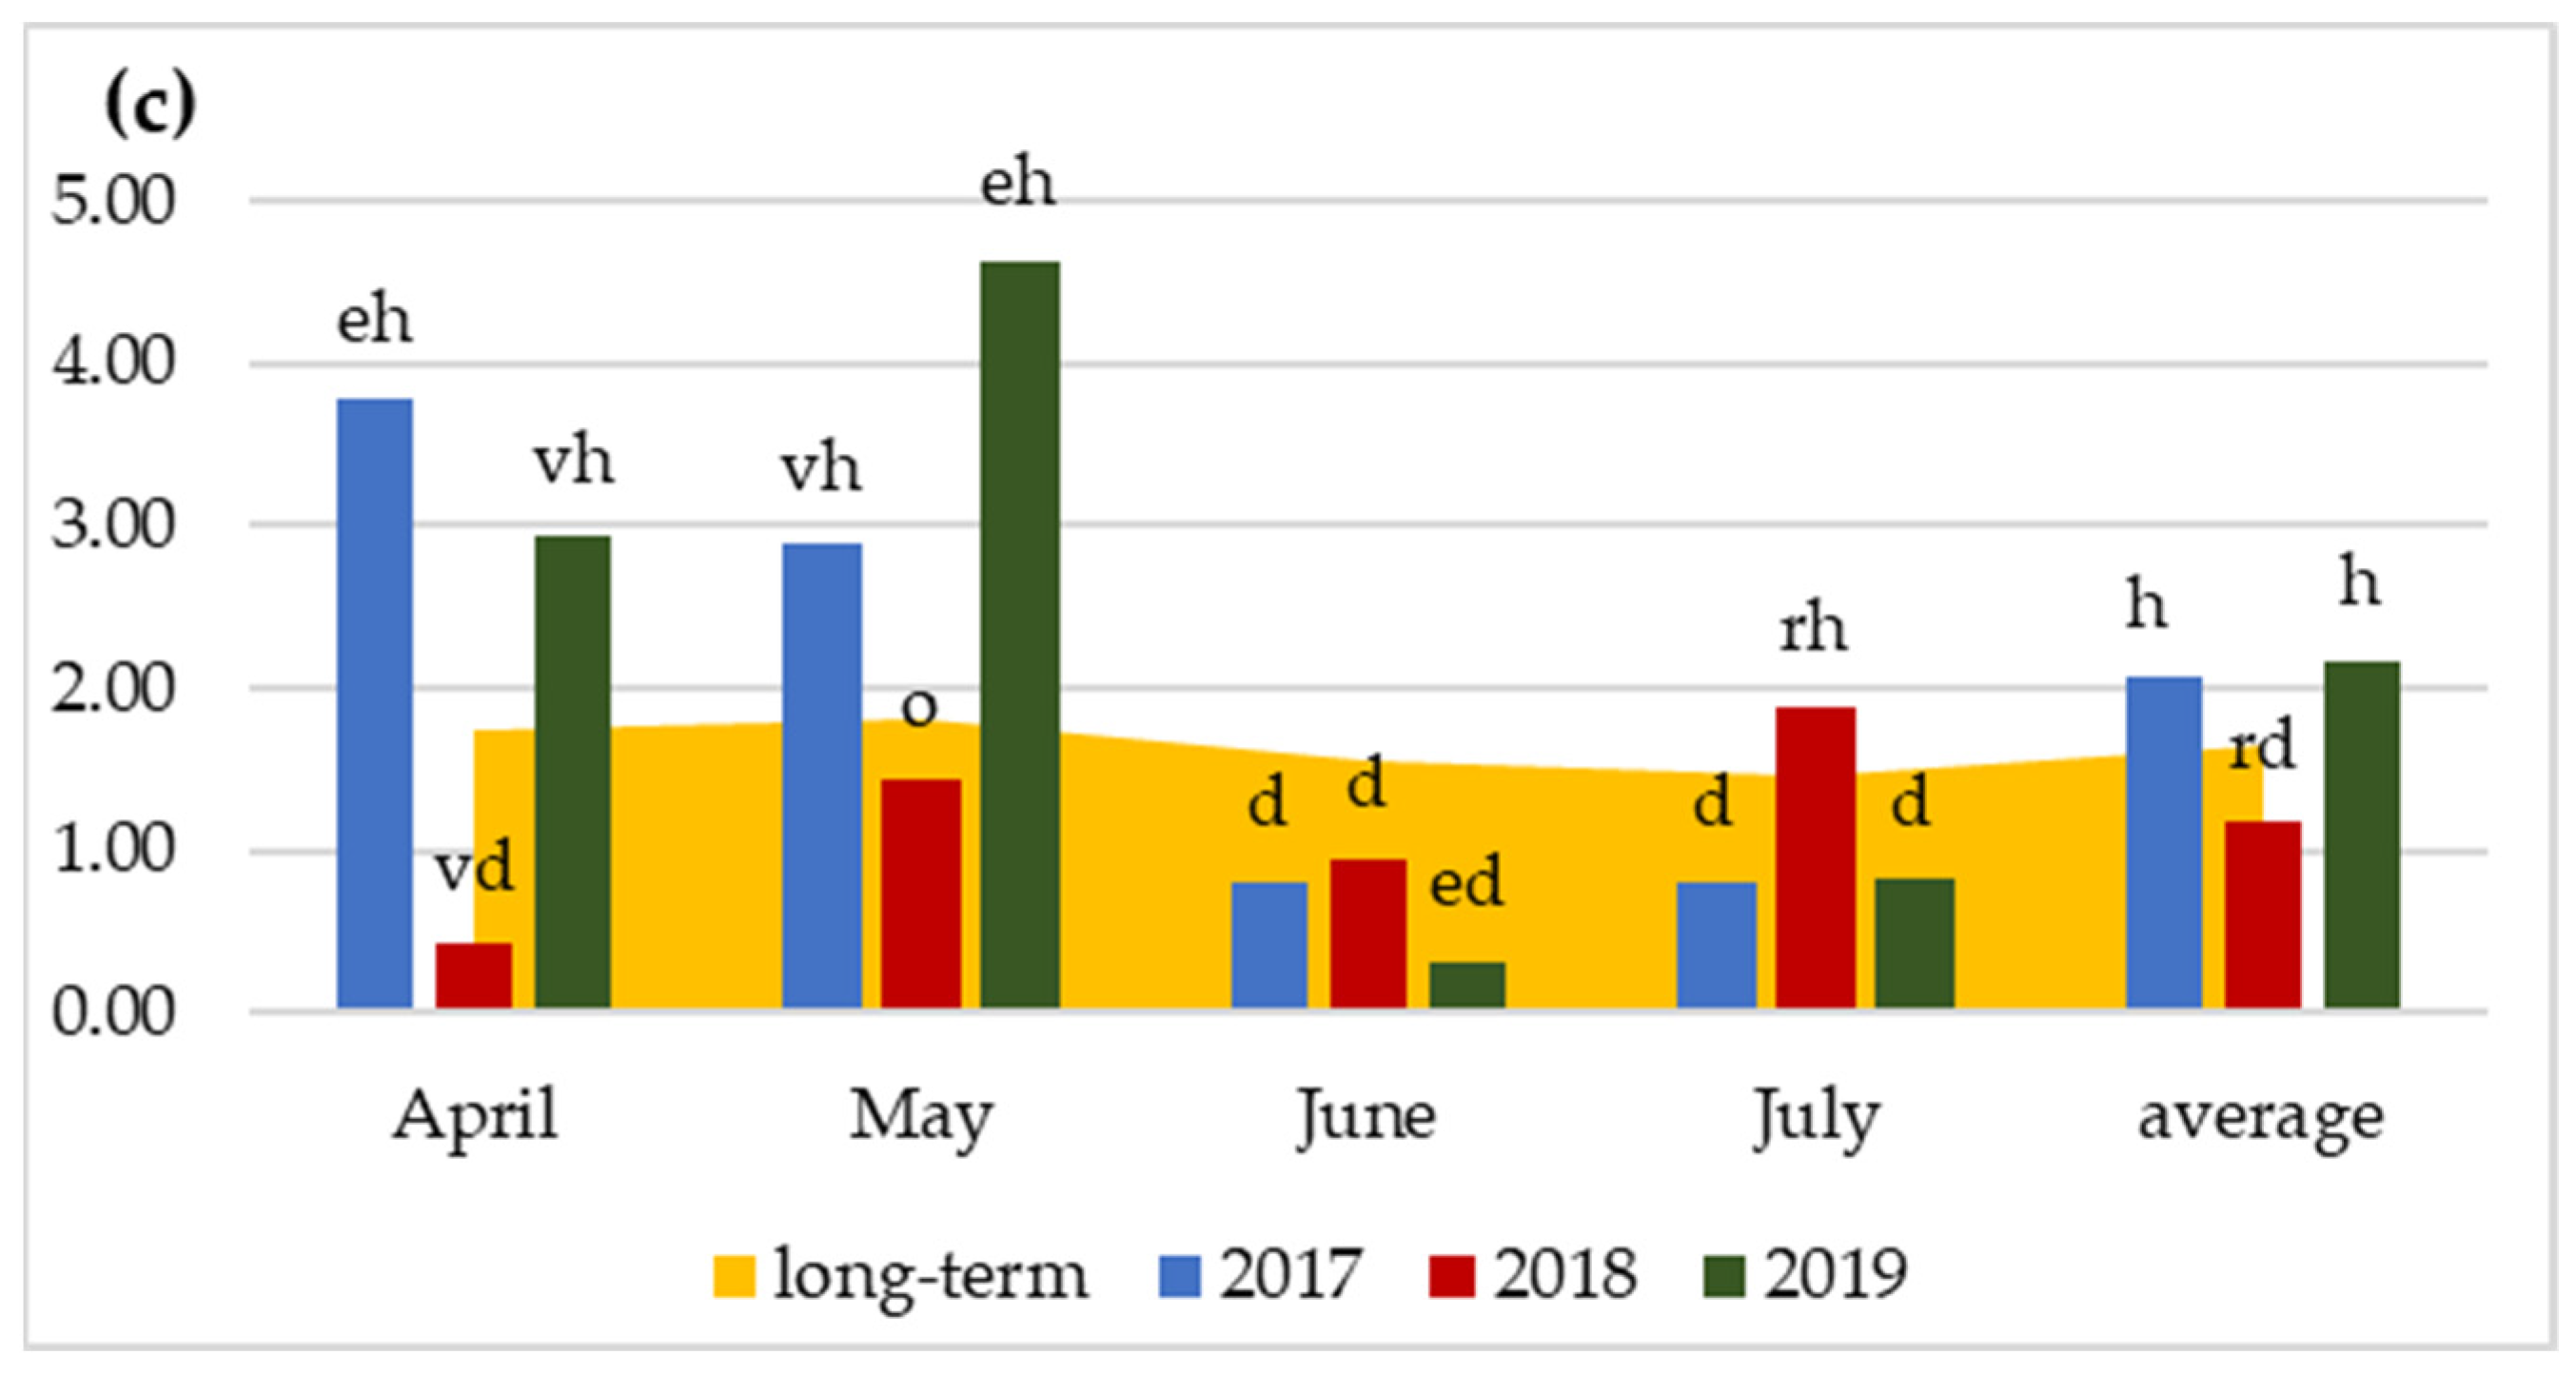
2.2. Weather and Soil Condition

The weather conditions were given in accordance with the records of the meteorological station at the Experimental Station for Variety Assessment in Przecław. For precipitation, greater differentiation was observed as compared to the air temperature (Figure 1a,b). Particularly large amounts of rainfall compared to the multiannual period were recorded in the autumn growing season in September 2017/2018 and in November in the 2016/2017 season. During the spring and summer growth, extremely high rainfalls of 182.0 mm were recorded in May in the 2018/2019 season, which was 449.1% higher than the long-term values. According to the calculated Sielianinov coefficient, the periods of spring and summer growth in 2017 and 2019 were classified as humid, but extremely humid months were followed by dry and extremely dry months (Figure 1c). The most unfavorable humidity conditions occurred in April 2017 and in May and June 2019. The spring and summer growing period in 2018 was classified as quite dry. The most favorable humidity conditions were in May 2018. On the other hand, the average long-term values of the hydrothermal coefficient in June and July were optimal compared to the periods of spring and summer growth, which were classified as dry.
The experiment was carried out on brown alluvial soils with the granulometric composition of silt loam (2016/2017 and 2018/2019) and clay loams (2017/2018). The soil was classified as Fluvic Cambisols (CMfv) according to WRB [19]. The content of Nmin was low, the available phosphorus, potassium, and magnesium were very high, and the micronutrients content was average (Table 2). The soil samples were assessed for contents of organic matter with Tiurin’s method [20], Nmin in 0.01 CaCl2 solution [21], available forms of P, K with Egner–Riehm’s method [22], Mg with Schachtschabel’s method [23], and micronutrients with Rinkis’s method [24].

2.3. Physiological Measurements

Physiological measurements (LAI, chlorophyll content, chlorophyll fluorescence, and gas exchange) were carried out each time in the morning at the milk maturity stage (74 BBCH). Measurements were made on the first fully developed leaf, in the central part of the leaf blade, omitting the main nerve.

2.3.1. Leaf Area Index Measurement

LAI measurement was performed in 4 replicates using an LAI 2000 instrument (LI-COR, Lincoln, NE, USA). One measurement over the canopy and four measurements on the canopy were carried out [25].

2.3.2. Relative Chlorophyll Content

Measurements of the relative chlorophyll content were carried out on 20 randomly selected leaves in each plot using a Chlorophyll Content Meter CCM-200plus (Opti-Sciences, Hudson, NH, USA) [26].

2.3.3. Chlorophyll Fluorescence

Chlorophyll fluorescence was measured using a hand-held chlorophyll fluorescence meter (Pocket PEA, Hansatech Instruments, King’s Lynn, Norfolk, UK). Measurements were carried out on 4 randomly selected leaves on each plot, after adapting them to the dark using a leaf clip. The maximal available intensity was 3500 µmol, which was applied for 1 s with light with a peak wavelength of 627 nm. The studied parameters were: Fv/Fm (maximum efficiency of PSII), Fv/F0 (quantum yield of the primary photochemistry), and PI (performance index) [27,28].

2.3.4. Gas Exchange

Gas exchange measurements were performed using the Portable Photosynthesis Measurement System LCpro-SD (ADC BioScientific Ltd., Hoddesdon, UK). In the determination process, the light intensity was 1500 mol m−2 s−1 and the leaf chamber temperature was 22 °C. Measurements were carried out on 4 randomly selected plants in each plot. The following parameters were analyzed: net photosynthetic rate (PN, mol m−2 s−1), transpiration rate (E, mmol m−2 s−1), stomatal conductance (gs, mmol H2O m−2 s−1), and intracellular CO2 concentration (Ci, mol CO2 m−2 s−1) [29]. Water use efficiency (WUE) was calculated by dividing PN by E.

2.4. Grain Yield

The wheat was harvested with a plot harvester at the full-grain maturity stage (89–92 BBCH). The grain yield from the plots was calculated per 1 ha, taking into account 15% moisture content.

2.5. Quality Parameters

A hammer mill (FN 3100, Perten Instruments,) equipped with a 0.8 mm sieve was used to grind each wheat sample to wholegrain flour for gluten, according to AACC Method No. 26-50.01 [30]. Nitrogen content was measured and calculated into crude protein content using the N × 6.25 conversion ratio based on AACC Method No. 46-11.02 [30]. Wet gluten content was determined following AACC Method No. 38-12.02 [30]. Crude protein content was evaluated by the Kjeldahl method and wet gluten content by means of a Glutomatic 2200 device (Perten Instruments AB, Huddinge, Sweden).

2.5.1. Protein Extraction and Analysis

Proteins were analyzed with the RP-HPLC technique using the solvent system developed by Wieser et al. [31]. Before analyses, grain was milled in a laboratory mill type IKA A10 (Labortechnik, Germany).
  • Albumins + globulins—double extraction of 1 cm3 of the mixture (0.4 mol/L NaCl + 0.067 mol/L HKNaPO4 with a pH of 7.6),
  • Gliadins—triple extraction of 1 cm3 of the mixture (60% ethanol),
  • Glutenins—double extraction of 1 cm3 of the mixture (50% propanol 1 + 2 mol/L urea 0.05 mol/L Tris-HCl (pH 7.5) + 1% DTE under nitrogen).
The first two protein fractions were extracted at room temperature using an Eppendorf thermomixer (10 min extraction). Glutenins were also extracted in a thermomixer, at 60 °C. After each extraction, the samples were centrifuged at 11,000× g.
The collected fractions were lyophilized and then dissolved in 2 cm3 of the appropriate phase (1–3), purified on a Spartan–3 NY filter with a pore size of 0.45 μm, and transferred to glass ampoules. The determination was made in a Hewlett Packard 1050 series apparatus with the following parameters: RP-18 Vydac 218TP54 column, 5 μm, 250 × 4.6 mm, Zorbax 300SB-C18 pre-column, 4.6 × 12.5 mm, column temperature 45 °C, mobile phase flow rate 1 mL per min, and injection size of 20 μL. Separation was carried out using a two-component gradient. Component A proportion was as follows: 0 min 75%, 5 min 65%, 10 min 50%, 17 min 25%, 18 min 15%, 19 min 75%.
The first gradient (A) was water with an addition of 0.1% TFA, while the second gradient (B) was ACN with an addition of 0.1% TFA. Detection was carried out with a detector from the same company using a reading at a wavelength of 210 nm. The identification of protein subunits was based on their retention times and the second derivative of their UV spectra according to Konopka et al. [32]. The results were analyzed with the use of the computer program HPLC 3D ChemStation and were presented in mAU·s−1 (milli-absorbance units).

2.5.2. Analysis of Nutrients

To determine elements, grain samples were mineralized in HNO3:HClO4:H2SO4 in a 20:5:1 ratio, in an open system in a Tecator heating block. The content of Mg, Zn, Mn, Cu, and Fe was determined in the samples by atomic absorption spectroscopy (FAAS), using a Hitachi Z-2000 apparatus (Hitachi, Tokyo, Japan).

2.6. Statistical Analysis

The statistical analysis of the obtained results was performed with the use of the TIBCO Statistica13.3.0 software (TIBCO Software Inc., Palo Alto, CA, USA). The test results were statistically processed using the analysis of variance (ANOVA). Tukey’s post-hock test was used at p ≤ 0.05.

3. Results and Discussion
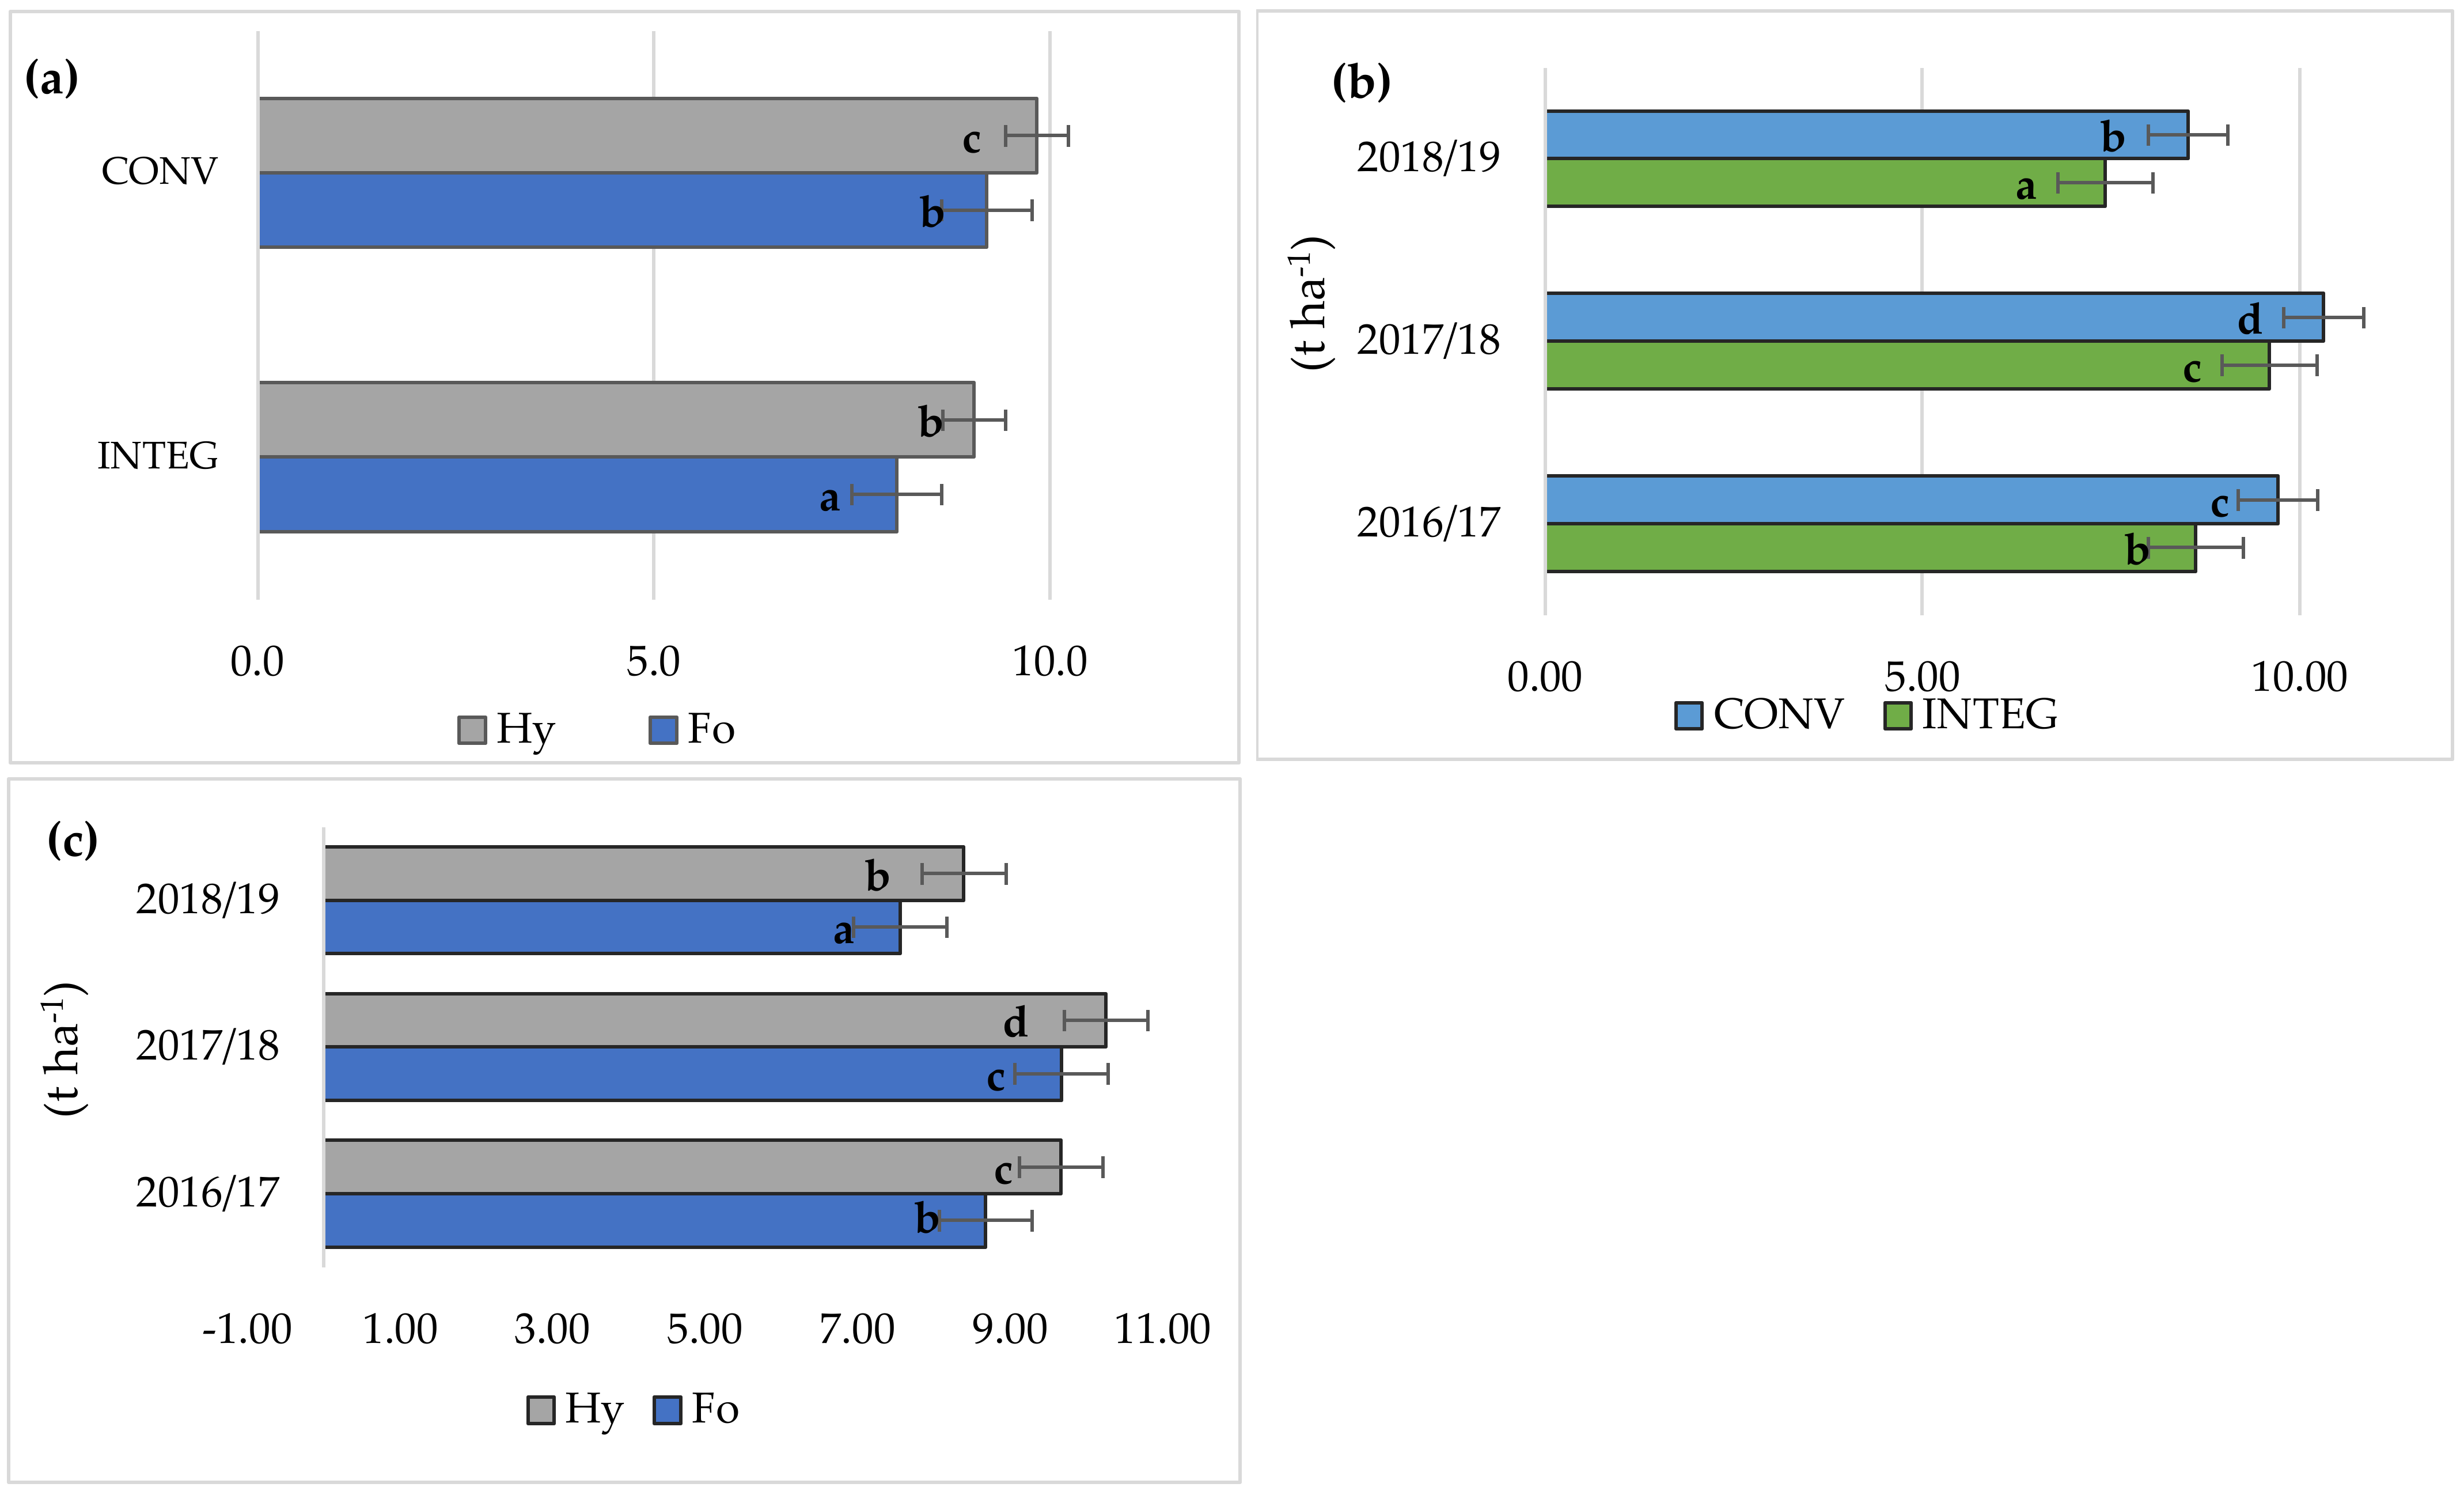
3.1. Grain Yield

The average grain yield obtained in the experiment was 9.04 t ha−1 and was significantly dependent on the cropping system, cultivar, and years of the study (Table 3). The use of the CONV system increased the yield by 11.3% compared to the INTEG system, which proves that wheat is a species strongly responding with yield increases to the increase in cultivation intensity [2]. A similar relationship in a study with spring wheat was obtained by Sułek and Cacak-Pietrzak [33]. They showed an increase in grain yield by 18.0% in the CONV system compared to INTEG. The study conducted by Kołodziejczyk and Szmigiel [34] showed an increase in yield of as much as 26.5%, which was caused by the application of a higher rate of nitrogen and the use of better protection with fungicides. The hybrid cv. Hymalaya (9.44 t ha−1) was characterized by a 9.3% higher grain yield than the population cv. Formacja. According to Plessis et al. [35] and Whitford et al. [36], hybrid cultivars of wheat are distinguished by grain yield higher by 3.5 to 15.0% than the population cultivars. Cv. Hymalaya in the INTEG system gave yields similar to cv. Formacja in the CONV system (Figure 2a), which proves the greater cultivation efficiency of the hybrid cultivar in less favorable conditions and non-necessity of using higher rates of nitrogen that have a negative impact on the environment [13]. In addition, cv. Hymalaya responded better to the higher fertilization applied in the CONV system, which resulted in obtaining a higher grain yield of 9.83 t ha−1. In the 2017/2018 growing season, the highest grain yield was obtained (9.96 t ha−1) out of all years of the study (Figure 2b). This was due to more optimal hydrothermal conditions compared to the other years of the study, in which there were extreme values of precipitation and temperature. The lowest grain yield was obtained in the INTEG system in the 2018/2019 season, with the least favorable hydrothermal conditions during the growing season. In the conducted experiment, the CONV system significantly affected the amount of the obtained yield in the years of the study. The highest grain yield, 10.25 t ha−1, was found in cv. Hymalaya in the 2017/2018 season (Figure 2c). The importance of habitat conditions, in particular the weather conditions, as factors determining the size and quality of winter wheat yield was confirmed in a study conducted by Iwańska et al. [37].

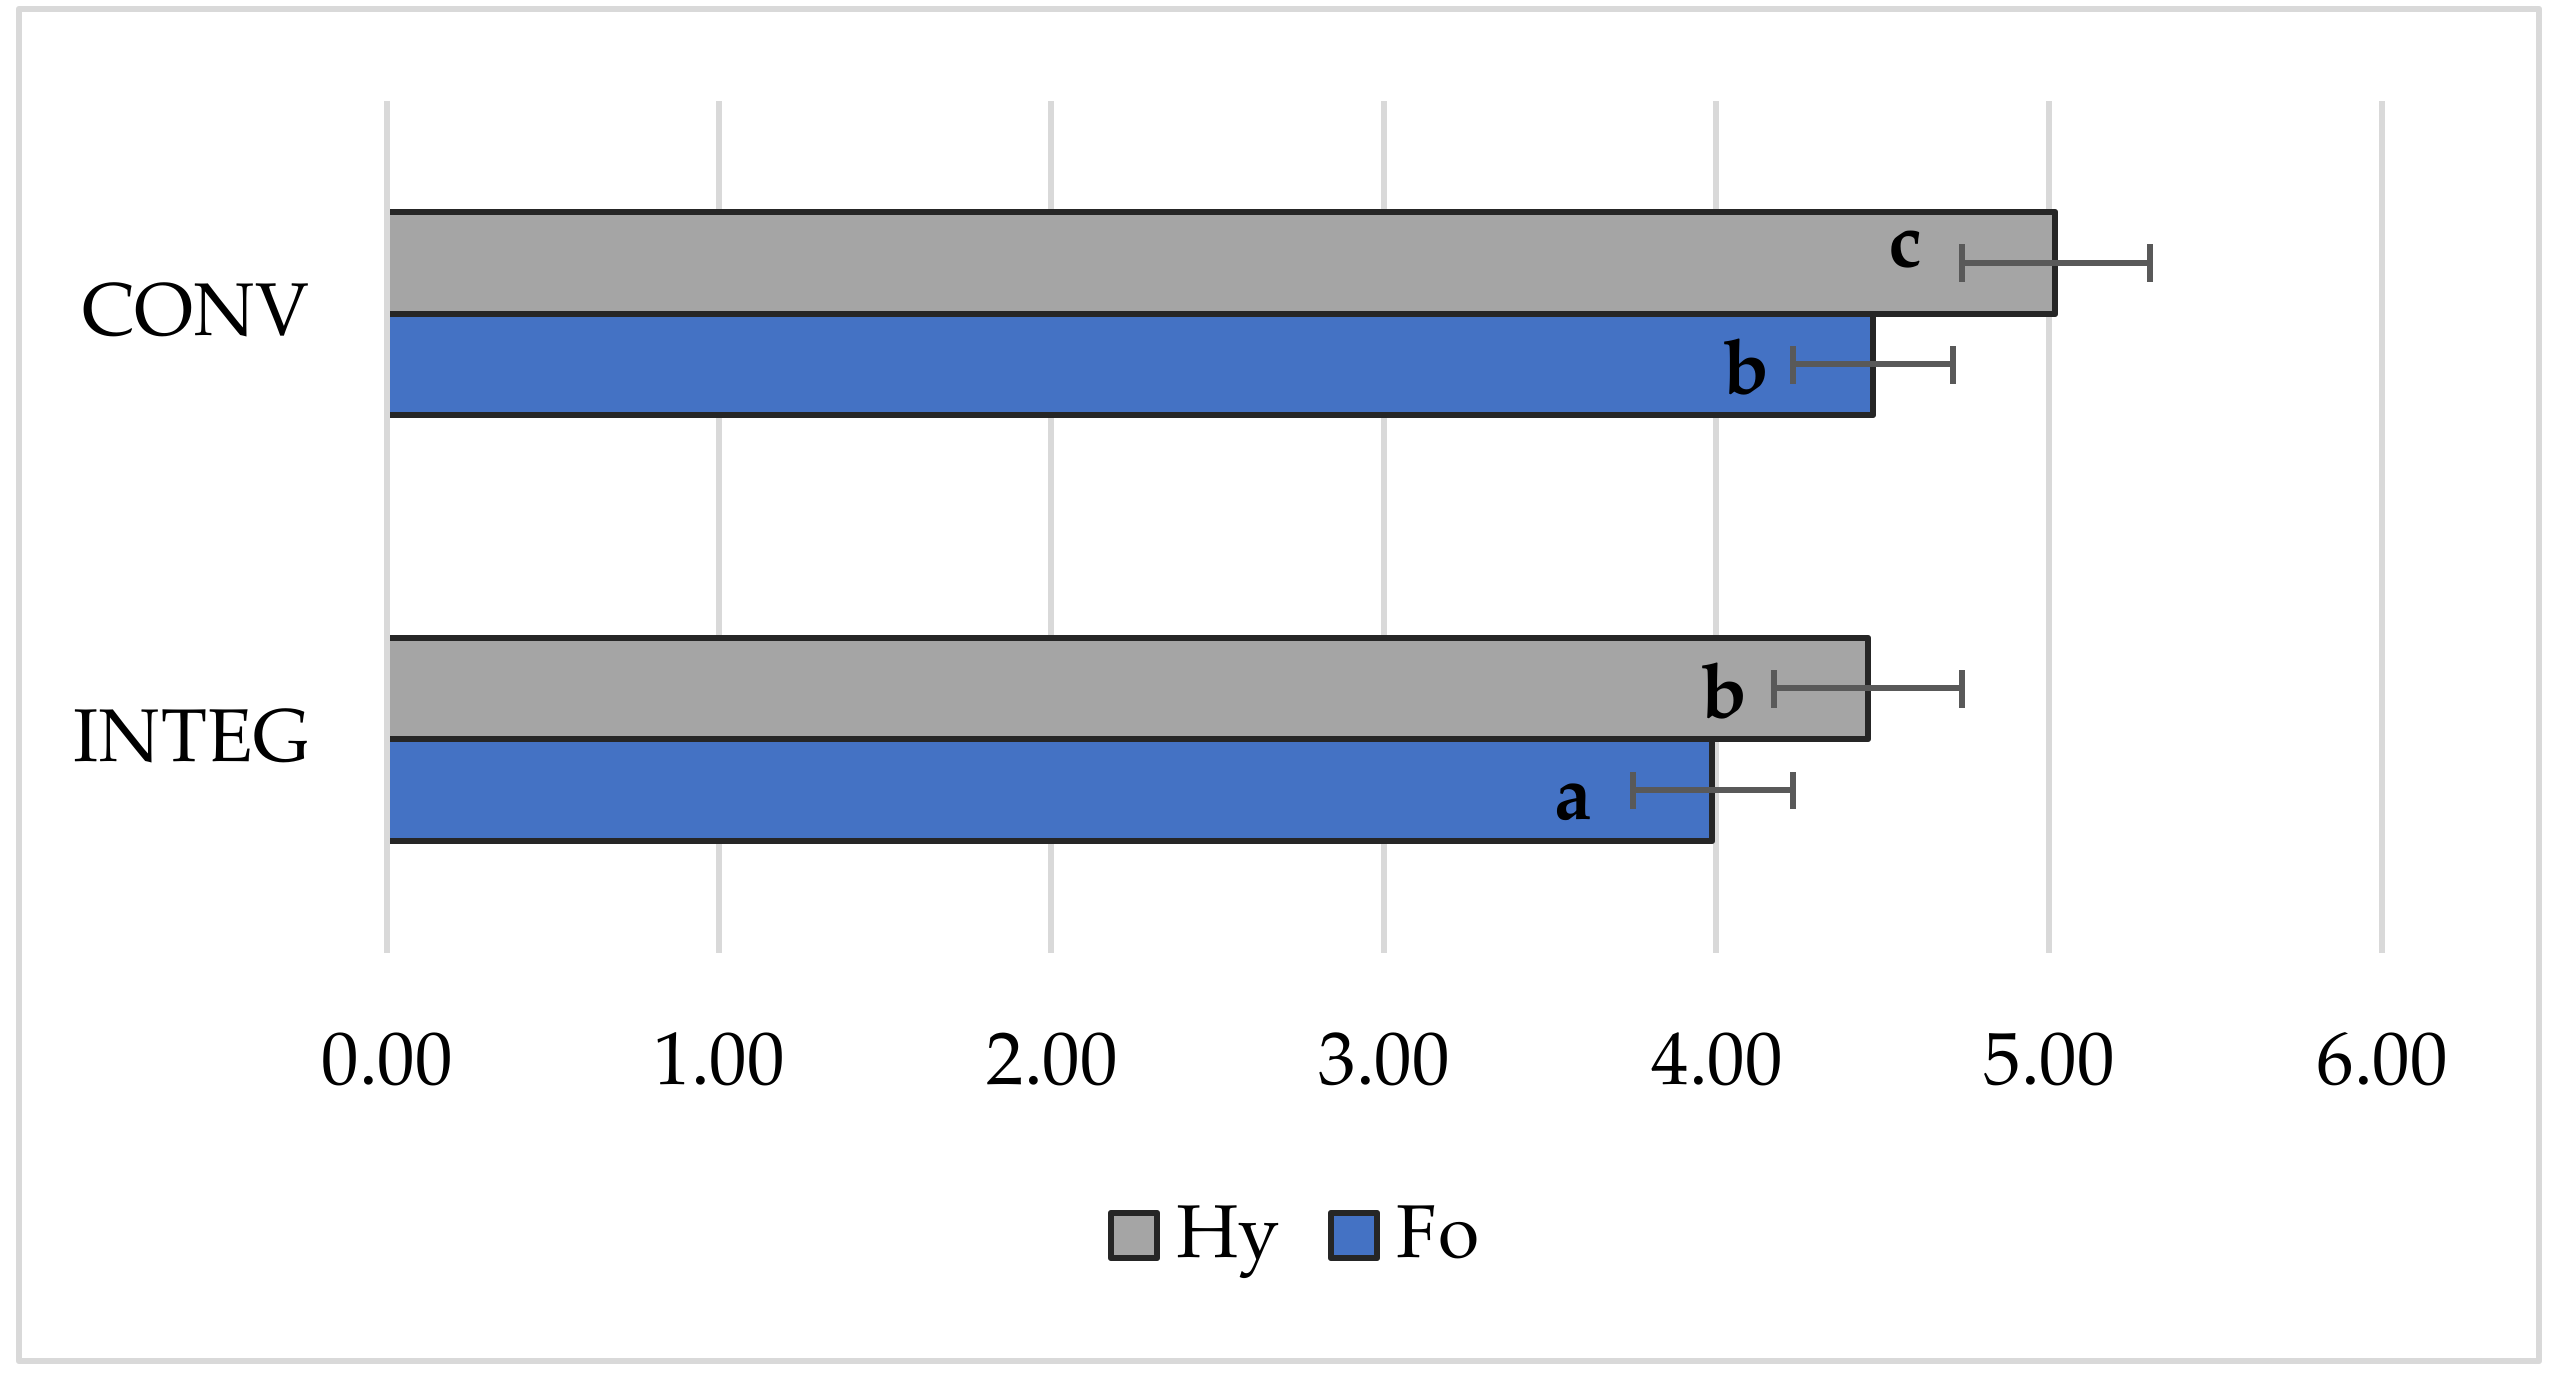
3.2. Leaf Area Index (LAI)

The leaf area index (LAI) is an important parameter characterizing the physiological processes of plants, including photosynthesis, transpiration, evapotranspiration, and their condition. Plants exposed to abiotic stress factors that reduce productivity or damage them show a decrease in the leaf area index value [38].
In this study, the mean LAI value was 4.48 (Table 3). According to Jamieson et al. [39], the optimal LAI for cereal plants at the heading stage should be around 4.0. The cultivar genotype and weather conditions during individual years of the study modified the value of the LAI. Plants of cv. Hymalaya were characterized by a 12.1% higher LAI value in relation to cv. Formacja. In studies by Bavec et al. [40] and Olsen and Weiner [41], it was shown that nitrogen fertilization had a positive effect on the growth of wheat leaf surface. A similar relationship was obtained in this research in the CONV system, where a higher LAI value was obtained compared to the INTEG system. A significant interaction was found between the experimental factors. Plants of cv. Hymalaya grown in the INTEG system achieved a similar value of the LAI index to plants of cvs. Formacja and Hymalaya in the CONV system (Figure 3).

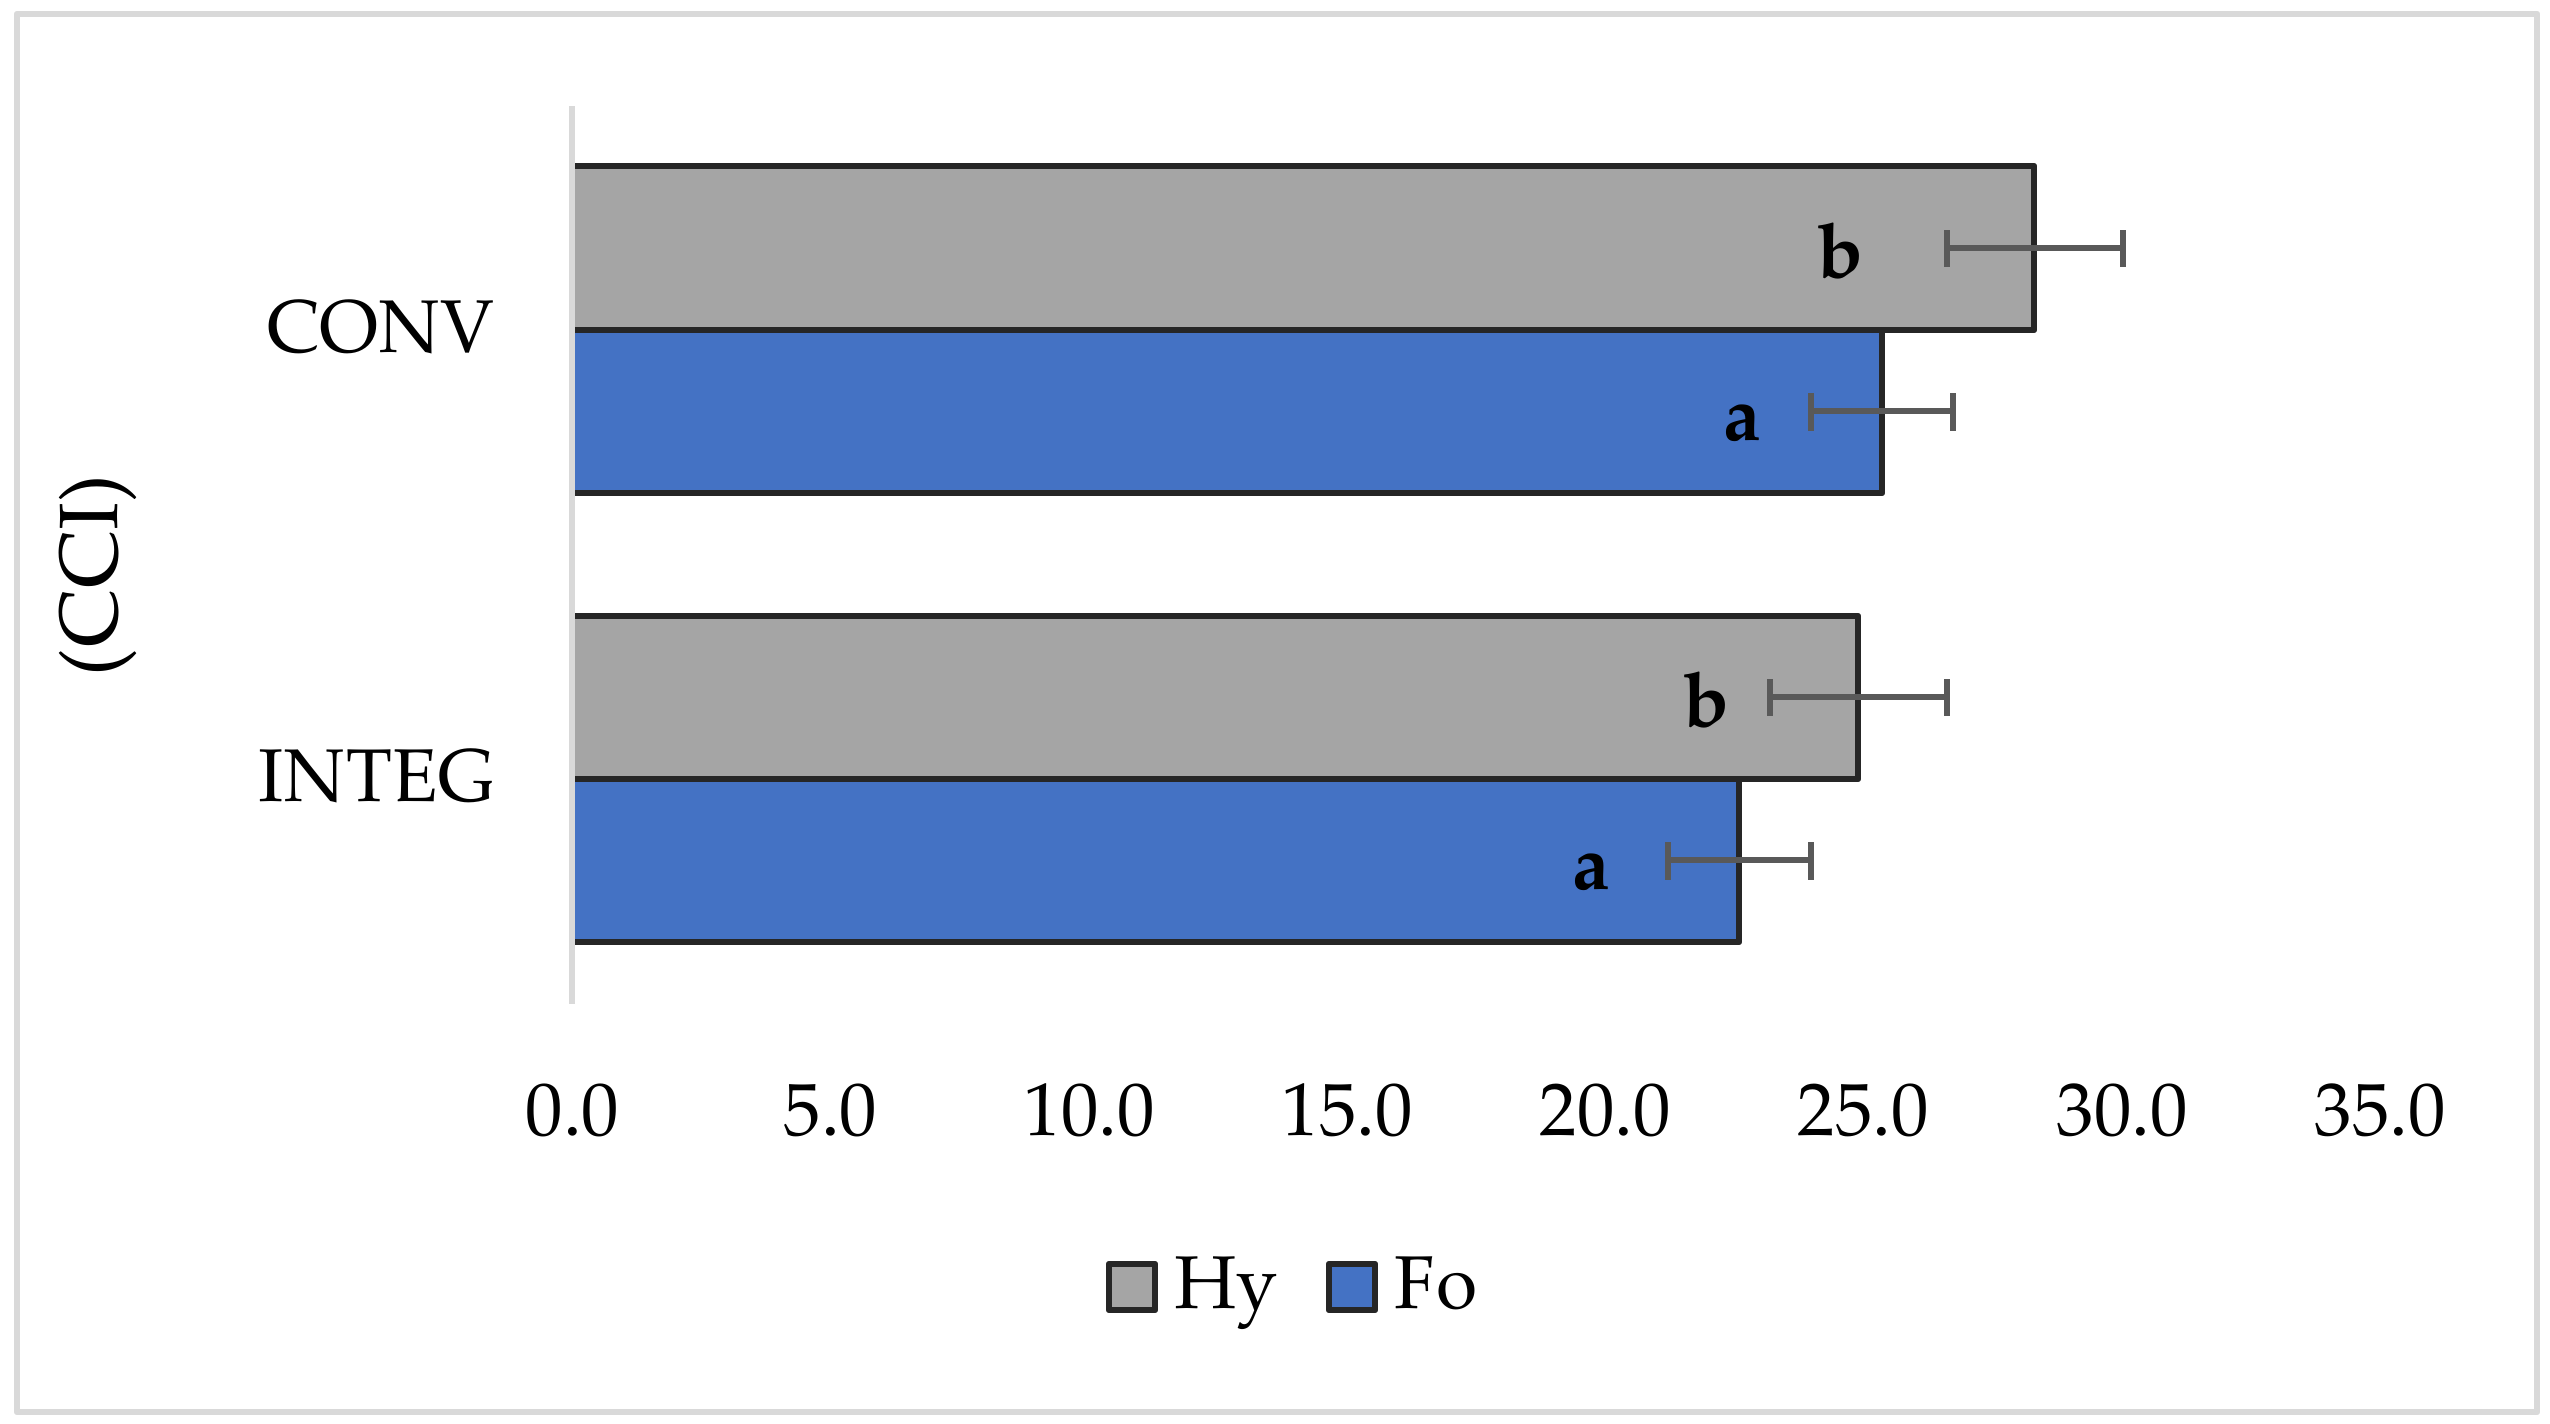
3.3. Relative Chlorophyll Content

The growth and development of plants depend on the photosynthesis process, which is influenced by environmental factors and the nutritional status of plants. The chlorophyll content in the leaf informs the estimated nitrogen uptake from the soil under various environmental conditions. The use of this method during the growing season of wheat allows for the determination of the fertilization needs and enables forecasting the yield and its quality [42]. The content of chlorophyll in the wheat flag leaf was dependent on the cropping system and was 12.6% higher in the CONV system compared to the INTEG (Table 3, Figure 4). The key factor significantly affecting the increase in chlorophyll content is the higher level of nitrogen fertilization in the CONV system. In a pot experiment with winter wheat, in which they applied different rates of nitrogen fertilization, Živčák et al. [15] obtained a higher value of the leaf greenness index in the variant with the highest nitrogen rate. In that experiment, there were differences in chlorophyll content between the cultivars. The hybrid cv. Hymalaya (26.6 CCI) was characterized by a higher chlorophyll content compared to the population cv. Formacja (24.0 CCI). Kara and Mujdeci [43] also showed differences in chlorophyll content between the studied wheat cultivars, which indicates that it is a genetically determined trait. The weather factor, including the amount of precipitation, may also modify changes in the accumulation of chlorophyll content [43]. In the 2018/2019 growing season, this index was lower than in the 2016/2017 and 2017/2018 seasons, which were characterized by greater total precipitation.

3.4. Chlorophyll Fluorescence
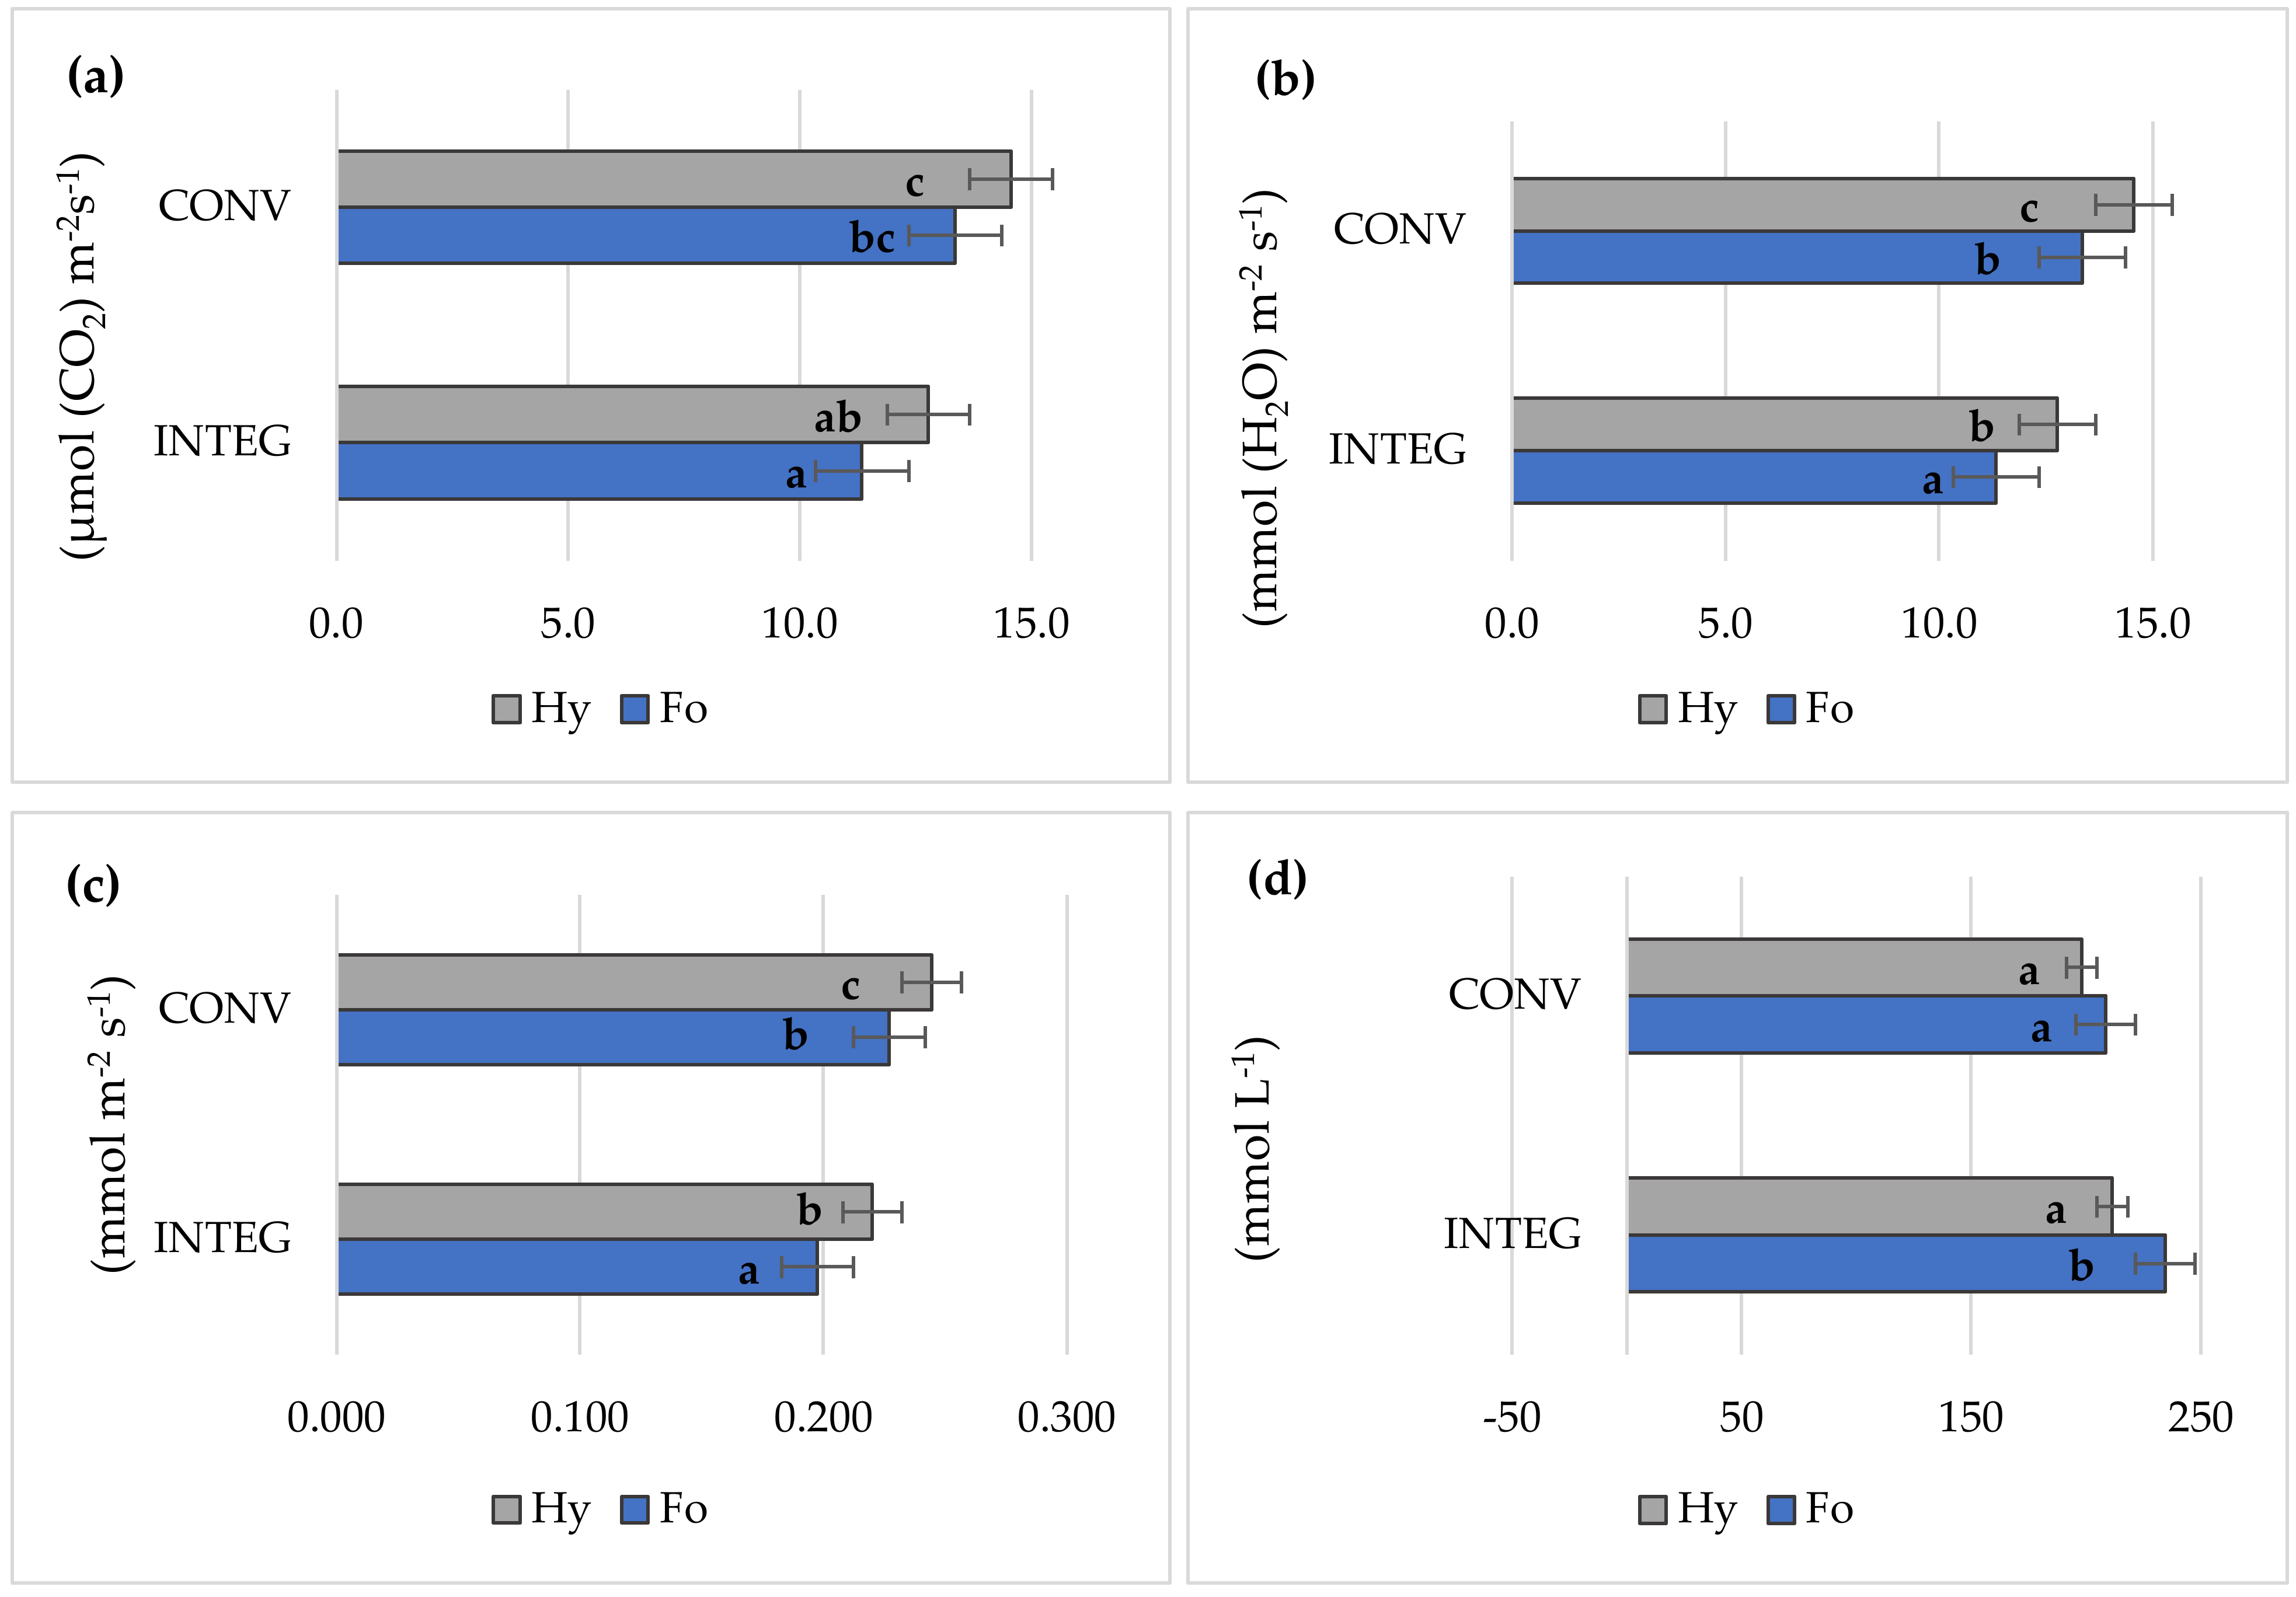
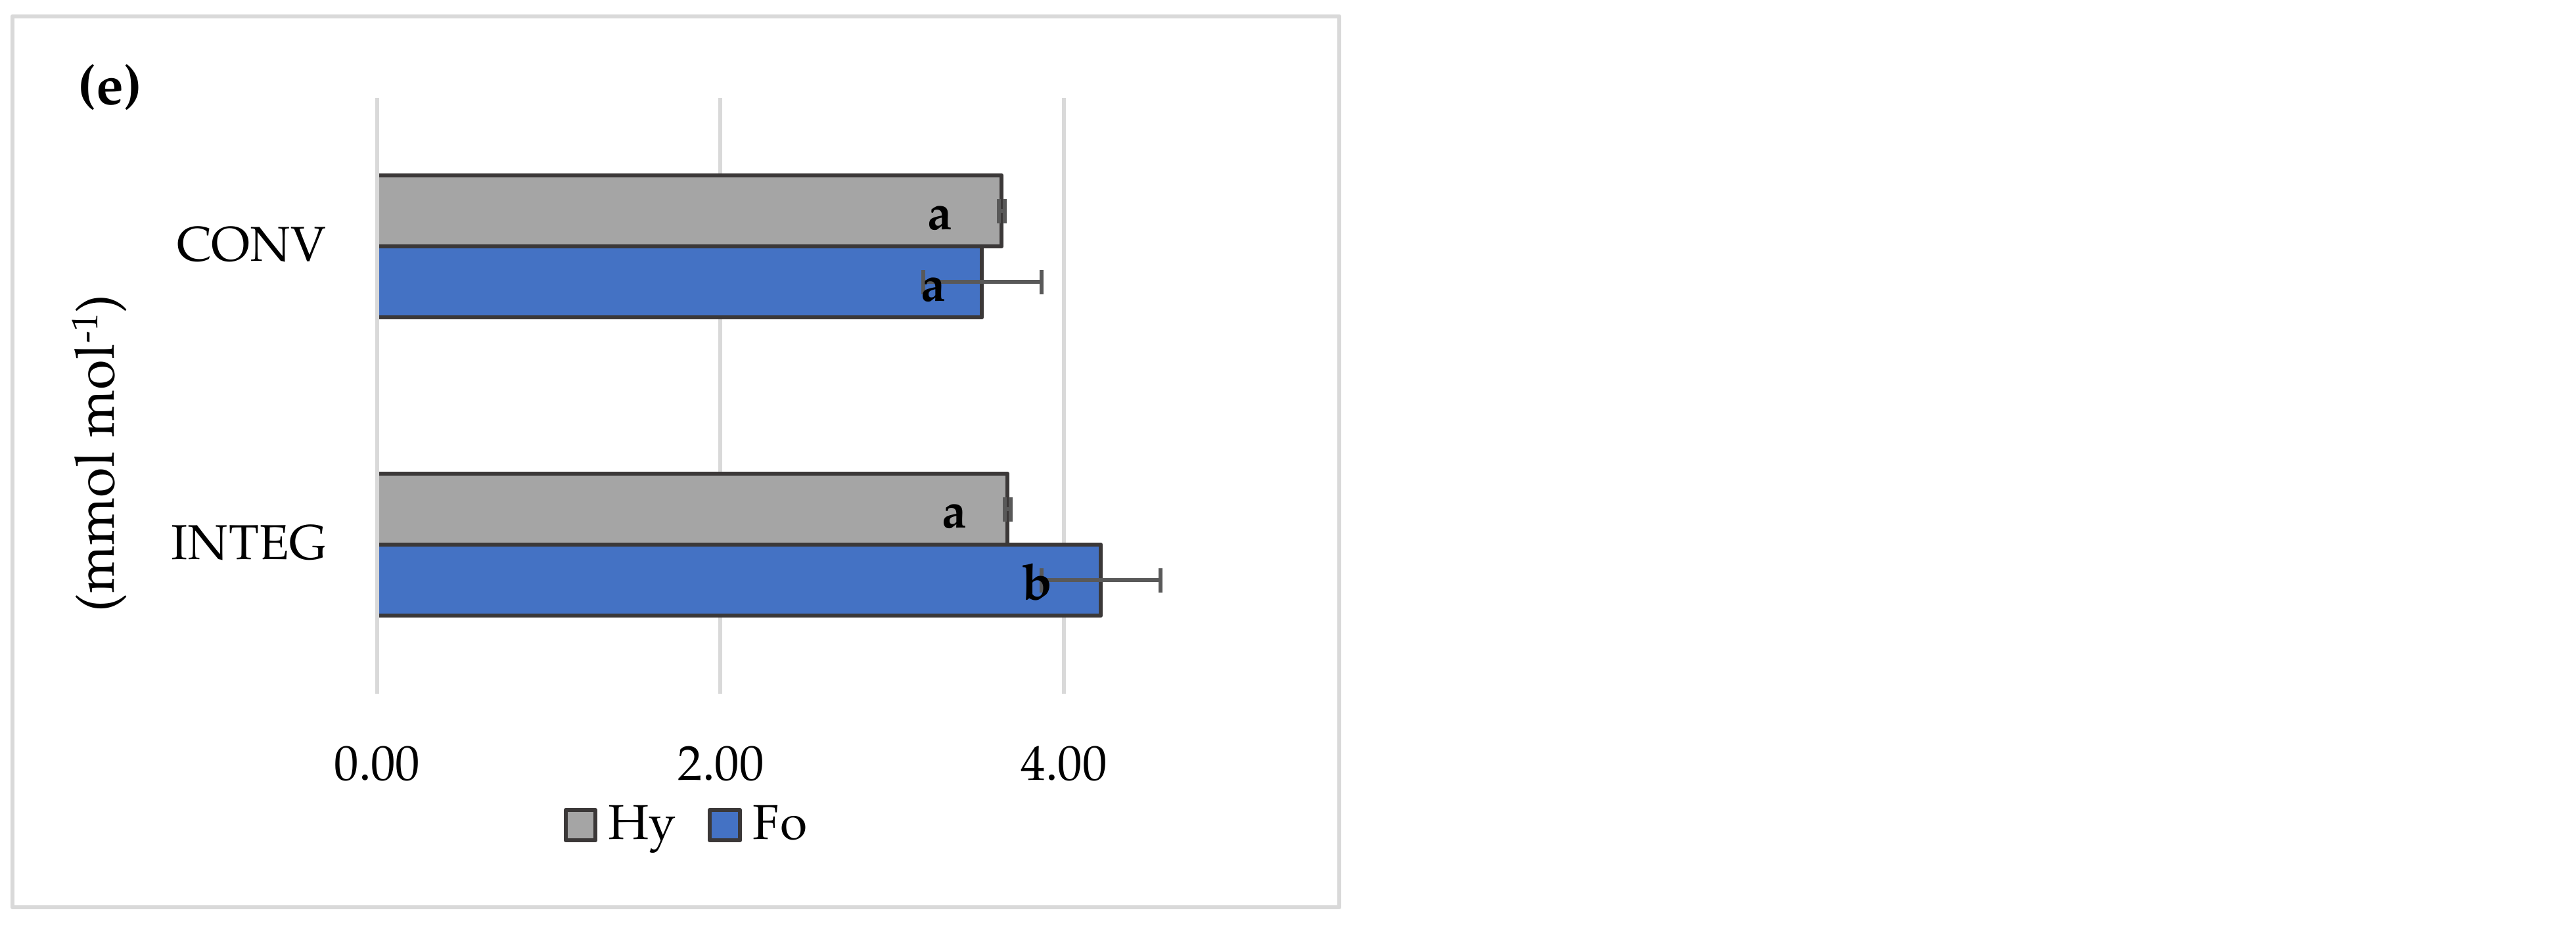
The method based on the measurement of the chlorophyll fluorescence signal is a valuable tool for assessing the physiological condition of plants grown in changing environmental conditions [44]. Živčák et al. [15], in a pot study with winter wheat, showed that the PI index is more sensitive to changes in environmental factors than Fv/Fm, which proves that it is more useful for comparing the photosynthesis efficiency of plants grown at different levels of nitrogen fertilization. This was confirmed in the present authors’ study, which showed a significant effect of the cropping system used on the value of the PI index but insignificant effect on the Fv/F0 value. This may be evidence of the fact that nitrogen is the most important nutrient for keeping photosynthetic efficiency at a high-level. Chlorophyll fluorescence is, therefore, a valuable method for assessing the state of nitrogen nutrition in plants [15,45]. Increasing the rate of nitrogen may also contribute to an increase in the induction of Rubisco enzyme synthesis, which significantly improves the photosynthesis process [46]. According to Wang et al. [47], the supply of nitrogen in fertilizers, especially in the CONV system, can increase the photosynthesis efficiency by maintaining the Fv/Fm and Fv/F0 parameters at appropriately high levels. Lu et al. [48] proved in a pot study on maize and wheat plants that, in parallel with a decrease in nitrogen fertilization, the assimilation capacity of CO2 decreases, which is related to a decrease in the activity of the Rubisco enzyme. Lawlor and Cornic [49] and Wang et al. [47] reported that a lower level of nitrogen fertilization may also lead to a decrease in the values of the Fv/Fm and Fv/F0 parameters, which may be related to the photoinhibition process manifested by the destruction of PSII and a slowdown in the transport of electrons leading to a reduction in the efficiency of the photosynthesis process. During the experiment, the variation factor modified the values of the Fv/F0 and PI parameters (Table 3, Figure 5a–c). The hybrid cv. Hymalaya was characterized by the highest value of these indices. The difference in photosynthetic activity between the cultivars, observed in the present authors’ experiment, is dictated by their genotype. Wang et al. [47] came to similar conclusions based on a pot experiment carried out on different cultivars of winter wheat, which were cultivated under the same conditions but were characterized by different values of the Fv/Fm and Fv/F0 parameters. Yang et al. [50], in field studies carried out on two-parent cultivars of winter wheat and the hybrid line obtained from them, showed an increase in the Fv/Fm value in the flag leaf and an increase in the activity of the Rubisco enzyme. The obtained results prove that the higher activity of photosynthesis of the hybrid line results in a greater accumulation of dry matter and may be the basis for obtaining better efficiency in relation to the parent cultivars. In the present authors’ experiment, the hybrid cv. Hymalaya was also characterized by the highest value of the Fv/Fm and PI indices, which was manifested in obtaining a higher grain yield. A statistically significant interaction between the experimental factors was found for the PI index. Cv. Hymalaya grown in the INTEG system reached a PI value similar to cvs. Formacja and Hymalaya in the CONV system. Furthermore, Zheng et al. [16] proved in their study that higher nitrogen rates improved the values of photosynthesis parameters and affected the improvement of the anatomical structure of wheat leaves and stem due to the increased numbers and transverse area of vascular bundles.

3.5. Gas Exchange

The use of the CONV system also contributed to an increase in the value of gas exchange parameters PN, E, and gs and a decrease in the value of the Ci parameter (Table 3, Figure 6a–c). A similar relationship was demonstrated by Waraich et al. [51] in a field study with wheat, where four levels of nitrogen fertilization were applied (0, 50, 100, and 150 N kg·ha−1). These authors proved that higher nitrogen rates improve the PN, E, and gs parameters. Furthermore, Wang et al. [47] showed an increase in the value of the PN parameter under the condition of a higher level of nitrogen fertilization, which helps to improve the efficiency of the photosynthesis process. In the present study, under the influence of the CONV system, a decrease in the value of the Ci parameter by 9.9% was obtained (Figure 6d). Ciompi et al. [52], based on a study carried out on sunflower plants, showed that the decrease in photosynthesis activity is associated with an increase in the Ci parameter in the intercellular space, resulting from the use of a lower rate of nitrogen fertilizer. A similar relationship was found by Shangguan et al. [53] in a study conducted on winter wheat plants. They showed a higher Ci value in plants grown under conditions of nitrogen deficiency, which proves a reduction in the efficiency of CO2 assimilation occurring in the dark phase of photosynthesis. Based on the quotient of the net photosynthesis intensity to transpiration (PN/E), the photosynthetic water use efficiency (WUE) index was determined. This index is important, as it provides information about the adaptation of plants to the prevailing conditions. The stomata in leaves control CO2 incorporation in photosynthesis and water loss through transpiration. The degree of their opening is regulated by the WUE; therefore, the stomata conductivity is necessary to stimulate the efficiency of crops in agricultural ecosystems [54]. The experiment showed an increase in the WUE value by 10.1% in the case of wheat cultivars grown in the INTEG system (Figure 6e). This may prove more economical water management in plants with less fertilization applied, including nitrogen fertilization. A similar relationship was found in winter wheat by Wang et al. [47], who showed in their experiment that the WUE value increases with lower nitrogen fertilization. An interaction between the experimental factors was found for the E index, the value of which in plants of cv. Hymalaya grown in the INTEG system was at the level of plants in the CONV system. A significant interaction was also demonstrated for the WUE index. Lower values were obtained for plants of cvs. Formacja and Himalaya grown in the CONV system and plants of cv. Hymalaya grown in the INTEG system.

3.6. Quality Parameters

Significantly higher protein and gluten content in the grain by 3.2 and 5.6%, respectively, were obtained in the CONV system compared to INTEG (Table 4). Higher fertilization intensity, especially with nitrogen, in the CONV system compared to INTEG may result in a more favorable use of nitrogen, which results in a higher protein and gluten content in wheat grain [55]. Wojtkowiak and Stępień [56] report that NPK fertilization treatments had an ambiguous effect on the protein content in the spelt grain, and the addition of fertilization with microelements Cu, Zn, and Mn reduced the content of this parameter. According to Woźniak and Rachoń [57], the content of protein and gluten in wheat grain is determined by the combination of genetic traits of wheat cultivars and the environmental conditions, as well as their interaction. The protein and gluten content was significantly higher in cv. Hymalaya than in cv. Formacja, by 6.4% and 9.7%, respectively. The CS × C interaction showed a significantly higher protein content for cv. Hymalaya than cv. Formacja, and a higher protein content in the CONV system than INTEG. Higher gluten content has also been shown for cvs. Hymalaya and Formacja in the CONV system than INTEG. Furthermore, many years of research by Mader et al. [58] confirmed a significantly lower protein content in wheat grain in the ORG system than in the CONV system, on average in the range from 143.7 to 152.2 g·kg−1. The study by García-Molina and Barro [59] shows that excess rainfall, especially at the end of the growing season of wheat, may affect the faster synthesis of gliadins in protein, thus weakening the mechanical strength of gluten. In the present authors’ study, the 2018/2019 growing season with the dry wheat maturing period in June and July was favorable for a significantly higher value of protein and gluten [57].

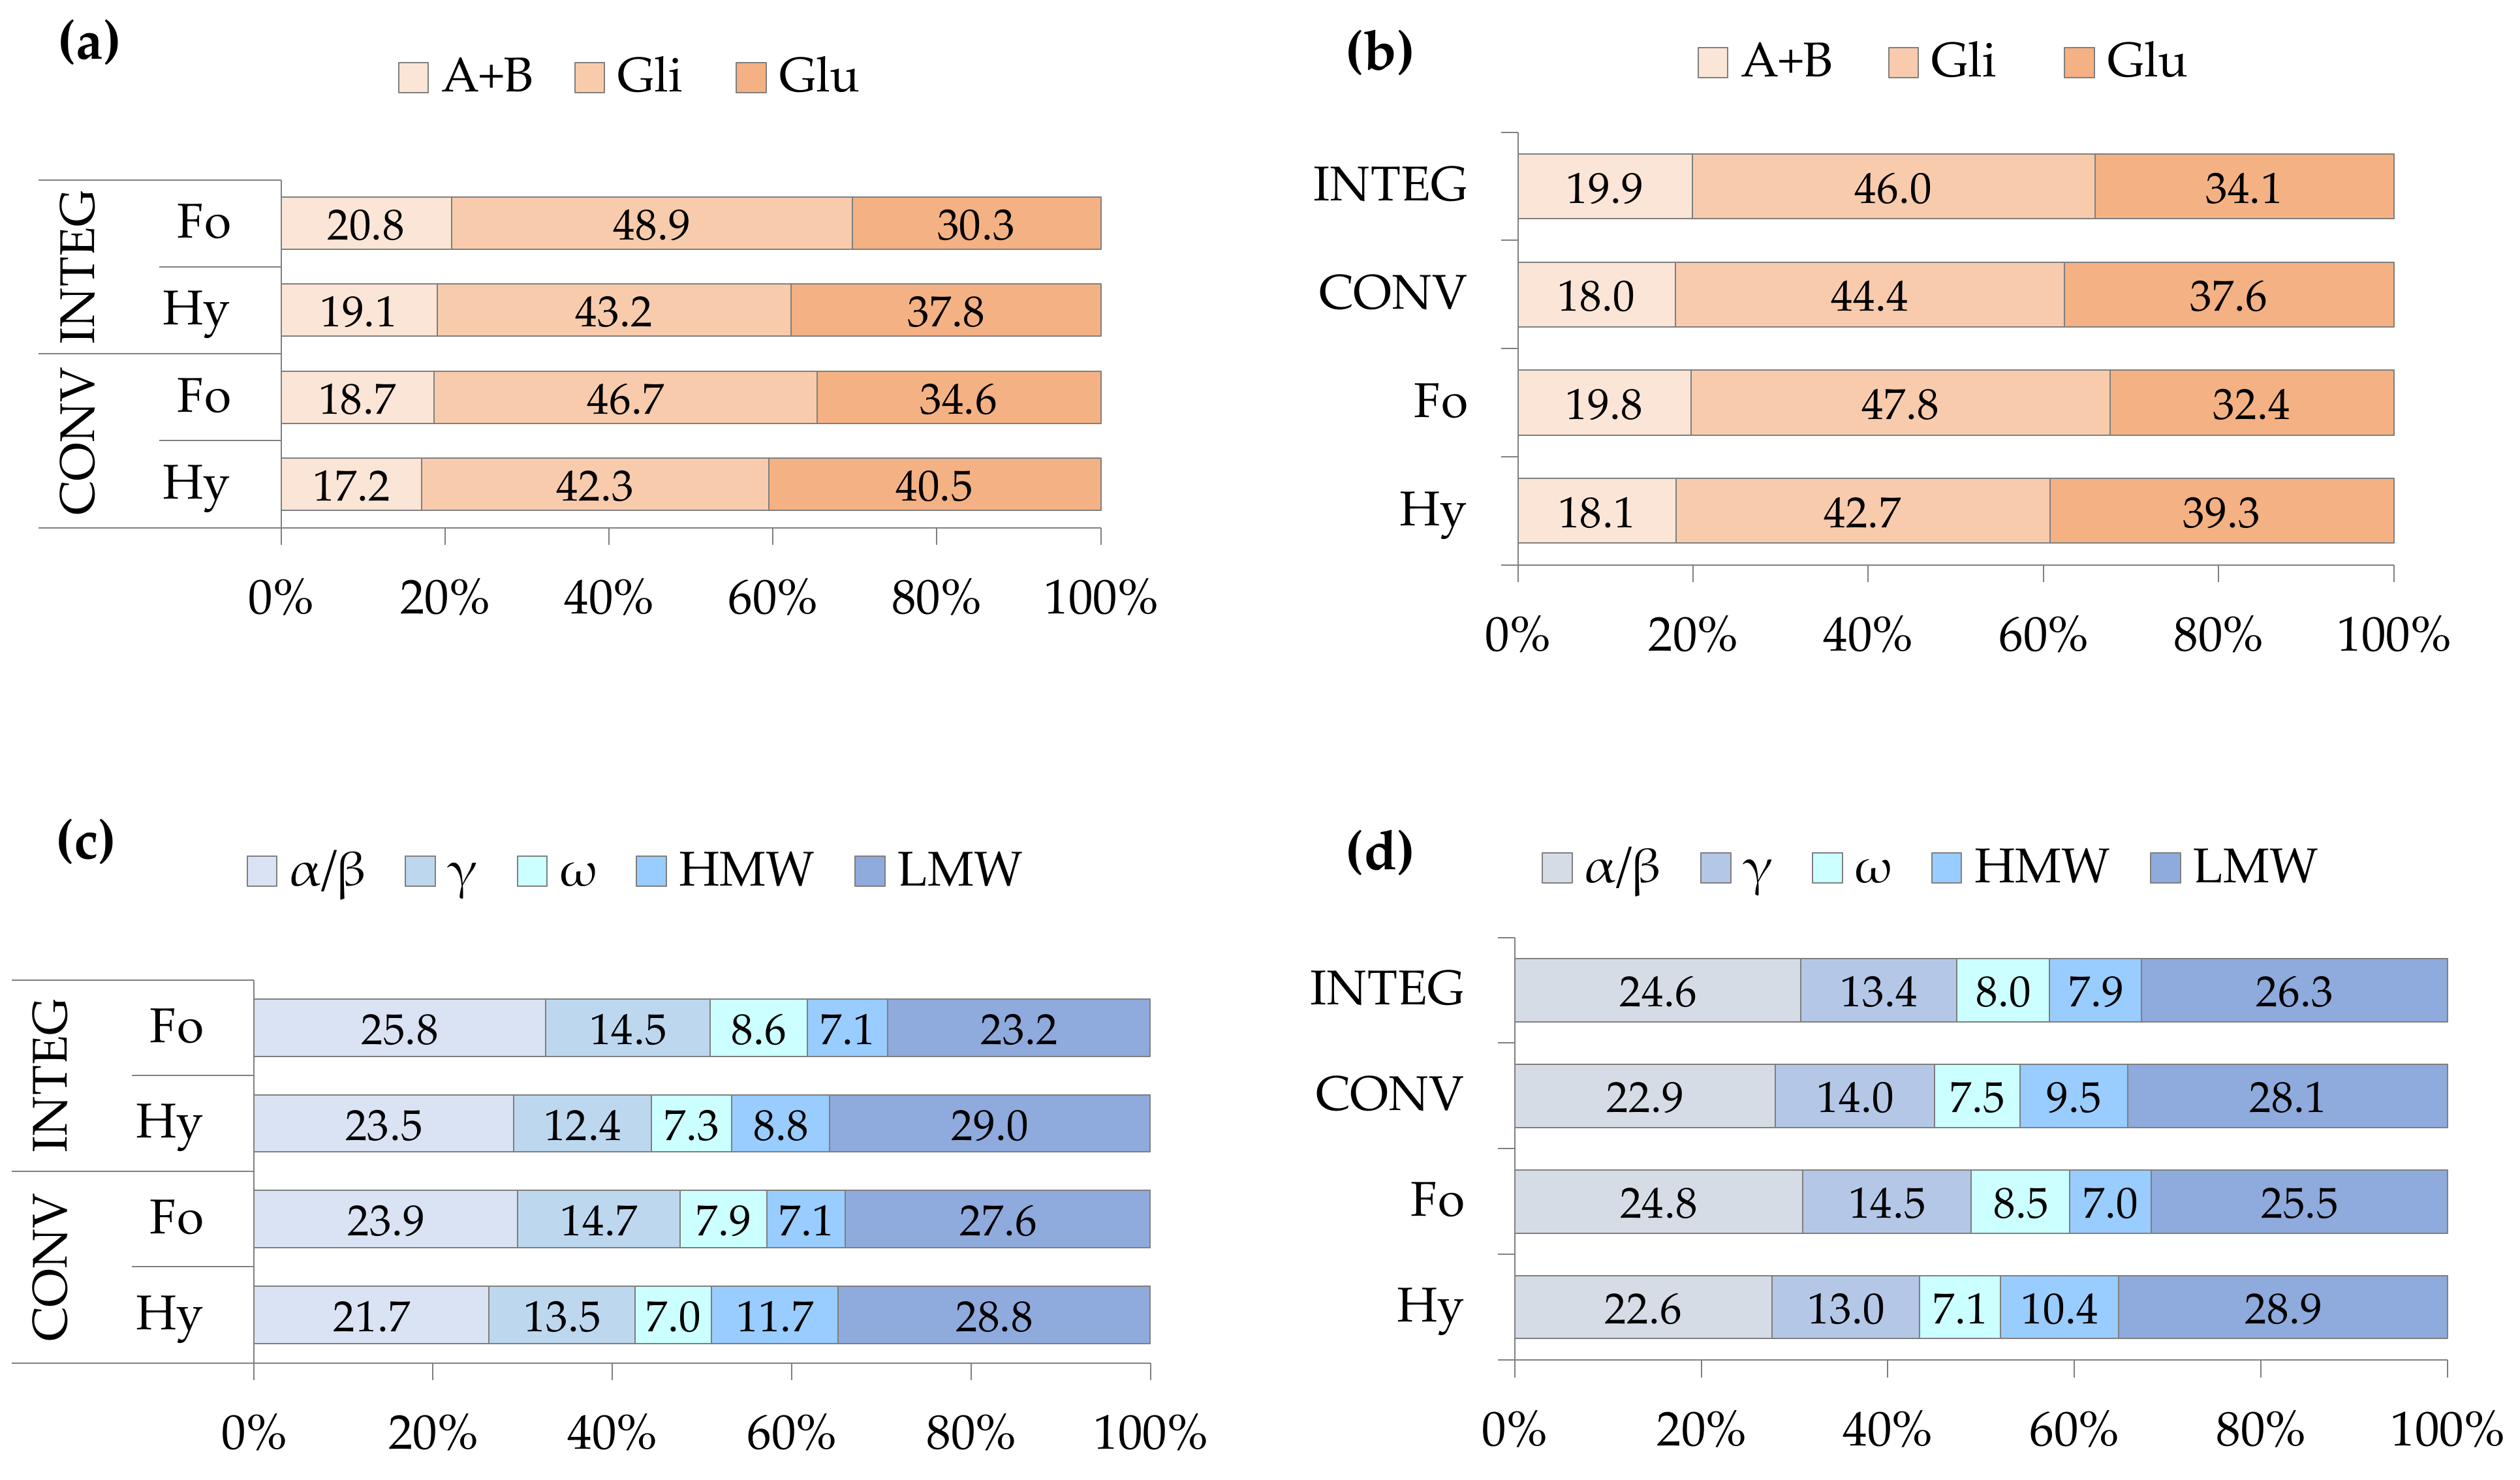
3.7. Protein Fraction Composition

The quality of wheat gluten is determined in particular by the optimal combination of storage proteins, its viscosity and extensibility are influenced by gliadins, and gluten elasticity is shaped by glutenins [60]. The wheat grain from the CONV system compared to INTEG contained significantly more gliadins and glutenins (Table 5). The increase in the amount of gliadins from the CONV system to INTEG was 4.8%, and glutenins increased by 16.7%. The obtained results are consistent with the study by García-Molina and Barro [59], who found that the use of nitrogen in the CONV system generally increases the proportion of protein fractions typical of gluten, i.e., glutenins and gliadins. The cropping system, however, did not differentiate the content of albumins and globulins. Krejčířová et al. [61] showed a 58.6% increase in the content of albumins and globulins in the grain of wheat cultivars from the organic system (ORG) to the conventional one (CONV). Horvat et al. [62] reported that the proportion of albumins and globulins in the total wheat protein, depending on the cultivar, ranges from 12.2% to 19.8%. Gliadins range from 46.2% to 56.6%, and glutenins range from 27.2% to 36.6%. In the present authors’ study, depending on the cropping system, the proportion of gliadins ranged from 44.4% to 46.0% (INTEG vs. CONV), and glutenins ranged from 34.1% to 37.6% (CONV vs. INTEG), while albumins and globulins ranged from 18.0% to 19.9% (CONV vs. INTEG). The CONV system compared to INTEG caused a significant increase in the content of ω gliadins as well as LMW and HMW glutenins.
The grain from the INTEG system had a higher proportion of subunits α/β (24.6%) and ω (8.0%) gliadins, and the CONV system had a higher proportion of γ gliadins (14.0%) as well as LMW and HMW glutenins, which were on average 9.5% and 28.1% (Table 5). Krejčířová et al. [61] showed a significant increase in the content of HMW glutenins from 12.7% to 25.2% (ORG vs. CONV), and the difference in the content of gliadins and LMW glutenins was insignificant, ranging from 67.2% (CONV) to 69.6% (ORG). The proportion of HMW and LMW glutenin fractions affects the quality and use of wheat grain for baking purposes [63]. In a study by Stępień and Wojtkowiak [64], the use of organic fertilization and meat and bone meal (MBM) resulted in a significant increase in the subunits α/β and γ gliadins in the grain of wheat cultivars. Horvat et al. [65] showed that the composition of the gliadin and glutenin fractions in grains is determined mainly by the genetic traits of wheat cultivars rather than differentiated nitrogen fertilization. In the present authors’ study, the highest values of the γ gliadin protein fractions, as well as LMW and HMW glutenins in the CONV system compared to INTEG, were found in the grain of cv. Hymalaya rather than cv. Formacja. On average, cv. Hymalaya accumulated significantly more LMW (10.4%) and HMW (28.9%) glutenins in the grain, and cv. Formacja accumulated significantly more albumins and globulins (19.8%),α/β and γ gliadins (24.8% and 14.5%, respectively), and ω gliadins (8.5%) (Figure 7a–d). Slightly different content of gliadins in wheat was found by Podolska et al. [66], who obtained 1.6% and 4.8% less α/β and ω gliadins and 1.7% more γ-gliadins than the average content of gliadin subunits in the present authors’ study. On the other hand, a study by Horvat et al. [62] shows that the average LMW glutenin content was the same as in the present study and the HMW glutenin content was 3.3% lower. The flour strength is positively affected by an increase in the HMW (high molecular weight) glutenin content and its ratio to the LMW (low molecular weight) glutenin subunit [58,59,60].
In the present study, the Gli/Glu and HMW/LMW ratios of cvs. Formacja and Hymalaya ranged from 1.40 to 1.28 and from 0.28 to 0.35, respectively. The CONV system effected a more favorable HMW/LMW ratio for cv. Hymalaya and the INTEG system for cv. Formacja. Moreover, cv. Hymalaya compared to cv. Formacja had a more favorable Gli/Glu ratio of 1.28. The Gli/Glu and HMW/LMW ratios were not significantly differentiated between the yeasts of the study.
A higher Gli/Glu ratio may suggest a reduced technological quality of the protein of wheat cultivars; as the number of glutenin subunits is positively correlated with the energy and volume of bread dough, a higher Gli/Glu ratio lowers the value of these parameters [66]. Many authors [58,59,64,65] indicate a significant impact of the environmental conditions, including weather conditions, on the content of gliadins and glutenins and their subunits, which was also confirmed in the present authors’ study. A more favorable composition of the glutenin proteins and their HMW/LMW subunits was demonstrated especially in the grain of cv. Hymalaya in the 2018/2019 season, where hydrothermal conditions were described as dry, particularly in June, and in July as rather dry (Table 6 and Table 7).

3.8. Minerals Content

The grain from the integrated system (INTEG) contained more Fe and Mn than the conventional system (CONV) (Table 8). The difference between these systems in the content of these elements was significant and amounted to 2.00 mg·kg−1 Fe and 3.24 mg·kg−1 Mn. Ciołek et al. [67] showed an increase in the content of Fe and Mn in wheat grain in the organic system (ORG) compared to the conventional system (CONV), which on average amounted to 4.68 and 3.56 mg·kg−1, respectively. According to Ryan et al. [68], higher contents of Mn and lower contents of Zn and Cu were found in wheat grain cultivated in the CONV system. However, no effect of the cropping system on the content of Mg and Fe was shown. In the present authors’ study, cropping systems did not differentiate the content of Cu, Zn, and Mg, which were at levels similar to the values given by Suchowilska et al. [69]. Liu et al. [70] showed that the concentration of Fe and Zn in wheat grain changes due to environmental conditions and may range from 44.2 to 46.5 mg·kg−1 Fe and from 29.1 to 30.2 mg·kg−1 Zn. The present authors’ study showed no effect of the interaction of experimental factors (CS × C) on the content of microelements in wheat grain in the years of the study (Y). However, significantly more micronutrients and higher Mg in wheat grain were found in the 2017/2018 season, characterized by not very high temperature and less rainfall during the wheat maturing period. According to Garnet and Graham [71], wheat can accumulate even up to 77.0% Fe and up to 62.0% Cu at the full-grain maturity stage. Grain of the hybrid cv. Hymalaya contained significantly more Fe, Cu, Mn, and Mg than a grain of the population cv. Formacja. The INTEG cropping system, compared to CONV, favored a higher content of Fe, Mn, and Mg in the grain of cv. Hymalaya than of cv. Formacja. No significant effect of the cultivar on Zn content was demonstrated. The highest average level of elements in the grain of wheat cultivars was found for Fe, and the lowest was found for Mg (Fe > Zn > Mn > Cu > Mg). The determined average contents of Zn (39.02 mg·kg−1) and Mn (28.71 mg·kg−1) in wheat grain were close to the range of values obtained by Mader et al. [58] in wheat grain grown in the conventional (CONV) and organic (ORG) systems. The average Fe content was higher, i.e., 39.65 mg·kg−1, in the grain of wheat cultivars representing the main cultivation regions of this species in the world [72]. The average amounts of Cu and Mg, in turn, were slightly higher than the values of 2.55 and 0.63 mg·kg−1 found by Ciołek et al. [67] in wheat grain from the conventional system (CONV).

4. Conclusions

The use of the conventional system (CONV) resulted in a higher grain yield and an increase in the physiological parameters of wheat plants (LAI, chlorophyll content, chlorophyll fluorescence, and gas exchange indices). The use of the hybrid cv. Hymalaya as compared to the population cv. Formacja resulted in a higher grain yield due to a more efficient course of the photosynthesis process. The yielding level of cv. Hymalaya in the INTEG system was similar to that of cv. Formacja grown in the CONV system.
A higher content of protein, γ gliadins, and LMW and HMW glutenins was found in the CONV system compared to INTEG, in the grain of cv. Hymalaya than of cv. Formacja. The INTEG cropping system, in turn, favored a higher content of Fe, Mn, and Mg in the grain of cv. Hymalaya.
Hydrothermal conditions with rainfall deficit in the 2018/2019 season resulted in a more favorable composition of glutenin proteins and a more favorable HMW/LMW ratio for cv. Hymalaya than cv. Formacja. The study has shown that hybrid wheat can be an alternative to population wheat, especially in farming systems with lower input levels as well as in regions exposed to periodic shortages of precipitation during growth.

Author Contributions

Conceptualization, M.J.-P. and J.B.; methodology, M.J.-P. and J.B.; formal analysis, M.J.-P.; investigation, M.J.-P., J.B., C.A.K. and E.H.; writing—original draft preparation, M.J.-P. and J.B.; writing—review and editing, J.B. and M.J.-P. All authors have read and agreed to the published version of the manuscript.

Funding

This research was funded by financial resources of the Ministry of Education and Science for scientific activities of the Institute of Agricultural Sciences, Land Management and Environmental Protection, University of Rzeszow.

Institutional Review Board Statement

Not applicable.

Informed Consent Statement

Not applicable.

Data Availability Statement

Not applicable.

Conflicts of Interest

The authors declare no conflict of interest.

References

  1. Tilman, D.; Cassman, K.G.; Matson, P.A.; Naylor, R.; Polasky, S. Agricultural sustainability and intensive production practices. Nature 2002, 418, 671–677. [Google Scholar] [CrossRef] [PubMed]
  2. Sułek, A. Economic evaluation of winter wheat production from different utility groups depending on the intensity of technology. Ann. Pol. Assoc. Agric. Aribus. Econ. 2017, 19, 226–231. [Google Scholar] [CrossRef]
  3. Szeląg-Sikora, A.; Sikora, J.; Niemiec, M.; Gródek-Szostak, Z.; Kapusta-Duch, J.; Kuboń, M.; Komorowska, M.; Karcz, J. Impact of Integrated and Conventional Plant Production on Selected Soil Parameters in Carrot Production. Sustainability 2019, 11, 5612. [Google Scholar] [CrossRef] [Green Version]
  4. Dachraoui, M.; Sombrero, A. Effect of tillage systems and different rates of nitrogen fertilisation on the carbon footprint of irrigated maize in a semiarid area of Castile and Leon, Spain. Soil Tillage Res. 2020, 196, 104472. [Google Scholar] [CrossRef]
  5. Tuomisto, H.L.; Hodge, I.D.; Riordan, P.; Macdonald, D.W. Comparing global warming potential, energy use and land use of organic, conventional and integrated winter wheat production. Ann. Appl. Biol. 2012, 161, 116–126. [Google Scholar] [CrossRef]
  6. Grabiński, J. Productive and Economical Effects of Intensive and Integrated Technology Production of Winter Wheat and Spring Barley. Ann. Pol. Assoc. Agric. Aribus. Econ. 2015, 17, 94–99. Available online: http://ageconsearch.umn.edu/record/233486 (accessed on 4 March 2022). (In Polish).
  7. Bielski, S.; Romaneckas, K.; Novikova, A.; Šarauskis, E. Are Higher Input Levels to Triticale Growing Technologies Effective in Biofuel Production System? Sustainability 2019, 11, 5915. [Google Scholar] [CrossRef] [Green Version]
  8. Shewry, P.R.; Hey, S.J. The contribution of wheat to human diet and health. Food Energy Secur. 2015, 4, 178–202. [Google Scholar] [CrossRef]
  9. Sharma, N.; Bhatia, S.; Chunduri, V.; Kaur, S.; Sharma, S.; Kapoor, P.; Kumari, A.; Garg, M. Pathogenesis of Celiac Disease and Other Gluten Related Disorders in Wheat and Strategies for Mitigating. Them. Front. Nutr. 2020, 7, 6. [Google Scholar] [CrossRef] [Green Version]
  10. FAOSTAT. Available online: https://www.fao.org/faostat/en/#data/QCL (accessed on 20 April 2022).
  11. Ray, D.K.; Mueller, N.D.; West, P.C.; Foley, J.A. Yield trends are insufficient to double global crop production by 2050. PLoS ONE 2013, 8, e66428. [Google Scholar] [CrossRef] [Green Version]
  12. Jiang, Y.; Schmidt, R.H.; Zhao, Y.; Reif, J.C. A quantitative genetic framework highlights the role of epistatic effects for grain-yield heterosis in bread wheat. Nat. Genet. 2017, 49, 1741–1746. [Google Scholar] [CrossRef]
  13. Gupta, P.K.; Balyan, H.S.; Gahlaut, V.; Saripalli, G.; Pal, B.; Basnet, B.R.; Joshi, A.K. Hybrid wheat: Past, present and future. Theor. Appl. Genet. 2019, 132, 2463–2483. [Google Scholar] [CrossRef]
  14. Selva, C.; Riboni, M.; Baumann, U.; Würschum, T.; Whitford, R.; Tucker, M.R. Hybrid breeding in wheat: How shaping floral biology can offer new perspectives. Funct. Plant Biol. 2020, 47, 675–694. [Google Scholar] [CrossRef]
  15. Živčák, M.; Olšovská, K.; Slamka, P.; Galambošová, J.; Rataj, V.; Shao, H.B.; Brestič, M. Application of chlorophyll fluorescence performance indices to assess the wheat photosynthetic functions influenced by nitrogen deficiency. Plant Soil Environ. 2014, 60, 210–215. [Google Scholar] [CrossRef] [Green Version]
  16. Zheng, B.; Zhang, X.; Wang, Q.; Li, W.; Huang, M.; Zhou, Q.; Cai, J.; Wang, X.; Cao, W.; Dai, T.; et al. Increasing plant density improves grain yield, protein quality and nitrogen agronomic efficiency of soft wheat cultivars with reduced nitrogen rate. Field Crops Res. 2021, 267, 108145. [Google Scholar] [CrossRef]
  17. Meier, U. Growth Stages of Mono- and Dicotyledonous Plants; BBCH Monograph: Quedlinburg, Germany, 2018; p. 204. [Google Scholar]
  18. Skowera, B. Changes of hydrothermal conditions in the Polish area (1971–2010). Fragm. Agron. 2014, 31, 74–87. (In Polish) [Google Scholar]
  19. IUSS Working Group WRB. Reference Base for Soil Resources 2014; Update 2015; Word Soil Resources Reports No. 106; FAO: Rome, Italy, 2015; pp. 172–173. [Google Scholar]
  20. Jankauskas, B.; Slepetiene, A.; Jankauskiene, G.; Fullen, A.M.; Booth, A.C. A comparative study of analytical methodologies to determine the soil organic matter content of Lithuanian Eutric Albeluvisols. Geoderma 2006, 136, 763–773. [Google Scholar] [CrossRef]
  21. Van Erp, P.J.; Houba, Y.J.G.; Van Beusichem, M.L. One hundredth molar calcium chloride extraction procedure. Part I: A review of soil chemical, analytical, and plant nutritional aspects. Commun. Soil Sci. Plant Anal. 1998, 29, 1603–1623. [Google Scholar] [CrossRef]
  22. Egner, H.; Riehm, H.; Domingo, R.W. Investigations on the chemical soil analysis as a basis for assessing the nutrient condition of the soil, II: Chemical extraction methods for phosphorus and potassium determination. K. Lantbr. Ann. 1960, 26, 199–215. [Google Scholar]
  23. Schachtschabel, P. The plant-available magnesium in the soil and its determination. Z. Pflanz. Düngung Bodenkd. 1954, 67, 9–23. [Google Scholar] [CrossRef]
  24. Rinkis, G.J. Micronutrients in Agriculture and Medicine; Naukova Dumka: Kijev, Ukraine, 1963. [Google Scholar]
  25. Hicks, S.; Lascano, R. Estimation of leaf area index for cotton canopies using the Li-Cor LAI 2000 plant canopy analyser. Agron. J. 1995, 87, 458–464. [Google Scholar] [CrossRef]
  26. Blackmer, T.M.; Schepers, J.S. Techniques for monitoring crop nitrogen status in corn. Commun. Soil Sci. Plant Anal. 1994, 25, 1791–1800. [Google Scholar] [CrossRef]
  27. Maxwell, K.; Johnson, G.N. Chlorophyll fluorescence—A practical guide. J. Exp. Bot. 2000, 51, 659–668. [Google Scholar] [CrossRef] [PubMed]
  28. Kalaji, H.M.; Schansker, G.; Ladle, R.J.; Goltsev, V.; Bosa, K.; Allakhverdiev, S.I.; Brestic, M.; Bussotti, F.; Calatayud, A.; Dąbrowski, P.; et al. Frequently asked questions about in vivo chlorophyll fluorescence: Practical issues. Photosyn. Res. 2014, 122, 121–158. [Google Scholar] [CrossRef] [Green Version]
  29. Nobel, P.S. Physicochemical and Environmental Plant Physiology; Elsevier: Oxford, UK, 2009. [Google Scholar] [CrossRef]
  30. AACC. American Association of Cereal Chemists (AACC) International Approved Methods of Analysis, 11th ed.; AACC: St. Paul, MN, USA, 2009. [Google Scholar]
  31. Wieser, H.; Antes, S.; Seilmeier, W. Quantitative determination of gluten protein types in wheat flour by reversed-phase high-performance liquid chromatography. Cereal Chem. 1998, 75, 544–650. [Google Scholar] [CrossRef]
  32. Konopka, I.; Tańska, M.; Pszczółkowska, A.; Fordoński, G.; Kozirok, W.; Olszewski, J. The effect of water stress on wheat kernel size, color and protein composition. Pol. J. Nat. Sci. 2007, 2, 157–171. [Google Scholar] [CrossRef]
  33. Sułek, A.; Cacak-Pietrzak, G. The influence of production technology on yield and selected quality parameters of spring wheat cultivars. Res. Rural Dev. 2018, 2, 42–48. [Google Scholar] [CrossRef]
  34. Kołodziejczyk, M.; Szmigiel, A.; Kulig, B. Yielding of selected spring wheat cultivars depending on technology level. Fragm. Agron. 2009, 26, 58–67. (In Polish) [Google Scholar]
  35. Plessis, A.; Ravel, C.; Bordes, J.; Balfourier, F.; Martre, P. Association study of wheat grain protein composition reveals that gliadin and glutenin composition are trans-regulated by different chromosome regions. J. Exp. Bot. 2013, 64, 3627–3644. [Google Scholar] [CrossRef] [Green Version]
  36. Whitford, R.; Fleury, D.; Reif, J.C.; Garcia, M.; Okada, T.; Korzun, V.; Langridge, P. Hybrid breeding in wheat: Technologies to improve hybrid wheat seed production. J. Exp. Bot. 2013, 64, 5411–5428. [Google Scholar] [CrossRef] [Green Version]
  37. Iwańska, M.; Paderewski, J.; Stępień, M.; Rodrigues, P.C. Adaptation of Winter Wheat Cultivars to Different Environments: A Case Study in Poland. Agronomy 2020, 10, 632. [Google Scholar] [CrossRef]
  38. Serrano, L.; Gamon, J.A.; Peńuelas, J. Estimation of canopy photosynthetic and nonphotosynthetic components from spectral transmittance. Ecology 2000, 81, 3149–3162. [Google Scholar] [CrossRef]
  39. Jameison, P.D.; Martin, R.J.; Francis, G.S.; Wilson, D.R. Drought effects on biomass production and radiation—Use efficiency in barley. Field Crops Res. 1995, 43, 77–86. [Google Scholar] [CrossRef]
  40. Bavec, M.; Vuković, K.; Grobelnik Mlakar, S.; Rozman, Č.; Bavec, F. Leaf area index in winter wheat: Response on seed rate and nitrogen application by different varieties. J. Cent. Eur. Agric. 2007, 8, 337–342. [Google Scholar]
  41. Olsen, J.; Weiner, J. The influence of Triticum aestivum density, sowing pattern and nitrogen fertilization on leaf area index and its spatial variation. Basic Appl. Ecol. 2007, 8, 252–257. [Google Scholar] [CrossRef]
  42. Skudra, I.; Ruza, A. Effect of nitrogen and sulphur fertilization on chlorophyll content in winter wheat. Rural Sustain. Res. 2017, 37, 29–37. [Google Scholar] [CrossRef] [Green Version]
  43. Kara, B.; Mujdeci, M. Influence of late-season nitrogen application on chlorophyll content and leaf area index in wheat. Sci. Res. Essays. 2010, 5, 2299–2303. [Google Scholar] [CrossRef]
  44. Sayed, O.H. Chlorophyll fluorescence as a tool in cereal crop research. Photosynthetica 2003, 41, 321–330. [Google Scholar] [CrossRef]
  45. Baker, N.R.; Rosenqvist, E. Applications of chlorophyll fluorescence can improve crop production strategies: An examination of future possibilities. J. Exp. Bot. 2004, 55, 1607–1621. [Google Scholar] [CrossRef] [Green Version]
  46. Whitney, S.M.; Houtz, R.L.; Alonso, H. Advancing our understanding and capacity to engineer nature’s CO2—Sequestering enzyme, Rubisco. Plant Physiol. 2011, 155, 27–35. [Google Scholar] [CrossRef] [Green Version]
  47. Wang, X.; Wang, L.; Shangguan, Z. Leaf gas exchange and fluorescence of two winter wheat varieties in response to drought stress and nitrogen supply. PLoS ONE 2016, 11, e0165733. [Google Scholar] [CrossRef] [Green Version]
  48. Lu, C.; Zhang, J.; Zhang, Q.; Li, L.; Kuang, T. Modification of photosystem II photochemistry in nitrogen deficient maize and wheat plants. J. Plant Physiol. 2001, 158, 1423–1430. [Google Scholar] [CrossRef]
  49. Lawlor, D.W.; Cornic, G. Photosynthetic carbon assimilation and associated metabolism in relation to water deficits in higher plants. Plant Cell Environ. 2002, 25, 275–294. [Google Scholar] [CrossRef] [Green Version]
  50. Yang, X.; Chen, X.; Ge, Q.; Li, B.; Tong, Y.; Li, Z.; Kuang, T.; Lu, C. Characterization of photosynthesis of flag leaves in a wheat hybrid and its parents grown under field conditions. J. Plant Physiol. 2007, 164, 318–326. [Google Scholar] [CrossRef]
  51. Waraich, E.A.; Ahmad, R.; Saifullah Ahmad, A. Water stress and nitrogen managment effects on gas exchange, water relations, and water use efficiency in wheat. J. Plant Nutr. 2011, 34, 1867–1882. [Google Scholar] [CrossRef]
  52. Ciompi, S.; Gentili, E.; Guidi, L.; Soldatini, G.F. The effect of nitrogen deficiency on leaf gas exchange and chlorophyll fluorescence parameters in sunflower. Plant Sci. 1996, 118, 177–184. [Google Scholar] [CrossRef]
  53. Shangguan, Z.; Shao, M.; Dyckmans, J. Effects of nitrogen nutrition and water deficit on net photosynthetic rate and chlorophyll fluorescence in winter wheat. J. Plant Physiol. 2000, 156, 46–51. [Google Scholar] [CrossRef]
  54. Yu, Q.; Zhang, Y.I.; Liu, Y.; Shi, P. Simulation of the stomatal conductance of winter wheat in response to light, temperature and CO2 changes. Ann. Bot. 2004, 93, 435–441. [Google Scholar] [CrossRef] [Green Version]
  55. Rachoń, L.; Szumiło, G.; Brodowska, M.; Woźniak, A. Nutritional value and mineral composition of grain of selected wheat species depending on the intensity of a production technology. J. Elem. 2015, 3, 705–7015. [Google Scholar] [CrossRef] [Green Version]
  56. Wojtkowiak, K.; Stępień, A. Nutritive value of spelt (Triticum aestivum spp. spelta L.) as influenced by the foliar application of copper, zinc and manganese. Zemdirbyste-Agriculture 2015, 24, 389–396. [Google Scholar] [CrossRef] [Green Version]
  57. Mader, P.; Hahn, D.; Dubois, D.; Gunst, L.; Alfoldi, T.; Bergmann, H.; Oehme, M.; Amado, R.; Schneider, H.; Graf, U.; et al. Wheat quality in organic and conventional farming: Results of a 21 year field experiment. J. Sci. Food Agric. 2007, 87, 1826–1835. [Google Scholar] [CrossRef]
  58. García-Molina, D.M.; Barro, F. Characterization of changes in gluten proteins in low-gliadin transgenic wheat lines in response to application of different nitrogen regimes. Front. Plant Sci. 2017, 8, 257. [Google Scholar] [CrossRef] [PubMed] [Green Version]
  59. Woźniak, A.; Rachoń, L. Effect of tillage systems on the yield and quality of winter wheat grain and soil properties. Agriculture 2020, 10, 405. [Google Scholar] [CrossRef]
  60. Shewry, P.R. Improving the protein content and composition of cereal grain. J. Cereal Sci. 2007, 46, 239–250. [Google Scholar] [CrossRef]
  61. Krejčířová, L.; Capouchová, I.; Petr, J.; Bicanová, E.; Faměra, O. The effect of organic and conventional growing systems on quality and storage protein composition of winter wheat. Plant Soil Environ. 2007, 53, 499–505. [Google Scholar] [CrossRef] [Green Version]
  62. Horvat, D.; Drezner, G.; Sudar, R.; Šimic, G.; Dvojkovic, K.; Španic, V.; Magdic, D. Distribution of wheat protein components under different genetic backgrounds and environments. Turk. J. Field Crops. 2015, 20, 150–154. [Google Scholar] [CrossRef] [Green Version]
  63. Shewry, P.R. Wheat. J. Exp. Bot. 2009, 60, 1537–1553. [Google Scholar] [CrossRef]
  64. Stępień, A.; Wojtkowiak, K. Composition of gluten proteins in spring and winter wheat grain cultivated under conditions of varied fertilization. Acta Agric. Scand. B Soil Plant. Sci. 2013, 63, 588–594. [Google Scholar] [CrossRef]
  65. Horvat, D.; Šimić, G.; Dvojković, K.; Ivić, M.; Plavšin, I.; Novoselović, D. Gluten protein compositional changes in response to nitrogen application rate. Agronomy 2021, 11, 325. [Google Scholar] [CrossRef]
  66. Podolska, G.; Aleksandrowicz, E.; Szafrańska, A. Bread making potential of Triticum aestivum and Triticum spelta species. Open Life Sci. 2020, 15, 30–40. [Google Scholar] [CrossRef] [Green Version]
  67. Ciołek, A.; Makarska, E.; Wesołowski, M.; Cierpiała, R. Content of selected nutrients in wheat, barley and oat grain from organic and conventional farming. J. Elem. 2012, 2, 181–189. [Google Scholar] [CrossRef]
  68. Ryan, M.; Derrick, J.; Dann, P. Grain mineral concentrations and yield of wheat grown under organic and conventional management. J. Sci. Food Agri. 2004, 84, 207–216. [Google Scholar] [CrossRef]
  69. Suchowilska, E.; Wiwart, M.; Kandler, W.; Krska, R. A comparison of macro- and microelement concentrations in the whole grain of four Triticum species. Plant Soil Environ. 2012, 58, 141–147. [Google Scholar] [CrossRef] [Green Version]
  70. Liu, H.; Wang, H.Z.; Li, F.; Li, L.; Yang, N.; Yang, Y.; Huang, D.; Liang, D.; Zhao, H.; Mao, H.; et al. Grain iron and zinc concentrations of wheat and their relationships to yield in major wheat production areas in China. Field Crops Res. 2014, 156, 151–160. [Google Scholar] [CrossRef]
  71. Garnet, P.T.; Graham, D.G. Distribution and remobilization of iron and copper in wheat. Ann. Bot. 2005, 95, 817–826. [Google Scholar] [CrossRef] [Green Version]
  72. Velu, G.; Singh, R.P.; Huerta-Espino, J.; Peña, R.J. Breeding for enhanced zinc and iron concentration in CIMMYT spring wheat germplasm. Czech J. Genet. Plant Breed. 2011, 47, 174–177. [Google Scholar] [CrossRef] [Green Version]
Figure 1. (ac) Meteorological conditions during the wheat growing seasons. (a) precipitation (mm), (b) temperature (°C), (c) Sielianinov hydrothermal coefficient [18] (ed—extremely dry, vd—very dry, d—dry, rd—rather dry, o—optimal, rh—rather humid, h—humid, vh—very humid, eh—extremely humid).
Agronomy 12 01345 g001aAgronomy 12 01345 g001b
Figure 2. (ac) Winter grain yield depending on (a) cultivars and cropping systems, (b) cropping systems and years of research, and (c) cultivars and years of research. The presence of different lowercase letters indicates a statistical difference between means (Tukey’s Test, p = 0.05). INTEG—integrated cropping system, CONV—conventional cropping system, Fo—cv. Formacja, Hy—cv. Hymalaya.
Agronomy 12 01345 g002
Figure 3. Leaf area index depending on cultivars and cropping systems. The presence of different lowercase letters indicates a statistical difference between means (Tukey’s Test, p = 0.05). INTEG—integrated cropping system, CONV—conventional cropping system, Fo—cv. Formacja, Hy—cv. Hymalaya.
Agronomy 12 01345 g003
Figure 4. Relative chlorophyll content depending on cultivars and cropping systems. The presence of different lowercase letters indicates a statistical difference between means (Tukey’s Test, p = 0.05). INTEG—integrated cropping system, CONV—conventional cropping system, Fo—cv. Formacja, Hy—cv. Hymalaya.
Agronomy 12 01345 g004
Figure 5. (ac) Selected chlorophyll fluorescence parameters depending on cultivars and cropping systems. (a) Fv/F0—the maximum quantum yield of primary photochemistry, (b) Fv/Fm—maximum quantum yield of PSII photochemistry, and (c) PI—performance index. The presence of different lowercase letters indicates a statistical difference between means (Tukey’s Test, p = 0.05). INTEG—integrated cropping system, CONV—conventional cropping system, Fo—cv. Formacja, Hy—cv. Hymalaya.
Agronomy 12 01345 g005
Figure 6. (ae) Selected gas exchange parameters depending on cultivars and cropping systems. (a) PN—net photosynthetic rate, (b) gs—stomatal conductance, (c) E—transpiration rate, (d) Ci—intracellular CO2 concentration, and (e) WUE—water use efficiency. The presence of different lowercase letters indicates a statistical difference between means (Tukey’s Test, p = 0.05). INTEG—integrated cropping system, CONV—conventional cropping system, Fo—cv. Formacja, Hy—cv. Hymalaya.
Agronomy 12 01345 g006aAgronomy 12 01345 g006b
Figure 7. (ad) Changes in the proportions of storage proteins as affected by the cropping system and cultivar (total protein = 100%). The presence of different lowercase letters indicates a statistical difference between means (Tukey’s Test, p = 0.05). A + B—albumins and globulins, Gli—gliadins, Glu—glutenins, α/β, γ, ω Gli—α/β, γ, ω Gliadins, HMW—high molecular weight, LMW—low molecular weight, INTEG—integrated cropping system, CONV—conventional cropping system, Fo—cv. Formacja, Hy—cv. Hymalaya.
Agronomy 12 01345 g007
Table 2. Basic soil characteristics prior to the experiment.
TraitsYears
2016/20172017/20182018/2019
Value
pH KCl7.326.586.75
organic carbon (g·kg−1)10.710.510.9
Nmin (kg·ha−1)61.258.366.0
Content of available nutrients (mg·kg−1 soil):
phosphorus (P)202.0131.583.0
potassium (K)272.5190.1245.2
magnesium (Mg) 128.6142.4231.7
iron (Fe)2291.42529.12235.8
zinc (Zn)15.314.113.9
manganese (Mn) 379.8241.3275.3
copper (Cu) 6.86.16.5
Table 3. Grain yield and selected physiological parameters depending on cultivars and cropping systems. The presence of different lowercase letters indicates a statistical difference between means (Tukey’s Test, p = 0.05). ***, **, * and ‘ns’ indicate significant difference, p < 0.001, p < 0.01 and p < 0.05 and non-significant differences, respectively. INTEG—integrated cropping system, CONV—conventional cropping system.
FactorGrain YieldLAIRelative Chlorophyll ContentGas ExchangeChlorophyll Fluorescence
Cropping
System (CS)
Cultivar
(C)
PnEgsCiWUEFv/FmFv/F0PI
INTEG 8.55 a4.22 a23.8 a12.1 a3.17 a0.209 a223 b3.94 b0.757 a3.30 a4.84 a
CONV 9.52 b4.75 b26.8 b14.0 b3.91 b0.236 b203 a3.58 a0.812 b3.60 a5.88 b
Formacja8.64 a 4.23 a24.0 a12.3 a3.30 a0.212 a222 b3.87 a0.764 a3.31 a4.87 a
Hymalaya9.44 b4.74 b26.6 b13.7 b3.78 b0.232 b205 a3.66 a0.805 b3.59 a5.85 b
Year
2016/20179.17 b4.28 a24.6 b11.7 a3.30 b0.246 b220 b4.01 b0.780 a3.53 a5.38 b
2017/20189.96 c4.88 b28.6 c12.6 a4.36 c0.205 a202 a3.90 b0.772 a3.63 a6.09 c
2018/20197.98 a4.30 a22.7 a14.7 b2.96 a0.216 a218 b3.38 a0.801 a3.19 a4.60 a
Mean9.044.4825.313.03.540.2222133.760.7853.455.36
CS**************************ns***
C*********************ns**ns***
Y*********************nsns***
CS × C*nsnsns**nsns*nsns**
CS × Ynsns*nsnsnsns*nsnsns
C × Ynsns**nsnsnsnsnsnsnsns
CS × C × Ynsns*nsnsnsnsnsnsnsns
Table 4. Effect of cropping system and cultivar on the content and composition of proteins.
FactorProtein
[g·kg−1]
Gluten
[%]
A + BGli GluGli/
Glu
Cropping
System (CS)
Cultivar
(C)
mAU·s−1
INTEGFormacja124.4 a25.5 a12.1 b28.4 b17.6 a1.47 b
Hymalaya131.9 b28.1 bc11.7 ab26.5 a23.2 b1.29 a
CONVFormacja127.5 a26.8 ab11.6 a28.9 b21.4 b1.33 a
Hymalaya137.3 c29.9 c11.7 ab28.8 b27.6 c1.27 a
INTEG 128.2 a26.8 a11.9 a27.5 a20.4 a1.38 a
CONV 132.4 b28.4 b11.7 a28.9 b24.5 b1.30 b
Formacja126.0 a26.2 a11.9 a28.7 a19.5 a1.40 a
Hymalaya134.6 b29.0 b11.7 a27.6 b25.4 b1.28 b
Year (Y)
2016/2017120.5 a25.5 a11.1 a25.2 a19.8 a1.37 a
2017/2018130.2 b27.3 b12.1 b29.4 b22.9 b1.35 a
2018/2019140.2 c29.9 c12.1 b29.9 b24.6 c1.29 a
Mean130.327.611.828.222.41.34
CS******ns********
C******ns*********
Y****************
CS × C*nsns***ns*
CS × Y**nsns********
C × Y****ns*****ns
CS × C × Ynsnsns***nsns
The presence of different lowercase letters indicates a statistical difference between means (Tukey’s Test, p = 0.05). ***, **, * and ‘ns’ indicate significant difference, p < 0.001, p < 0.01 and p < 0.05 and non-significant differences, respectively. A + B—albumins and globulins, Gli—gliadins, Glu—glutenins, Gli/Glu—ratio, INTEG—integrated cropping system, CONV—conventional cropping system.
Table 5. Effect of cropping system and cultivar on the protein fractions of gliadins and glutenins.
Factorα/β
Gli
γ
Gli
ω
Gli
HMW GluLMW GluHMW/
LMW
Cropping
System (CS)
Cultivar
(C)
mAU·s−1
INTEGFormacja15.0 b8.4 b5.0 b4.1 a13.5 a0.30 b
Hymalaya14.4 a7.6 a4.5 a5.4 b17.8 b0.30 b
CONVFormacja14.8 ab9.1 c5.1 b4.4 a17.1 b0.26 a
Hymalaya14.8 ab9.2 c4.8 ab8.0 c19.6 c0.40 c
INTEG 14.7 a8.0 a4.8 a4.7 a15.7 a0.30 a
CONV 14.8 a9.1 b4.9 a6.2 b18.3 b0.33 b
Formacja14.9 a8.7 a5.0 a4.2 a15.3 a0.28 a
Hymalaya14.6 b8.4 b4.6 b6.7 b18.7 b0.35 b
Year (Y)
2016/201713.2 a7.8 a4.3 a4.7 a15.1 a0.31 a
2017/201815.5 b9.1 b4.9 b5.5 b17.4 b0.31 a
2018/201915.6 b8.9 b5.4 c6.2 c18.5 b0.33 a
Mean14.78.64.85.517.00.32
CSns*************
C**************
Y***************ns
CS × C***ns*******
CS × Y***********
C × Y***********ns*
CS × C × Ynsnsnsnsnsns
The presence of different lowercase letters indicates a statistical difference between means (Tukey’s Test, p = 0.05). ***, **, * and ‘ns’ indicate significant difference, p < 0.001, p < 0.01 and p < 0.05 and non-significant differences, respectively. α/β, γ, ω Gli—α/β, γ, ω Gliadins, HMW—high molecular weight, LMW—low molecular weight, HMW/LMW—ratio, Gli —gliadins, Glu—glutenins, INTEG—integrated cropping system, CONV—conventional cropping system.
Table 6. Effect of cultivars and years of research on the content and composition of proteins.
Year (Y)Cultivar (C)Protein
[g·kg−1]
Gluten
[%]
A + BGli GluGli/
Glu
mAU·s−1
2016/2017Formacja117.7 a23.8 a11.2 a25.0 a17.3 a1.41 d
Hymalaya123.3 b27.1 b11.1 a25.3 a22.3 b1.34 c
20117/2018Formacja128.4 c26.5 b12.2 b29.6 c20.4 b1.42 d
Hymalaya132.0 c28.2 b12.0 b29.3 c25.5 c1.28 b
2018/2019Formacja131.8 c28.2 b12.2 b31.5 d20.8 b1.37 c
Hymalaya148.7 d31.7 c12.0 b28.3 b28.4 d1.21 a
The presence of different lowercase letters indicates a statistical difference between means (Tukey’s Test, p = 0.05). A + B—albumins and globulins, Gli—gliadins, Glu—glutenins, Gli/Glu—ratio, INTEG—integrated cropping system, CONV—conventional cropping system.
Table 7. Effect of cultivars and years of research on the protein fractions of gliadins and glutenins.
Year (Y)Cultivar (C)α/β
Gli
γ
Gli
ω
Gli
HMW GluLMW GluHMW/
LMW
mAU·s−1
2016/2017Formacja13.2 a7.5 a4.3 a3.9 a13.5 a0.29 a
Hymalaya13.1 a8.0 ab4.2 a5.6 c16.7 bc0.33 b
20117/2018Formacja15.4 bc9.3 d4.9 b4.2 ab16.1 b0.27 a
Hymalaya15.1 b8.9 cd4.9 b6.7 d18.7 cd0.35 b
2018/2019Formacja16.1 c9.5 d5.9 c4.6 b16.3 b0.29 a
Hymalaya15.6 bc8.4 bc4.8 b7.8 e20.7 d0.37 b
The presence of different lowercase letters indicates a statistical difference between means (Tukey’s Test, p = 0.05). α/β, γ, ω Gli—α/β, γ, ω Gliadins, HMW—high molecular weight, LMW—low molecular weight, HMW/LMW—ratio, Gli—gliadins, Glu—glutenins, INTEG—integrated cropping system, CONV—conventional cropping system.
Table 8. Effect of cropping system and cultivar on the mineral composition.
FactorIron
(Fe)
Cooper
(Cu)
Zinc
(Zn)
Manganese
(Mn)
Magnesium
(Mg)
Cropping
System (CS)
Cultivar
(C)
mg·kg−1g·kg−1
INTEGFormacja52.1 ab2.48 a38.37 a28.12 b0.92 a
Hymalaya54.9 a3.11 b39.93 a32.54 c1.02 b
CONVFormacja50.2 a2.59 a38.35 a25.84 a0.94 ab
Hymalaya52.9 ab3.05 b39.45 a28.34 b0.95 ab
INTEG 53.5 a2.79 a39.15 a30.33 a0.97 a
CONV 51.5 b2.82 a38.90 a27.09 b0.94 a
Formacja51.1 a2.53 a38.36 a26.98 a0.93 a
Hymalaya53.9 b3.08 b39.69 a30.44 b0.99 b
2016/201748.7 a2.50 a39.79 a27.85 a0.89 a
2017/201855.1 b3.06 b41.20 b30.34 b1.02 b
2018/201953.8 b 2.86 b36.08 b27.93 a0.97 b
Mean52.502.8139.0228.710.96
CS**nsns****
C***********
Y***************
CS × Cnsnsns***ns
CS × Ynsnsnsnsns
C × Ynsnsnsnsns
CS × C × Ynsnsnsnsns
The presence of different lowercase letters indicates a statistical difference between means (Tukey’s Test, p = 0.05). ***, **, * and ‘ns’ indicate significant difference, p < 0.001, p < 0.01 and p < 0.05 and non-significant differences, respectively. INTEG—integrated cropping system, CONV—conventional cropping system.
Publisher’s Note: MDPI stays neutral with regard to jurisdictional claims in published maps and institutional affiliations.

