
Evaluation of Grain Yield Stability in Some Selected Wheat Genotypes Using AMMI and GGE Biplot Methods


 ,
,  ,
,  and
and 
Abstract
:1. Introduction
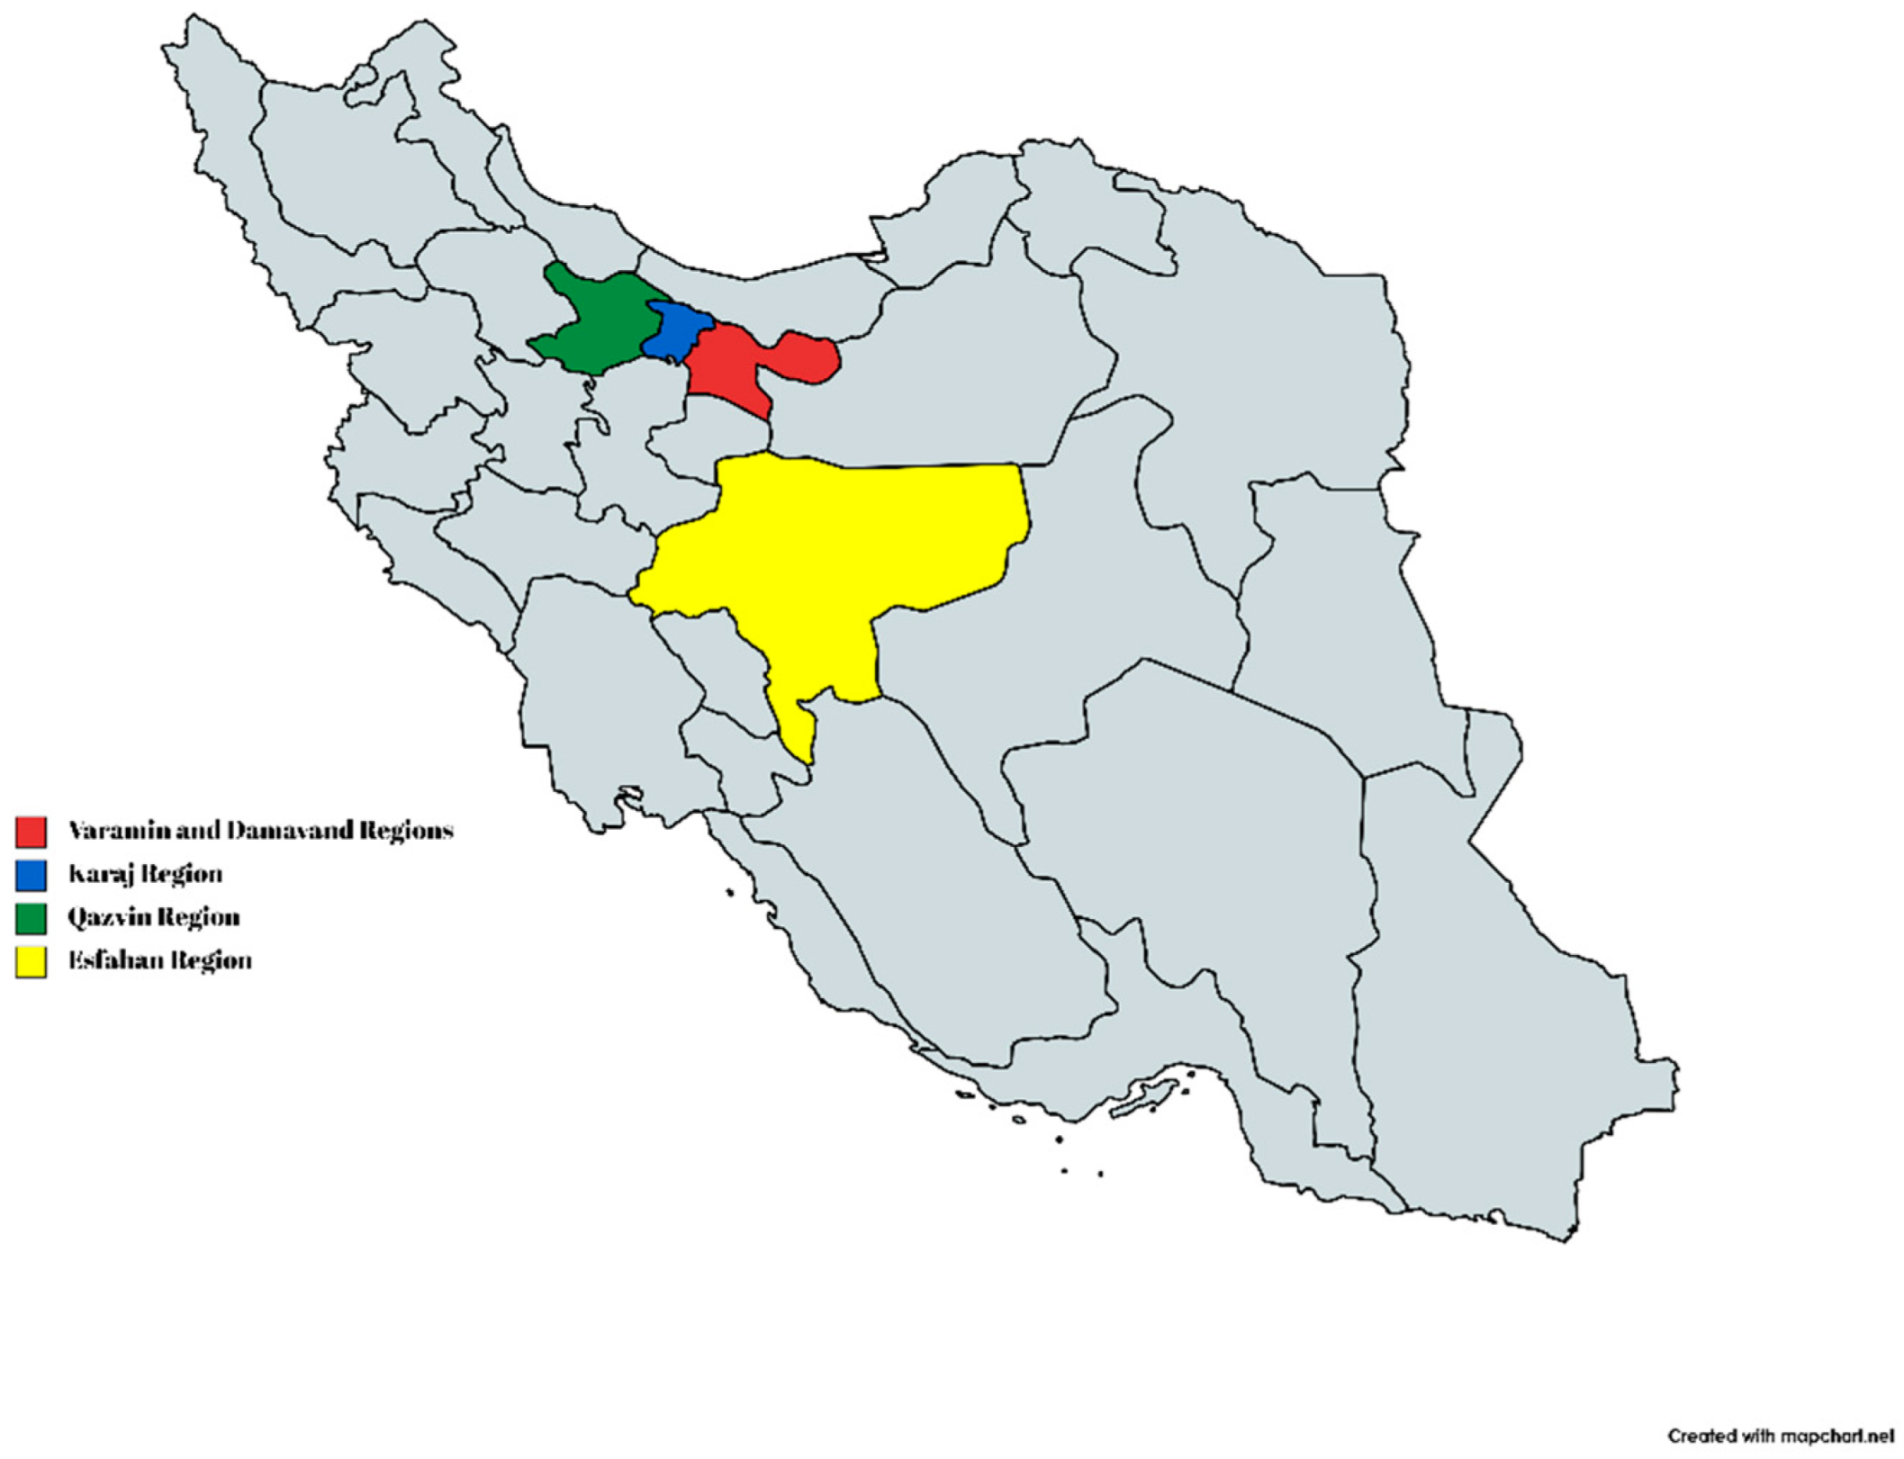
2. Materials and Methods
3. Results
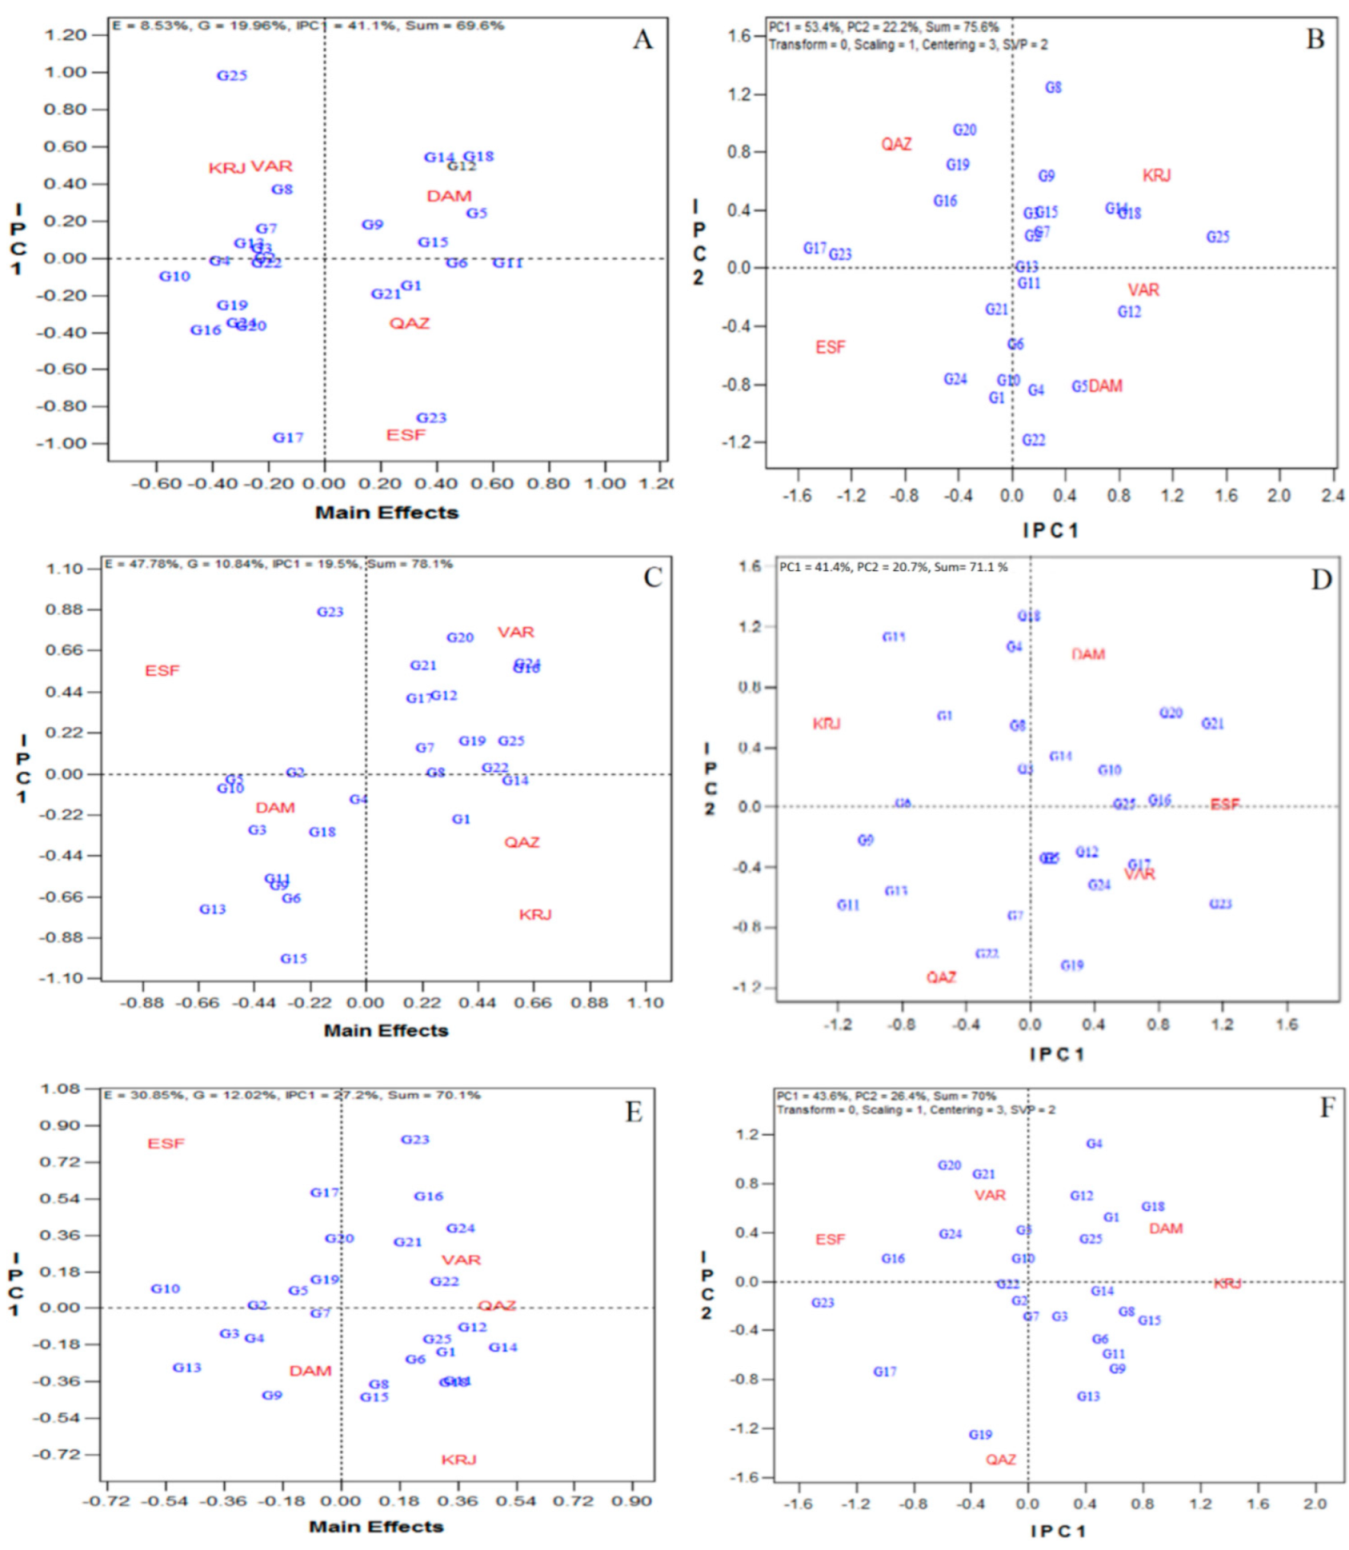
3.1. AMMI Analysis
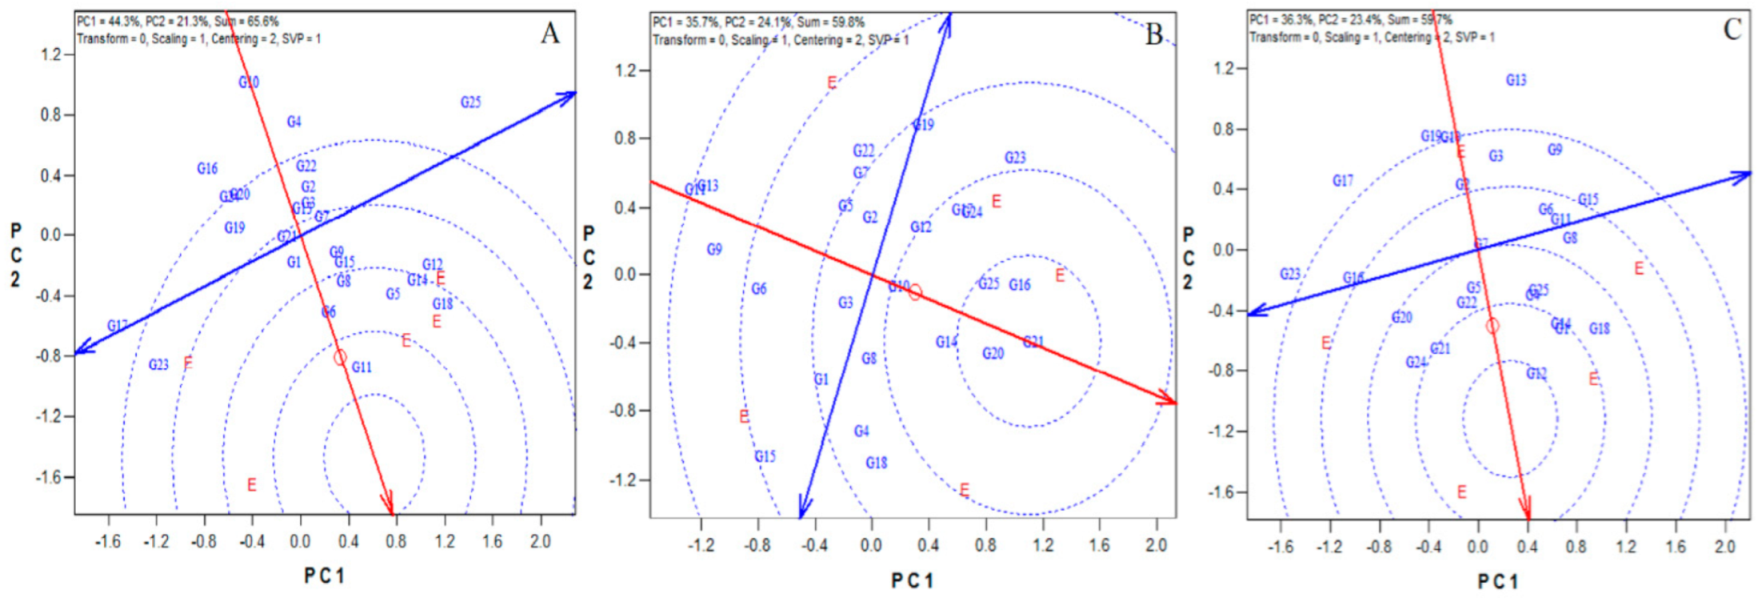
3.2. Genotypes Stability by GGe Biplot
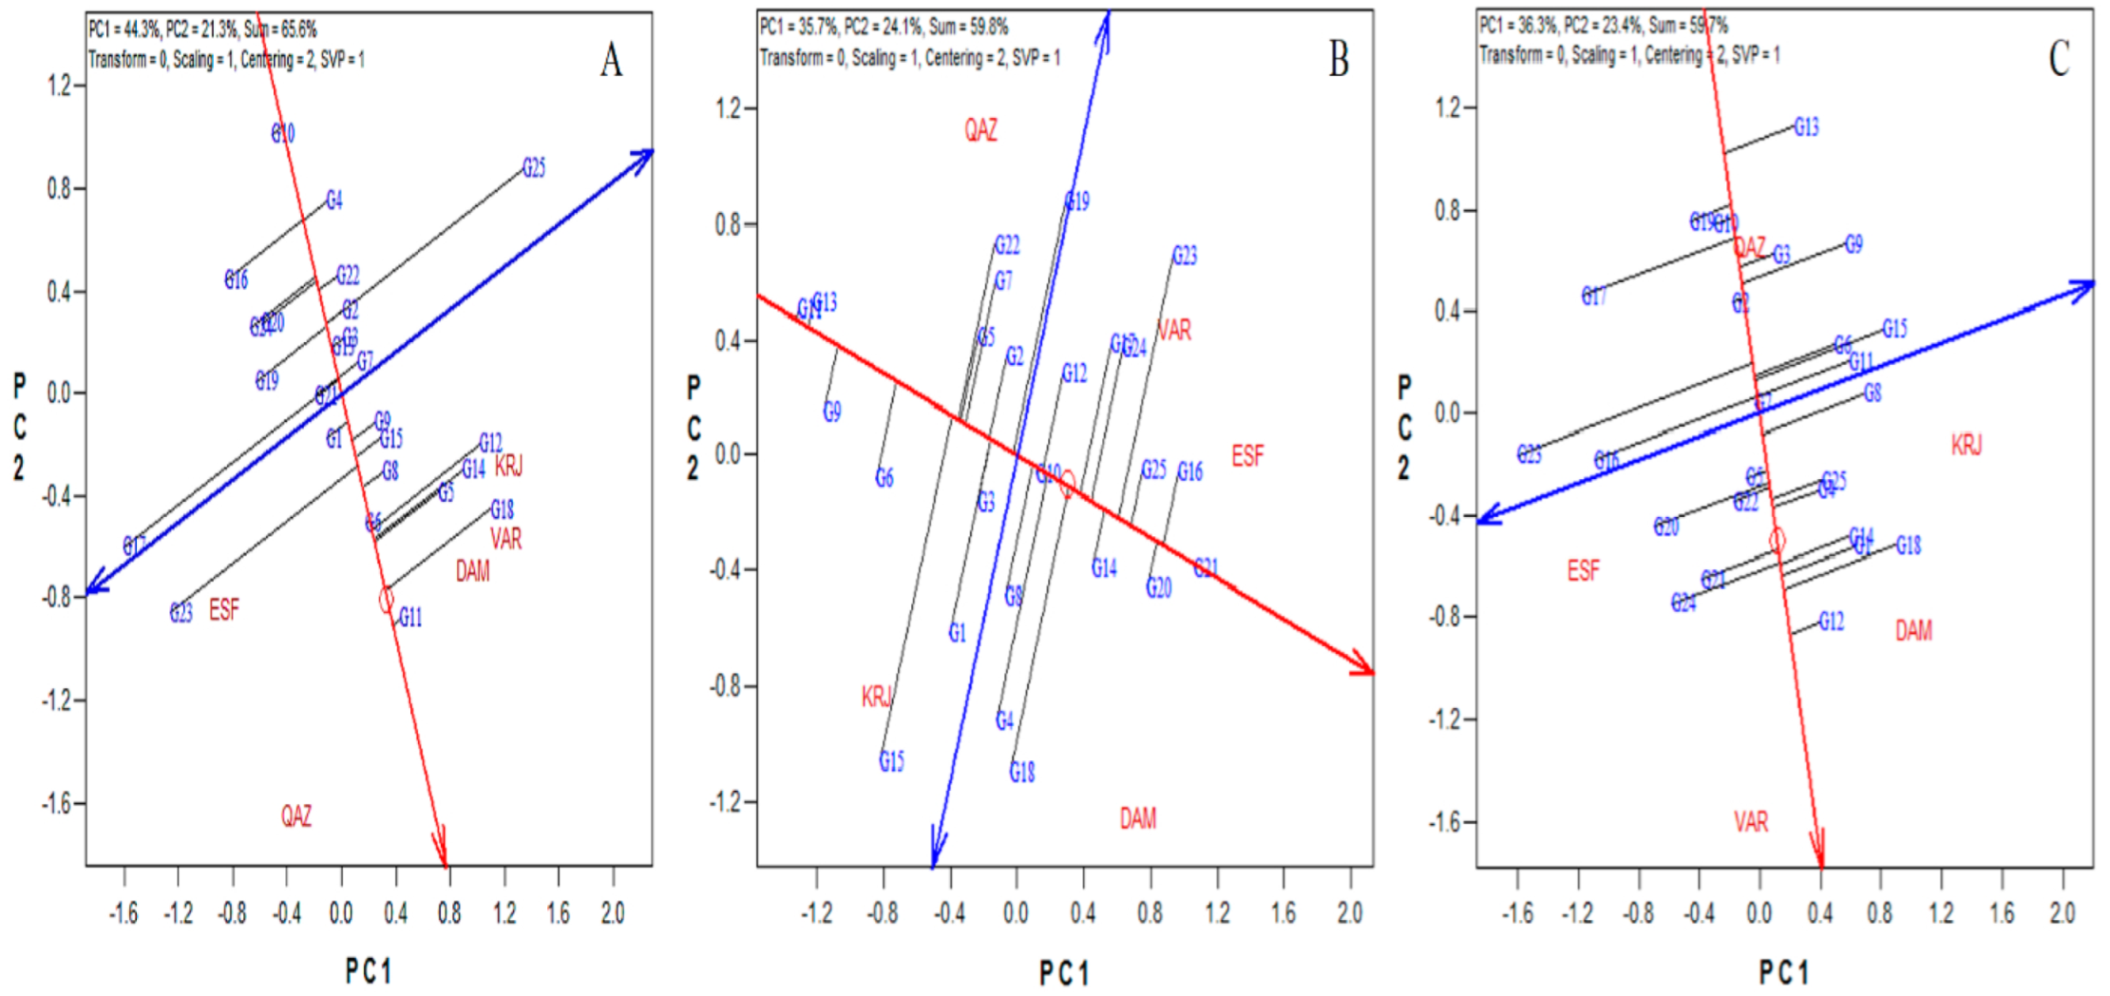
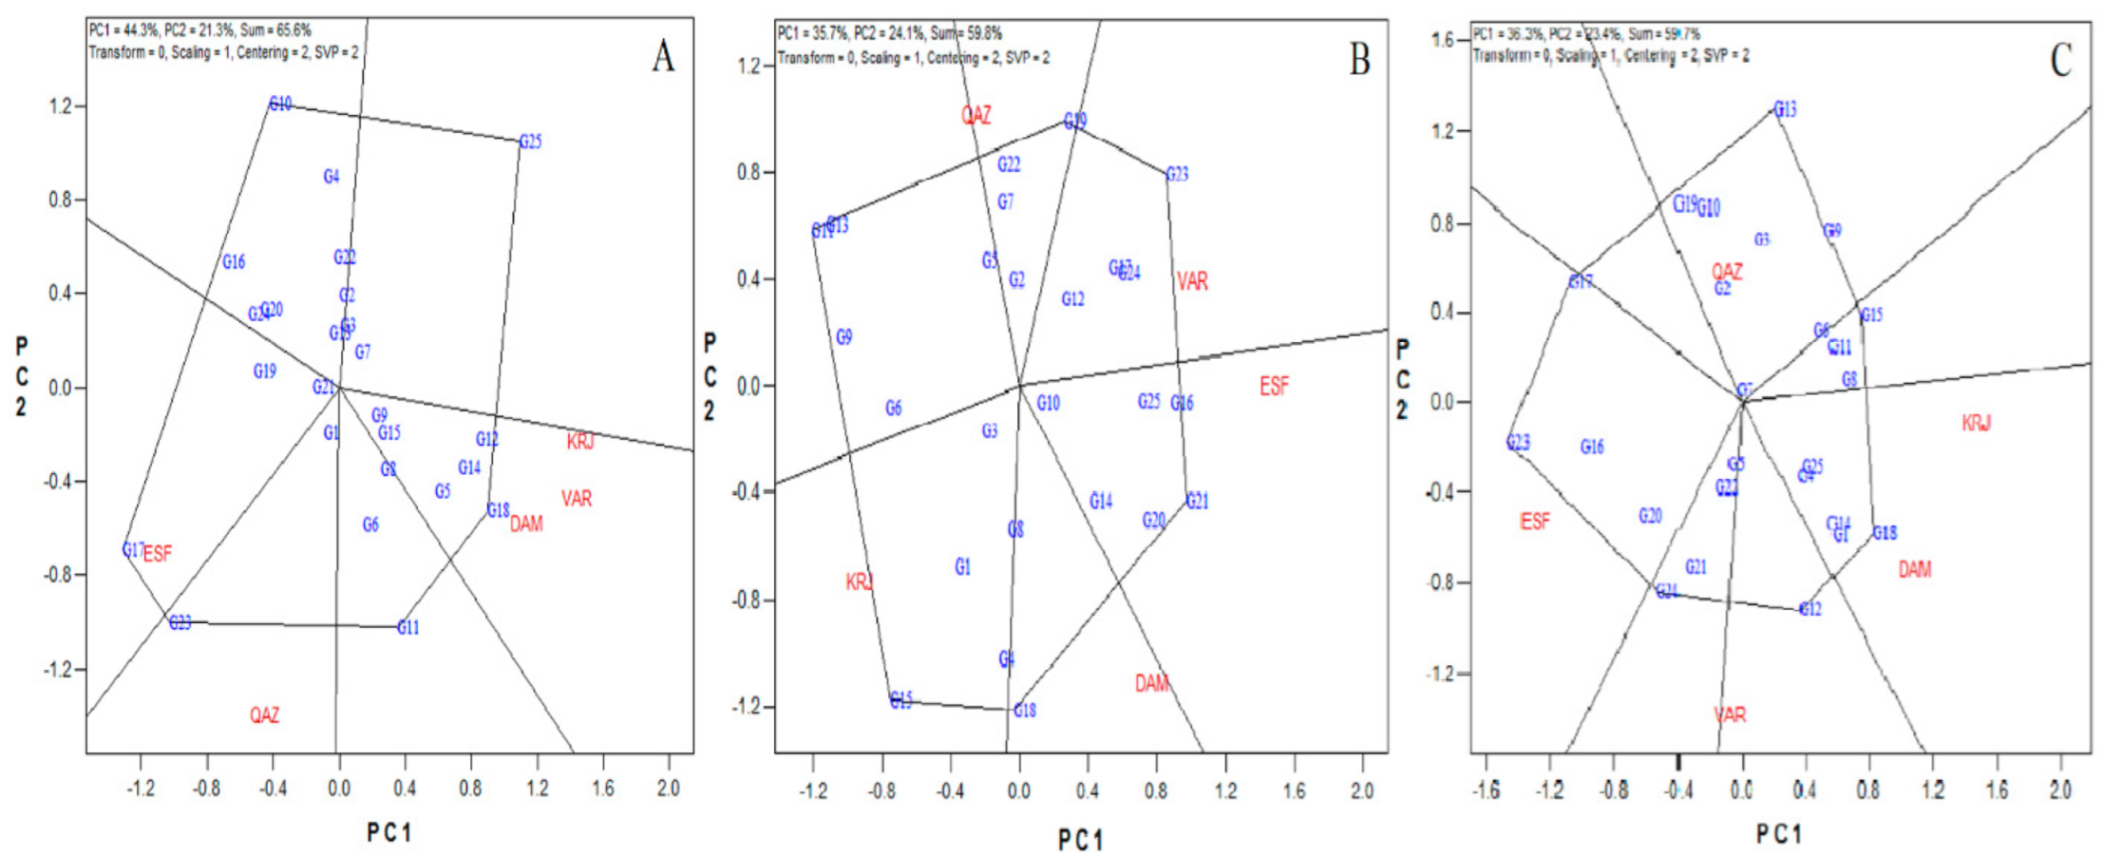
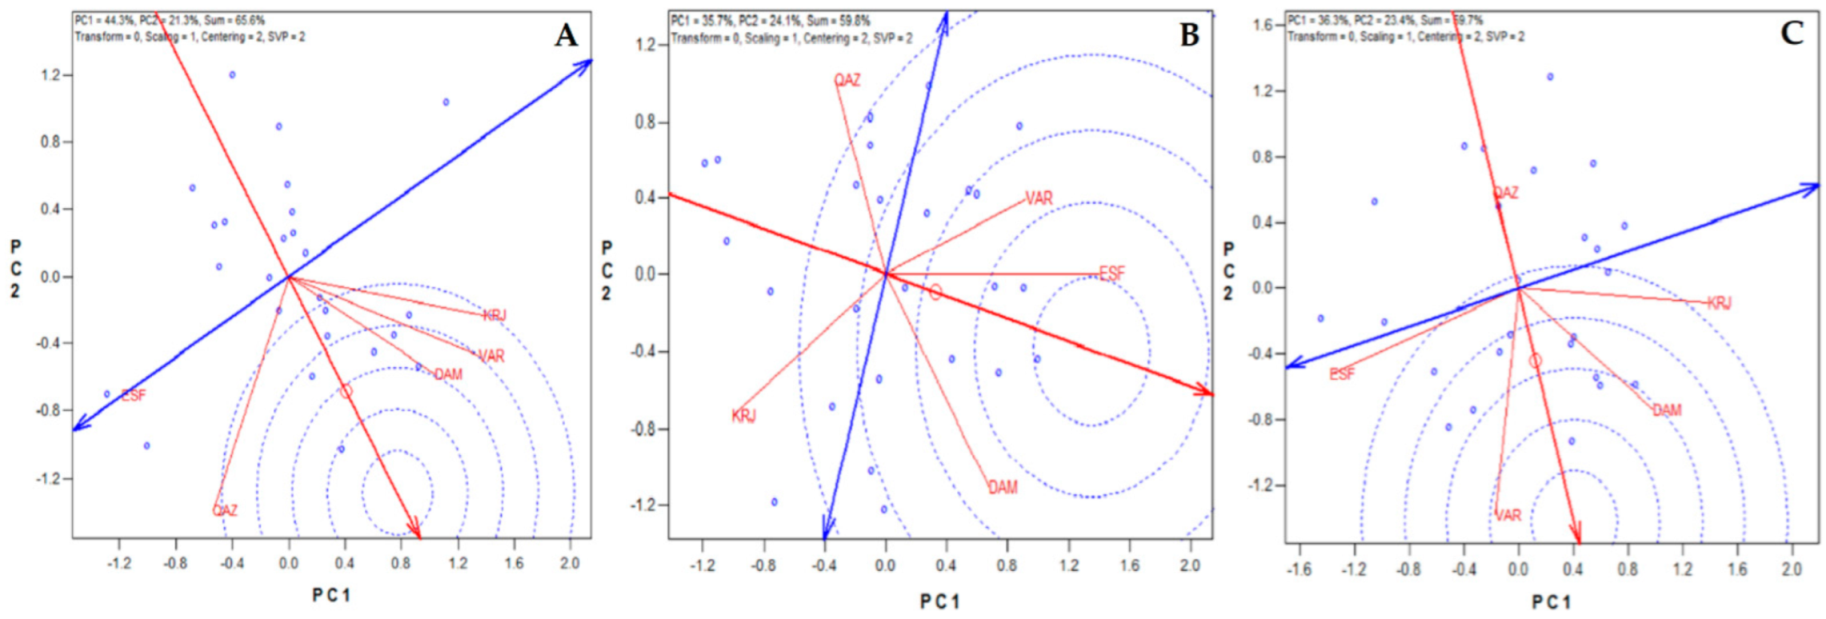
3.3. Adaptability Analysis
3.4. Ideal Genotypes and Environments
3.5. Stability Based on the AMMI Analysis
4. Discussion
5. Conclusions
Author Contributions
Funding
Institutional Review Board Statement
Informed Consent Statement
Data Availability Statement
Conflicts of Interest
References
- Farcas, A.C.; Galanakis, C.M.; Socaciu, C.; Pop, O.L.; Tibulca, D.; Paucean, A.; Socaci, S.A. Food Security during the Pandemic and the Importance of the Bioeconomy in the New Era. Sustainability 2020, 13, 150. [Google Scholar] [CrossRef]
- Mondal, S.; Singh, R.P.; Mason, E.R.; Huerta-Espino, J.; Autrique, E.; Joshi, A.K. Grain yield, adaptation and progress in breeding for early-maturing and heat-tolerant wheat lines in South Asia. Field Crops Res. 2016, 192, 78–85. [Google Scholar] [CrossRef] [PubMed] [Green Version]
- Nuss, E.T.; Tanumihardjo, S.A. Maize: A paramount staple crop in the context of global nutrition. Compr. Rev. Food Sci. Food Saf. 2010, 9, 417–436. [Google Scholar] [CrossRef] [PubMed]
- Hamdan, I.; Smets, S. Climate Change Impact on WANA: Key Researchable Issues and Proposed Measures. In Climate Change and Food Security in West Asia and North Africa; Springer: Dordrecht, The Netherlands, 2013; Volume 1, pp. 147–159. [Google Scholar]
- Illés, Á.; Mousavi, S.M.; Bojtor, C.; Nagy, J. The plant nutrition impact on the quality and quantity parameters of maize hybrids grain yield based on different statistical methods. Cereal Res. Commun. 2020, 48, 565–573. [Google Scholar] [CrossRef]
- Mousavi, S.M.N.; Bojtor, C.; Illés, Á.; Nagy, J. Genotype by Trait Interaction (GT) in Maize Hybrids on Complete Fertilizer. Plants 2021, 10, 2388. [Google Scholar] [CrossRef]
- Trethowan, R.M.; Reynolds, M. Drought resistance: Genetic approaches for improving productivity under stress. In Wheat Production in Stressed Environments; Springer: Dordrecht, The Netherlands, 2007; Volume 1, pp. 289–299. [Google Scholar]
- Mousavi, S.M.N.; Hejazi, P.; Mostafavi, K.; Fotovat, F. Investigation of drought stress on morphological traits in some bread wheat cultivars. Adv. Environ. Biol. 2013, 7, 131–136. [Google Scholar]
- Farshadfar, E.; Sabaghpour, S.H.; Zali, H. Comparison of parametric and non-parametric stability statistics for selecting stable chickpea (Cicer arietinum L.) genotypes under diverse environments. Aust. J. Crop Sci. 2012, 6, 514–524. [Google Scholar]
- Farshadfar, E.; Farshadfar, H. Biplot analysis for detection of heterotic crosses and estimation of additive and dominance components of genetic variation for drought tolerance in bread wheat (Triticum aestivum). Agric. Commun. 2013, 1, 1–7. [Google Scholar]
- Farshadfar, E.; Sutka, J. Biplot analysis of genotype-environment interaction in durum wheat using the AMMI model. Acta Agron. Hung. 2006, 54, 459–467. [Google Scholar] [CrossRef]
- Farshadfar, E.; Sadeghi, M. GGE biplot analysis of genotype× environment interaction in wheat-agropyron disomic addition lines. Agric. Commun. 2014, 2, 1–7. [Google Scholar]
- Farshadfar, E.; Hatami, N. Evaluation of genotype× environment interaction in wheat substitution lines. Agric. Commun. 2015, 3, 1–7. [Google Scholar]
- Finlay, K.W.; Wilkinson, G.N. The analysis of adaptation in a plant-breeding programme. Aust. J. Agric. Res. 1963, 14, 742–754. [Google Scholar] [CrossRef] [Green Version]
- Eberhart, S.T.; Russell, W.A. Stability parameters for comparing varieties 1. Crop Sci. 1966, 6, 36–40. [Google Scholar] [CrossRef] [Green Version]
- Francis, T.R.; Kannenberg, L.W. Yield stability studies in short-season maize. I. A descriptive method for grouping genotypes. Can. J. Plant Sci. 1978, 58, 1029–1034. [Google Scholar] [CrossRef]
- Gauch, H.G., Jr. Statistical analysis of yield trials by AMMI and GGE. Crop Sci. 2006, 46, 1488–1500. [Google Scholar] [CrossRef]
- Yan, W.; Kang, M.S. GGE Biplot Analysis: A Graphical Tool for Breeders, Geneticists, and Agronomists; CRC Press: Boca Raton, FL, USA, 2002. [Google Scholar]
- Yan, W.; Kang, M.S.; Ma, B.; Woods, S.; Cornelius, P.L. GGE biplot vs. AMMI analysis of genotype-by-environment data. Crop Sci. 2007, 47, 643–653. [Google Scholar] [CrossRef]
- Kang, M.S.; Gauch, H.G. Genotype-by-Environment Interaction; CRC Press: Boca Raton, FL, USA, 1996. [Google Scholar]
- Mohammadi, M.; Hosseinpour, T.; Armion, M.; Khanzadeh, H.; Ghojogh, H. Analysis of genotype, environment and genotype× environment interaction in bread wheat genotypes using GGE biplot. Agric. Commun. 2016, 4, 1–8. [Google Scholar]
- Omrani, S.; Naji, A.M.; Esmaeilzadeh Moghaddam, M. Yield stability analysis of promising bread wheat lines in southern warm and dry agro climatic zone of Iran using GGE biplot model. J. Crop Breed. 2017, 9, 157–165. [Google Scholar] [CrossRef] [Green Version]
- Zulkiffal, M.; Ahsan, A.; Javed, A.; Aziz, R.; Muhammad, A.; Saima, G. Appraisal of bread wheat (Triticum aestivum L.) genotypes under normal, drought and heat prone environments for morpho-physiological multiplicity and constancy. Int. J. Agric. Environ. Res. 2018, 4, 1298–1306. [Google Scholar]
- De Vita, P.; Mastrangelo, A.M.; Matteu, L.; Mazzucotelli, E.; Virzi, N.; Palumbo, M.; Cattivelli, L. Genetic improvement effects on yield stability in durum wheat genotypes grown in Italy. Field Crops Res. 2010, 119, 68–77. [Google Scholar] [CrossRef]
- Tekdal, S.; Kendal, E. AMMI model to assess durum wheat genotypes in multi-environment trials. J. Agric. Sci. Technol. 2018, 20, 153–166. [Google Scholar]
- Mousavi, S.M.N.; Illés, Á.; Bojtor, C.; Nagy, J. The impact of different nutritional treatments on maize hybrids morphological traits based on stability statistical methods. Emir. J. Food Agric. 2020, 11, 666–672. [Google Scholar] [CrossRef]
- Shojaei, S.H.; Mostafavi, K.; Bihamta, M.R.; Omrani, A.; Mousavi, S.M.N.; Illés, Á.; Nagy, J. Stability on Maize Hybrids Based on GGE Biplot Graphical Technique. Agronomy 2022, 12, 394. [Google Scholar] [CrossRef]
- Shojaei, S.H.; Mostafavi, K.; Lak, A.; Omrani, A.; Omrani, S.; Mousavi, S.M.N.; Nagy, J. Evaluation of stability in maize hybrids using univariate parametric methods. J. Crop Sci. Biotechnol. 2021, 17, 1–8. [Google Scholar] [CrossRef]
- Islam, M.R.; Anisuzzaman, M.; Khatun, H.; Sharma, N.; Islam, M.Z.; Akter, A.; Biswas, P.S. AMMI analysis of yield performance and stability of rice genotypes across different haor areas. Eco. Friendly Agril. J. 2014, 7, 20–24. [Google Scholar]
- Bhartiya, A.; Aditya, J.P.; Kumari, V.; Kishore, N.; Purwar, J.P.; Agrawal, A.; Kant, L. GGE biplot & ammi analysis of yield stability in multi-environment trial of soybean [Glycine max (L.) Merrill] genotypes under rainfed condition of north western Himalayan hills. J. Anim. Plant Sci. 2017, 27, 227–238. [Google Scholar]
- Alipour, H.; Abdi, H.; Rahimi, Y.; Bihamta, M.R. Dissection of the genetic basis of genotype-by-environment interactions for grain yield and main agronomic traits in Iranian bread wheat landraces and cultivars. Sci. Rep. 2021, 11, 17742. [Google Scholar] [CrossRef]
- Sharma, R.C.; Morgounov, A.I.; Braun, H.J.; Akin, B.; Keser, M.; Bedoshvili, D.; van Ginkel, M. Identifying high yielding stable winter wheat genotypes for irrigated environments in Central and West Asia. Euphytica 2010, 171, 53–64. [Google Scholar] [CrossRef]


| Genotype No. | Genotype | Genotype No. | Genotype | Genotype No. | Genotype |
|---|---|---|---|---|---|
| G1 | ABC Zigmund | G10 | Ralitsa | G19 | Neven |
| G2 | ABC Lombardia | G11 | Faktor | G20 | Tervel |
| G3 | A 38/64 | G12 | Ognyana | G21 | Riana |
| G4 | ABC Kolino | G13 | ABC Alfio | G22 | Vyara |
| G5 | Presyana | G14 | A 27/320 | G23 | Aneta |
| G6 | Bilyana | G15 | Apogej | G24 | Alisa |
| G7 | ABC Navo | G16 | A 18/74 | G25 | Rakhshan (Control) |
| G8 | LG Anapurna | G17 | Pryaspa | ||
| G9 | ABC Klauzius | G18 | A 47/415 |
| Location Code | Location | Longitude | Latitude | Elevation AMSL (m) | Average Rainfall (mm) | Average Annual Min Temp (°F) | Average Annual Max Temp (°F) |
|---|---|---|---|---|---|---|---|
| KRJ | KARAJ | 51.00 | 35.48 | 1321 | 295 | 35 | 83 |
| QAZ | QAZVIN | 49.99 | 36.31 | 2347 | 210 | 33 | 79 |
| VAR | VARAMIN | 51.64 | 35.32 | 918 | 218 | 33 | 101 |
| ESF | ESFAHAN | 51.65 | 32.68 | 1590 | 116.9 | 24 | 98 |
| DAM | DAMAVAND | 52.06 | 35.72 | 2300 | 320 | 21 | 83 |
| Year 1 | Year 2 | Average of 2 Years | |||||
|---|---|---|---|---|---|---|---|
| SOV | DF | SS | MS | SS | MS | SS | MS |
| Block | 2 | 0.0000004 | 0.0000002 ns | 0.000002 | 0.000001 ns | 0.0000008 | 0.0000004 * |
| Environment | 4 | 0.000004 | 0.000001 * | 0.00006 | 0.00001 ** | 0.00001 | 0.000003 ** |
| Genotype | 24 | 0.00001 | 0.0000004 * | 0.00001 | 0.0000006 ** | 0.000006 | 0.0000002 ** |
| G × E | 96 | 0.00004 | 0.0000004 * | 0.00005 | 0.0000006 ** | 0.00002 | 0.0000002 ** |
| IPCA 1 | 27 | 0.00002 | 0.0000008 ** | 0.00002 | 0.0000009 ** | 0.00001 | 0.0000004 ** |
| IPCA 2 | 25 | 0.000008 | 0.0000003 ns | 0.00001 | 0.0000006 ** | 0.000005 | 0.0000002 * |
| IPCA 3 | 23 | 0.000006 | 0.0000002 ns | 0.00001 | 0.0000004 ns | 0.000004 | 0.0000001 ns |
| IPCA 4 | 21 | 0.000003 | 0.0000001 ns | 0.000004 | 0.0000002 ns | 0.0000003 | 0.0000001 ns |
| Error | 248 | 0.0000003 | 0.0000001 | 0.00007 | 0.0000003 | 0.00003 | 0.0000001 |
| CV% | 23.88 | 21.45 | 14.72 | ||||
| First Year | Second Year | Average of 2 Years | ||||||
|---|---|---|---|---|---|---|---|---|
| Environments | Mean | IPCA1 | Mean | IPCA1 | IPCA2 | Mean | IPCA1 | IPCA2 |
| E1 | 2.28 | −0.02 | 2.9 | 0.03 | 0.01 | 2.59 | −0.02 | 0.001 |
| E2 | 2.53 | 0.01 | 2.85 | 0.01 | 0.002 | 2.69 | 0.0001 | −0.02 |
| E3 | 2.38 | −0.01 | 2.82 | −0.03 | 0.03 | 2.6 | 0.005 | 0.02 |
| E4 | 2.48 | 0.04 | 1.8 | −0.02 | −0.02 | 2.14 | 0.03 | −0.004 |
| E5 | 2.56 | −0.009 | 2.36 | 0.007 | −0.01 | 2.46 | −0.009 | −0.003 |
| Genotype | Rank | Means |
|---|---|---|
| G1 | 3 | 2.66 a |
| G2 | 21 | 2.409 abcd |
| G3 | 23 | 2.29 bcd |
| G4 | 22 | 2.405 abcd |
| G5 | 18 | 2.482 abcd |
| G6 | 10 | 2.54 abc |
| G7 | 17 | 2.49 abcd |
| G8 | 20 | 2.422 abcd |
| G9 | 19 | 2.447 abcd |
| G10 | 25 | 2.16 d |
| G11 | 6 | 2.58 abc |
| G12 | 2 | 2.67 a |
| G13 | 24 | 2.23 cd |
| G14 | 1 | 2.71 a |
| G15 | 14 | 2.506 abcd |
| G16 | 9 | 2.56 abc |
| G17 | 15 | 2.502 abcd |
| G18 | 5 | 2.6 ab |
| G19 | 16 | 2.5 abcd |
| G20 | 13 | 2.506 abcd |
| G21 | 11 | 2.53 abc |
| G22 | 7 | 2.577 abc |
| G23 | 12 | 2.52 abc |
| G24 | 4 | 2.61 ab |
| G25 | 8 | 2.572 abc |
| First Year | Second Year | Average 2 Years | ||||||
|---|---|---|---|---|---|---|---|---|
| Genotype | Mean | IPCA1 | Mean | IPCA1 | IPCA2 | Mean | IPCA1 | IPCA2 |
| G1 | 2.67 | 0.007 | 2.66 | 0.006 | 0.013 | 2.66 | −0.005 | −0.0006 |
| G2 | 2.39 | −0.0007 | 2.42 | −0.0005 | −0.003 | 2.4 | 0.001 | −0.004 |
| G3 | 2.31 | −0.0006 | 2.27 | 0.003 | −0.012 | 2.29 | 0.0006 | −0.007 |
| G4 | 2.25 | 0.0003 | 2.55 | 0.003 | 0.0008 | 2.4 | −0.003 | 0.007 |
| G5 | 2.71 | −0.004 | 2.25 | 0.0006 | −0.0027 | 2.48 | 0.002 | 0.004 |
| G6 | 2.64 | 0.001 | 2.44 | 0.015 | −0.0011 | 2.54 | −0.006 | −0.008 |
| G7 | 2.39 | −0.003 | 2.59 | −0.002 | 0.011 | 2.49 | −0.001 | 0.005 |
| G8 | 2.23 | −0.017 | 2.61 | 0.00004 | 0.005 | 2.42 | −0.014 | 0.003 |
| G9 | 2.47 | −0.004 | 2.41 | 0.014 | 0.008 | 2.44 | −0.011 | −0.002 |
| G10 | 2.1 | 0.002 | 2.21 | 0.001 | −0.015 | 2.16 | 0.003 | −0.009 |
| G11 | 2.76 | 0.003 | 2.4 | 0.013 | −0.016 | 2.58 | −0.007 | −0.001 |
| G12 | 2.73 | −0.01 | 2.62 | −0.009 | 0.009 | 2.67 | −0.006 | 0.012 |
| G13 | 2.35 | −0.001 | 2.12 | 0.017 | 0.002 | 2.23 | −0.007 | −0.008 |
| G14 | 2.59 | −0.01 | 2.84 | 0.0008 | −0.009 | 2.71 | −0.004 | −0.00006 |
| G15 | 2.56 | −0.002 | 2.44 | 0.023 | −0.009 | 2.5 | −0.01 | −0.006 |
| G16 | 2.23 | 0.008 | 2.89 | −0.013 | −0.007 | 2.56 | 0.013 | 0.002 |
| G17 | 2.42 | 0.02 | 2.58 | −0.009 | −0.004 | 2.5 | 0.015 | −0.01 |
| G18 | 2.69 | −0.01 | 2.5 | 0.007 | −0.007 | 2.6 | −0.009 | 0.005 |
| G19 | 2.3 | 0.005 | 2.69 | −0.003 | −0.003 | 2.5 | 0.004 | −0.014 |
| G20 | 2.35 | 0.007 | 2.65 | −0.016 | 0.005 | 2.5 | 0.008 | 0.013 |
| G21 | 2.48 | 0.004 | 2.58 | −0.01 | −0.005 | 2.53 | 0.008 | 0.004 |
| G22 | 2.38 | 0.001 | 2.76 | −0.0004 | 0.012 | 2.57 | 0.002 | 0.005 |
| G23 | 2.52 | 0.02 | 2.51 | −0.019 | 0.001 | 2.52 | 0.022 | −0.0001 |
| G24 | 2.33 | 0.009 | 2.9 | −0.013 | 0.015 | 2.61 | 0.009 | 0.010 |
| G25 | 2.31 | −0.02 | 2.83 | −0.004 | −0.019 | 2.57 | −0.003 | 0.0008 |
Publisher’s Note: MDPI stays neutral with regard to jurisdictional claims in published maps and institutional affiliations. |
© 2022 by the authors. Licensee MDPI, Basel, Switzerland. This article is an open access article distributed under the terms and conditions of the Creative Commons Attribution (CC BY) license (https://creativecommons.org/licenses/by/4.0/).
Share and Cite
Omrani, A.; Omrani, S.; Khodarahmi, M.; Shojaei, S.H.; Illés, Á.; Bojtor, C.; Mousavi, S.M.N.; Nagy, J. Evaluation of Grain Yield Stability in Some Selected Wheat Genotypes Using AMMI and GGE Biplot Methods. Agronomy 2022, 12, 1130. https://doi.org/10.3390/agronomy12051130
Omrani A, Omrani S, Khodarahmi M, Shojaei SH, Illés Á, Bojtor C, Mousavi SMN, Nagy J. Evaluation of Grain Yield Stability in Some Selected Wheat Genotypes Using AMMI and GGE Biplot Methods. Agronomy. 2022; 12(5):1130. https://doi.org/10.3390/agronomy12051130
Chicago/Turabian StyleOmrani, Ali, Saeed Omrani, Manoochehr Khodarahmi, Seyed Habib Shojaei, Árpád Illés, Csaba Bojtor, Seyed Mohammad Nasir Mousavi, and János Nagy. 2022. "Evaluation of Grain Yield Stability in Some Selected Wheat Genotypes Using AMMI and GGE Biplot Methods" Agronomy 12, no. 5: 1130. https://doi.org/10.3390/agronomy12051130
APA StyleOmrani, A., Omrani, S., Khodarahmi, M., Shojaei, S. H., Illés, Á., Bojtor, C., Mousavi, S. M. N., & Nagy, J. (2022). Evaluation of Grain Yield Stability in Some Selected Wheat Genotypes Using AMMI and GGE Biplot Methods. Agronomy, 12(5), 1130. https://doi.org/10.3390/agronomy12051130