Article

The Impact of Salinity Stress on Antioxidant Response and Bioactive Compounds of Nepeta cataria L.

by
Constantin Lungoci
1,*,
Iuliana Motrescu
2,3,*,
Feodor Filipov
4,
Carmenica Doina Jitareanu
1,
Gabriel-Ciprian Teliban
5,
Carmen Simona Ghitau
1,
Ioan Puiu
1 and
Teodor Robu
1
1
Department of Plant Science, Iasi University of Life Sciences, 3 Sadoveanu Alley, 700490 Iasi, Romania
2
Department of Exact Sciences, Iasi University of Life Sciences, 3 Sadoveanu Alley, 700490 Iasi, Romania
3
Research Institute for Agriculture and Environment, Iasi University of Life Sciences, 14 Sadoveanu Alley, 700490 Iasi, Romania
4
Department of Pedotechnics, Iasi University of Life Sciences, 3 Sadoveanu Alley, 700490 Iasi, Romania
5
Department of Horticultural Technologies, Iasi University of Life Sciences, 3 Sadoveanu Alley, 700490 Iasi, Romania
*
Authors to whom correspondence should be addressed.
Agronomy 2022, 12(3), 562; https://doi.org/10.3390/agronomy12030562
Submission received: 22 January 2022 / Revised: 21 February 2022 / Accepted: 22 February 2022 / Published: 24 February 2022

Abstract

:
In this study, the ability of Nepeta cataria L. to grow and synthesize bioactive compounds on soil treated with different salt concentrations was tested to evaluate the opportunity of cultivating it in soils affected by salinization. N. cataria L. was grown in soil containing specific amounts of NaCl, Na2SO4, and their mixture. After harvesting, the plants were analyzed from the morphological and physiological point of view. Salinity stress inhibited the growth, with the highest decrease of the plant yield up to about 70% in the case of salt mixture, and smaller values for the separate salt treatments. In the same time, as a defense mechanism, there was an increase of granular trichomes’ density, as observed with the scanning electron microscope. For mild concentrations of salt, the amount of chlorophyll pigments was enhanced, while for stronger salinity stress, it decreased. The opposite behavior was evidenced for the polyphenol content, as antioxidant activity was used as a protective mechanism against reactive oxygen species produced under salinity stress. The antioxidant activity was considerably higher for separate NaCl and Na2SO4 treatments than for the salt mixture variants. The results showed that the species Nepeta cataria L. reacts well to high salinity levels, with an increased content of bioactive compounds and antioxidant activity even for the highest studied salinity conditions.

1. Introduction

Population growth rate and climate change are the main causes threatening the global food security [1,2]. The lack of recent rainfall or its uneven distribution have a direct impact on crop yields. To meet this shortcoming, mankind has been resorting to artificial methods, especially through irrigation. In addition to the many advantages, irrigation has several drawbacks, such as soil compaction, leaching, and erosion, but the most important is its salinization. History records that, among the causes that led to the failure of the great civilizations is the salinization of the lands [3]. Salinization due to irrigation or evapotranspiration affects large areas of the globe—about 30% of the arable land spread over more than 100 countries, and it is constantly extending [4].
The effects of soil salinity on plants are extensively studied in order to understand the mechanisms and changes induced in plants and then obtain cultures that are tolerant to salinity. However, the focus is mainly on the species used as foods, both agricultural corps and vegetables, and there is less interest for other benefic species, such as aromatic plants. The latter have many uses owing to their antioxidant and antimicrobial activity and medicinal properties [5,6,7,8]. Salt stress induces numerous changes in the plants, both morphological and biochemical, with many mechanisms being already identified as adaptations. The effects on the plants are due to osmosis and toxicity of microelements, indirectly due to soil structural problems; salinity might inhibit the growth by affecting the photosynthesis, thus disturbing the mineral uptake and availability. At the cell level, it interferes with passive transport through the cell membrane by changing the electrochemical gradient; decreasing the cellular water content; and influencing the ionic signaling pathways, ion cell performance, and the regulation of the enzymatic activity. Furthermore, the salinity of the soil induces oxidative stress in plants, leading to the production of reactive oxygen species (ROS) that further alter the metabolic activity of the cells. ROS are not only toxic but also interfere with the cell signaling; regulating processes, such as growth; stress response of the cells; and cell death. The tolerance to salinity is complex and genetically controlled, so it may differ from one species to another. The main mechanisms aim either to limit the entrance of salt in the plant or the concentration of salt in the cytoplasm [9,10,11,12,13].
The genus Nepeta sp. belongs to the Lamiaceae family. The center of origin of the genus is the western region of Asia. It includes up to 300 species, according to Formisano [14]. In our country, the genus Nepeta is represented by four species: two common species, (N. cataria L. (Sect. Nepeta) and N. nuda L. ssp. Nuda (Sect. Orthonepeta)); and two rare and major-risk species (N. ucranica L. ssp. ucranica and N. parviflora M. Bieb. (Sect. Oxynepeta)). Nepeta cataria L., commonly known as catnip, is popular in the pet-toy industry, due to its effects on felines induced by the nepetalactones compounds. Besides this common use, Nepeta essential oil has multiple benefits in the treatment of fever, insomnia, and inflammation; it has sedative effect, antimicrobial, and antioxidant properties; and it can be used as a bioherbicide, insect repellant, preventive method for vector-borne diseases, growth inhibition and apoptosis of some cancer cells, and so on [15,16,17,18,19,20,21,22,23,24,25,26,27,28,29,30]. Due to such properties, the essential oil demands have increased in the past years in food, pharmaceutical, and cosmetic industry, making them valuable products. In the case of Nepeta cataria L., the main bioactive components and their uses are resumed in Figure 1.
To the best of our knowledge, there are very few reports regarding the impact of salinity on Nepeta sp. Mohammadi et al. found that biometric parameters changed, the concentrations of chlorophyll pigments decreased, and electrolyte leaking was detected in the case of plants grown in soil treated with increasing concentrations of NaCl. They reported growth inhibitory effects, such as decreased plant height and dry weight; decreased shoot and root length; and reduced number of leaves. On the other hand, a positive effect was found: the essential oil content increased in saline conditions [31]. Similar results regarding the reduced length of roots and shoots and the decrease of fresh weight under salinity stress were also reported for Nepeta persica [32]. Mojarab et al. concluded that the use of salicylic acid can improve germination of Nepeta nuda L., which is highly affected by salinity stress [33].
In the abovementioned framework, our focus was to study the effects of salts (NaCl and Na2SO4) on some biochemical and physiological parameters of Nepeta cataria L. in order to establish the opportunity to cultivate this plant on soils affected by salinization. We focused on some of the parameters that could influence the bio-activity of Nepeta, such as polyphenols, flavonoids, chlorophyll pigments, and antioxidant activity.

2. Materials and Methods

2.1. Experimental Design

The experiment was set up with seedlings of Nepeta cataria L. in Mitscherlich pots with a capacity of 10 dm3. The experiment had 10 variants with 4 repetitions, as presented in Table 1. The salt (both Na2SO4 and NaCl, separately or in mixture, as indicated in Table 1) was mixed with the soil prior to the start of the experiment. A quantity of 7 kg of soil was placed in each vessel where the seedlings were planted. The plants were harvested after 86 days in 2020 and 116 in 2021, respectively, during full bloom, in the month of August. For all the variants, the yield was evaluated by weighting each repetition of each variant.

2.2. Climate Conditions

There were major fluctuations in the rainfall in 2020; for example, in April, the quantity of precipitations was only 4 mm, while in August, it was 8.2 mm. The year 2021 was mostly characterized by a rainfall regime higher than the multiannual average; only in September was the amount of precipitation lower by 34.6 mm. During the experiment, the humidity was kept constant at the level of field capacity by watering as many times as needed. The water collected in the tray of the vessel was reused to avoid salt losses.
The temperature differences in 2020 compared to the multiannual average were larger, especially in April, +4.6 °C, and September, +3 °C. The values were close to the multiannual average in 2021, with the differences being minor. The data are shown in Table 2.

2.3. Soil Characterization

The soil used for the experiments was from the Am (molic) horizon of Chernozems. The soil was slight alkaline, with a pH value of 7.9, as determined in water suspension. Table 3 shows the values for some of the macro- and microelements in the soil used for the experiments.

2.4. Morphological Analysis

For the micro-imaging of the samples, environmental scanning electron microscopy (ESEM) was used (Quanta 450, FEI, Thermo Fisher Scientific, Hilsboro, OR, USA). This electron microscope has the environmental working mode that allows for the analysis of biological samples without any sophisticated preparation, such as covering with a metallic layer. Pieces of the leaves were glued to the aluminum stubs through carbon double-sided tape, with the lower epidermis exposed. The measurements were performed at 70 Pa working pressure in low vacuum mode, using 15 kV accelerated electron beam at 2.5 spot size and 10 mm working distance.

2.5. Physiological Analysis

The stomatal conductance was determined by using the LCi-SD Ultra Compact Photosynthesis System (ADC BioScientific, Hoddesdon, UK), which analyzes the concentration of carbon dioxide and water vapor at the leaf surface relative to the atmospheric level, using an infrared (IR) detector. The measurements were performed by placing a closed chamber of known size on the surface of the leaf tissue, the concentration of CO2 inside this enclosure being compared with the reference value of the gases in the atmosphere. The results of stomatal conductance are expressed in µmols CO2 m2s−1 [34].

2.6. Biochemical Analyses

The quantitative determination of chlorophyll pigments—chlorophyll a, chlorophyll b, carotenoids—was performed from 0.5 g of fresh leaves samples, using 80% acetone as solvent. The absorbance measured with a UV/Vis spectrophotometer at 470, 646.8, and 663.2 nm ( A 470 , A 646.8 , and A 663.2 , respectively) was used to calculate the concentrations of chlorophyll pigments in µg/mL, based on Lichtenthaler’s equations [35,36]:
c a = 12.25 · A 663.2 2.79 · A 646.8
c b = 21.50 · A 646.8 5.10 · A 663.2
c a + b = 7.15 · A 663.2 + 18.71 · A 646.8
c x + c = 1000 · A 470 1.82 · c a 85.02 · c b 198
For the determination of flavonoids, polyphenols, and antioxidant activity, 0.5 g/fresh sample was incubated for 24 h with 95 mL of ethyl alcohol (98%). The filtered product was also used for other analyses. The readings were taken on a UV/Vis spectrophotometer, DLAB PS-V1100. The total phenol content was determined as follows: 0.1 mL of leaf extract was mixed with Folin–Ciocâlteu reagent (Merck, Kenilworth, IL, USA), and then 7.5% NaCO3 was added. After 90 min of incubation, the samples were read on the spectrophotometer at 760 nm. The results were interpreted according to the calibration curve as gallic acid equivalents per gram of dry mass [37,38].
The total flavonoid content of the extract was determined by using 5% NaNO2 and 10% AlCl3 with the absorbances measured at 510 nm. The results were interpreted according to the calibration curve obtained for different quercetin concentrations and expressed in quercetin equivalents per gram of dry matter [39,40].
To evaluate the antioxidant activity, 0.1 mL of plant extract was mixed with 2.9 mL of 60 μM DPPH (2,2-diphenyl-1-picrylhydrazyl) and incubated for 180 min for a complete reaction. The absorbance was read at 515 nm [41,42]. The data processing was performed according to the following formula:
DPPHsc % = ( Abs   control ) t = x   min ( Abs   sample ) t = x   min ( Abs   control ) t = x   min × 100
where Abs control represents the absorption of the DPPH solution without the extract, and Abs sample is the absorbance of DPPH mixed with the extract.

2.7. Statistical Analysis

To assess statistically significant differences between the treatments, the means were compared by unidirectional analysis of variance (ANOVA). When the results were statistically significant, the Tukey multiple comparison test was used. The main difference was set to be significant at p < 0.05. The software used for statistical analysis was IBM SPSS v14. All the results are presented as averages with standard deviations. Inferential statistics (Pearson correlation) was also employed to find correlations between the studied parameters.

3. Results and Discussion

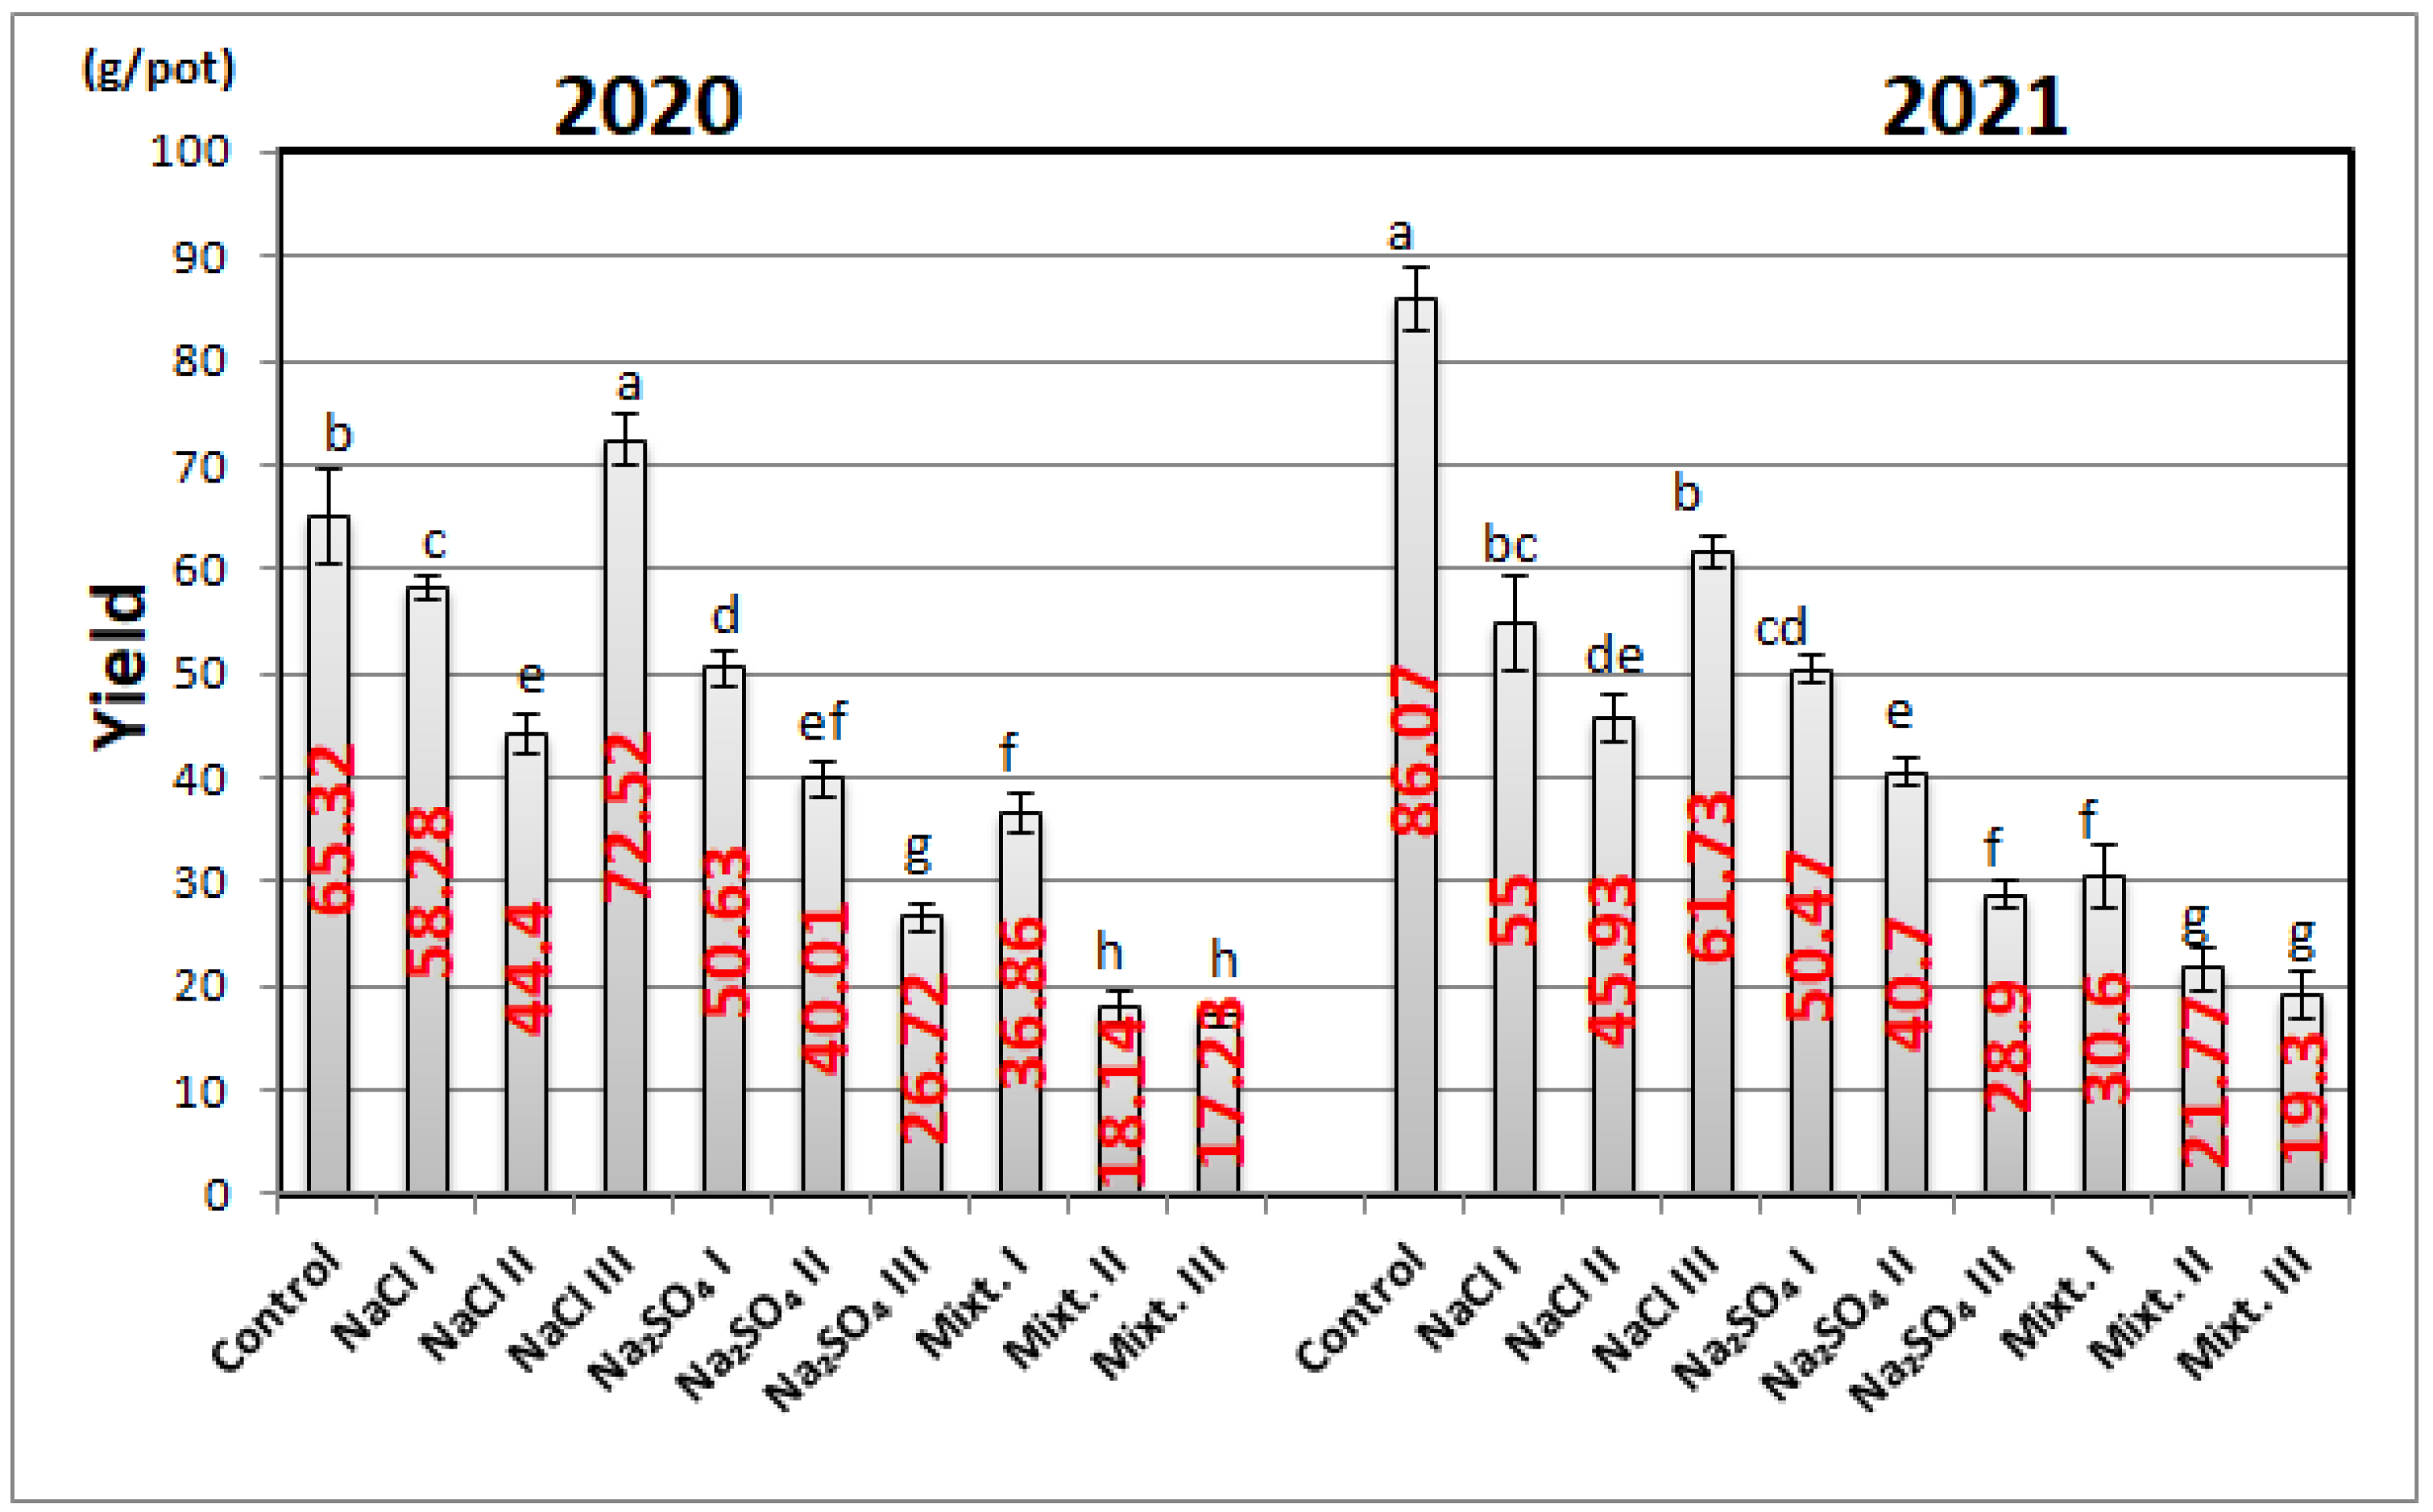
3.1. Yield of Nepeta Cultures

The average yield per vegetation pot is presented in Figure 2. Except for the control variant, we found that the NaCl III variant had the highest production for both studied years. The weight of the plants decreased with increasing the soil salinity for both Na2SO4 variants and mixture salt variants, with a slightly different behavior for NaCl, for which the weight did not indicate a linear change with the salt content of the soils. Overall, with a small exception, salinity has a negative impact on the yield, decreasing it with up to about 70% in the case of salt mixture. The effects of Na2SO4 salinity are higher than in the case of NaCl, with about 59% in the first year and 66% in the second year, compared to 32% and 46% for the latter conditions, respectively. A similar response behavior to salinity stress was also reported in the case of sage (Salvia officinalis L.), with stronger effects for Na2SO4 than NaCl [42]. The same report also shows a non-linear trend of the yield as function of the salt concentration in the case of NaCl, suggesting that the two studied salts induce slightly different responses to salinity stress in some plants. A decrease of the yield by up to 40% was also reported for both Thymus vulgaris L. and Thymus daenensis Celak under NaCl salinity stress [43].

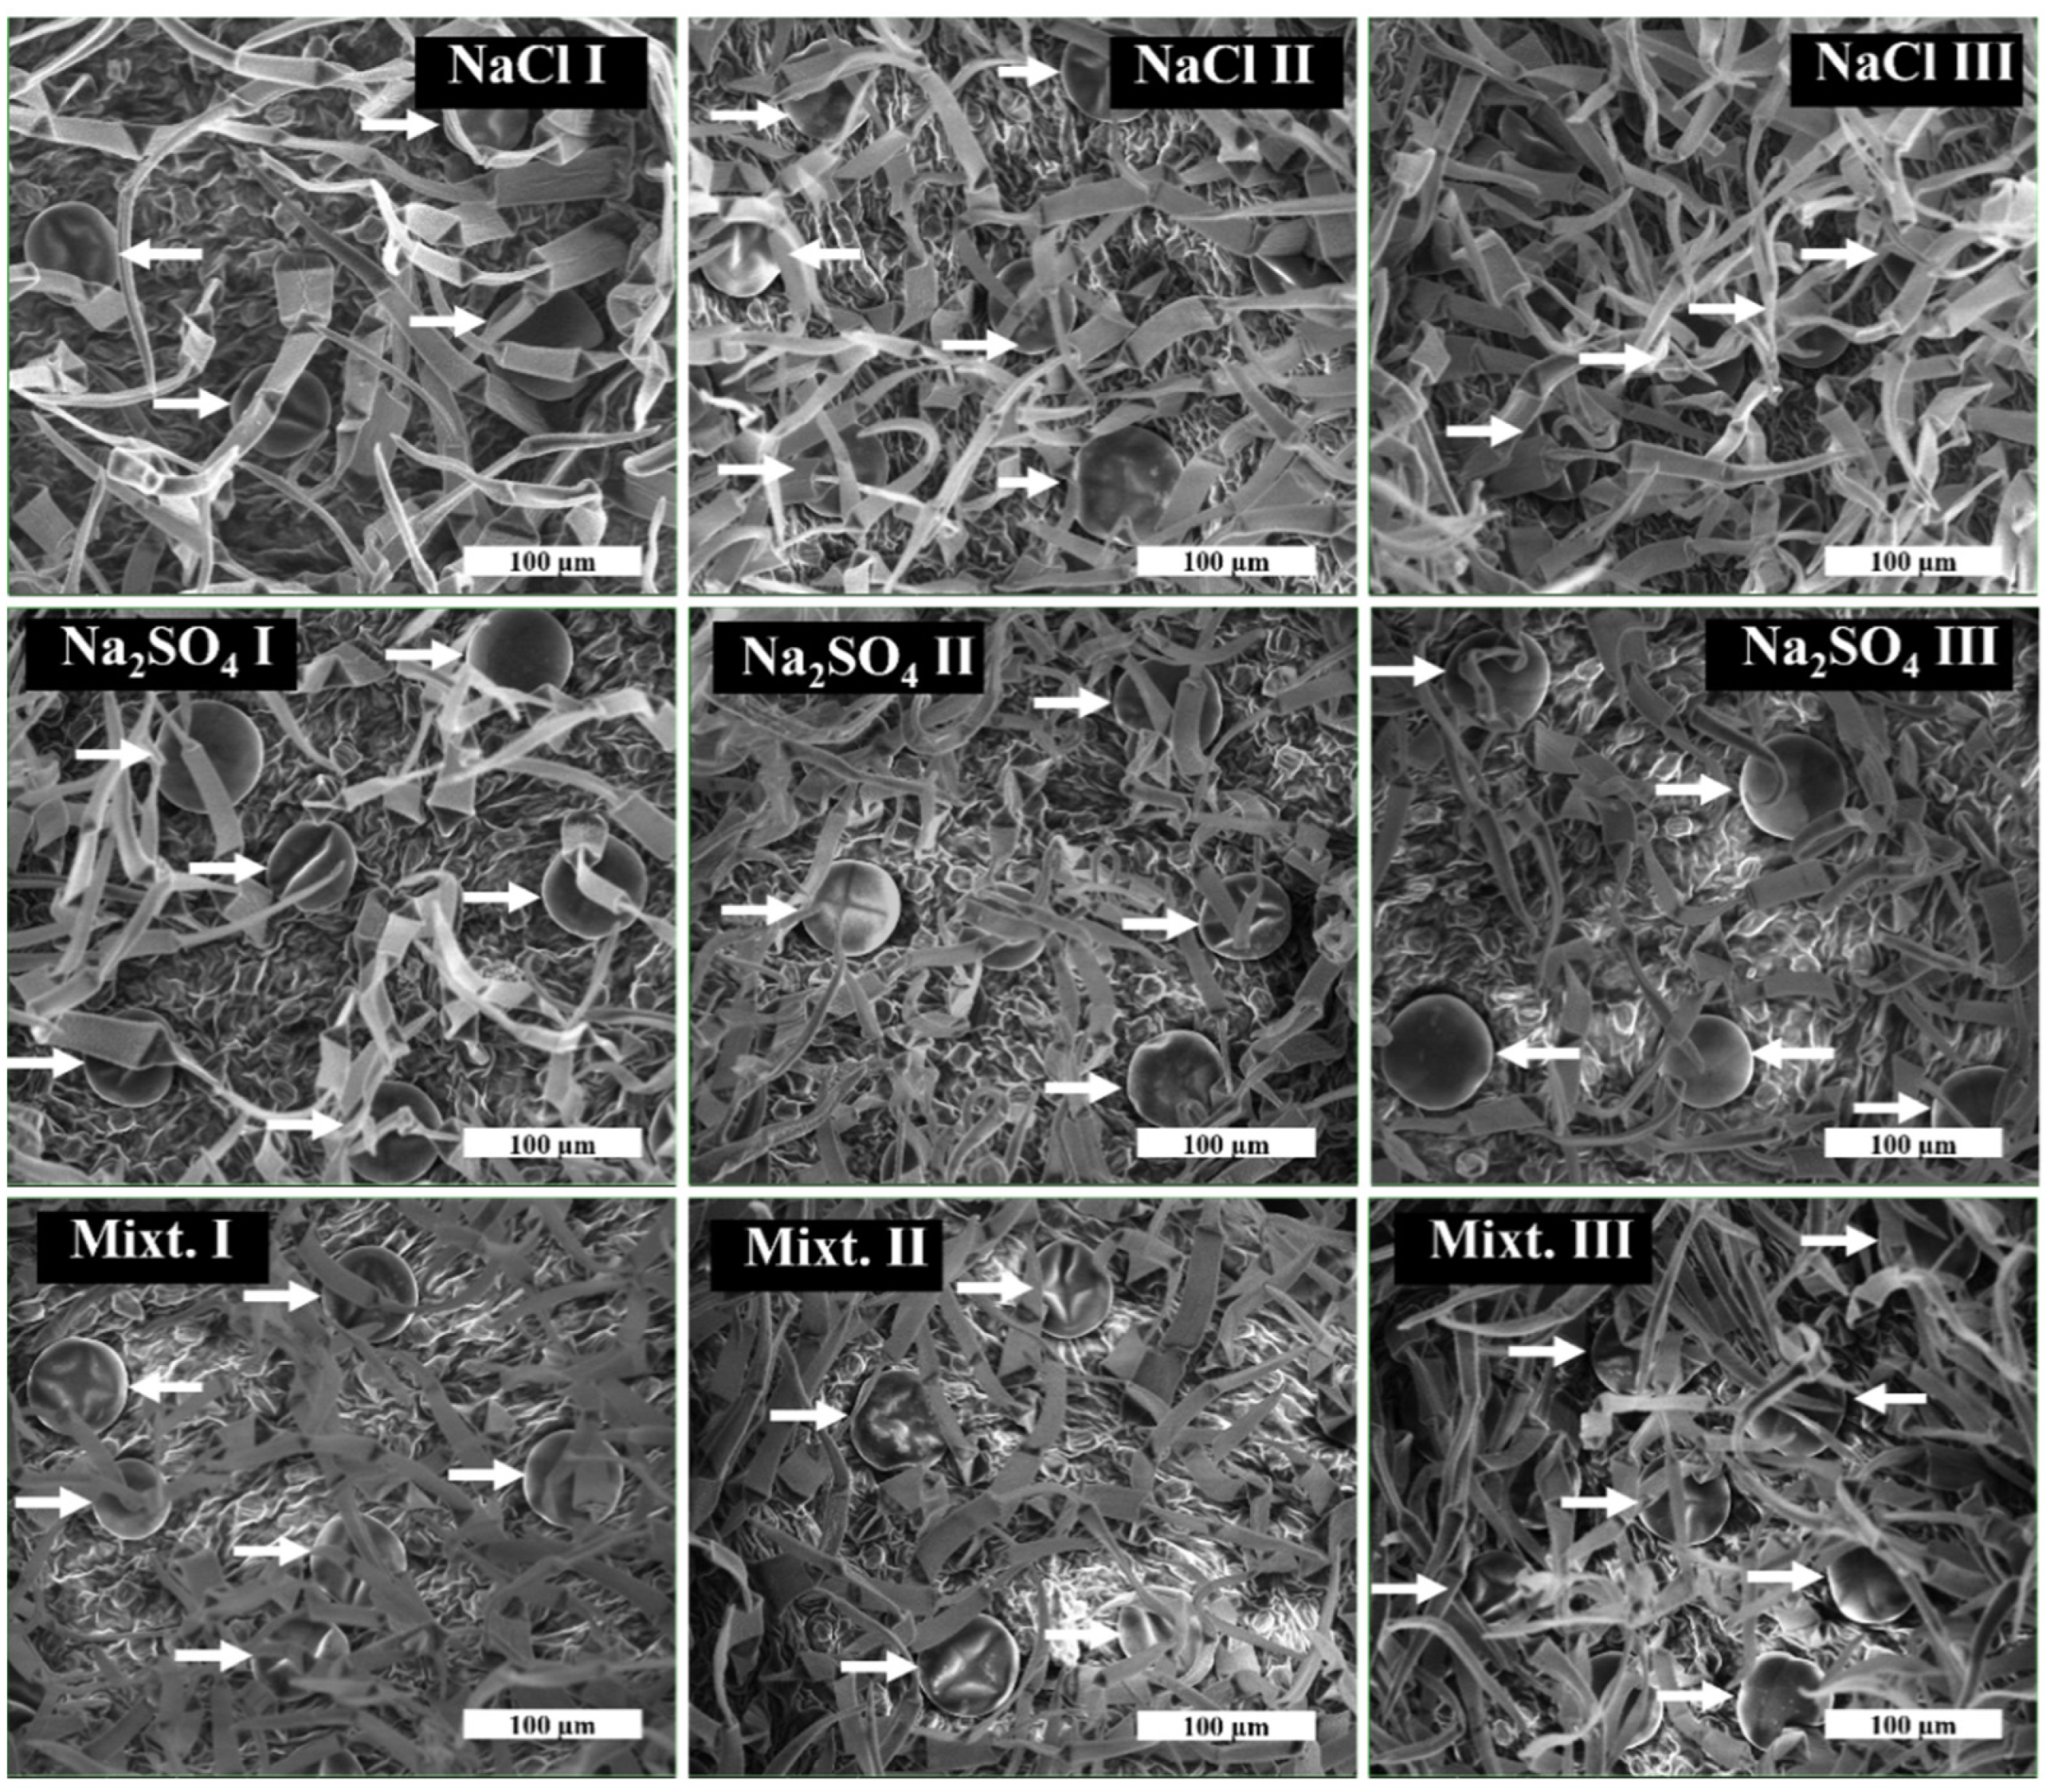
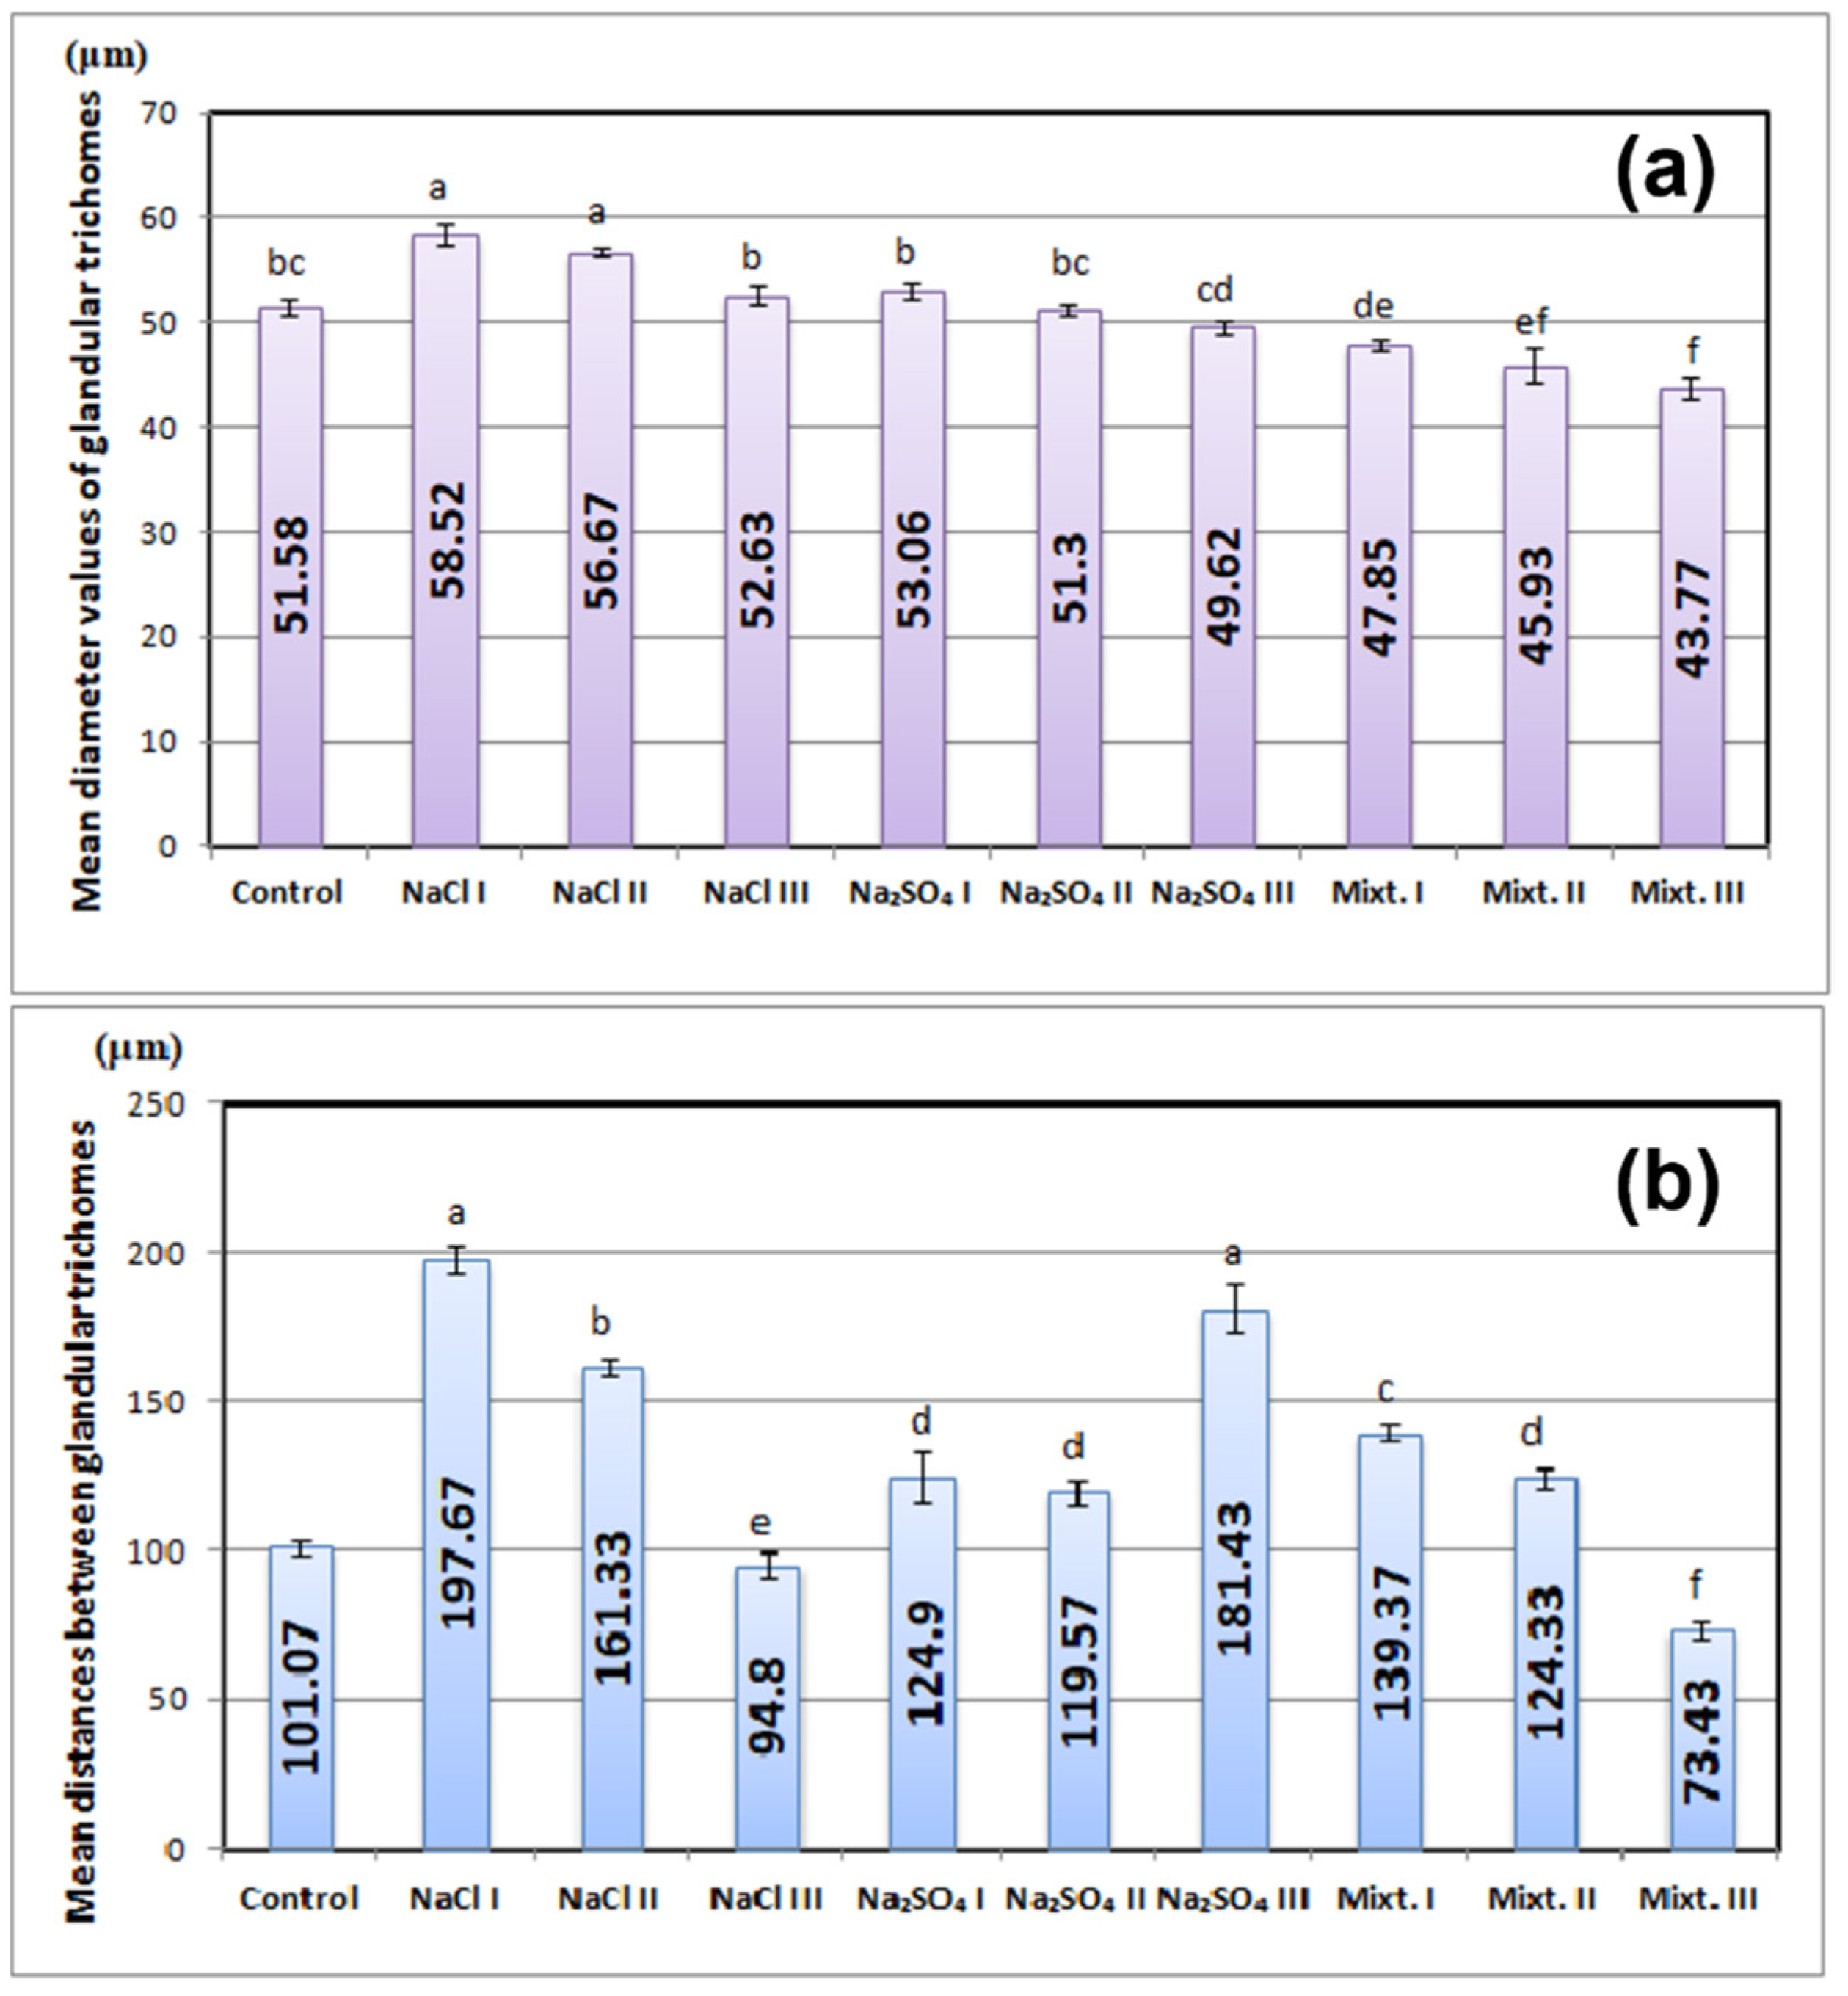
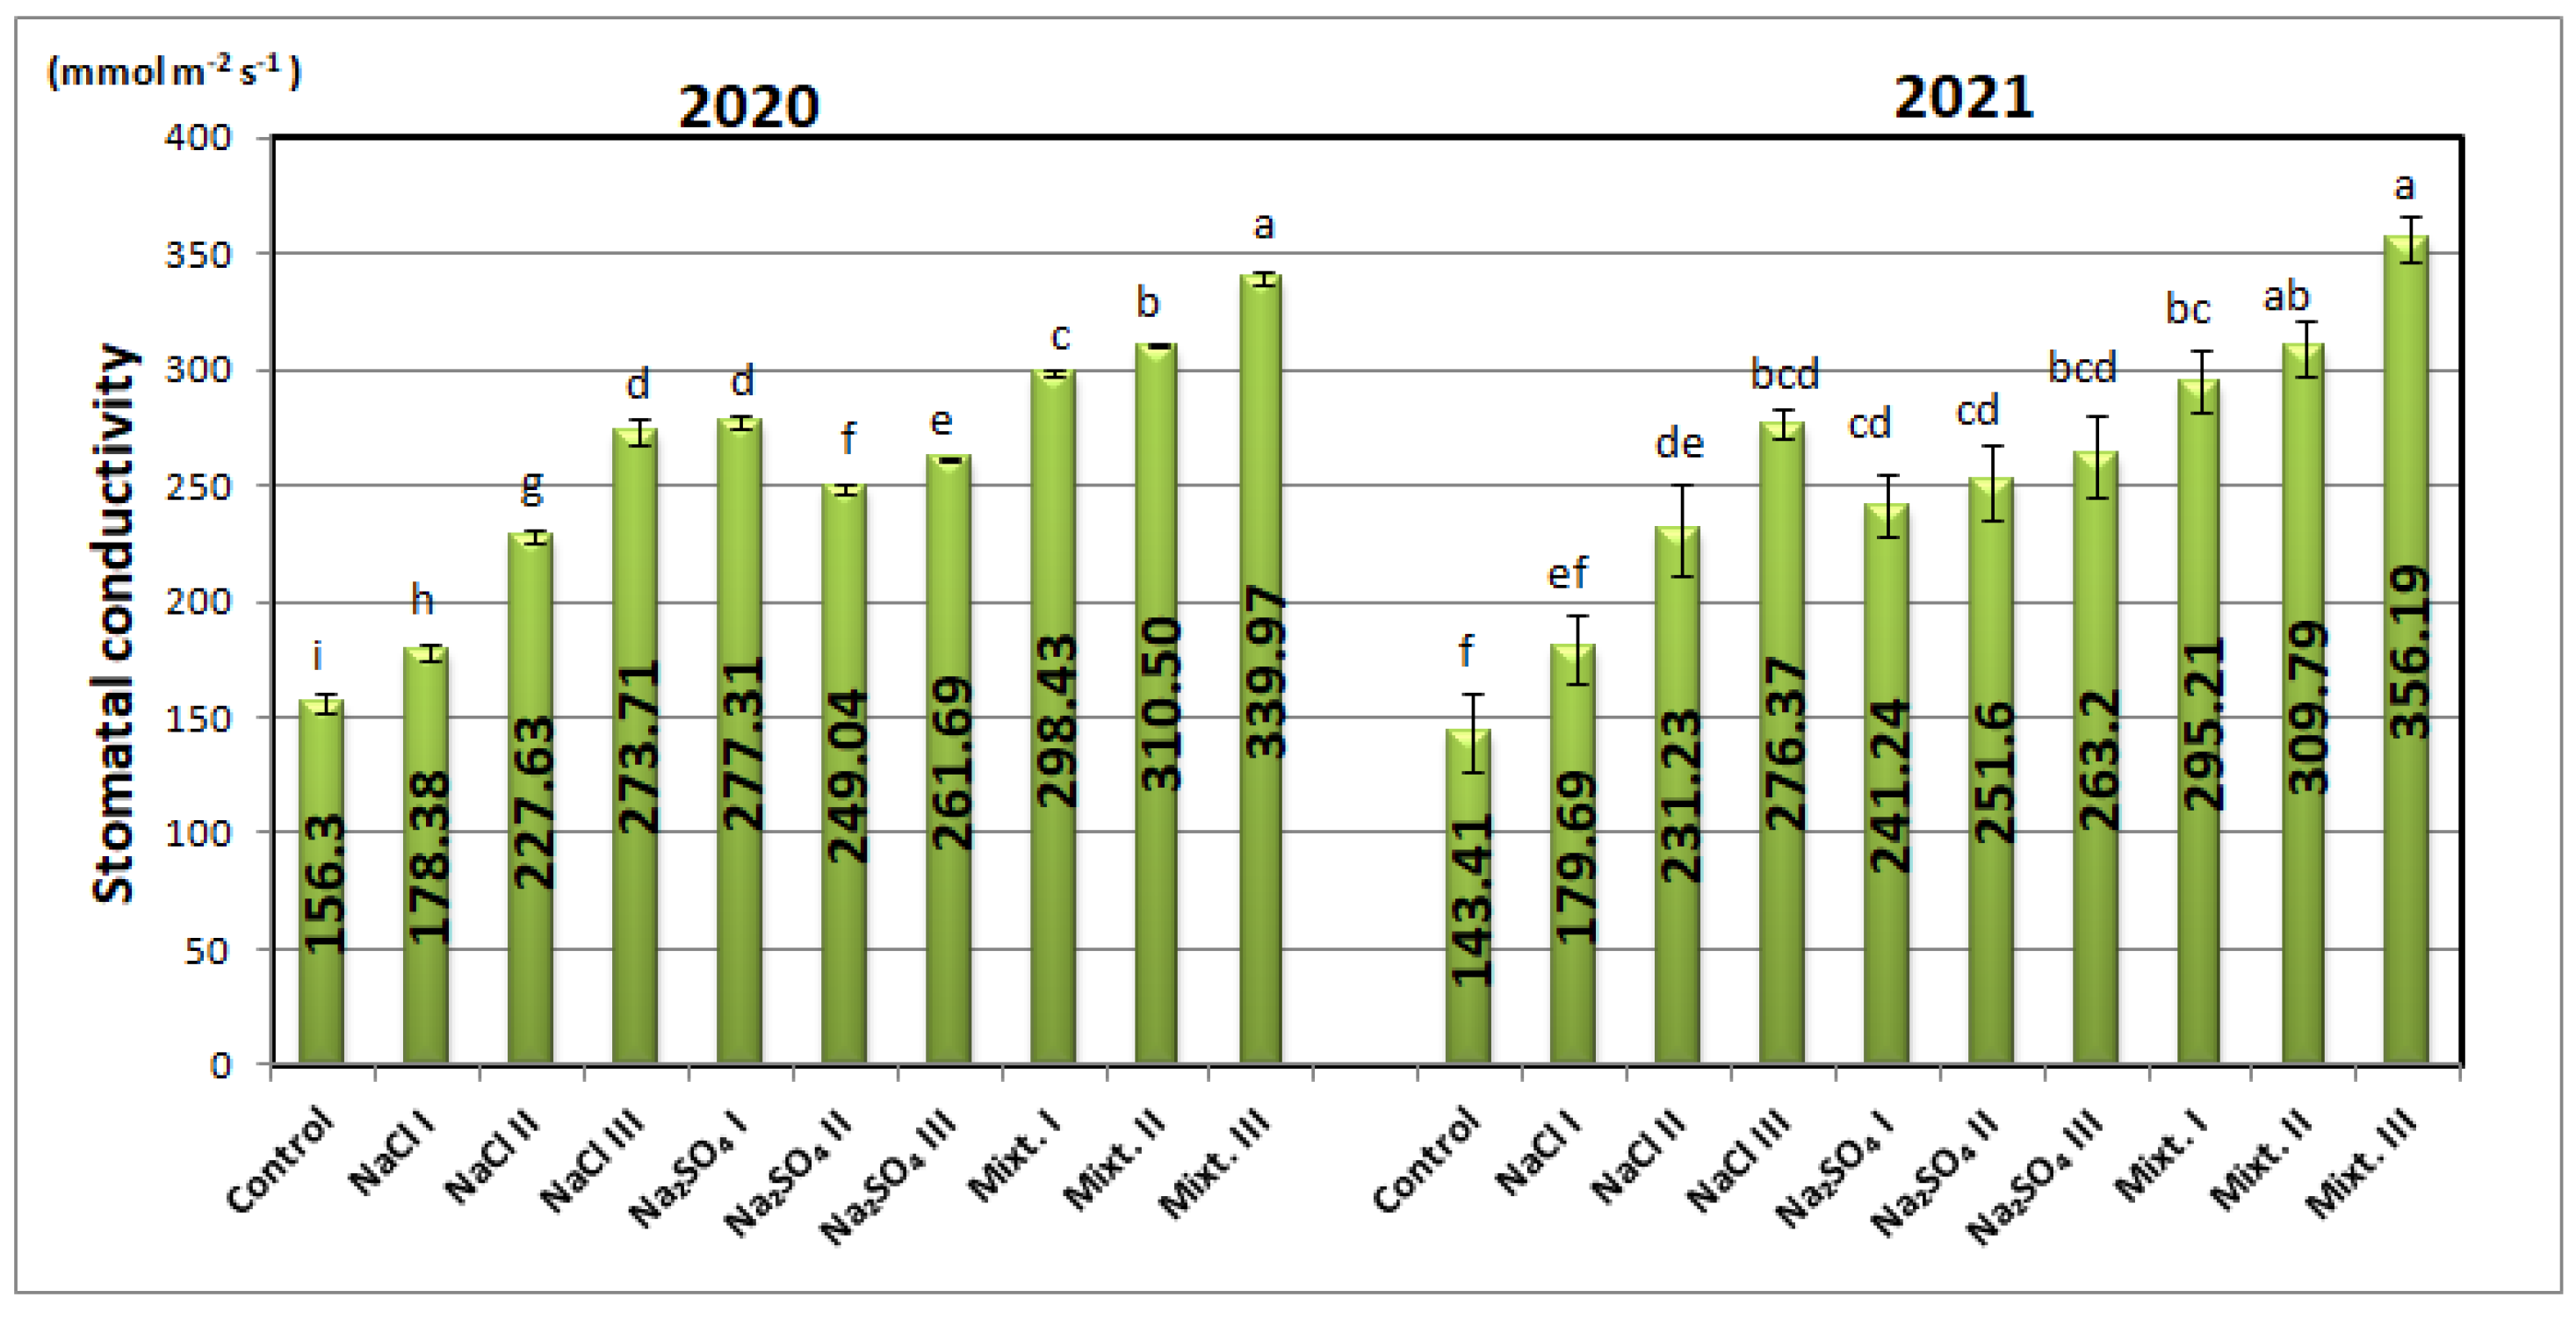
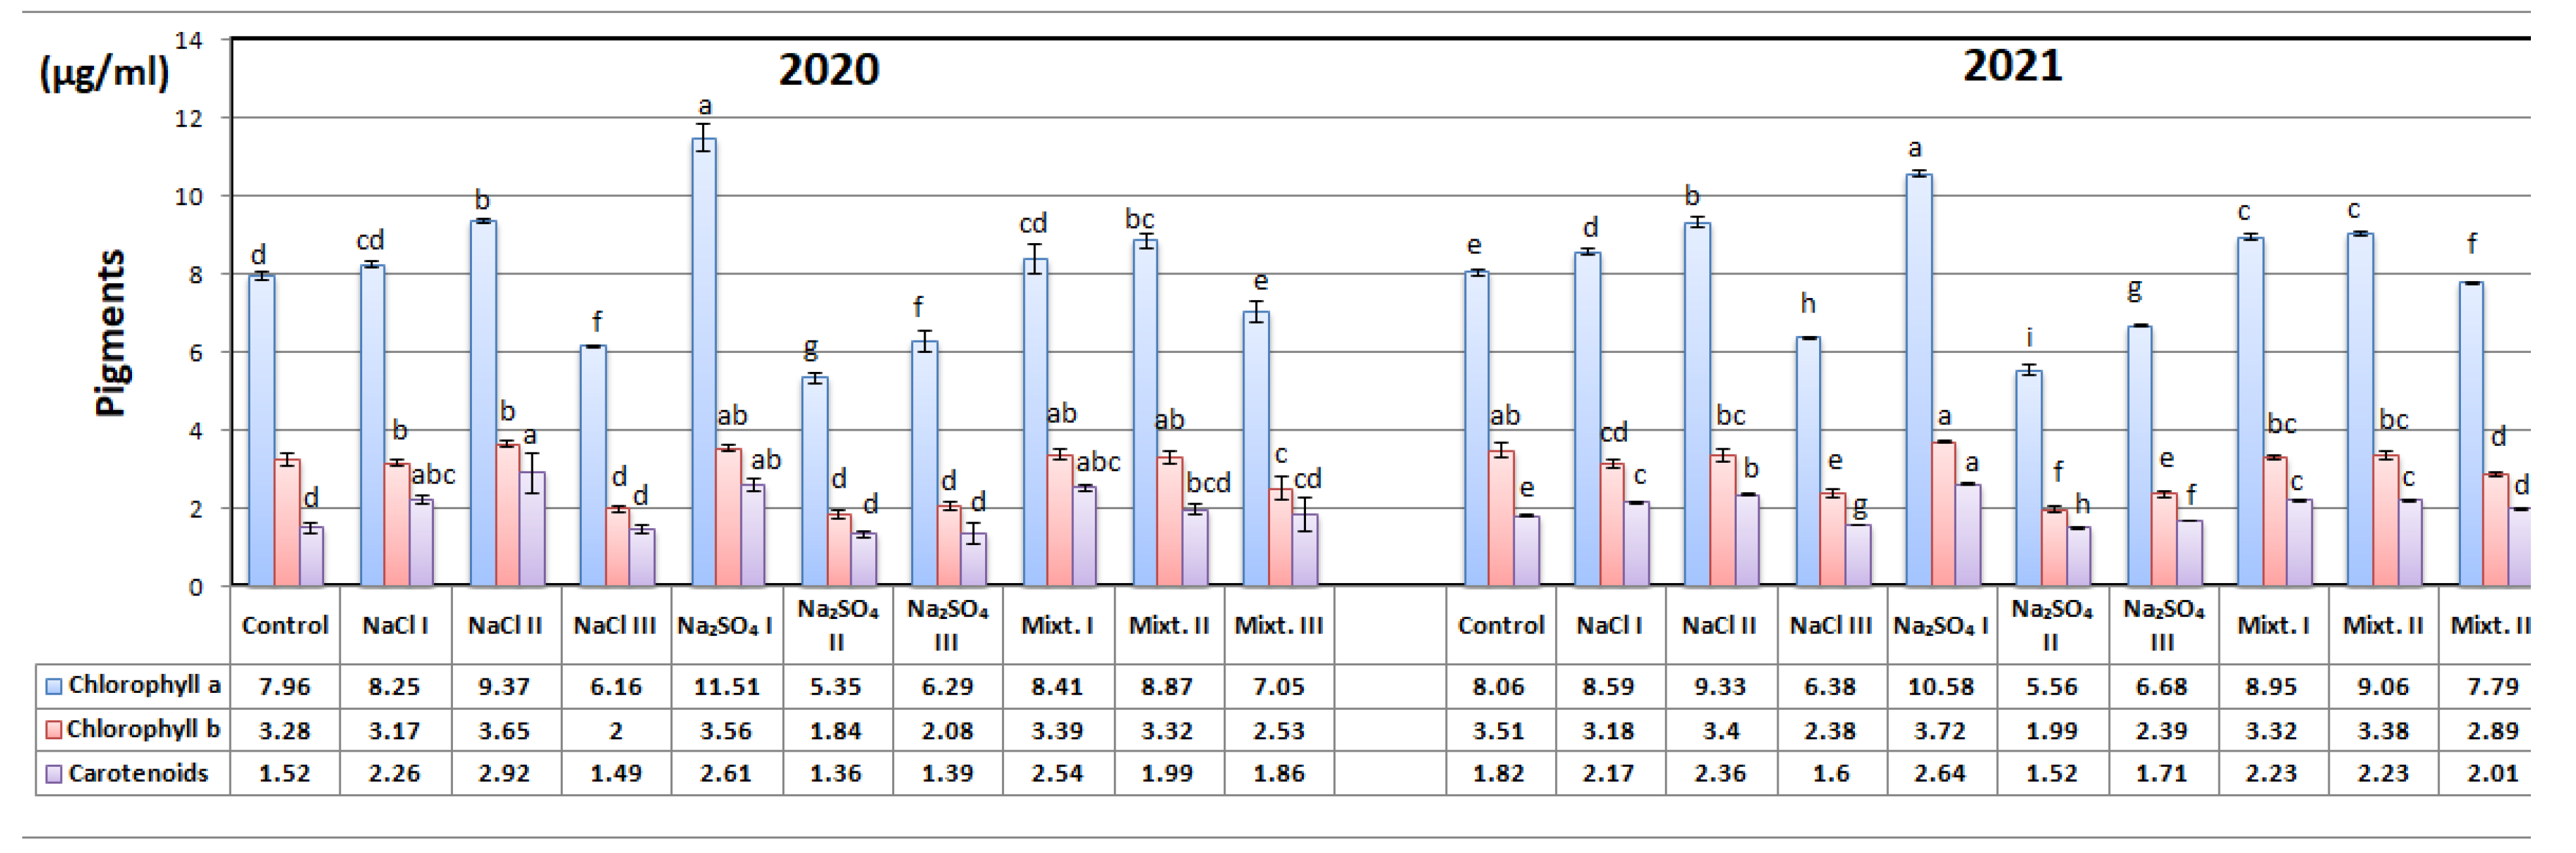
3.2. Morphological and Physiological Analyses

ESEM images for all the variants from 2021 can be seen in Figure 3. The micro-imaging of the lower epidermis indicated that the level of salinity influences the size and number of the glandular trichomes (indicated with white arrows) on the leaves, as well as the distance between them. For a better comparison, the distances were estimated by using the dedicated software employed to image the samples, and the measurements resulting from ESEM are presented in Figure 4.
Glandular trichomes are found in many botanical families, but the most numerous are found in the Lamiaceae family—which includes the genus Nepeta. They are oil secretors and plant protectors. Trichomes are usually found on the leaves and contain volatile odorous substances that have many roles, such as attracting pollinating insects, playing a repellent role, and acting as an antimicrobial. The size and distance between these trichomes can provide information on the production of volatile oil [44].
Figure 4a shows the mean diameters estimated from ESEM images for the glandular trichomes in the analyzed samples. The increase of the salt concentration leads to the decrease of the trichomes compared with the control, especially for salt mixture variants, while for NaCl, there is a slight increase. For the same salt, the diameters decrease with increasing the salt concentration. The largest dimensions of glandular trichomes were determined as NaCl II > NaCl III > Na2SO4 I > Na2SO4 II > Na2SO4 III > Mixture I > Mixture II > Mixture III.
The distances between the trichomes were variable, as can be seen in Figure 4b. In the case of NaCl treatment, the distances between the trichomes decrease with increasing concentration, and in the case of Na2SO4 treatment, the distances between the glandular trichomes increased with the concentration of salts. In variants treated with a mixture of salts, the distances decreased with increasing concentration. In variants treated with high concentrations of salts and in those with mixtures, the lower epidermis of the leaf was lined with a large number of secretory cells, but it was smaller in size. The smallest distances between glandular trichomes were found in Mixture III (43.77 ± 1.04 μm), and in the NaCl III variant (52.53 ± 1.93 μm) in 2020.
The decreased distance between trichomes that can also be seen as an increased density was also reported under salinity-stress exposure of Mentha pulegium [45] and Schizonepeta tenuifolia Briq. [46], as well as Mentha piperita L. [47]; the effect seems to be associated with the improvement of the metabolism of the plants under saline stress, or it might be a way of keeping Na+ in plant leaves [48]. The variation of the density and size of glandular trichomes under external stress has been reported in other studies and for other aromatic species, being believed to be determined by a synergistic action of internal and external factors [49,50,51,52]. The molecular bases of such changes are still unknown, although it is believed that the increased density of trichomes has the role to improve the resistance of the crops to abiotic stresses, with the trichomes acting as chemical defense barriers.
The stomatal conductance is a way to evaluate the osmotic stress tolerance. In our experiment, its values increased with the salinity and was higher in all cases compared to control variant. This could be due to an increased number of stomata as a plant response to saline stress in order to regulate the water uptake that suffers under saline conditions. The highest value of the conductance was measured for Mixture III variant, as can be seen in Figure 5.

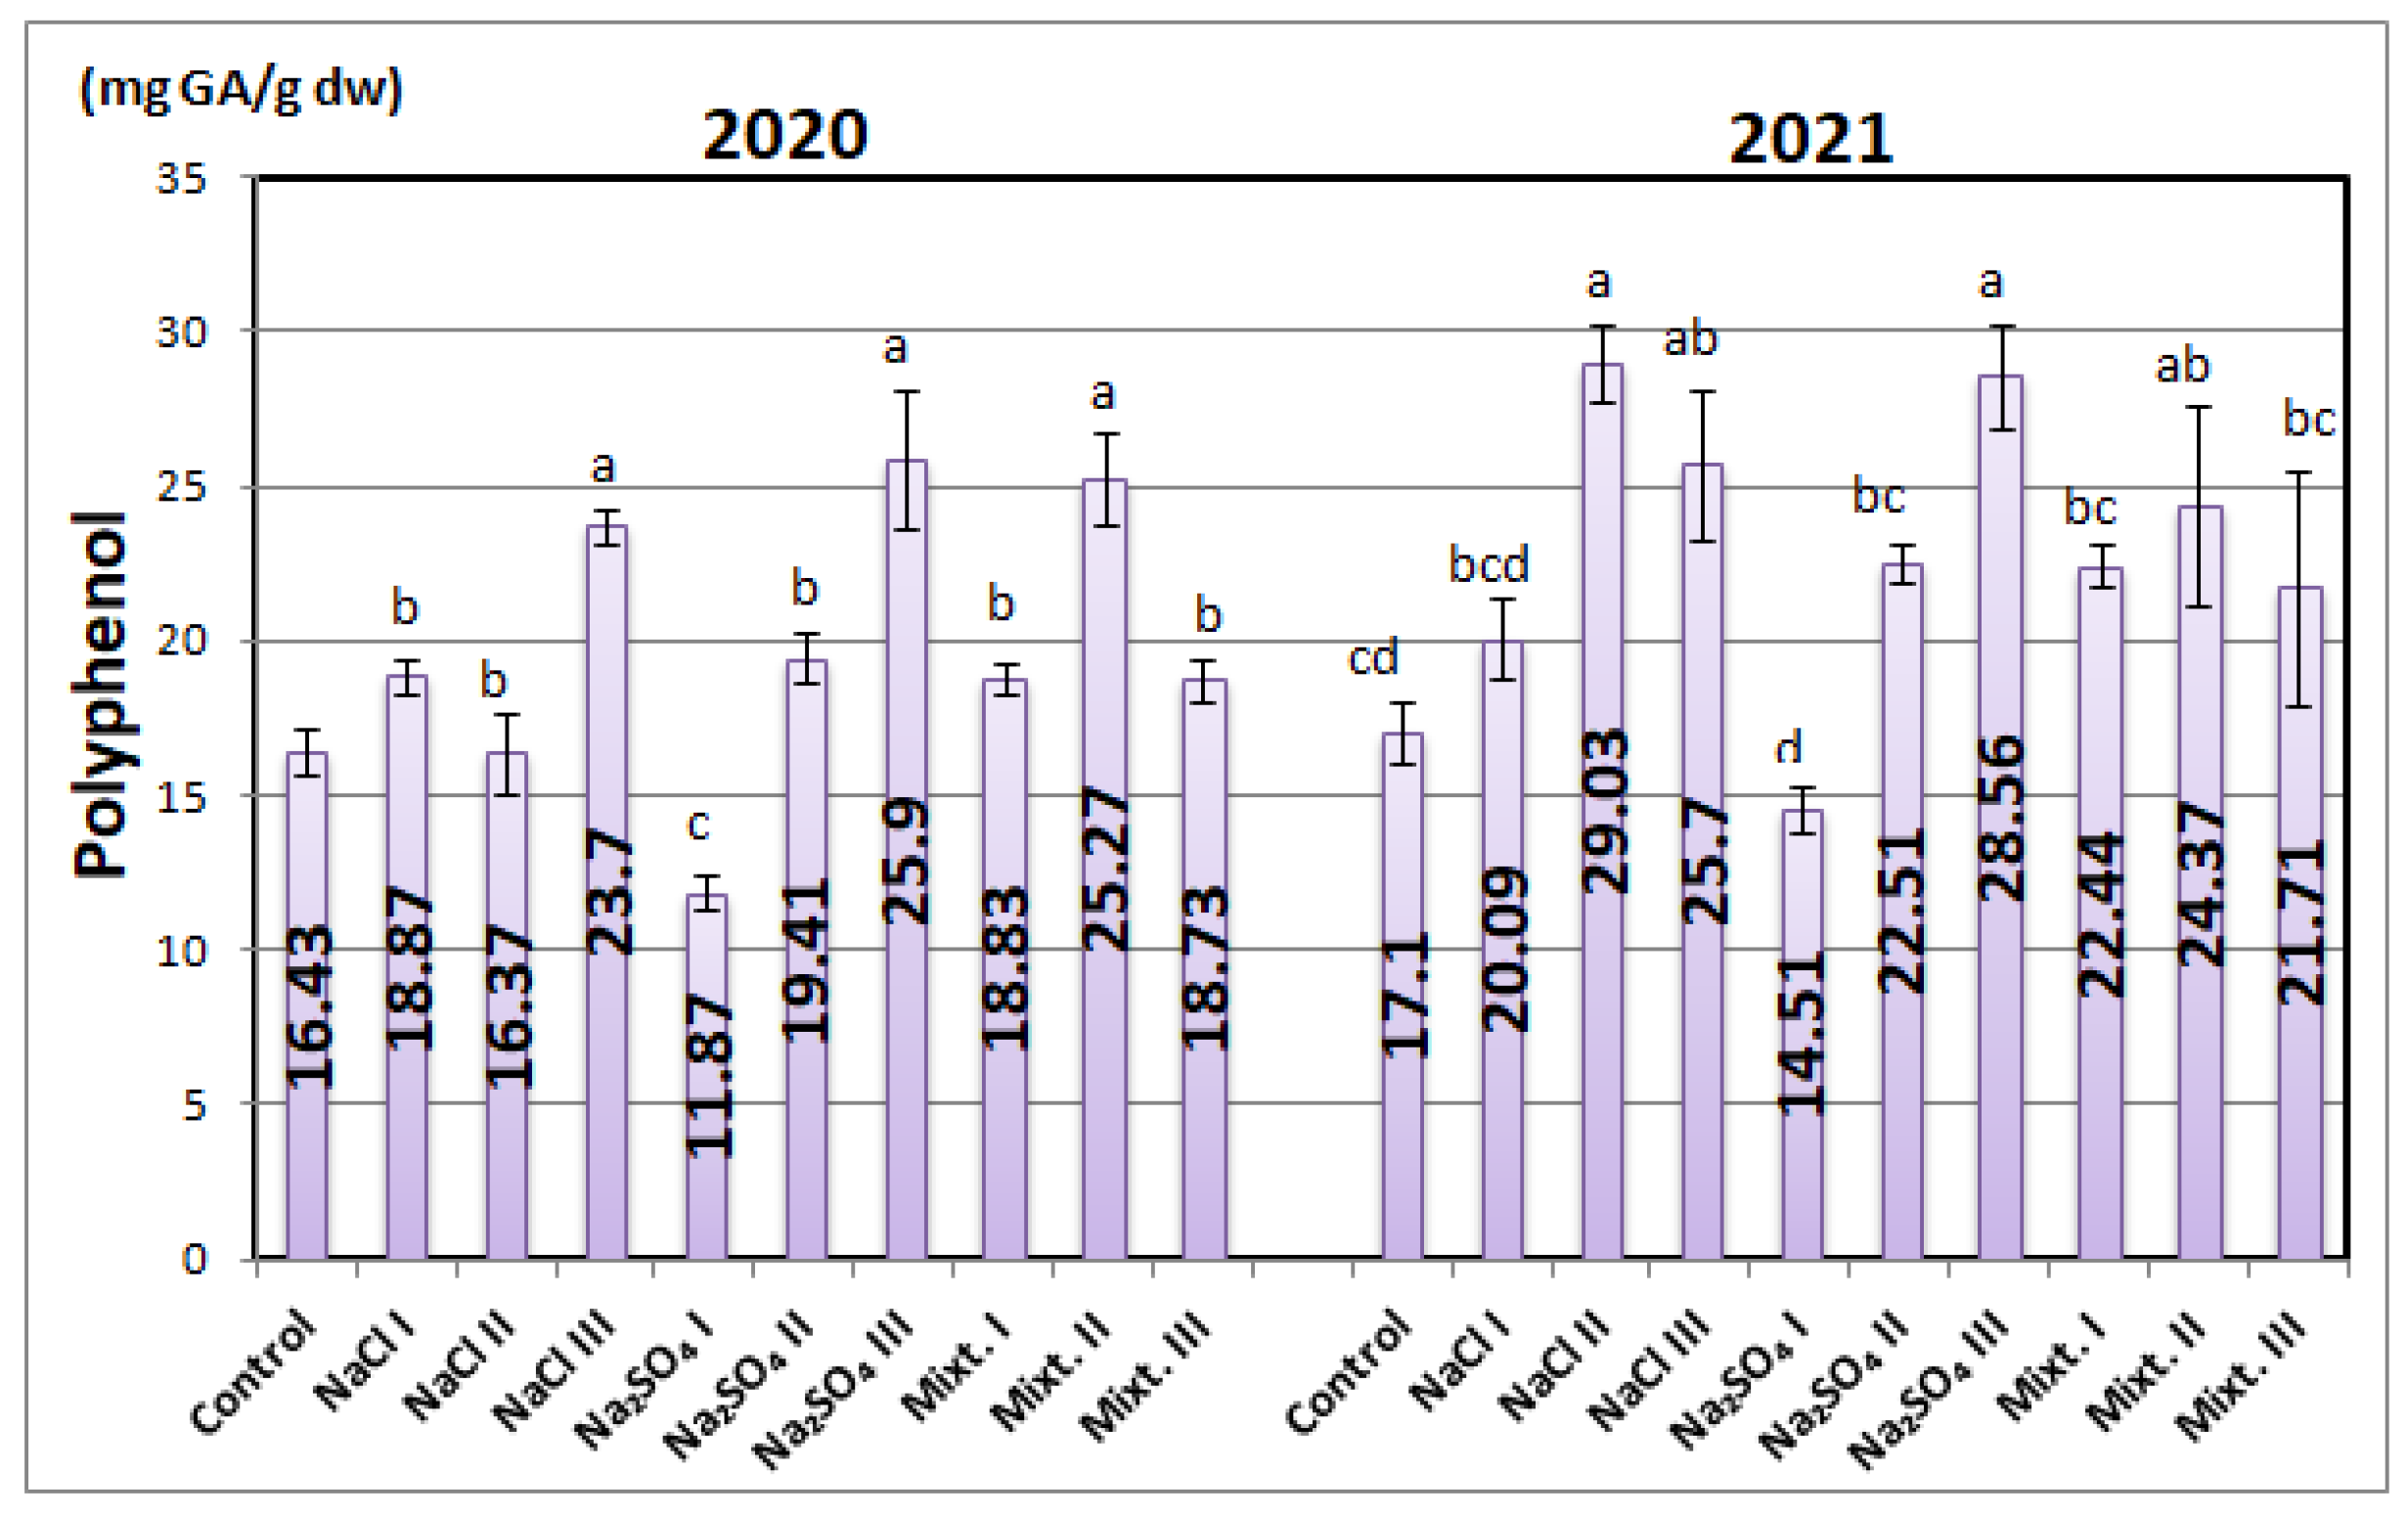
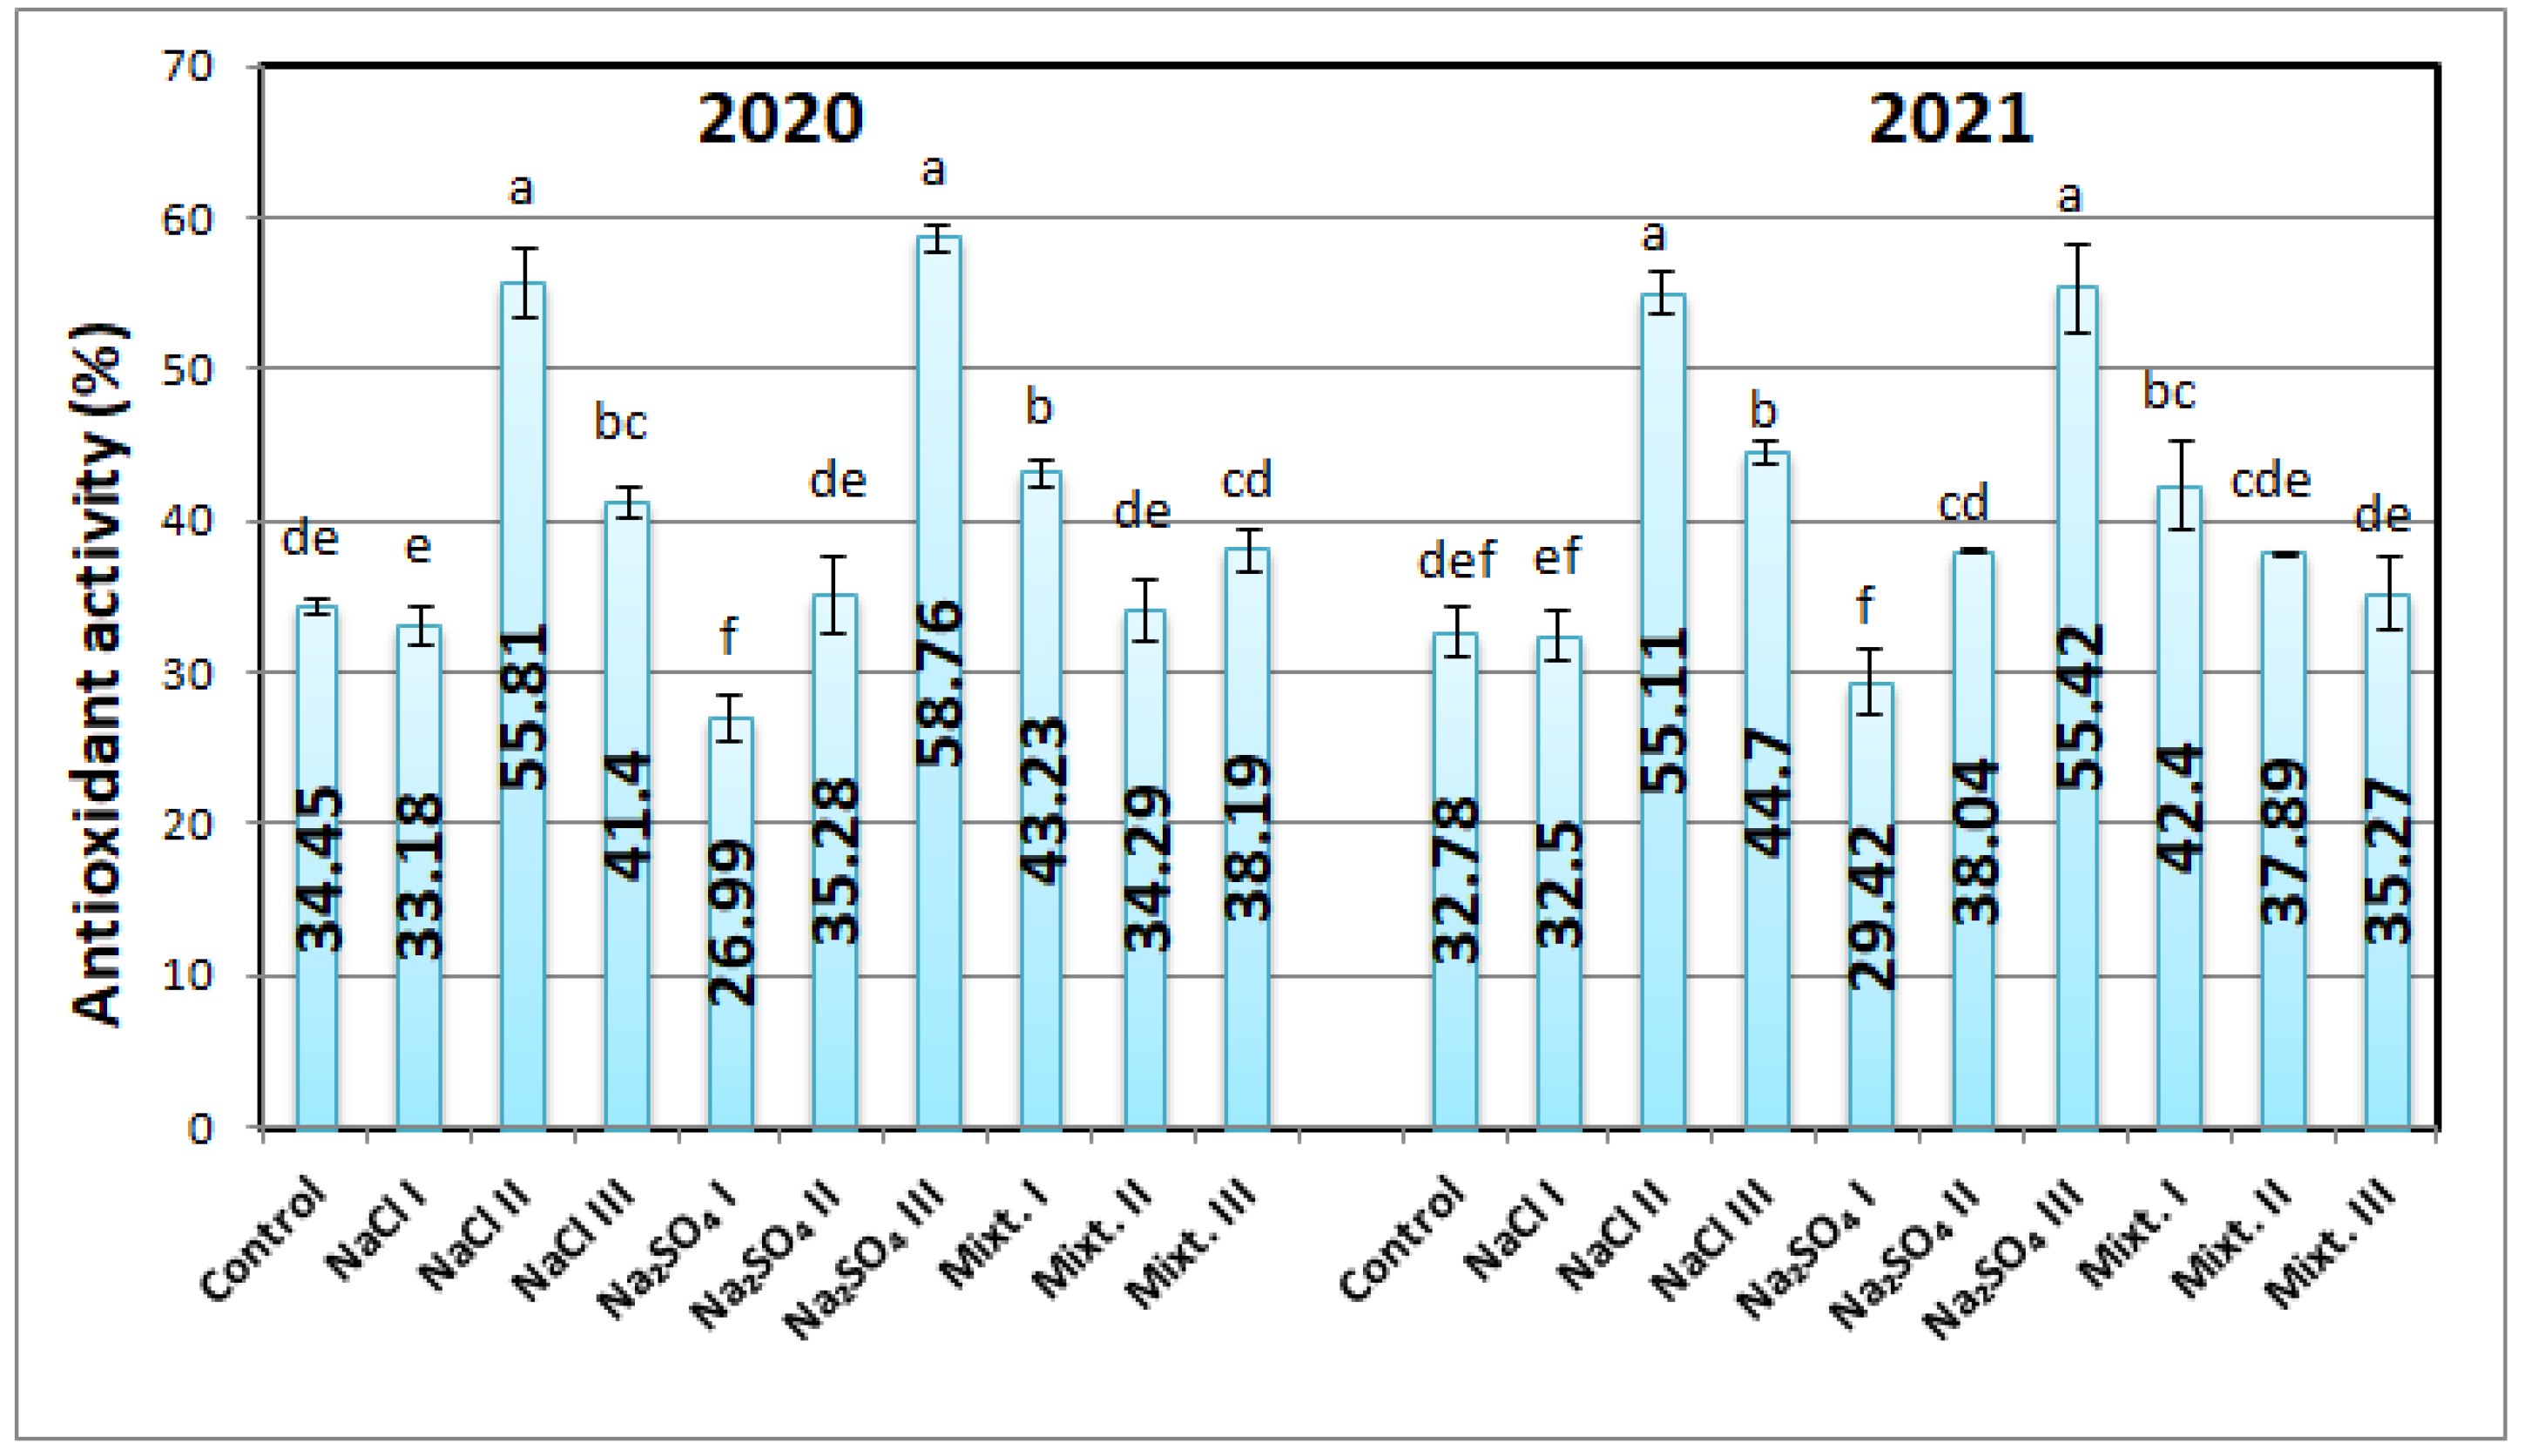
3.3. Biochemical Analyses

The concentrations of chlorophyll pigments (a, b, and carotenoids) are presented in Figure 6. It is confirmed that strong biochemical changes take place as a result of salinity stress. In most cases, the concentrations of chlorophyll pigments decreased. For small concentrations, it appears that some salinity-tolerance mechanisms were involved, leading to an increase of mostly chlorophyll a, which is mainly responsible for photosynthesis. In the Na2SO4 I variant, the chlorophyll a content was the highest for both years, 10.58 ± 0.08 μg/mL and 11.51 ± 0.35 μg/mL, respectively. Chlorophyll b was also the highest for the Na2SO4 I variant, with values of 3.56 ± 0.08 μg/mL in 2020 and 3.72 ± 0.02 μg/mL in 2021. The same trend as for the chlorophyll b was observed for the carotenoid pigments.
These results show that, due to saline stress, plants intensify their gas exchange at the stomatal level: oxygen, which is necessary for respiration, and carbon dioxide, which is required for photosynthesis, as also discussed by other studies [6,43,46,47,48,53,54], and could also correspond to the increase of stomatal conductance evidenced for saline stress variants previously described. The suppressed photosynthesis observed especially for high salt concentrations is in accordance with other reports, being believed that, under severe salt stress, some structural changes are stimulated, with the major target being the chloroplasts. At the same time, the increased production of ROS in the cells can affect the photosynthetic electron transport chain [11,46]. The effects induced by NaCl and Na2SO4 are similar to a limited extent. Na2SO4 seems to trigger stronger modifications than NaCl, as seen in the trichrome density and chlorophyll pigments, as well as confirmed by the literature [42].
Figure 7 shows the total polyphenol content of the variants from both years. The concentration ranged from 29.8 ± 0.3 to 49.3 ± 2.7 mg GA/g dw. The highest content of polyphenols was achieved in 2021, with values between 29.03 ± 1.24 mg GA/g dw for NaCl II and 28.56 ± 1.7 mg GA/g dw for Na2SO4 III. The results are in agreement with those obtained by Mihaylova et al. [55]. Other researchers found that the concentration of polyphenols increases with the increase of the salinity, which we also found, but only in the case of Na2SO4 [56].
Overall, it appears that the trend is similar for both years, i.e., high concentrations of polyphenol being found in some high-salinity soil-growing conditions, with values significantly increased compared to the control. This founding indicates that salinity stress might stimulate the production of polyphenols in the plants. Phenolic compounds are a class of secondary metabolites, along with phenolic acids and polyphenols, and have many functions in the plants and very important properties, such as antioxidative, anti-inflammatory, anti-mutagenic, and anti-carcinogenic properties [57,58,59].
Flavonoids are a subgroup of secondary metabolites and are the most studied in the plant kingdom, due to their important properties (bioactivities) [60]. The concentration of flavonoids for the studied salinity conditions showed higher concentrations for most variants than for the control. One exception was N. cataria grown in soil with Na2SO4 concentration of 80 mg/soil, the lowest in its series. Flavonoids had the highest values in Mixture III variant in both years (44.66 ± 0.77 mg QE/g dw—2020, and 47.45 ± 2.35 mg QE/g dw in 2021, respectively) (Figure 8).
A similar trend as for the polyphenol content was observed in the case of antioxidant activity. Samples grown in high-salinity conditions presented a much higher antioxidant activity than the control one, by up to about 20%, as can be seen in Figure 9. Just as for the other presented results, the variations were similar for both analyzed years. The highest antioxidant activity was recorded for NaCl II and Na2SO4 III in both years (55.81 ± 2.18–58.76 ± 0.92% in 2020, and 55.11 ± 1.34–55.42 ± 2.87% in 2021).
The similarity between the polyphenol content of variants and antioxidant activity is due to the fact that polyphenols are powerful antioxidants, their production having the purpose of mediating the scavenging harmful effects of ROS under salinity stress. The synthesis of polyphenols and flavonoids is stimulated as a mechanism of plant tolerance against salinity stress, as evidenced by and reported in many studies [42,43,46,47,48,54,61]. Flavonoids, polyphenols, and antioxidant activity decreased for a small concentration of Na2SO4, while higher salt stress stimulated the production of active compounds for all variants. This can also have a connection with the decreased distances between the glandular trichomes, which can be seen as an increase of their density, thus leading to higher concentrations of bioactive compounds. Similar biochemical and glandular trichomes’ density changes under salinity stress were reported in the literature, with enhanced production of antioxidant compounds under low salinity stress, and inhibition under severe saline conditions [43,45,46,47,61].
For a better understanding of any existing correlation between the studied parameters, Pearson’s correlation coefficients were calculated. The results are shown in Table 4. A strong correlation was found between polyphenols and antioxidant activity, as expected. Positive correlations were also determined between polyphenol concentration and stomatal conductivity, as well as the abovementioned parameters and salt concentration. Negative correlations were evidenced for the rest of the studied parameters.

4. Conclusions

In this study, we analyzed the effects of some salinity-stress conditions on Nepeta cataria L. The yield is directly influenced by salinity. The highest value was obtained in the NaCl III variant in the first year of study, while, in the second year, the highest was obtained for the control variant, indicating a negative effect of salinity stress. The difference in production between years could also be attributed to different climatic conditions.
Different saline concentrations influence biochemical parameters, such as polyphenol and flavonoid contents, in some conditions having a stimulating effect for the production of bioactive compounds. Antioxidant activity has also increased, mostly for the variants exposed to Na2SO4 stress, and it showed no correlation with other environmental conditions. Due to the fact that polyphenols also have a high concentration, the increase of antioxidant activity can be attributed mostly to polyphenols and, to a lesser extent, flavonoids. An increased density of the trichomes evidenced by electron microscopy imaging can be correlated with increased concentration of bioactive compounds and could be associated with a metabolic enhancement under salt stress. The high antioxidant activity in some conditions is a protective response of the plants to the high concentrations of ROS produced for high salt concentrations.
Salinity also influences the amount of chlorophyll pigments; the highest amount of chlorophyll a was determined in the Na2SO4 variant, in both years and in the variants with salt mixtures. A similar distribution of values was maintained in chlorophyll b. In the case of carotenoids, the highest values were obtained in the variants with the smallest salt concentrations.
The species grows well on soils that contain both NaCl and Na2SO4. The main compounds analyzed, with potential use in many industrial fields (polyphenols, flavonoids, and antioxidant activity), have significantly higher values in the salt-treated variants compared to the control variant, indicating the possibility of benefiting from such cultures even in salinity-stress conditions. Further genetic and biophysical research is necessary to establish the insights of the salinity response of Nepeta, especially regarding the enhancement of the bioactive compounds’ production, to finally benefit by cultivating it in salinity-affected soils.

Author Contributions

Conceptualization, F.F., C.L. and T.R.; methodology, I.P., I.M. and C.D.J.; software, G.-C.T.; validation, F.F., T.R. and C.D.J.; formal analysis, C.S.G.; investigation, I.M. and C.L.; resources, T.R.; data curation, C.S.G.; writing—original draft preparation, I.M. and C.L.; writing—review and editing, C.L., I.M. and F.F.; visualization, T.R.; supervision, T.R. All authors have read and agreed to the published version of the manuscript.

Funding

This research received no external funding.

Data Availability Statement

Not applicable.

Acknowledgments

The materials used for the experiments were bought from Ph.D. program funds.

Conflicts of Interest

The authors declare no conflict of interest.

References

  1. Lesk, C.; Rowhani, P.; Ramankutty, N. Influence of extreme weather disasters on global crop production. Nature 2016, 529, 84–87. [Google Scholar] [CrossRef]
  2. Fahad, S.; Bajwa, A.; Nazir, U.; Anjum, S.A.; Farooq, A.; Zohaib, A.; Sadia, S.; Nasim, W.; Adkins, S.; Saud, S.; et al. Crop Production under Drought and Heat Stress: Plant Responses and Management Options. Front. Plant Sci. 2017, 8, 1147. [Google Scholar] [CrossRef] [Green Version]
  3. Jacobsen, T.; Adams, R.M. Salt and Silt in Ancient Mesopotamian Agriculture. Science 1958, 128, 1251–1258. [Google Scholar] [CrossRef] [PubMed]
  4. Dagar, J.C.; Yadav, R.K.; Singh, A.; Singh, N.T. Historical Perspectives and Dynamics of Nature, Extent, Classification and Management of Salt-affected Soils and Waters. In Research Developments in Saline Agriculture; Springer: Singapore, 2019; pp. 3–52. [Google Scholar] [CrossRef]
  5. Machado, R.M.A.; Serralheiro, R.P. Soil Salinity: Effect on Vegetable Crop Growth. Management Practices to Prevent and Mitigate Soil Salinization. Horticulturae 2017, 3, 30. [Google Scholar] [CrossRef]
  6. Saeidnejad, A.H.; Kafi, M.; Pessarakli, M. Interactive Effects of Salinity Stress and Zn Availability on Physiological Properties, Antioxidant Activity, and Micronutrients Content of Wheat (Triticum aestivum) Plants. Commun. Soil Sci. Plant Anal. 2016, 47, 1048–1057. [Google Scholar] [CrossRef]
  7. Alnusairi, G.S.H.; Mazrou, Y.S.A.; Qari, S.H.; Elkelish, A.A.; Soliman, M.H.; Eweis, M.; Abdelaal, K.; El-Samad, G.A.; Ibrahim, M.F.M.; ElNahhas, N. Exogenous Nitric Oxide Reinforces Photosynthetic Efficiency, Osmolyte, Mineral Uptake, Antioxidant, Expression of Stress-Responsive Genes and Ameliorates the Effects of Salinity Stress in Wheat. Plants 2021, 10, 1693. [Google Scholar] [CrossRef] [PubMed]
  8. Harris, B.N.; Sadras, V.O.; Tester, M. A water-centred framework to assess the effects of salinity on the growth and yield of wheat and barley. Plant Soil 2010, 336, 377–389. [Google Scholar] [CrossRef]
  9. Rengasamy, P. Soil processes affecting crop production in salt-affected soils. Funct. Plant Biol. 2010, 37, 613–620. [Google Scholar] [CrossRef]
  10. Miller, G.; Shulaev, V.; Mittler, R. Reactive oxygen signaling and abiotic stress. Physiol. Plant. 2008, 133, 481–489. [Google Scholar] [CrossRef]
  11. Shahid, M.A.; Sarkhosh, A.; Khan, N.; Balal, R.M.; Ali, S.; Rossi, L.; Gómez, C.; Mattson, N.; Nasim, W.; Garcia-Sanchez, F. Insights into the Physiological and Biochemical Impacts of Salt Stress on Plant Growth and Development. Agronomy 2020, 10, 938. [Google Scholar] [CrossRef]
  12. Hussain, Q.; Asim, M.; Zhang, R.; Khan, R.; Farooq, S.; Wu, J. Transcription Factors Interact with ABA through Gene Expression and Signaling Pathways to Mitigate Drought and Salinity Stress. Biomolecules 2021, 11, 1159. [Google Scholar] [CrossRef] [PubMed]
  13. Wang, J.; Zhu, J.; Zhang, Y.; Fan, F.; Li, W.; Wang, F.; Zhong, W.; Wang, C.; Yang, J. Comparative transcriptome analysis reveals molecular response to salinity stress of salt-tolerant and sensitive genotypes of indica rice at seedling stage. Sci. Rep. 2018, 8, 2085. [Google Scholar] [CrossRef] [PubMed] [Green Version]
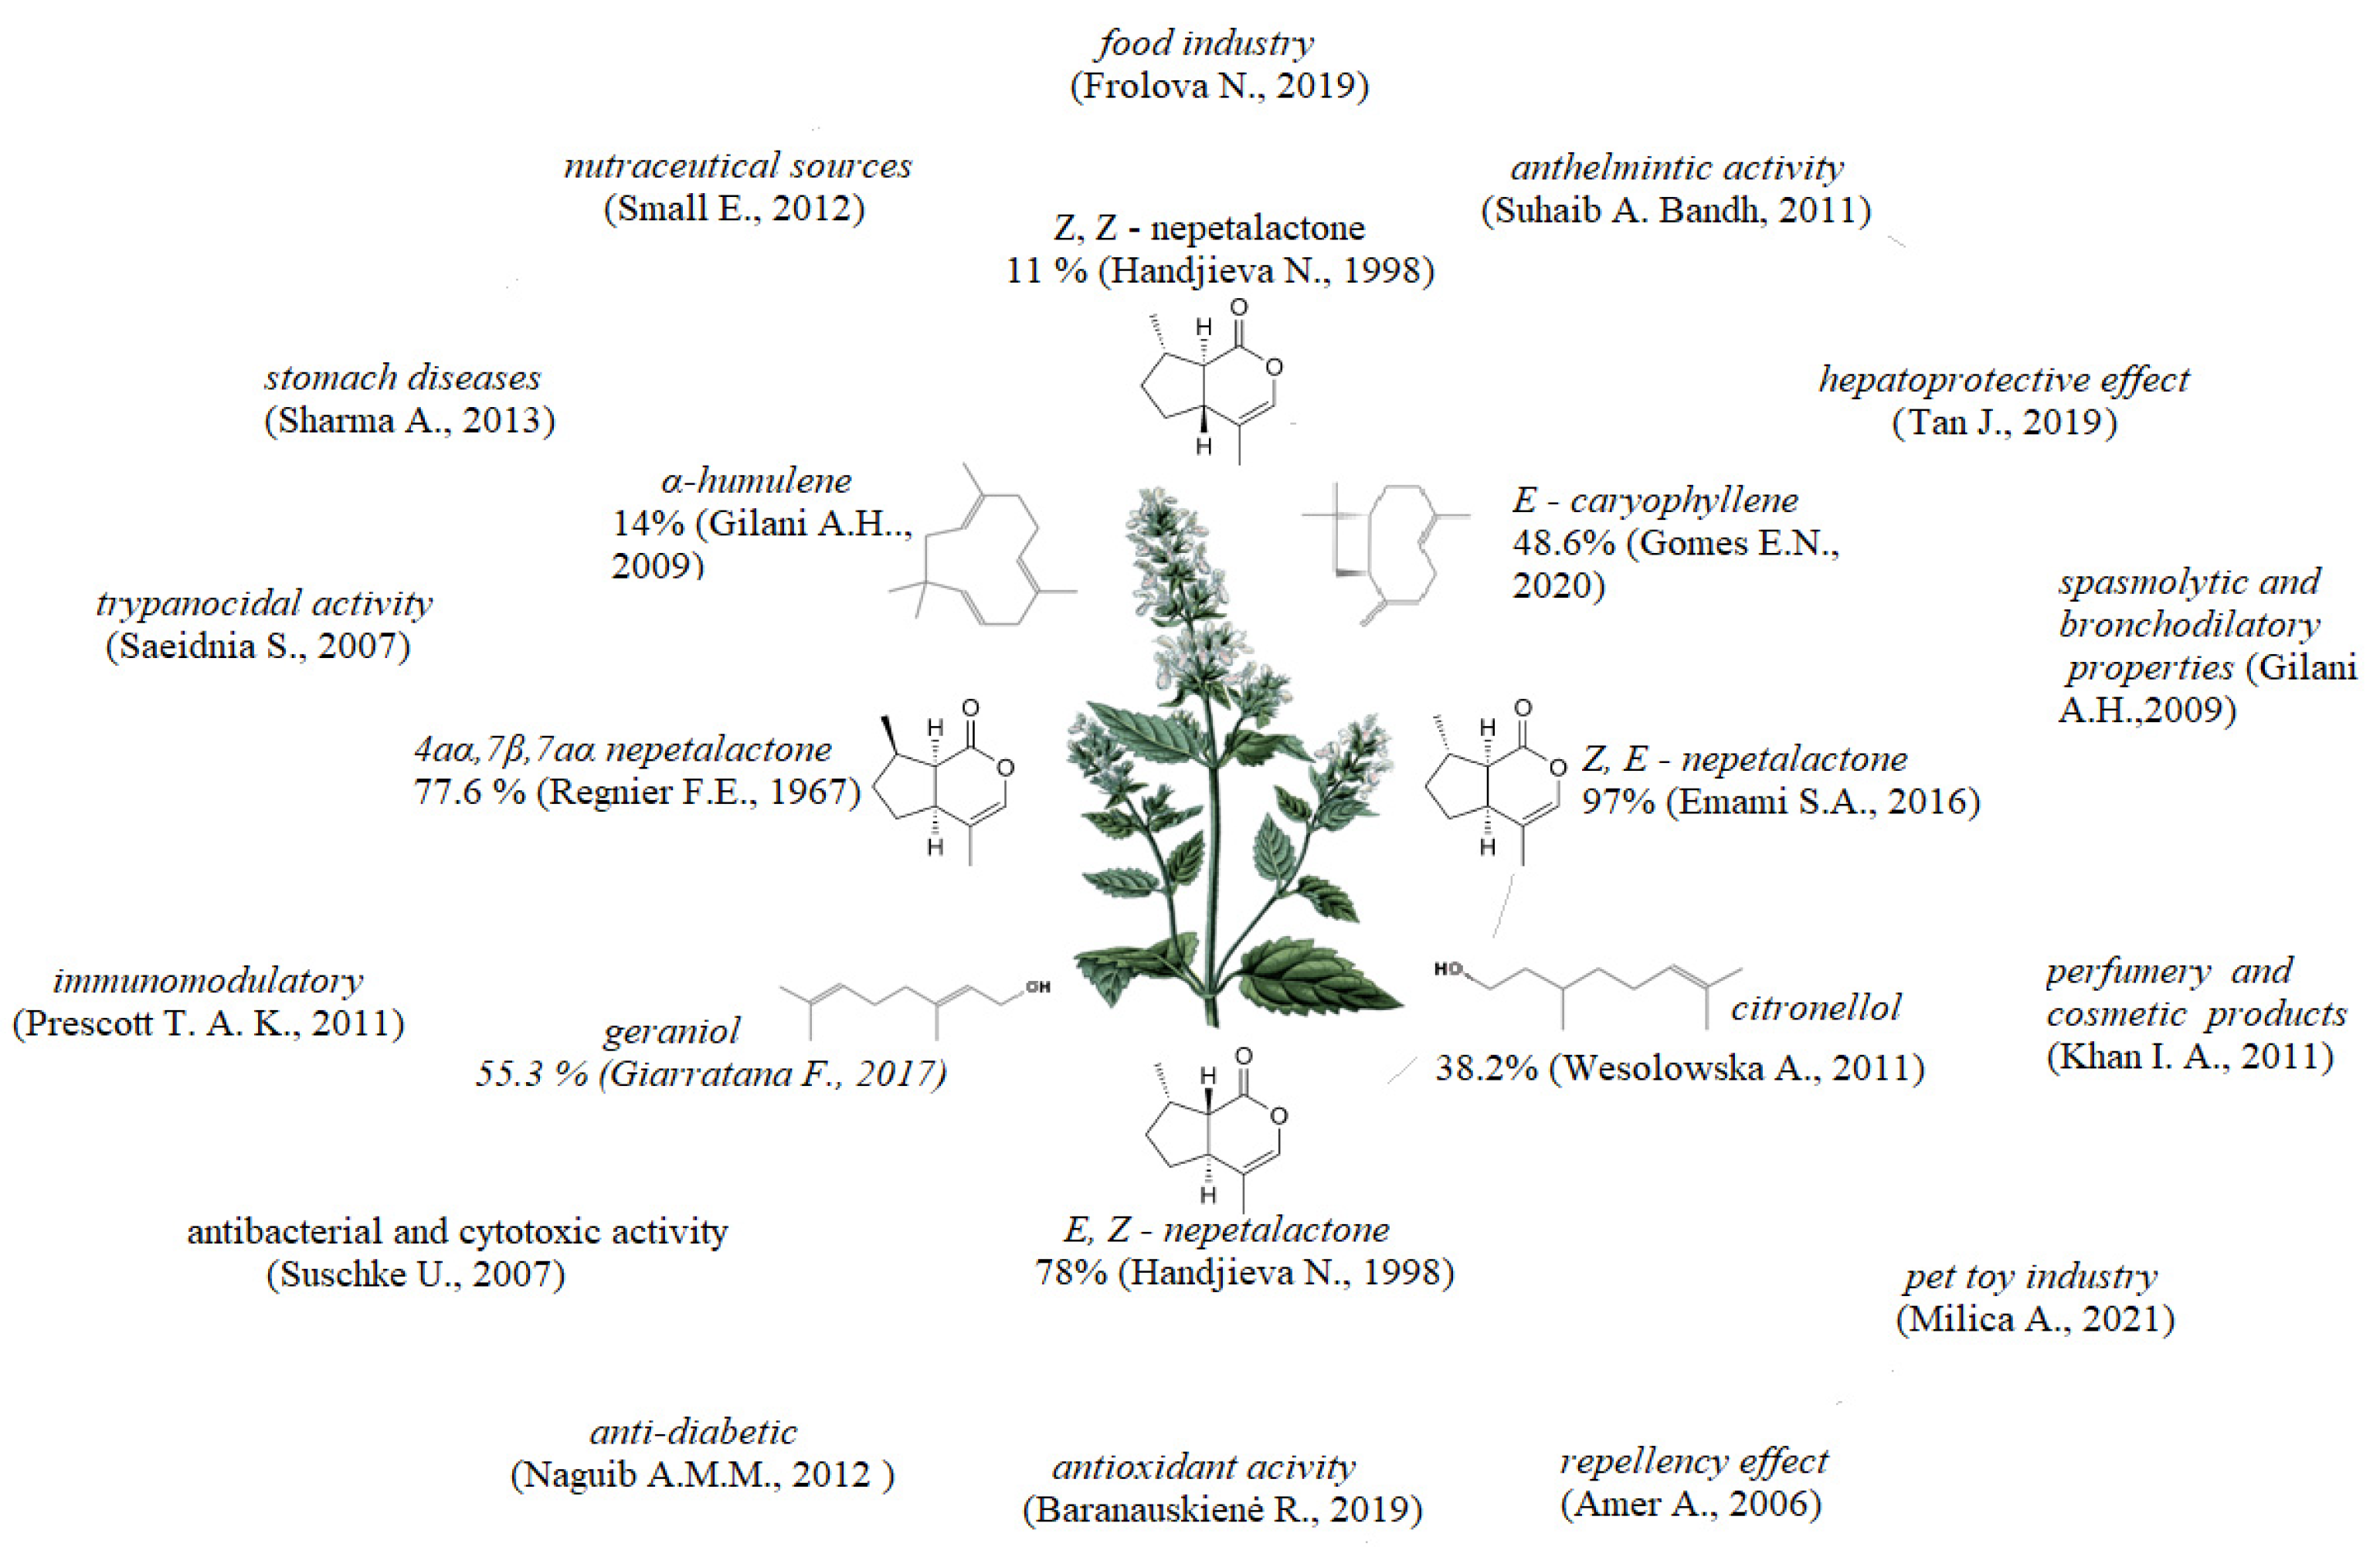
  14. Formisano, C.; Rigano, D.; Senatore, F. Chemical Constituents and Biological Activities of Nepeta Species. Chem. Biodivers. 2011, 8, 1783–1818. [Google Scholar] [CrossRef] [PubMed]
  15. Reichert, W.; Villani, T.; Pan, M.H.; Ho, C.T.; Simon, J.E.; Wu, Q.L. Phytochemical analysis and anti-inflammatory activity of Nepeta cataria accessions. J. Med. Active Plants 2018, 7, 19–27. [Google Scholar] [CrossRef]
  16. Bandh, S.A.; Kamili, A.N.; Ganai, B.A.; Lone, B.A.; Saleem, S. Evaluation of antimicrobial activity of aqueous extracts of Nepeta cataria. J. Pharm. Res. 2011, 4, 3141–3142. [Google Scholar]
  17. Zomorodian, K.; Saharkhiz, M.J.; Rahimi, M.J.; Shariatifard, S.; Pakshir, K.; Khashei, R. Chemical composition and antimi-crobial activities of essential oils from Nepeta cataria L. against commons causes of oral infections. J. Dent. 2013, 10, 329–337. [Google Scholar]
  18. Duda, S.C.; Marghitas, L.A.; Dezmirean, D.S.; Bobis, O.; Duda, M.M. Nepeta cataria: Medicinal plant of interest in phytotherapy and bee keeping. Hop. Med. Plants 2015, 23, 34–38. [Google Scholar]
  19. Patience, G.S.; Karirekinyana, G.; Galli, F.; Patience, N.A.; Kubwabo, C.; Collin, G.; Bizimana, J.C.; Boffito, D.C. Sustainable manufacture of insect repellents derived from Nepeta cataria. Sci. Rep. 2018, 8, 2235. [Google Scholar] [CrossRef] [Green Version]
  20. Handjieva, N.V.; Popov, S.S.; Evstatieva, L.N. Constituents of Essential Oils from Nepeta cataria L., N. grandiflora M.B. and N. nuda L. J. Essent. Oil Res. 1996, 8, 639–643. [Google Scholar] [CrossRef]
  21. Gomes, E.N.; Allen, K.; Jaworski, K.; Zorde, M.; Lockhart, A.; Besancon, T.; Brown, T.; Reichert, W.; Wu, Q.; Simon, J.E. Catnip (Nepeta cataria L.): Recent Advances in Horticulture and Production. In Medicinal and Aromatic Plants of North America; Springer: Berlin/Heidelberg, Germany, 2020; pp. 247–284. [Google Scholar]
  22. Emami, S.A.; Asili, J.; HosseinNia, S.; Yazdian-Robati, R.; Sahranavard, M.; Tayarani-Najaran, Z. Growth Inhibition and Apoptosis Induction of Essential Oils and Extracts of Nepeta cataria L. on Human Prostatic and Breast Cancer Cell Lines. Asian Pac. J. Cancer Prev. 2016, 17, 125–130. [Google Scholar] [CrossRef] [Green Version]
  23. Wesołowska, A.; Jadczak, D.; Grzeszczuk, M. GC-MS analysis of lemon catnip (Nepeta cataria L. var. citriodora Balbis) essential oil. Acta Chromatogr. 2011, 23, 169–180. [Google Scholar] [CrossRef]
  24. Giarratana, F.; Muscolino, D.; Ziino, G.; Lo Presti, V.; Rao, R.; Chiofalo, V.; Giuffrida, A.; Panebianco, A. Activity of Catmint (Nepeta cataria) essential oil against Anisakis larvae. Trop. Biomed. 2017, 34, 22–31. [Google Scholar]
  25. Regnier, F.; Waller, G.; Eisenbraun, E. Studies on the composition of the essential oils of three Nepeta species. Phytochemistry 1967, 6, 1281–1289. [Google Scholar] [CrossRef]
  26. Gilani, A.H.; Shah, A.J.; Zubair, A.; Khalid, S.; Kiani, J.; Ahmed, A.; Rasheed, M.; Ahmad, V.U. Chemical composition and mechanisms underlying the spasmolytic and bronchodilatory properties of the essential oil of Nepeta cataria L. J. Ethnopharmacol. 2009, 121, 405–411. [Google Scholar] [CrossRef] [PubMed]
  27. Frolova, N.; Ukrainets, A.; Korablova, O.; Voitsekhivskyi, V. Plants of Nepeta cataria var. citriodora Beck. and essential oils from them for food industry. Potravin. Slovak J. Food Sci. 2019, 13, 449–455. [Google Scholar] [CrossRef] [Green Version]
  28. Tan, J.; Li, J.; Ma, J.; Qiao, F. Hepatoprotective effect of essential oils of Nepeta cataria L. on acetaminophen-induced liver dysfunction. Biosci. Rep. 2019, 39, BSR20190697. [Google Scholar] [CrossRef] [PubMed] [Green Version]
  29. Khan, I.A.; Abourashed, E.A. Leung’s Encyclopedia of Common Natural Ingredients, 3rd ed.; Wiley: Hoboken, NJ, USA, 2010; pp. 159–161. [Google Scholar]
  30. Acimovic, M.; Zeremski, T.; Kiprovski, B.; Brdar-Jokanovic, M.; Popovic, V.; Koren, A.; Sikora, V. Nepeta cataria—Cultivation, chemical composition and biological activity. J. Agron. Technol. Eng. Manag. 2021, 4, 620–634. [Google Scholar]
  31. Mohammadi, S.; Saharkhiz, M.J.; Javanmardi, J. Evaluation of interaction effects of spermidine and salinity on physiological and morphological trait of catnip (Nepeta cataria L.). Z. Arznei-Gewürzpflanzen 2017, 22, 104–109. [Google Scholar]
  32. Mohammadizad, H.A.; Khazaei, I.; Ghafari, M.; Fazel, M.; Sinehsar, F.; Barzegar, R. Effect of salt and drought stress on seed germination and early seedling growth of Nepeta persica. Int. J. Farm. Allied Sci. 2013, 2, 895–899. [Google Scholar]
  33. Mojarab, S.; Moghaddam, M.; Narimani, R. The effect of pretreatment of salicylic acid on seed germination, total phenoland antioxidant activity of Nepeta nuda L. under salt stress. Eco-Phytochem. J. Med. Plants 2018, 6, 21–31. [Google Scholar]
  34. Onofrei, V.; Teliban, G.-C.; Burducea, M.; Lobiuc, A.; Sandu, C.B.; Tocai, M.; Robu, T. Organic foliar fertilization increases polyphenol content of Calendula officinalis L. Ind. Crop. Prod. 2017, 109, 509–513. [Google Scholar] [CrossRef]
  35. Lichtenthaler, H.K. Chlorophylls and carotenoids: Pigments of photosynthetic biomembranes. Methods Enzymol. 1987, 148, 350–382. [Google Scholar]
  36. Wellburn, A.R. The Spectral Determination of Chlorophylls a and b, as well as Total Carotenoids, Using Various Solvents with Spectrophotometers of Different Resolution. J. Plant Physiol. 1994, 144, 307–313. [Google Scholar] [CrossRef]
  37. Singleton, V.L.; Rossi, J.A. Colorimetry of total phenolics with phosphomolybdic-phosphotungstic acid reagents. Am. J. Enol. Vitic. 1965, 16, 144–158. [Google Scholar]
  38. Teliban, G.-C.; Burducea, M.; Zheljazkov, V.; Dincheva, I.; Badjakov, I.; Munteanu, N.; Mihalache, G.; Cojocaru, A.; Popa, L.-D.; Stoleru, V. The Effect of Myco-Biocontrol Based Formulates on Yield, Physiology and Secondary Products of Organically Grown Basil. Agriculture 2021, 11, 180. [Google Scholar] [CrossRef]
  39. Herald, T.J.; Gadgil, P.; Tilley, M. High-throughput micro plate assays for screening flavonoid content and DPPH-scavenging activity in sorghum bran and flour. J. Sci. Food Agric. 2012, 92, 2326–2331. [Google Scholar] [CrossRef] [PubMed]
  40. Lobiuc, A.; Vasilache, V.; Oroian, M.; Stoleru, T.; Burducea, M.; Pintilie, O.; Zamfirache, M.-M. Blue and Red LED Illumination Improves Growth and Bioactive Compounds Contents in Acyanic and Cyanic Ocimum basilicum L. Microgreens. Molecules 2017, 22, 2111. [Google Scholar] [CrossRef] [Green Version]
  41. Thaipong, K.; Boonprakob, U.; Crosby, K.; Cisneros-Zevallos, L.; Byrne, D.H. Comparison of ABTS, DPPH, FRAP, and ORAC assays for estimating antioxidant activity from guava fruit extracts. J. Food Compos. Anal. 2006, 19, 669–675. [Google Scholar] [CrossRef]
  42. Kulak, M.; Gul, F.; Sekeroglu, N. Changes in growth parameter and essential oil composition of sage (Salvia officinalis L.) leaves in response to various salt stresses. Ind. Crop. Prod. 2020, 145, 112078. [Google Scholar] [CrossRef]
  43. Bistgani, Z.E.; Hashemi, M.; DaCosta, M.; Craker, L.; Maggi, F.; Morshedloo, M.R. Effect of salinity stress on the physiological characteristics, phenolic compounds and antioxidant activity of Thymus vulgaris L. and Thymus daenensis Celak. Ind. Crop. Prod. 2019, 135, 311–320. [Google Scholar] [CrossRef]
  44. Herron, S. Catnip, Nepeta cataria, a morphological comparison of mutant and wild type speciments to gain an ethnobotanical perspective. Econ. Bot. 2003, 57, 135–142. [Google Scholar] [CrossRef]
  45. Karray-Bouraoui, N.; Rabhi, M.; Neffati, M.; Baldan, B.; Ranieri, A.; Marzouk, B.; Lachaâl, M.; Smaoui, A. Salt effect on yield and composition of shoot essential oil and trichome morphology and density on leaves of Mentha pulegium. Ind. Crop. Prod. 2009, 30, 338–343. [Google Scholar] [CrossRef]
  46. Zhou, Y.; Tang, N.; Huang, L.; Zhao, Y.; Tang, X.; Wang, K. Effects of Salt Stress on Plant Growth, Antioxidant Capacity, Glandular Trichome Density, and Volatile Exudates of Schizonepeta tenuifolia Briq. Int. J. Mol. Sci. 2018, 19, 252. [Google Scholar] [CrossRef] [PubMed] [Green Version]
  47. Khanam, D.; Mohammad, F. Plant growth regulators ameliorate the ill effect of salt stress through improved growth, photosynthesis, antioxidant system, yield and quality attributes in Mentha piperita L. Acta Physiol. Plant. 2018, 40, 188. [Google Scholar] [CrossRef]
  48. Shabala, S. Learning from halophytes: Physiological basis and strategies to improve abiotic stress tolerance in crops. Ann. Bot. 2013, 112, 1209–1221. [Google Scholar] [CrossRef]
  49. Ehauser, M.-T. Molecular basis of natural variation and environmental control of trichome patterning. Front. Plant Sci. 2014, 5, 320. [Google Scholar] [CrossRef] [Green Version]
  50. Choi, Y.-E.; Harada, E.; Kim, G.-H.; Yoon, E.-S.; Sano, H. Distribution of elements on tobacco trichomes and leaves under cadmium and sodium stresses. J. Plant Biol. 2004, 47, 75–82. [Google Scholar] [CrossRef]
  51. Gonzáles, W.L.; Negritto, M.A.; Suárez, L.H.; Gianoli, E. Induction of glandular and non-glandular trichomes by damage in leaves of Madia sativa under contrasting water regimes. Acta Oecol. 2008, 33, 128–132. [Google Scholar] [CrossRef]
  52. Oksanen, E. Trichomes form an important first line of defence against adverse environment-New evidence for ozone stress mitigation. Plant Cell Environ. 2018, 41, 1497–1499. [Google Scholar] [CrossRef]
  53. Abdelaal, K.A.; El-Maghraby, L.M.; Elansary, H.; Hafez, Y.M.; Ibrahim, E.; El-Banna, M.; El-Esawi, M.; Elkelish, A. Treatment of Sweet Pepper with Stress Tolerance-Inducing Compounds Alleviates Salinity Stress Oxidative Damage by Mediating the Physio-Biochemical Activities and Antioxidant Systems. Agronomy 2019, 10, 26. [Google Scholar] [CrossRef] [Green Version]
  54. Melesse, T.; Caesar, K. Stomatal and Non-stomatal Effects of Salinity on Photosynthesis in Faba Beans (Vicia faba L.). J. Agron. Crop Sci. 1992, 168, 345–353. [Google Scholar] [CrossRef]
  55. Mihaylova, D.; Georgieva, L.; Pavlov, A. In Vitro Antioxidant Activity and Phenolic Composition of Nepeta cataria L. Extracts. Int. J. Agric. Sci. Technol. 2013, 1, 74–79. [Google Scholar]
  56. Ksouri, R.; Megdiche, W.; Debez, A.; Falleh, H.; Grignon, C.; Abdelly, C. Salinity effects on polyphenol content and antioxidant activities in leaves of the halophyte Cakile maritima. Plant Physiol. Biochem. 2007, 45, 244–249. [Google Scholar] [CrossRef] [PubMed]
  57. González-Sarrías, A.; Tomás-Barberán, F.A.; García-Villalba, R. Structural Diversity of Polyphenols and Distribution in Foods. Diet. Polyphen. Metab. Health Eff. 2020, 1–29. [Google Scholar] [CrossRef]
  58. Aelenei, P.; Rimbu, C.M.; Horhogea, C.E.; Lobiuc, A.; Neagu, A.-N.; Dunca, S.I.; Motrescu, I.; Dimitriu, G.; Aprotosoaie, A.C.; Miron, A. Prenylated phenolics as promising candidates for combination antibacterial therapy: Morusin and kuwanon G. Saudi Pharm. J. 2020, 28, 1172–1181. [Google Scholar] [CrossRef]
  59. Šamec, D.; Karalija, E.; Šola, I.; Vujčić Bok, V.; Salopek-Sondi, B. The Role of Polyphenols in Abiotic Stress Response: The Influence of Molecular Structure. Plants 2021, 10, 118. [Google Scholar] [CrossRef]
  60. Panche, A.N.; Diwan, A.D.; Chandra, S.R. Flavonoids: An overview. J. Nutr. Sci. 2016, 5, e47. [Google Scholar] [CrossRef] [Green Version]
  61. Yang, L.; Wen, K.-S.; Ruan, X.; Zhao, Y.-X.; Wei, F.; Wang, Q. Response of Plant Secondary Metabolites to Environmental Factors. Molecules 2018, 23, 762. [Google Scholar] [CrossRef] [Green Version]
Figure 1. Main bioactive compounds in Nepeta cataria L. and their uses.
Agronomy 12 00562 g001
Figure 2. Average yield per vegetation pot for N. cataria L. for all variants and both years with significant differences at 0.001 level indicated with letters.
Agronomy 12 00562 g002
Figure 3. ESEM micro-images of the variants with the glandular trichomes indicated with arrows.
Agronomy 12 00562 g003
Figure 4. (a) Mean diameters of glandular trichomes and (b) mean distances between glandular trichomes for N. cataria L. variants from 2021 with significant differences at 0.001 level indicated with letters.
Agronomy 12 00562 g004
Figure 5. Stomatal conductivity for N. cataria L. variants with significant differences at 0.001 level indicated with letters.
Agronomy 12 00562 g005
Figure 6. Concentrations of chlorophyll pigments in N. cataria L. studied variants with significant differences at 0.001 level indicated with letters.
Agronomy 12 00562 g006
Figure 7. Polyphenol content of N. cataria L. studied variants with significant differences at 0.001 level indicated with letters.
Agronomy 12 00562 g007
Figure 8. Flavonoid content of N. cataria L. studied variants with significant differences at 0.001 level indicated with letters.
Agronomy 12 00562 g008
Figure 9. Antioxidant activity of N. cataria L. studied variants with significant differences at 0.001 level indicated with letters.
Agronomy 12 00562 g009
Table 1. Salt percentage in the experimental variants.
Variantv1v2v3v4v5v6v7v8v9v10
ControlNaCl INaCl IINaCl IIINa2SO4 INa2SO4 IINa2SO4 IIIMixt. IMixt. IIMixt. III
Salt content
(mg/100 g of soil)
Cl018396000091930
SO4−200005085120254360
Table 2. Climatic conditions of 2020 and 2021 in the forest–steppe region of Moldavia, Romania.
Average Air Temperature (°C)Average Precipitations (mm)
Month/Years2020202120202021
March7.343.765.429.2
April11.018.356.444.8
May14.2915.28755.8
June20.9719.811583.7
July22.4223.271.671.3
August23.2720.9155.457.4
September19.2014.612.447.0
Table 3. Chemical analysis of Am (molic) horizon soil used for experiments.
Soil HorizonpHppmHumus
%
CaCO3
%
Ntotal
%
CorganicC/NCTSS
mg/100 g Soil
PP CorrectedK
Am7.931172293.494.770.1762.029.8453
Table 4. Pearson correlation coefficients for studied variants.
2020VariantPolyphenolAntioxidant ActivityStomatal ConductivityChlorophyll aChlorophyll bCarotenoidsYield
Variant1
Polyphenol0.49 ns1
Antioxidant activity0.41 ns0.41 ns1
Stomatal conductivity0.60 ns0.27 ns0.04 ns1
Chlorophyll a−0.43 ns−0.62 ns−0.30 ns−0.02 ns1
Chlorophyll b−0.65 *−0.56 ns−0.20 ns−0.19 ns0.90 **1
Carotenoids−0.41 ns−0.57 ns0.01 ns0.06 ns0.82 ns0.83 **1
Yield−0.63 **−0.32 ns−0.22 ns−0.68 *0.04 ns0.04 ns−0.04 ns1
2021VariantPolyphenolAntioxidant activityStomatal conductivityChlorophyll aChlorophyll bCarotenoidsYield
Variant1
Polyphenol0.44 ns1
Antioxidant activity0.41 ns0.92 **1
Stomatal conductivity0.62 ns0.34 ns0.18 ns1
Chlorophyll a−0.45 ns−0.39 ns−0.28 ns−0.09 ns1
Chlorophyll b−0.62 *−0.47 ns−0.35 ns−0.26 ns0.94 **1
Carotenoids−0.33 ns−0.32 ns−0.23 ns0.02 ns0.98 **0.86 **1
Yield−0.68 **−0.41 ns−0.26 ns−0.85 **−0.01 ns0.19 ns−0.16 ns1
* correlation is significant at the 0.05 level; ** correlation is significant at the 0.01 level; ns not significant.
Publisher’s Note: MDPI stays neutral with regard to jurisdictional claims in published maps and institutional affiliations.

