Article

Response of Potted Hebe andersonii to Salinity under an Efficient Irrigation Management

by
Daniel Bañón
1,*,
Juan José Alarcón
1,
María Jesús Sánchez-Blanco
1,
María Fernanda Ortuño
1,
Sebastián Bañón
2,
Beatriz Lorente
1 and
Jesús Ochoa
2
1
Department of Irrigation, Centro de Edafología y Biología Aplicada del Segura (CEBAS-CSIC), 30100 Espinardo, Spain
2
Department of Agronomical Engineering, Polytechnic University of Cartagena (UPCT), 30203 Cartagena, Spain
*
Author to whom correspondence should be addressed.
Agronomy 2022, 12(7), 1696; https://doi.org/10.3390/agronomy12071696
Submission received: 21 June 2022 / Revised: 11 July 2022 / Accepted: 16 July 2022 / Published: 18 July 2022

Abstract

:
Although the use of marginal-quality water can be an effective measure to alleviate water scarcity, it often contains a high concentration of salts that can compromise crop growth. As a result, farmers apply more water than necessary to leach salts away from the root zone, resulting in wasted water and the release of fertilizers into the groundwater. In this study, we assessed the effects of three salinity levels of irrigation water (1.8 dS m−1, 3.3 dS m−1, and 4.9 dS m−1) on the physiology and ornamental traits of Hebe andersonii cv. Variegata. The experiment was carried out with potted plants in a greenhouse for seven months. We also studied the feasibility of growing this cultivar without leaching salts. The results showed that Hebe plants can be grown without leaching using water up to 3 dS m−1. This setup produces plants with high water use efficiency and without reducing their ornamental value. Meanwhile, irrigation with 5 dS m−1 water reduced the quality of Hebe but did not compromise its physiological processes. The photosynthesis of Hebe under salinity conditions was mainly controlled by stomata, which was related to the level of salt stress and water status of the plant. Salinity had no significant effects on photosystem II, which can be explained by the fact that Hebe was able to dissipate the excess excitation energy as heat effectively. Hebe was able to avoid ion toxicity and maintain a suitable nutrient balance under the salinity levels tested in this experiment.

1. Introduction

Water availability has become a concern for most countries worldwide, but especially for those with arid or semi-arid climates [1]. Population growth, climate change, and the transition from dryland to irrigated agriculture are some of the recent global changes that are depleting water reserves worldwide. To prevent the depletion of freshwater resources, policymakers are taking legal action to force agricultural producers to use marginal-quality water for irrigation [2]. However, marginal water often contains a high concentration of dissolved salts that can compromise plant growth. Therefore, when irrigating with saline water, it is critical to control soil salinity to avoid decreasing plant quality and yield.
Salinity can compromise the ability of roots to absorb water and nutrients since high salt concentrations reduce the osmotic potential of soil water. Under these conditions, plants cannot absorb enough water to meet their evaporative demands and, as a result, plant water potential is reduced [3]. In this way, salinity inhibits plant development through a process that essentially generates a water stress effect [4]. Under moderate salinity, plants can absorb ions from the medium and store them in their tissues to reduce their water potential below the soil solution potential. By increasing the internal solute concentration, plants can maintain the potential gradient that drives water from the soil to the leaves. Osmotic adjustment, therefore, allows plants to grow in a saline medium while minimizing turgor loss. Although many plants can perform osmotic adjustments, this mechanism is not always cost-effective. Excessive accumulation of salt ions, such as Na+ and Cl, can induce the creation of reactive oxygen species and disrupt the electron transport chain in chloroplasts and mitochondria [5]. In addition, increasing toxic ions such as sodium and chloride can modify the concentration of essential nutrients. This ionic shift allows salt ions to interfere with nutrient uptake and transport processes, leading to nutrient instabilities in the plant. Ionic imbalances can lead to marginal chlorosis or leaf necrosis [6]. However, plants have mechanisms to regulate their ion balance and maintain normal metabolism. For example, plants can limit the uptake and translocation of toxic ions, such as Na+ and Cl, or prevent the uptake of metabolically necessary ions such as K+ [7].
The consequences of salt stress can be manifested in a multitude of physiological processes such as photosynthesis, protein and nucleic acid synthesis, enzymatic activities, or ion transport [8]. The most visible effects of salinity are manifested in many growth parameters, such as weight, height, width, leaf area, or stem length, as well as in certain visual quality parameters such as the number of shoots or the presence of flowers [9]. High salt stress can even lead to leaf scorch or necrosis, which is why knowing the tolerance to salinity of the species of interest is of utmost importance. Determining salt tolerance is one approach to avoiding salt stress in ornamental production [10]. While there are several definitions of salt tolerance, Parida and Das [11] defined it as the ability to withstand the effects of salinity without significantly affecting growth, yield, or leaf development. Therefore, it is common to determine salinity tolerance by comparing the decrease in biomass at a given salinity compared to non-saline conditions. However, in the case of ornamental plants, the loss of ornamental value must also be considered, as salt stress can affect aesthetic traits such as flowering, plant size, compactness, leaf greenness, and the presence of leaf spots [12]. Since salt tolerance varies widely between species or even between cultivars of the same species, crop-specific studies are needed to assess the suitability of a particular species for salt irrigation.
In this work, a hybrid of the genus Hebe (Hebe andersonii cv. Variegata) was selected as the study species. Although this genus is native to New Zealand, Australia, and South America, it has great potential for ornamental purposes in the Mediterranean climate. Hebe spp. is an evergreen shrub that usually grows between 50 and 60 cm in height. This genus is of great interest for ornamental horticulture worldwide, being of particular importance in some European countries such as the United Kingdom [13]. Hebe spp. is used for rock gardens, borders, and flower beds, and in pots for patios, balconies, and courtyards. The leaves of H. andersonii cv. Variegata are opposite, oval, and variegated (yellow-green color), while the flowers are purple and bloom in clusters at the apex of the stems. In this context, Morris [14] pointed out that the color, fleshy texture, and waxy cuticle of the leaves help the plant retain moisture and tolerate drought. A recent study has indicated that H. andersonii cv. Variegata can successfully grow under low substrate moisture and non-leaching conditions [15].
Although Hebe is commonly grown in nurseries, little is known about the effects of salinity on its growth, let alone an understanding of the basic physiological mechanisms underlying such effects. This lack of information, combined with the growing demand for sustainable irrigation practices, encouraged the aim of this study to evaluate the effects of non-leaching saline irrigation on potted Hebe. This irrigation strategy would save water and fertilizers, enabling the production of Hebe with reduced environmental impact, as the effluents of leaching would not be released into the environment. However, progressive salinization of the substrate could limit plant growth and even damage plants, so the interaction between physiology and irrigation management will be critical to assessing the feasibility of Hebe production under salinity.

2. Materials and Methods

2.1. Plant Material and Cultivation Conditions

Hebe plants (Hebe andersonii cv. Variegata) were supplied by a local nursery (Viveros Bermejo S.L., Murcia, Spain). Seedlings, 8–10 cm in size, were transplanted into 2.5 L black plastic pots, 15 cm high and 17 cm wide. The pots contained a commercial substrate mixture of peat, coconut fiber, and perlite (67/30/3, v/v/v) (Fertiberia S.A., Madrid, Spain). The moisture retention properties of the substrate were: 63.2% maximum water holding capacity, 28.1% readily available water, and 8.6% reserve water.
The experiment was carried out at the Tomás Ferro experimental farm located at the Polytechnic University of Cartagena (37°35′ N, 0°59′ W). The pots were grown in a polycarbonate greenhouse with a semicircular roof (15 m long × 8 m wide, 3.5 m high on the side, and 5.5 m in the center). The pots were arranged inside the greenhouse on the inner squares of a metal grid supported by concrete blocks that kept the plants 80 cm above the ground. Temperature and relative humidity were recorded every 30 min with a LOG 32 TH data logger (Dostmann electronic GmbH. Wertheim-Reicholzheim, Germany). The vapor pressure deficit (VDP) was determined using the equation used in [16]. The mean temperature and VPD data are shown in Figure 1.

2.2. Treatments and Irrigation Parameters

The treatments consisted of irrigating the Hebe plants for 22 weeks with water at three salinity levels (SL): 1.8 dS m−1 (control), 3.3 dS m−1 (SL3), and 4.9 dS m−1 (SL5). Self-compensating and anti-draining emitters with a flow rate of 1.5 L h−1 (Netafim Ltd., Israel) were used. A straight plastic shaft was inserted into the substrate of each pot and connected to an emitter through a 50 cm × 4 mm tube (two emitters per pot).
Irrigation was controlled using soil moisture sensors (EC5; METER Group, Inc., Pullman, WA, USA), which were connected to a CR1000 datalogger (Campbell Scientific, Ltd., Logan, UT, USA) through a multiplexer (Campbell Scientific, Ltd., Logan, UT, USA). Three solenoid valves connected to an SMD-CD16D multicontrol port multiplier (Campbell Scientific, Ltd., Logan, UT, USA) were used to allow AZ8222-2C-5DME relays (Zettler Components Inc., Aliso Viejo, CA, USA) to open the solenoid valves associated with the 1000 L irrigation tanks of each treatment. The entire electronic system was installed in the center of the greenhouse inside a waterproof box. A charger and a 12 V battery were provided to allow continuous operation of the system in case of a power failure.
The sensors were fully inserted vertically in the east-facing quadrant of the root ball, between two emitters. Three sensors per treatment were installed in random pots, with one sensor per pot. The volumetric water content (VWC) of the substrate was estimated by measuring the voltage of the growing medium (EC5 output), using a substrate-specific calibration equation. The calibration equation was obtained according to Valdés et al. [12]: VWC = 4.942 mV − 0.676, r2 = 0.98. From 9 a.m. to 2 p.m., the datalogger compared VWC every hour to a specific irrigation set-point (Figure 2), and when the VWC was below the set-point, a 1 min watering event was applied (50 mL of water per pot). The total applied water was the result of multiplying the total number of irrigation events by the volume of each even. In the absence of leaching, total water applied coincided with water consumption, and daily evapotranspiration was calculated by dividing water consumption by growing days.
The chemical composition of the nutrient solutions for the three treatments is shown in Table 1. These were formed by adding a commercial complex fertilizer with nutrient balance 4-1.7-4.5-4.5-4-1.4 (N-P2O5-K2O-CaO-MgO) to the irrigation water. The concentration of fertilizer applied in each tank corresponds to an increase in the EC of the irrigation water by 0.5 dS m−1. The final EC levels of the irrigation water were obtained by adding the corresponding amount of salt (NaCl) until the desired level was reached. In all cases, nitric acid was used to reduce the pH of the irrigation solution.

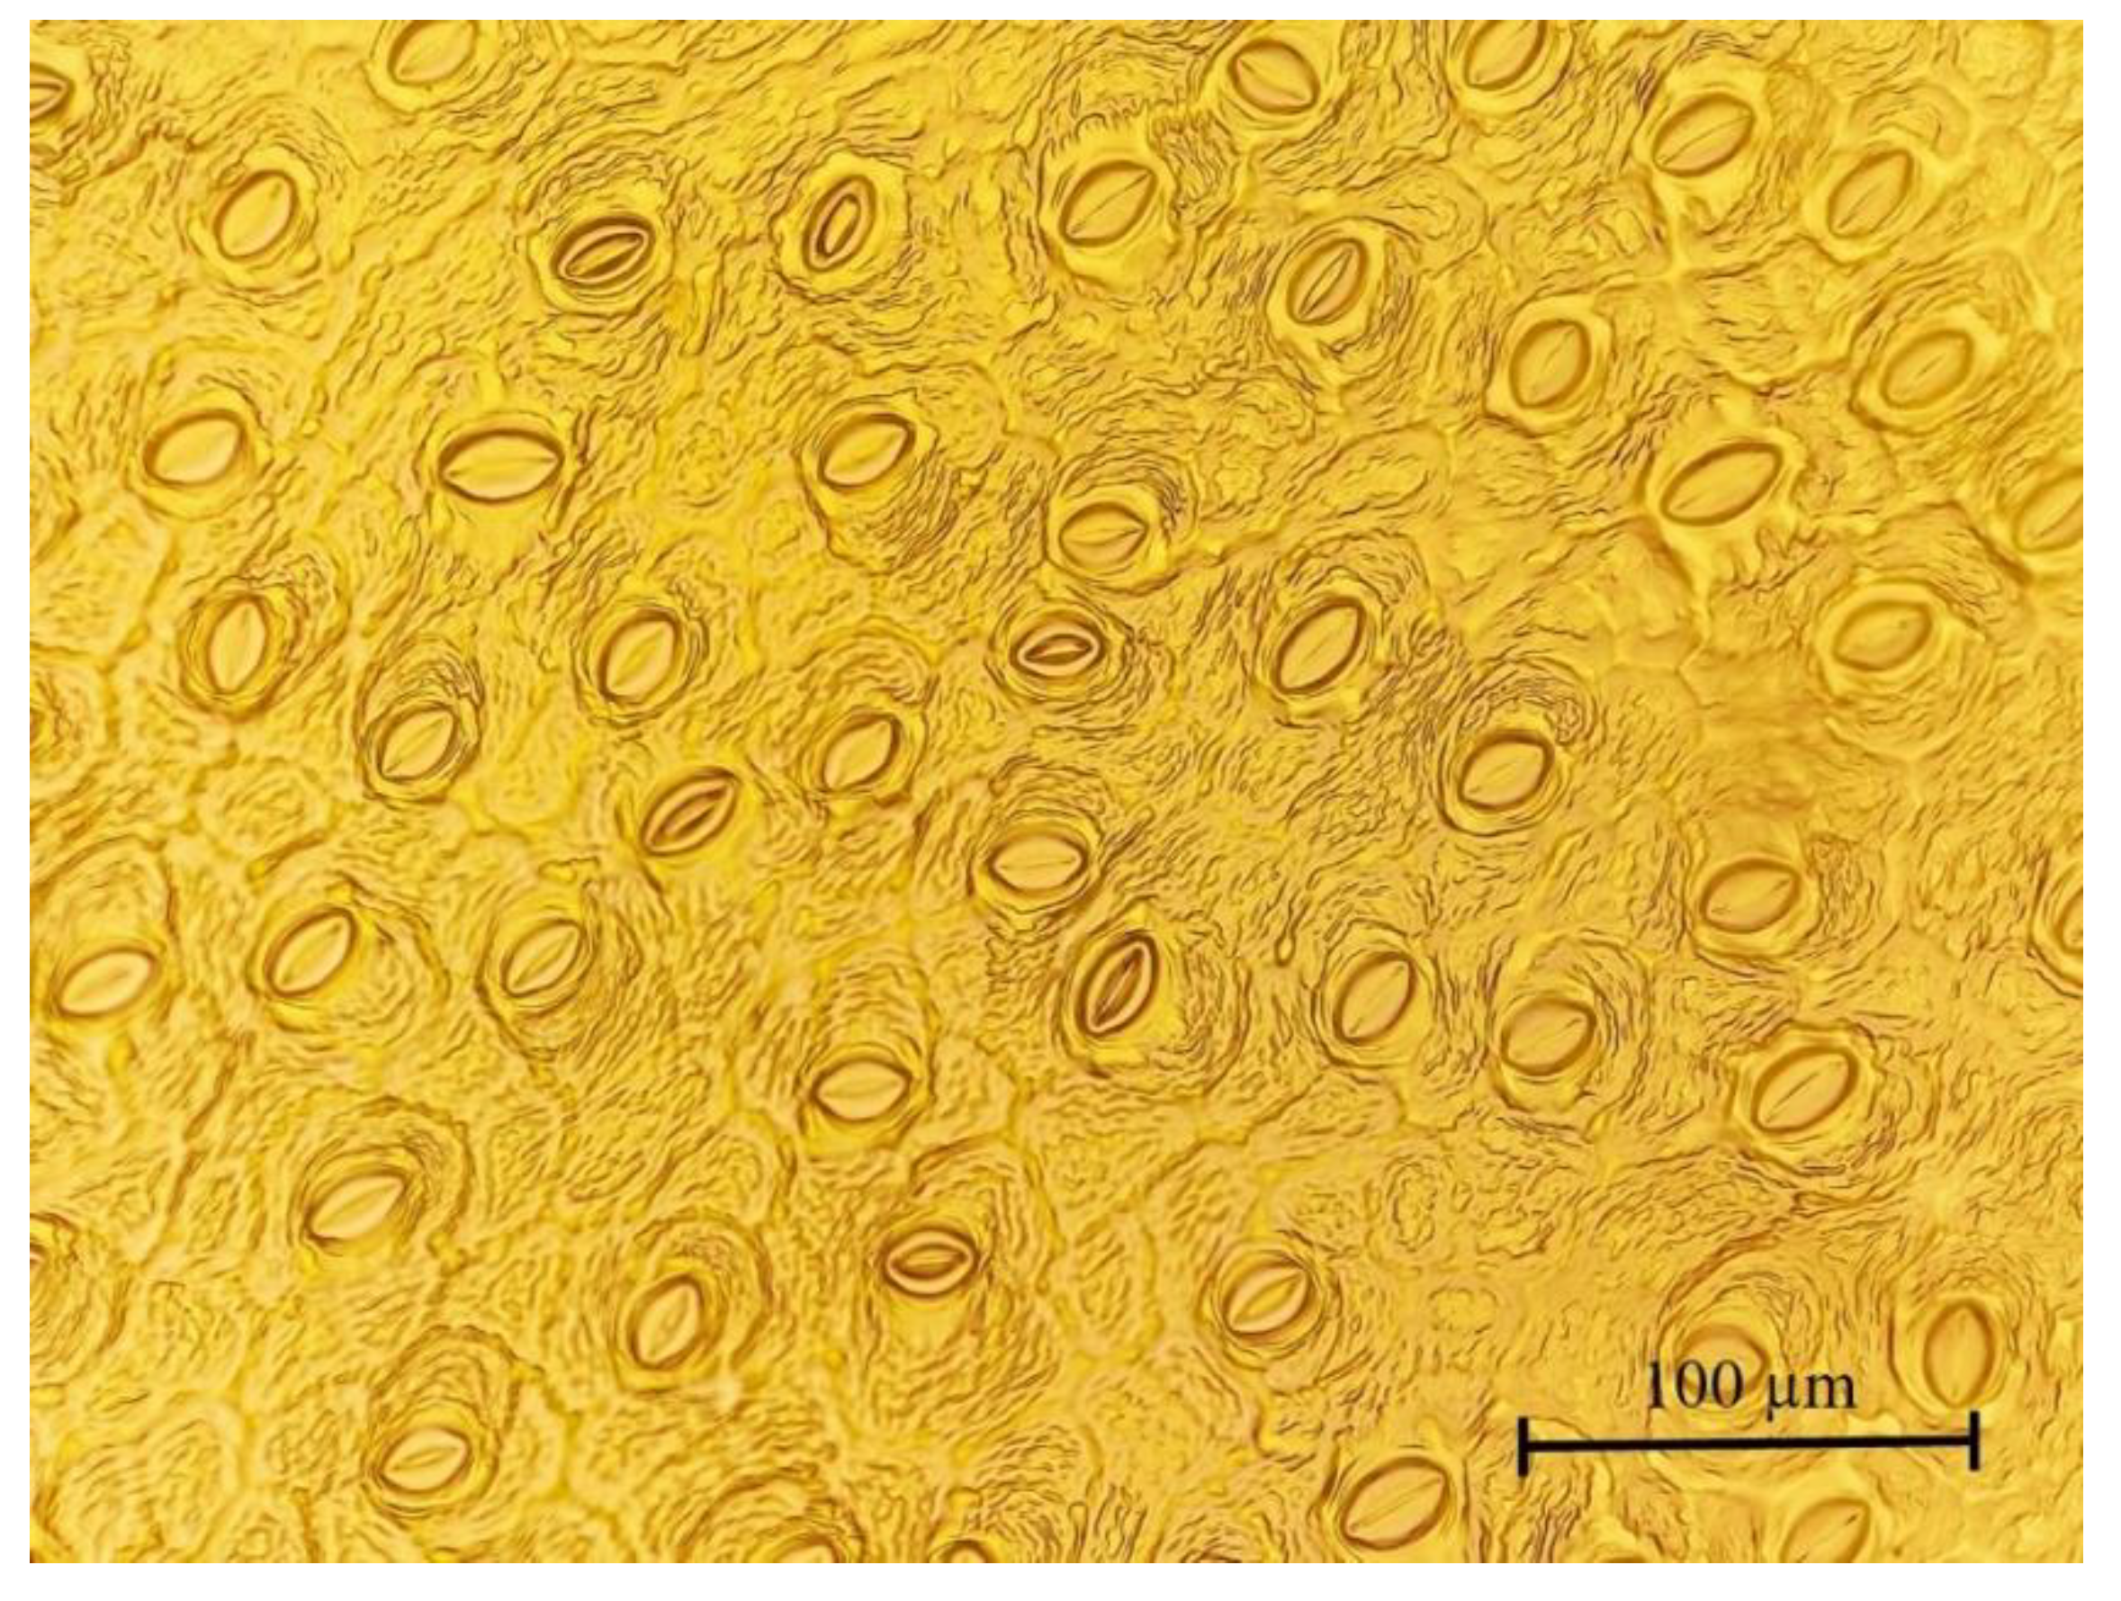
2.3. Plant Growth, Foliar Chlorophyll Content, and Stomatal Features

At the end of the experiment, a growth index was measured on six plants per treatment, calculated as (plant width A + plant width B + plant height)/3 [17]. Plant width A was measured at the widest part of the plant, and a second measurement was taken perpendicularly (plant width B). Plant height was measured from the base of the plant at the substrate surface to the most apical growth. The number of shoots per plant and the number of inflorescences per plant were also measured.
The dry biomass (dry weight) of the leaves, stems, and roots was determined for 10 plants of each treatment. The roots were cleaned with an awl and tweezers, trying to keep them as clean as possible. The samples were then placed in a natural convection oven at 65 °C for 4 days until total loss of moisture. Finally, the dry weight of leaves, stems, and roots was determined with an analytical balance (Mod. TE2145, Sartorius Weighing Technology, GmBH, Goettingen, Germany). The ratio between the plant dry weight produced between the beginning and the end of the experimental period, and the water applied during the same period was calculated as water use efficiency (WUE).
Ten plants per treatment were defoliated to record the number of leaves per plant. The average leaf area was then measured using Easy Leaf Area software [18], which analyses the area of the leaves in digital photographs by counting pixels and referring them to the image of a red square of a known area. Fifteen leaves per plant were randomly chosen for this purpose. The leaf area was determined by multiplying the average leaf area by the number of leaves per plant. The specific leaf area (SLA) was obtained by dividing the leaf area by the dry weight.
Leaf chlorophyll content and stomatal features were measured at the end of cultivation. Leaf chlorophyll quantification was carried out by solvent extraction of leaves per treatment. The extraction consisted of diluting 50 mg of fresh leaf in 5 mL of N,N-dimethylformamide and leaving it in agitation for one day at 4 °C and in the dark. The resulting extract was measured in a Uvikon 940 spectrophotometer (Kontron Instruments AG, Zürich, Switzerland) at 647 nm to quantify chlorophyll-a, and at 664 nm for chlorophyll-b. The actual chlorophyll concentrations were determined using the equations reported by Romero-Trigueros et al. [19]. Five leaves per treatment were collected from the middle of the shoots to determine the stomatal density and stomatal pore area. The leaves were fixed with nail polish and, after drying for 15 min, a transparent adhesive tape was adhered to the leaf surface, and then peeled off. The adhesive tape of the leaf print was affixed to a slide for study under an Olympus BX51optical microscope (Olympus, Tokyo, Japan) at ×400 magnification. The image analysis software ImageJ (LOCI, University of Wisconsin, Madison, WI, USA) was used to count the stomata in the different photographs taken. The area of an ellipse was used to calculate the stomatal pore area: A = π (a × b), where a and b are the semiaxes of the ellipse (the half of the vertical and horizontal diameters).

2.4. Leaf Water Potential

A Scholander-Hammel Soil Moisture pressure chamber, mod. 3000 (Soil Moisture Equipment Corp., Goleta, CA, USA), was used to measure leaf water potential. Six replicates were used in each treatment to determine leaf water potential (Ψl), leaf pressure potential (Ψp), and leaf osmotic potential at maximum saturation (Ψ100s). Leaf water potential measurements were performed on mature leaves at midday. The measurements were made during the central hours of illumination at seven growth stages throughout the experimental period (Figure 1).
The Ψp was calculated as the difference between leaf water and leaf osmotic potential. The osmotic potential was measured with a Wescor 5520 vapor pressure osmometer (Wescor Inc., Logan, UT, USA). Freshly cut leaves were wrapped in aluminum foil, placed in liquid nitrogen to rupture their cell membranes, and then stored at −30 °C. The leaves were then thawed at room temperature and squeezed to extract a drop which was used to measure the osmotic potential. The leaves were placed into beakers of distilled water for 24 h at 4 °C in the dark until they reached maximum turgor to determine the osmotic potential at maximum saturation (Ψ100). Subsequently, after being dried with filter paper, they were wrapped in aluminum foil and frozen in liquid nitrogen using the same method as described above for the osmotic potential.

2.5. Gas Exchange and Photochemical Efficiency of the Photosystem II (PSII)

Stomatal conductance (gs) and net photosynthetic rate (Pn) were determined at midday on the leaves of six plants per treatment. A portable gas exchange meter, LICOR LI 46400 (LI-COR Inc., Lincoln, NE, USA), was used. Intrinsic water use efficiency was estimated from the Pn/gs ratio. Measurement parameters were adjusted to a CO2 concentration of 400 ppm, an airflow rate of 500 µmol s−1, and photosynthetically active radiation (PAR) of 1000 µmol m−2 s−1 [20]. These measurements were performed on the same days and on the same plants on which leaf water potentials were measured.
At the end of the experiment, chlorophyll fluorescence parameters were measured with a pulse-modulated fluorometer (Mod. FMS-2, Hansatech Instruments, Norfolk, UK). The parameters determined were as follows: (i) maximum quantum yield of PSII (Fv/Fm), (ii) effective quantum yield of PSII (éPSII), and (iii) non-photochemical quenching (NPQ). The éPSII was used to estimate the electron transport rate (ETR) according to the following equation: ETR = éPSII × PFD × 0.84 × 0.5, where PFD represents the photon flux density incident on the leaf, 0.84 represents the leaf absorbance, and 0.5 represents a factor implying an equal distribution of energy between photosystems II and I. Each leaf was dark-adapted with a shutter-plate leaf clip 30 min before each measurement, following the method described by Sheng et al. [21]. Once in the dark, the minimum fluorescence (Fo) was measured and a light irradiation pulse of 5000 μmol m−2 s−1 was administered for 0.7 s to measure the maximum fluorescence of the dark-adapted leaf (Fm). The sample was then irradiated with actinic light of 400 μmol m−2 s−1 for 150 s to measure fluorescence under stationary light (Fs). Next, radiation of 5000 μmol m−2 s−1 was administered for 0.7 s to determine the maximum fluorescence of the light-adapted leaf (Fm′). Finally, the actinic radiation was switched off and far-red radiation was switched on for a period of 5 s to reoxidize the centers of PSII. Then, the minimum fluorescence of the light-adapted leaf (Fo′) was measured. Fv/Fm, éPSII, and NPQ were estimated from Fo, Fm, Fs, Fm’, and Fo’, according to the equations described in Brestic and Zivcak [22].

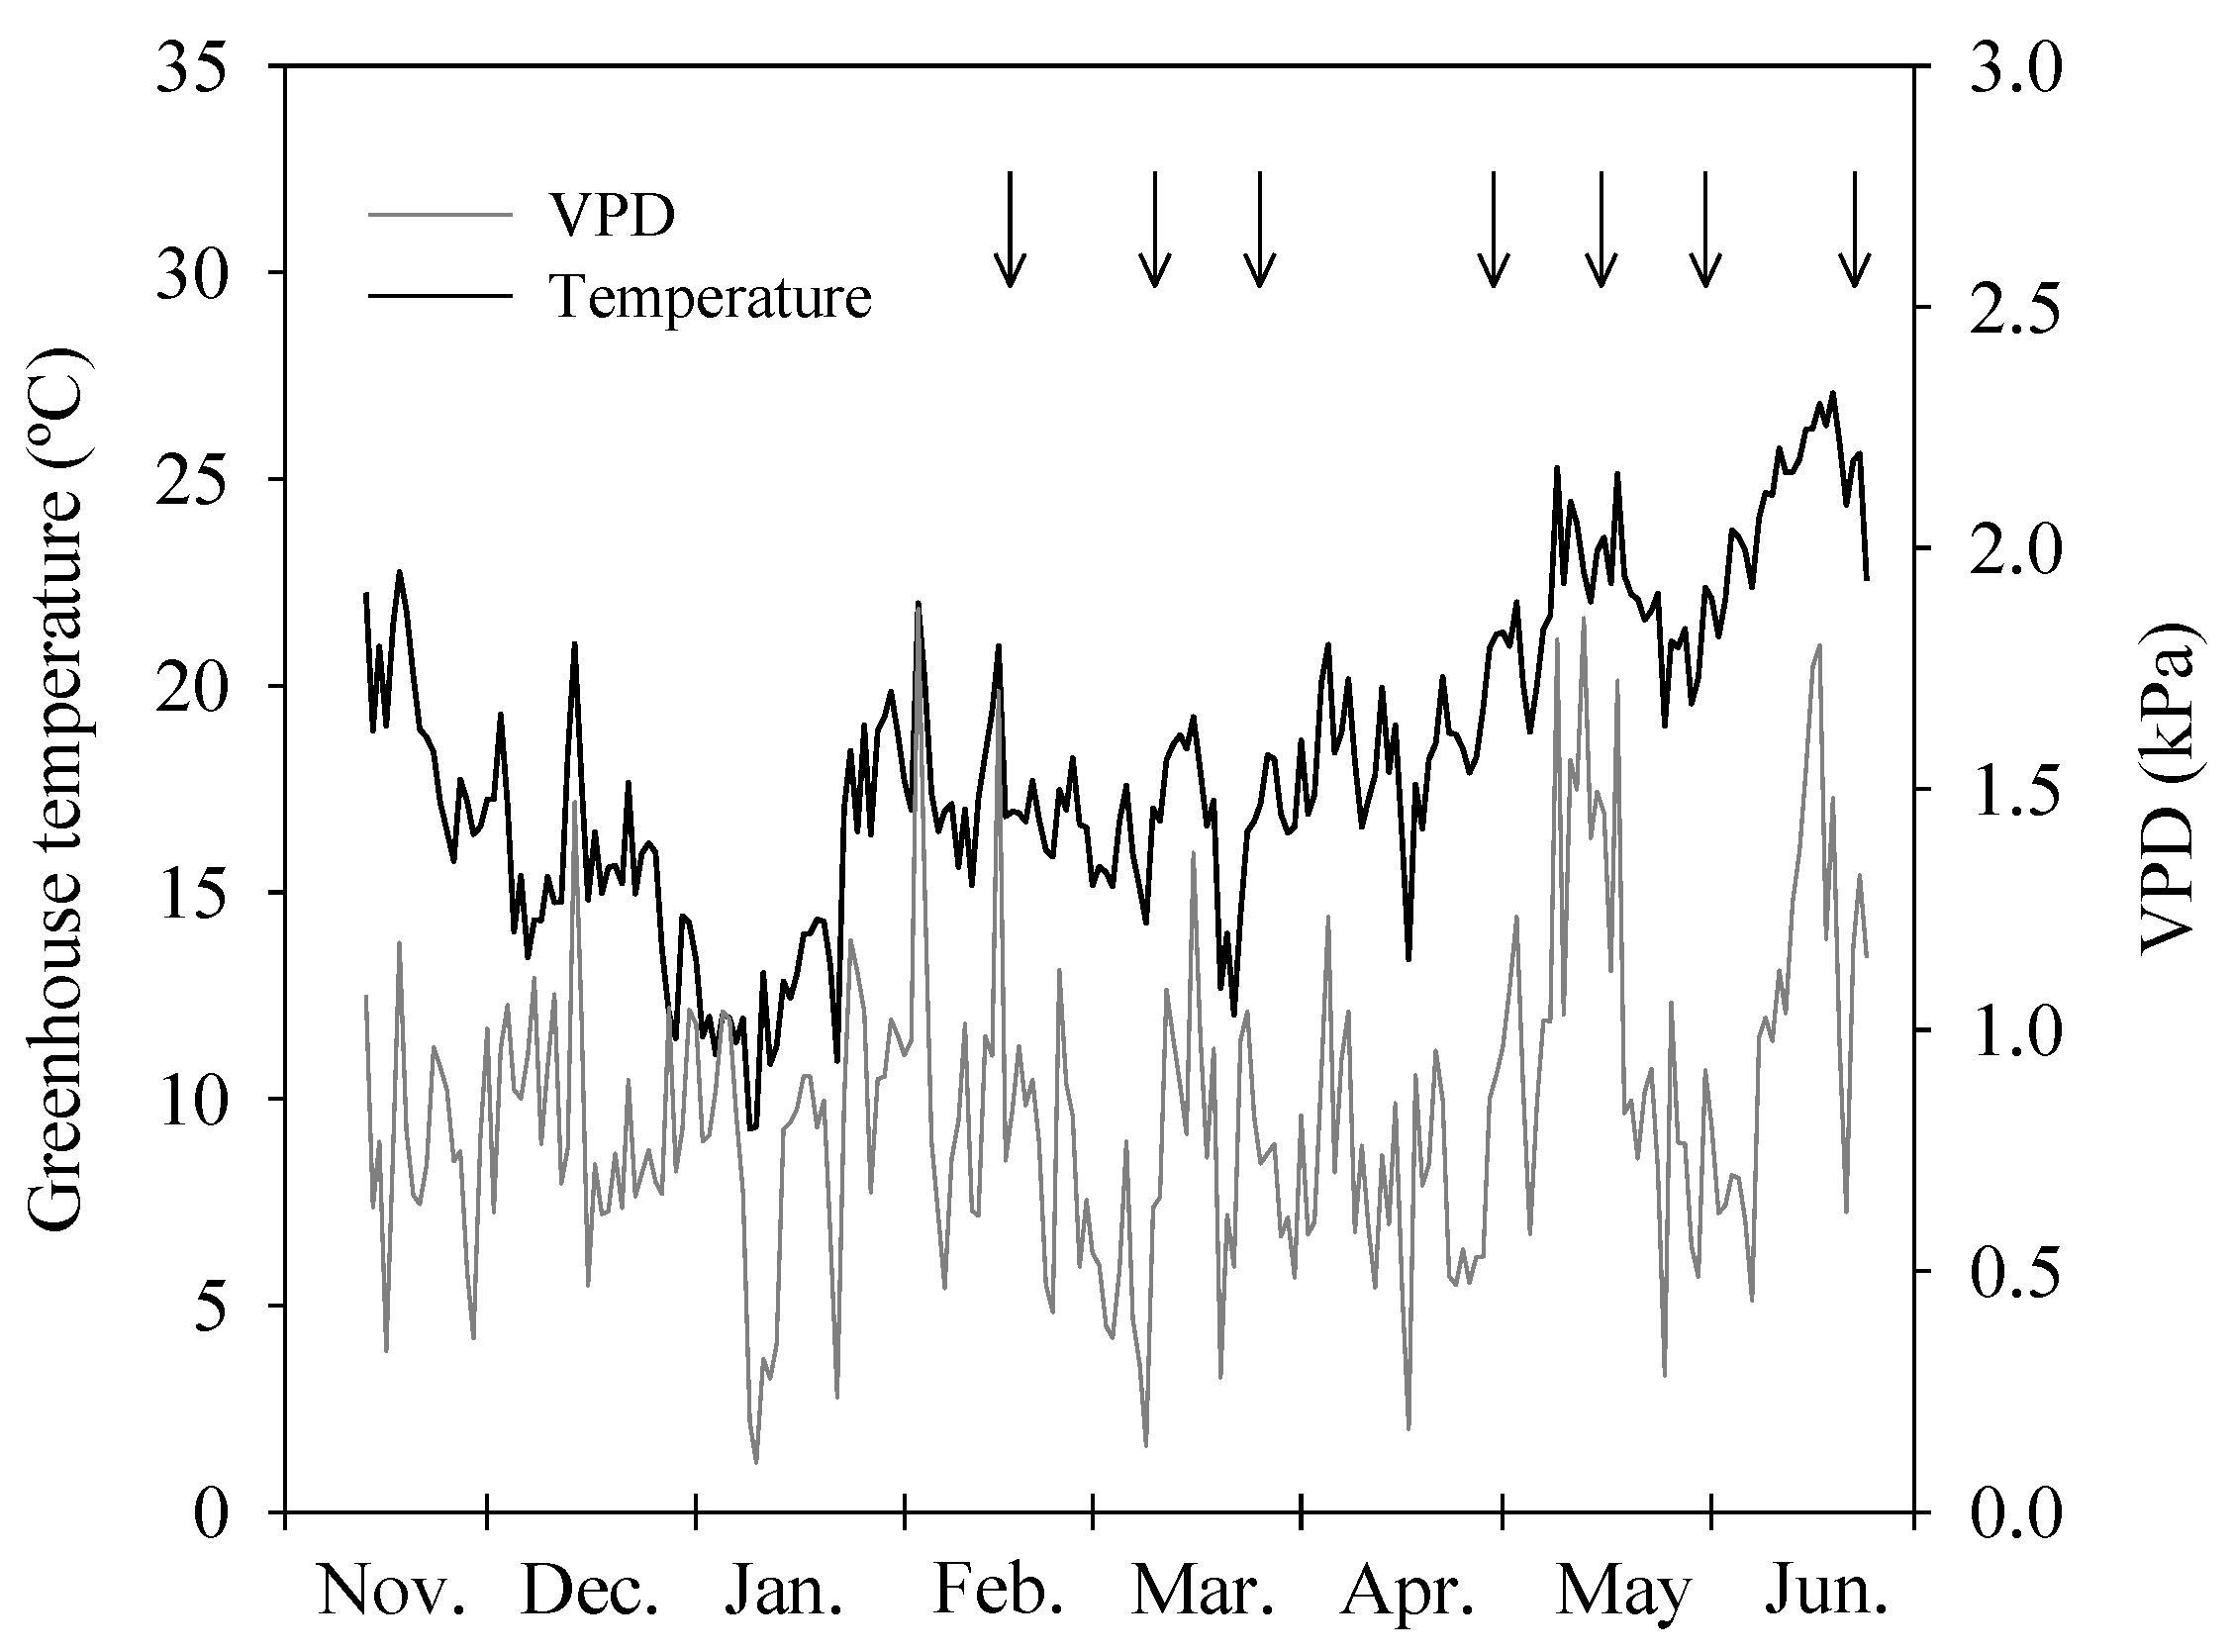
2.6. Leaf Temperature

After performing the gas exchange measurements, leaf temperature was measured with a FLIR thermal camera (Mod. E50, ThermaCam System, Inc., Danderyd, Sweden). Four thermal images were taken on six plants per treatment so that 24 temperature measurements were obtained per treatment. At the beginning of each series of measurements, background temperature, distance from the camera to the canopy, air temperature, and relative humidity were considered to compensate for the effects of atmospheric infrared transmission. The emissivity for leaf measurements was set at 0.96. The background temperature was obtained by measuring the temperature of a crumpled aluminum foil at a position and distance similar to the leaves of interest with the emissivity of 1.0. The distance between plant and camera was 0.5 m. Finally, the images were processed with ThermaCam Researcher Professional 2.10 software (FLIR Quick Report, Danderyd, Sweden).

2.7. Plant Mineral Content

The content of mineral ions in leaves, shoots, and roots was determined in six pots per treatment. Leaves, shoots, and roots were oven-dried and ground to a fine powder. Inorganic elements (Na+, K+, P, Ca2+, and Mg2+) were determined using inductively coupled plasma emission spectrophotometry (IRIS Intrepid II XDL ICP-OES, Thermo Fischer Scientific, Waltham, MA, USA). Plant ions were extracted by mixing 100 mg of dry powder with 40 mL of deionized water. The mixture was stirred for 30 min in a rotary shaker at 30 rpm and passed through a 0.45 μm PTFE syringe filter. Chloride concentration was analyzed in the aqueous extract using a chloride analyzer (Mod. 926, Sherwood Scientific, Cambridge, UK), and total nitrogen was measured with a nitrogen analyzer (Mod. Flash EA 1112, Thermo Fischer Scientific, Waltham, MA, USA).

2.8. Experimental Design and Statistical Analysis

Plants were arranged on crop benches in a randomized block design. Each of the three treatments (control, SL3, and SL5) was divided into three blocks, and each block was populated randomly with 10 plants (30 plants for treatment). Differences were assessed by one-way analysis of variance (ANOVA) using Statgraphics Centurion (v.XVI, StatPoint Technologies, Inc, Warrenton, VA, USA). When the ANOVA indicated significant effects, means were separated by the least significant difference (LSD) test. Plotting was performed with the SigmaPlot program (v.14.5, Systat Software Inc., San Jose, CA, USA).

3. Results and Discussion

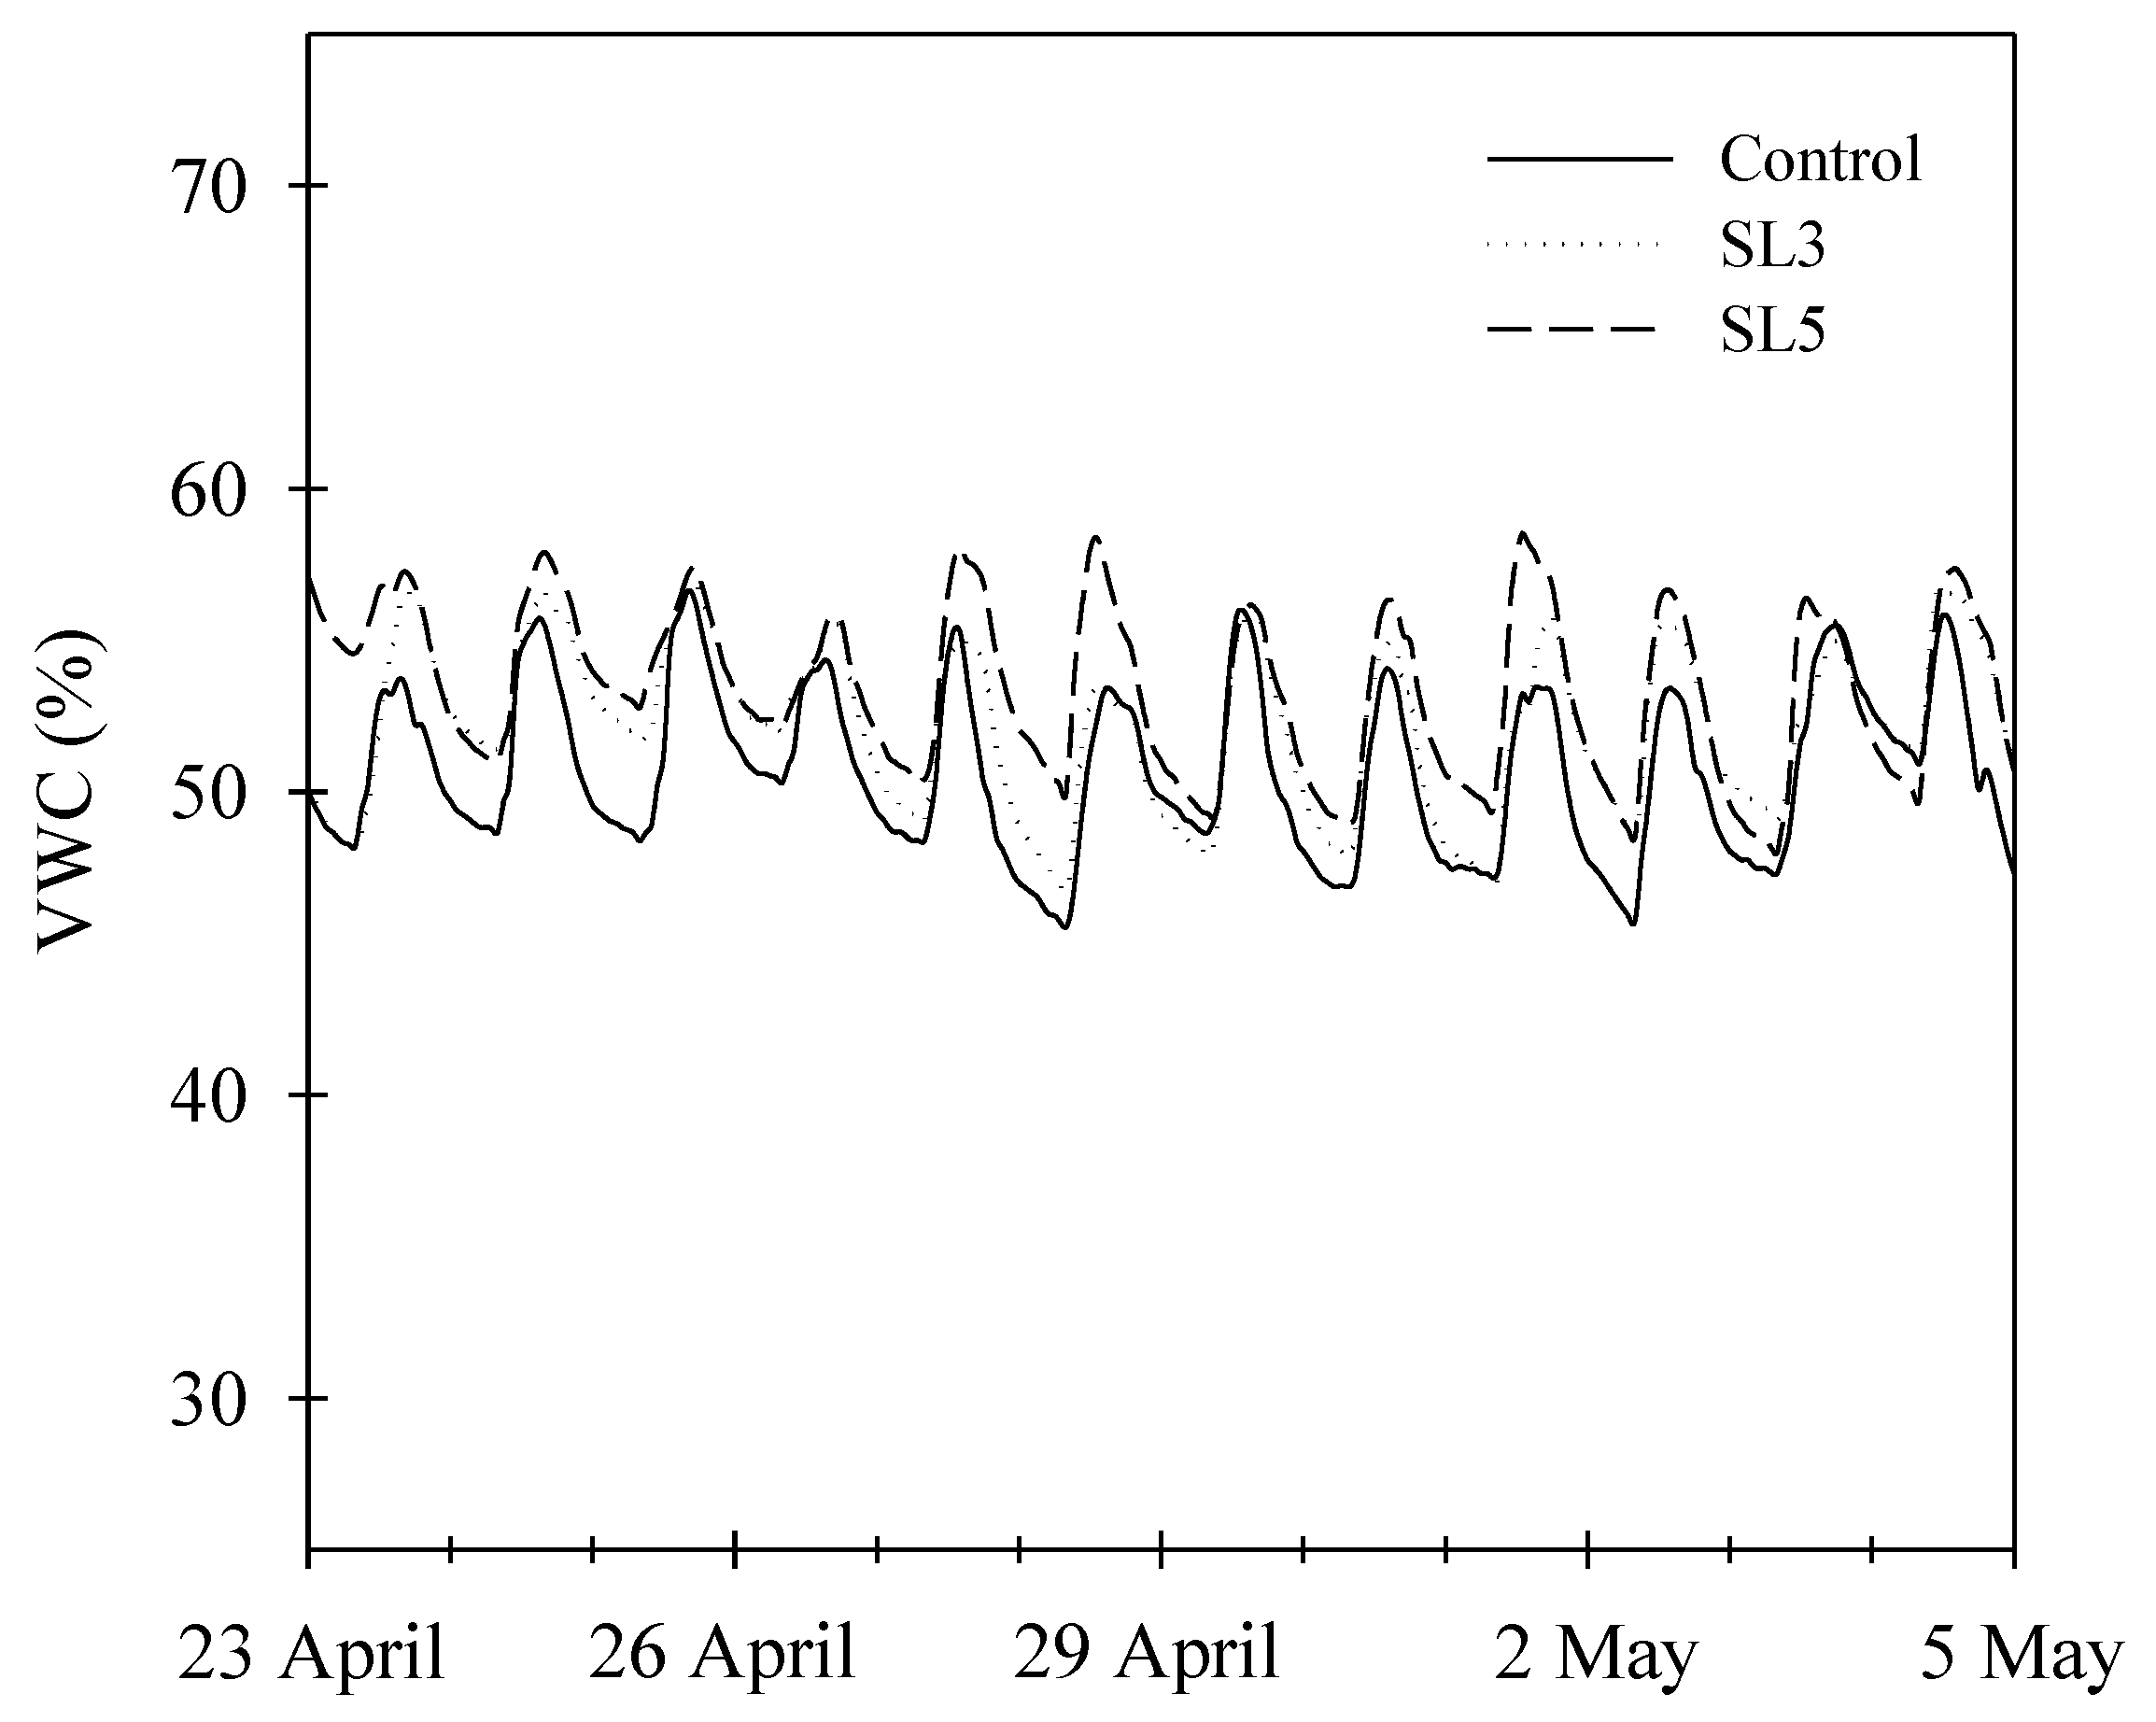
3.1. Water Consumption and Water-Use Efficiency

The three irrigation treatments maintained an average VWC of 50% throughout the experiment (Table 2). However, the salinized treatments reduced the total water applied compared to the control, with 25% less water for SL3 and 47% less water for SL5. A variety of published papers have reported that high salinity levels decrease plant water consumption [23,24,25,26].
SL3 and SL5 consumed less water because (i) salts decrease the saturation vapor pressure of irrigation water, thus reducing the evaporation rate [27,28], and (ii) salinized plants take up less water from the substrate as a consequence of the osmotic stress induced by salts [8,29]. Additionally, the reduction in leaf area [28] and the closure of stomata due to salt stress may have slowed the water uptake of Hebe [30,31]. These adaptations aim to protect plants from more severe or longer stresses in the future while limiting the translocation of toxic ions to the aerial part [32]. As the irrigation program did not produce any leaching, applied water was equal to evapotranspiration, and consequently, both varied similarly (Table 2).
In general, all treatments had a high water use efficiency (WUE), as no water was wasted through leaching. Salinity normally improves WUE as it reduces water consumption but, as it also reduces growth, this behavior does not always occur. The ideal case is that the decrease in growth is less than the decrease in water consumption so that the ratio (WUE) increases. This is what happened in this experiment as SL3 plants improved WUE by 7% and SL5 by 32% compared to the control (Table 2). A similar response to salinity was reported by Omamt et al. [33] and Lee and Van Iersel [34], who found that WUE increased with increasing NaCl concentrations in Amaranthus sp. and Chrysanthemum morifolium, respectively. However, there are contradictory observations in the literature regarding the effects of salinity on WUE. García-Caparrós et al. [35] found that WUE of Aloe vera and Kalanchoe sp. was reduced when exposed to salt stress. These contrasting results suggest that the response of WUE to salt stress is highly dependent on the species, which has led to its association with high tolerance to salinity [35,36]. Plants that can improve their WUE under salt stress, without significantly affecting their growth and ornamental quality, are likely candidates for potting, gardening, or landscaping. In this case, the WUE results suggest that Hebe can cope with salinity successfully.

3.2. Plant Growth and Visual Quality

The growth index indicated that plants under saline irrigation were smaller than control plants (Table 3). However, SL3 plants did not change their height, while SL5 plants reduced their height and width in a similar proportion compared to the control. At the end of the growing period, only SL5 had fewer shoots and inflorescences per plant than the control (11.7%, and 22% less, respectively) (Table 3). The reduction in the number of inflorescences, shoots, and plant size caused SL5 to lose ornamental quality.
The dry weights of leaves, stems, and roots were lower in SL3 and SL5 compared to the control (Table 3). Dry biomass production has been used by other authors as an indicator of plant sensitivity to salinity [37]. Miralles et al. [38] found similar responses to salinity in Hydrangea, with a large reduction in plant dry weight when water of 5.25 dS m−1 was used. The reduction in dry weight was greater in the roots than in the canopy, resulting in a net decrease in the root to shoot ratio (Table 3). An increased root to shoot ratio is a mechanism by which plants maximize water uptake (by increasing the root surface) and minimize transpiration (by reducing leaf area). The response found in Hebe, although it did not improve water uptake capacity, can be understood as a mechanism to limit the uptake of more saline ions and their toxicity [39].
The number of leaves per plant decreased as the salinity of irrigation water increased (Table 3). However, only SL5 had a significantly lower average blade area than the control. Leaf area was reduced by 25% (SL3) and 45% (SL5) compared to the control. Lower plant leaf area limits the rate of CO2 fixation, resulting in lower growth rates, which would be in accordance with lower biomass production (Table 3). The specific leaf area (SLA) followed the same pattern as the leaf area (Table 3). Nandy et al. [40] pointed out that low SLA values are typical in plants growing in stressful environments. A decrease in SLA means thicker and/or denser leaves. When density or thickness increases, leaves have higher photosynthetic activity per unit weight due to a higher density of pigments, proteins, and other metabolites [41], and lower water loss due to less surface available for transpiration [42]. Previous studies indicated that potted Hebe plants exposed to severe water stress increased their leaf thickness [15].
It has been suggested that reduced stomatal density and pore size may be a mechanism to reduce plant transpiration under saline conditions [43,44]. However, Hebe showed no significant differences neither in the stomatal density nor in the pore area (Table 3). The surface structure of Hebe leaves as seen from the optical microscope (×400) is shown in Figure 3. Likewise, none of the treatments promoted leaf abscission. Leaf abscission is an adaptation to salt stress that favors osmoregulation and the concentration of photosynthates and nutrients in the remaining leaves [45,46]. These results suggest that Hebe has an acceptable resistance to salinity, and this plant may require more severe or prolonged salt stress to develop such adaptive mechanisms.
The leaves in SL5 had a lower chlorophyll content compared to the control (10% lower), while SL3 had no different chlorophyll content than the control (Table 3). Salinity is known to accelerate the degradation of leaf chlorophyll and reduce chlorophyll synthesis rates, resulting in leaf yellowing or necrosis [47]. Niu et al. [48] observed a significant decrease in relative chlorophyll content (SPAD) in leaves of several species with increasing salinity. However, no chlorosis or apical burns were observed in the leaves of SL5 plants, which maintained their visual quality. Reductions in chlorophyll content under salinity have been related to salt-sensitive species in other studies [49,50].

3.3. Mineral Ions and Substrate Solution EC

The nitrogen content in leaves, stems, and roots of Hebe did not change significantly by salinity (Table 4). High concentrations of saline ions in plant tissues usually interfere with the uptake and assimilation of nitrogen ions such as nitrate and ammonium, resulting in a reduction of nitrogen content [51,52,53]. However, this did not occur in Hebe, perhaps because the effect of salinity on nitrate uptake depends on the species and growth conditions.
A similar response for nitrogen was found for phosphorus. The literature on the interaction between phosphorus and salinity has yielded mixed results. There is evidence that salinity can cause an accumulation of phosphorus to toxic levels, induce phosphorus deficiency, or have no effect [54], as was the case for Hebe.
Hebe plants decreased the concentration of potassium in leaves, shoots, and roots as salinity increased (Table 4), suggesting that Hebe struggled to incorporate potassium into its tissues in the presence of salinity. Potassium plays a vital role in osmoregulation in cells and translocation of essential nutrients in the plant [55]. Therefore, even small deficiencies of this ion can have a large impact on the overall quality of the crop. Al-Karaki [56] and Navarro et al. [57] found that salinity reduced the concentration of potassium in the leaves of tomato and strawberry tree, respectively, while Grieve and Poss [58] reported that its concentration in sunflower leaves increased in response to salinity.
The concentrations of calcium and magnesium decreased similarly with salinity in all Hebe tissues (Table 4). In this case, Hebe showed a behavior that coincides with other authors. Salachna and Zawadzi [59] found that calcium in Ornithogalum sp. plants decreased when irrigated with high NaCl irrigation solutions. However, other researchers such as Acosta-Motos et al. [60] have described the opposite effect when growing Eugenia sp. under salinity increased calcium content in all organs. Similarly, Fornes et al. [61] found higher magnesium contents in Petunia and higher calcium contents in Calceolaria in response to salinity.
Chloride levels increased significantly in all organs as salinity increased (Table 4). Although an essential nutrient, chloride can be toxic when its concentration exceeds certain thresholds. For reference, Colmenero-Flores et al. [62] indicated that concentrations >10 mg g−1 can be harmful to many species. Chloride concentrations in control leaves were above 10 mg g−1, while SL3 and SL5 surpassed three and five times this threshold, respectively. Consequently, it can be assumed that Hebe can withstand high chloride levels without foliar damage. The higher chloride content in the shoot relative to the leaves and roots indicates that Hebe compartmentalizes ions in shoots to reduce their toxicity to other more sensitive organs, such as the leaves [63].
Sodium content increased in leaves and roots but decreased in shoots (Table 4). Nevertheless, plants are usually more sensitive to the K+/Na+ ratio rather than to the absolute content of sodium [64]. The ability of plants to maintain a high K+/Na+ ratio is probably one of the key characteristics of a salt-tolerant cultivar [65]. Salinity reduced the K+/Na+ ratio in all organs of Hebe. However, this ratio was higher in control leaves than in other ornamental species [66]. It is usual to compare the K+/Na+ ratio with 1, as values above that number usually ensure that potassium-dependent cellular processes are functioning properly [67]. Control plants presented K+/Na+ ratios in the leaves and roots well above this value, while in the shoot it was below 1. Salinity decreased the K+/Na+ ratio in all organs of Hebe, but even the SL5 plants were able to maintain a K+/Na+ ratio in leaves above 1 (Table 4).
The EC1:2 of the substrate at the end of the growing period increased with salinity (Table 5). The combination of no leaching and saline water throughout the experiment led to these high EC levels in the substrate. Values such as these have been related to stressful conditions that normally damage plants. In this regard, Camberato et al. [68] reported that EC1:2 values higher than 1.76 dS m−1 reduced growth and generated marginal leaf burns and wilting in most ornamental plants. In the case of Hebe, the average substrate EC during the experiment must have been lower than the value on the last day (the day it was measured), which justifies, together with the resistance of Hebe to salinity, that neither leaf damage nor wilted plants were observed. The increase in substrate EC was mostly due to the increased Cl and Na+ concentrations, as the concentrations of other important ions (K+, NO3, Ca2+, SO42+) decreased in the saline treatments (Table 5). This reduction of the latter ions could be due to antagonism between saline ions and nutrients at the root surface [51].

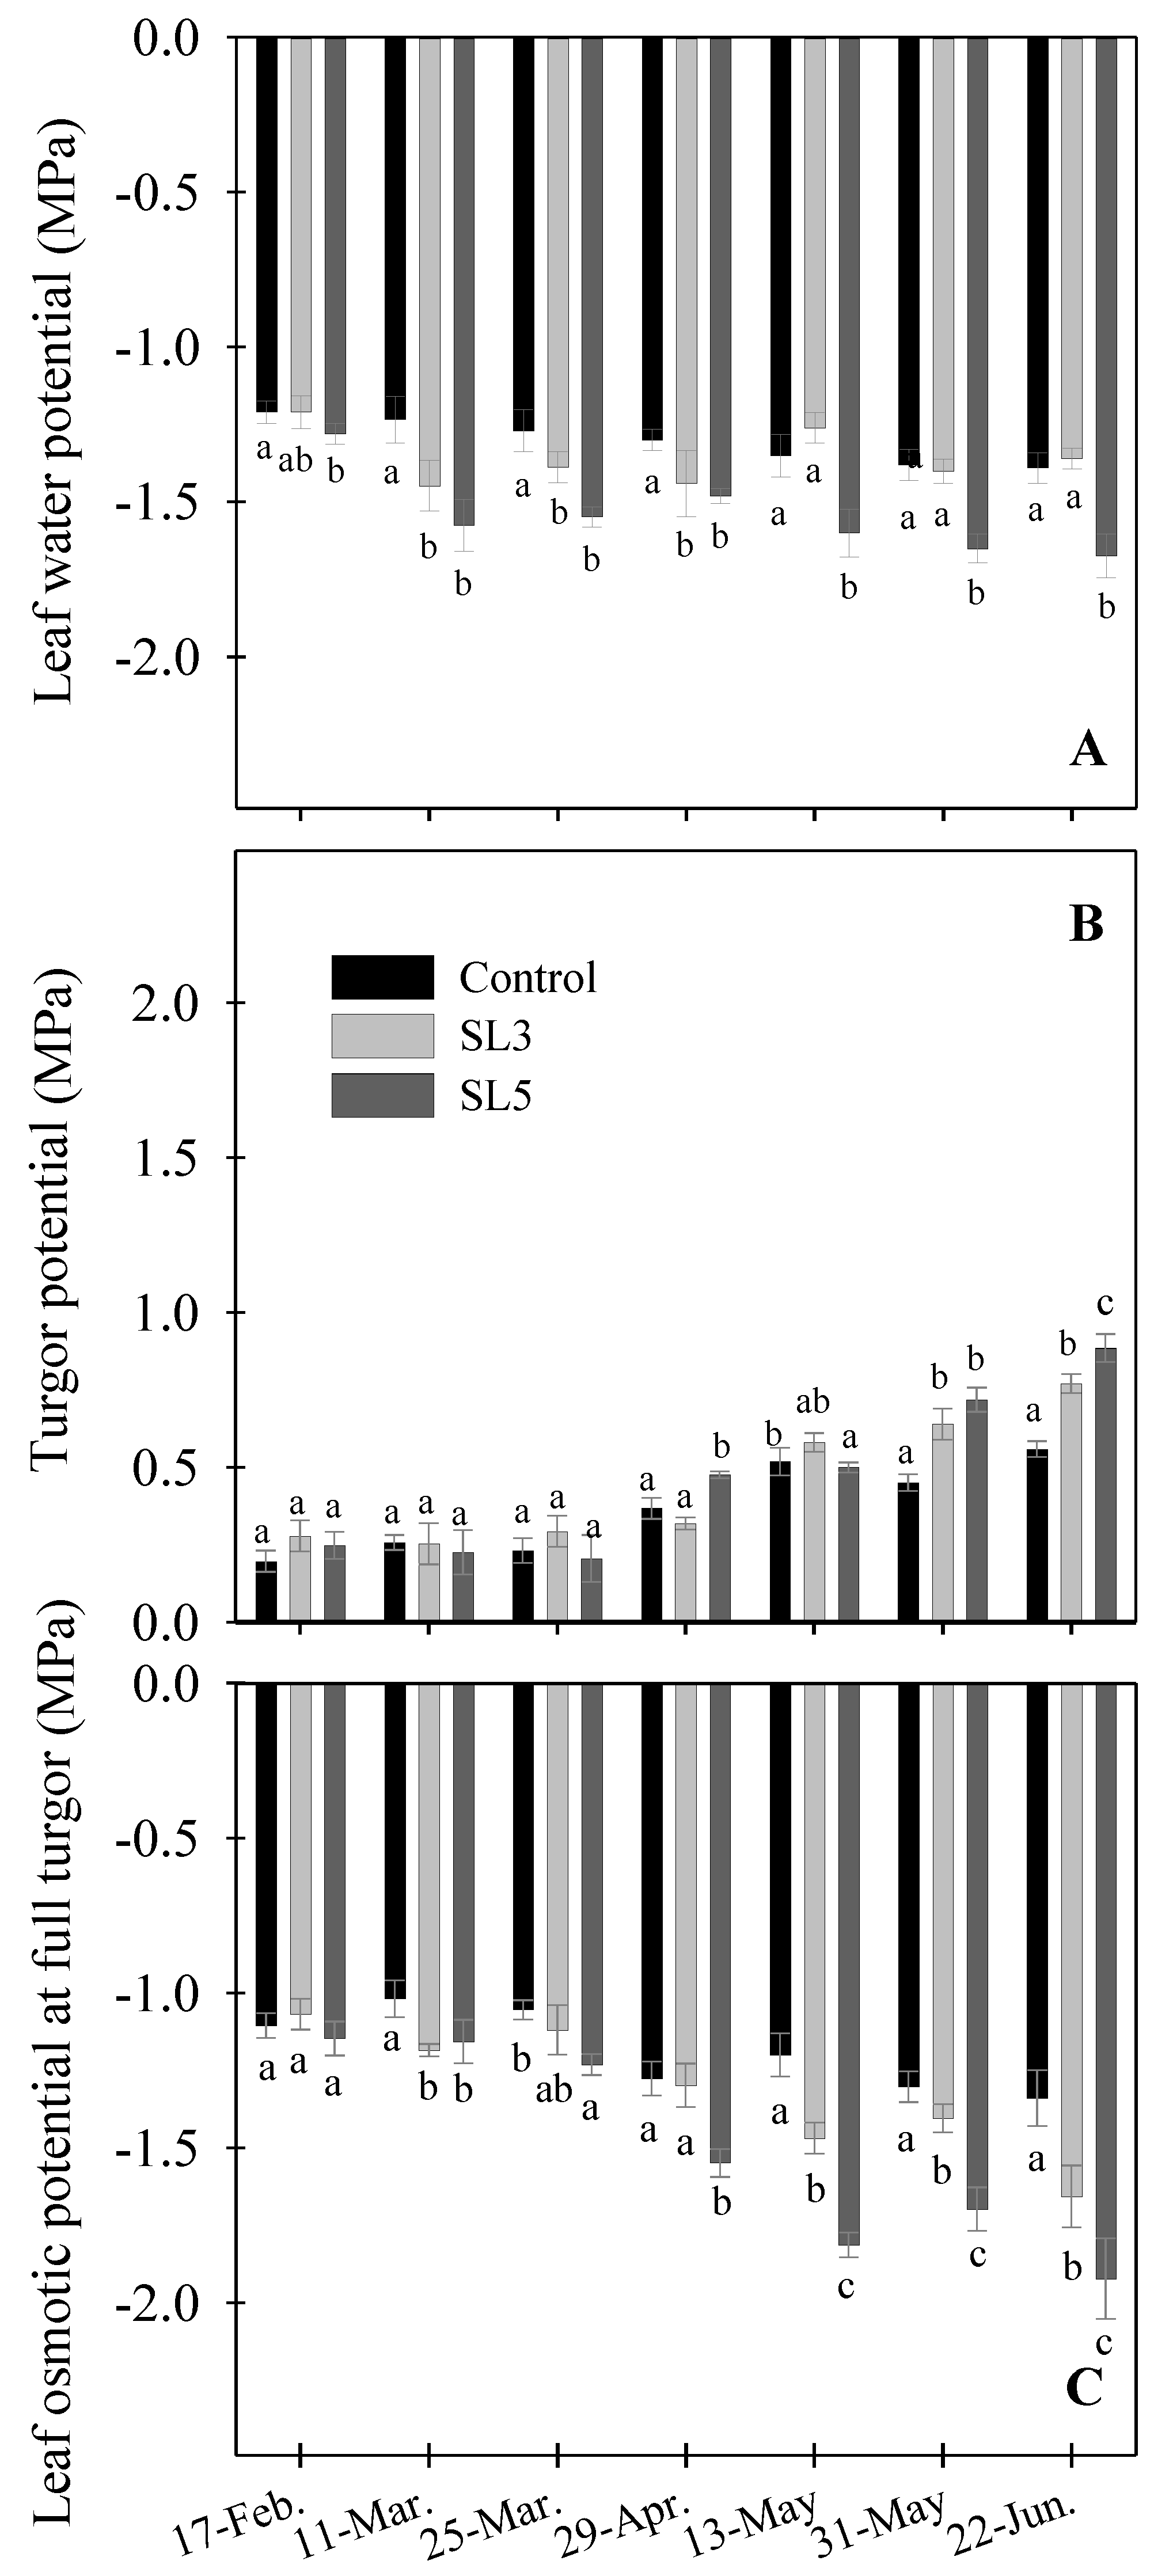
3.4. Plant Water Relations

The seasonal evolution of leaf water potential at midday (Ψl), leaf turgor potential (Ψt), and leaf osmotic potential at saturation (Ψ100s) is shown in Figure 4. Ψl slightly decreased in all treatments as the evaporative demand of the atmosphere increased, showing maximum values in February and minimum values in June when SL5 treatment reached the lowest values around −1.7 MPa (Figure 4A). More significant differences in Ψl levels were observed between control and SL5 treatments during the experimental period.
During the first half of the experiment, plant turgor was similar in all treatments, but in the last weeks, salinized plants presented higher turgor than the control (Figure 4B). Ψ100s decreased in all treatments as time progressed (Figure 4C). From 13 May to the end, the Ψ100s in SL3 were lower than the control but higher than SL5 (Figure 4C). So, the salinity treatments decreased their Ψl but lowered their Ψ100s at the same time to maintain cell hydration under salinity (osmotic adjustment). This suggests that Hebe plants accumulated solutes in the cells to maintain water flux and cell turgor [69], an effect that was more evident in SL5 than in SL3.

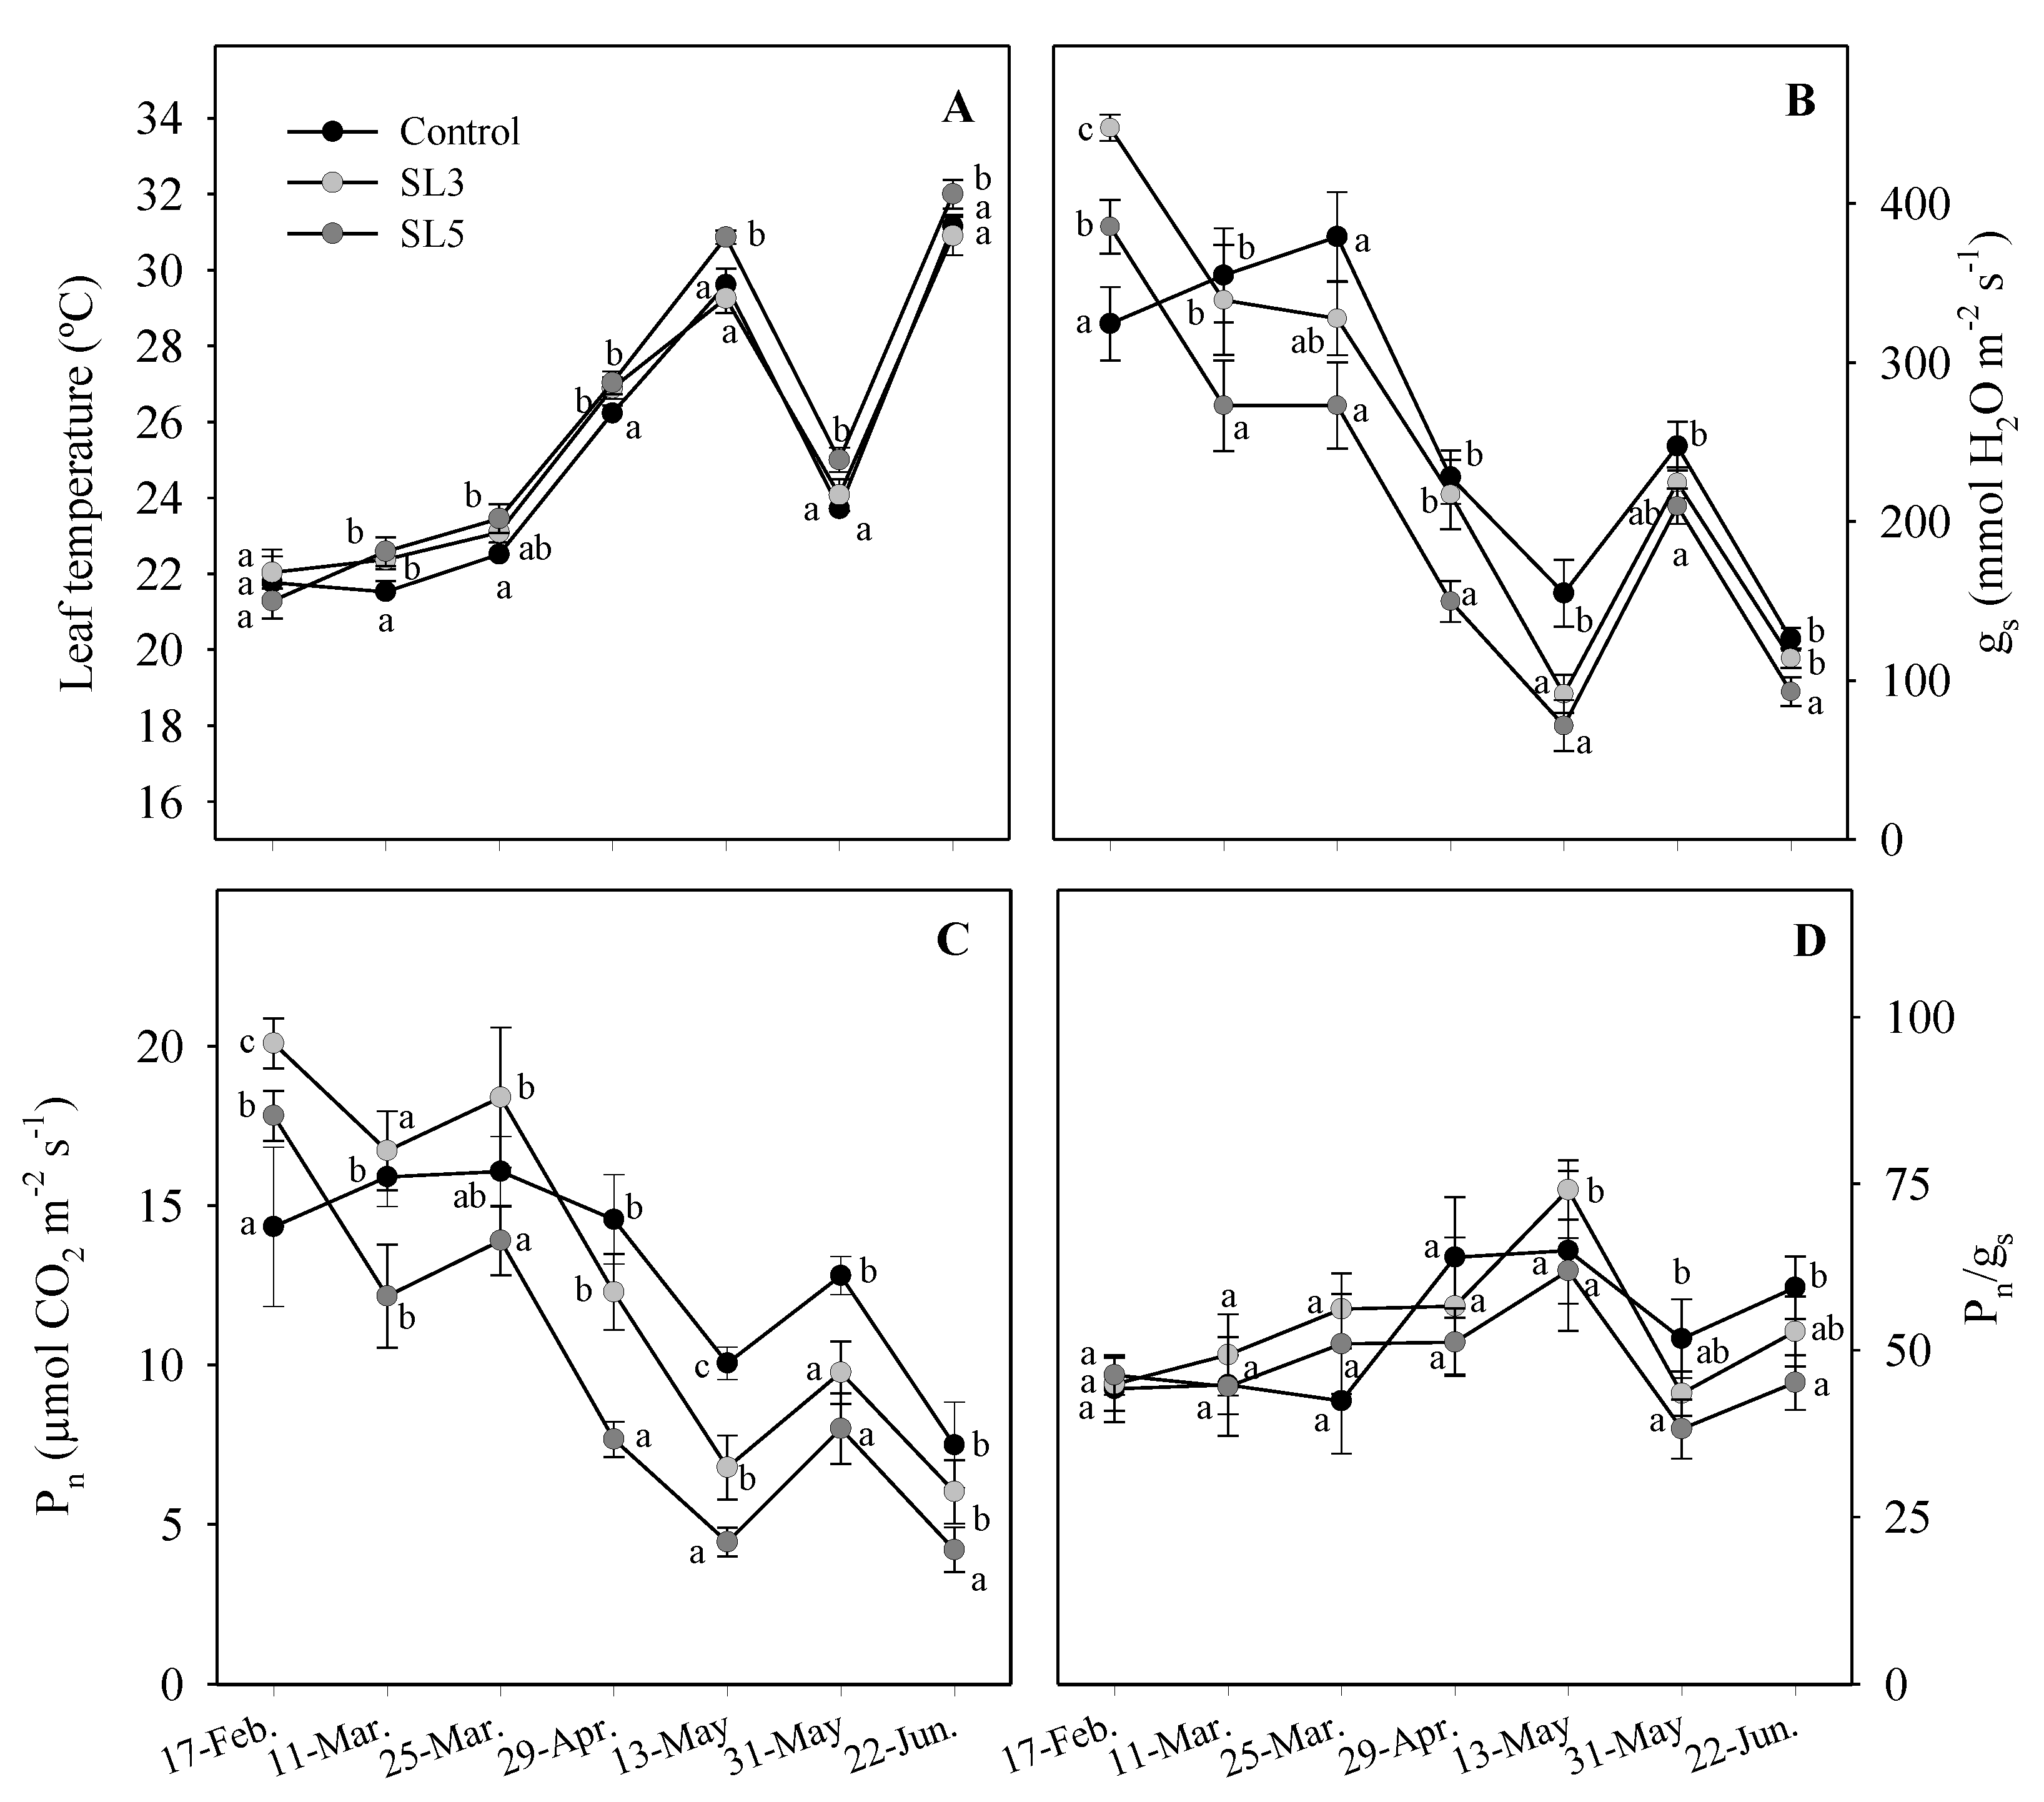
3.5. Leaf Temperature and Gas Exchange

Throughout the experiment, leaf temperature fluctuated between 21 °C and 32 °C (Figure 5A), which was associated with the air temperature in the greenhouse (Figure 1). During winter and the first half of spring, the leaf temperature of the control was slightly lower than in SL3 and SL5. However, from 13 May to 22 June, with increasing air temperatures and after accumulating salt stress for several months, leaf temperature in SL5 was higher than in the control (Figure 5A). Similar differences in leaf temperature have been reported when other species are subjected to salt stress [70,71]. Urrestarazu [72] found a negative correlation between leaf temperature and transpiration in Syngonium sp. and Philodendron sp. subjected to salt stress. In this sense, Azevedo-Neto et al. [73] suggested that leaf temperature can be a good indicator to assess the degree of salt stress in plants.
The stomatal conductance (gs) of Hebe showed maximum values during the first two months, around 400 mmol H2O m−2 s−1 (Figure 5B). From 25 March, there was a significant drop in gs, which coincided with the increase in leaf temperature (Figure 5A). In the last weeks of the experiment, stomatal conductance presented the lowest values in all treatments, around 100 mmol H2O m−2 s−1, and the gs in the control was higher than in the SL5 treatment (Figure 5B). Lower gs rates affect water loss through transpiration, which is associated with reduced water consumption [74], carbon fixation, and biomass production [75].
Stressful environments such as salinity, drought, and heat cause alterations in a wide range of physiological and biochemical processes in plants, including gas exchange [76]. The results of this experiment indicate that the stomatal conductance of Hebe was more sensitive to ambient temperature than salinity (Figure 5B). This sensitivity has also been reported by Niu et al. [77], who found a decrease in gs in other species as leaf temperature increased from 20 to 40 °C. In the last period of the experiment, a 6 °C drop between 13 and 31 May sharply increased the stomatal conductance in all treatments (Figure 5B). This suggests a rapid opening of the stomata due to less stressing temperatures. Then, on 31 May, all plants recovered their gs rates (up to about 200 mmol H2O m−2 s−1), indicating that the stomata of this species are very sensitive to temperature. The drop in leaf temperature on 31 May opened the stomata in all treatments (Figure 5B), showing that salinized plants transpired less than control plants, probably because they were more osmotically stressed [78]. Under osmotic stress, the stomata close, respiration decreases, and consequently leaf temperature increases [8].
The photosynthetic rate (Pn) followed a similar trend to that of gs (Figure 5C). This correlation suggests that Hebe regulates its photosynthesis through normal stomatal regulation. The Pn in Hebe decreased with increasing leaf temperature, an expected association as photosynthesis is known to be sensitive to heat [79,80]. In this regard, Ammar et al. [81] found a decrease in photosynthetic rate in fig plants due to high temperatures associated with high vapor pressure deficits. Elevated temperatures and excessive light intensity are common abiotic stresses that affect plants growing in landscapes [82]. On 17 February, Pn values were between 15 and 20 µmol CO2 m−2 s−1 for all three treatments. The increase in air temperature from 29 April (Figure 1) caused the photosynthetic rate to decrease in all treatments, but the control plants had higher Pn rates than the saline treatments (Figure 5C). In the last measurement, Pn in the control was statically like that of SL3, while SL5 had the lowest rate (Figure 5C). The decrease in the photosynthetic rate can be attributed to the suppression of mesophyll conductance and stomatal closure [83,84]. However, the reduced photosynthetic activity of salinized Hebe plants could also be related to non-stomatal factors [85]. As mentioned above, saline irrigation promotes high concentrations of Na+ and Cl in tissues (Table 4), which can reduce both the rate of electron transport [86,87] and the pigment content in chloroplasts [88,89], decreasing photosynthetic capacity, and reducing biomass production.
It has been suggested that the photosynthetic rate in salinized plants may not change even when stomatal conductance is reduced [90]. However, in the case of Hebe, variations in Pn were largely proportional to gs, which left the Pn/gs ratio virtually unchanged. The increase in WUE in SL3 and SL5 (Table 2) could be associated, among other reasons, with a smaller decrease in the photosynthetic rate compared to the decrease in stomatal conductance (Figure 5B,C). At the end of the experiment, control plants showed similar Pn/gs ratios to SL3, but higher than SL5 plants (Figure 5D). High Pn/gs ratios have been associated in other species with adaptive mechanisms to water stress [91,92,93].

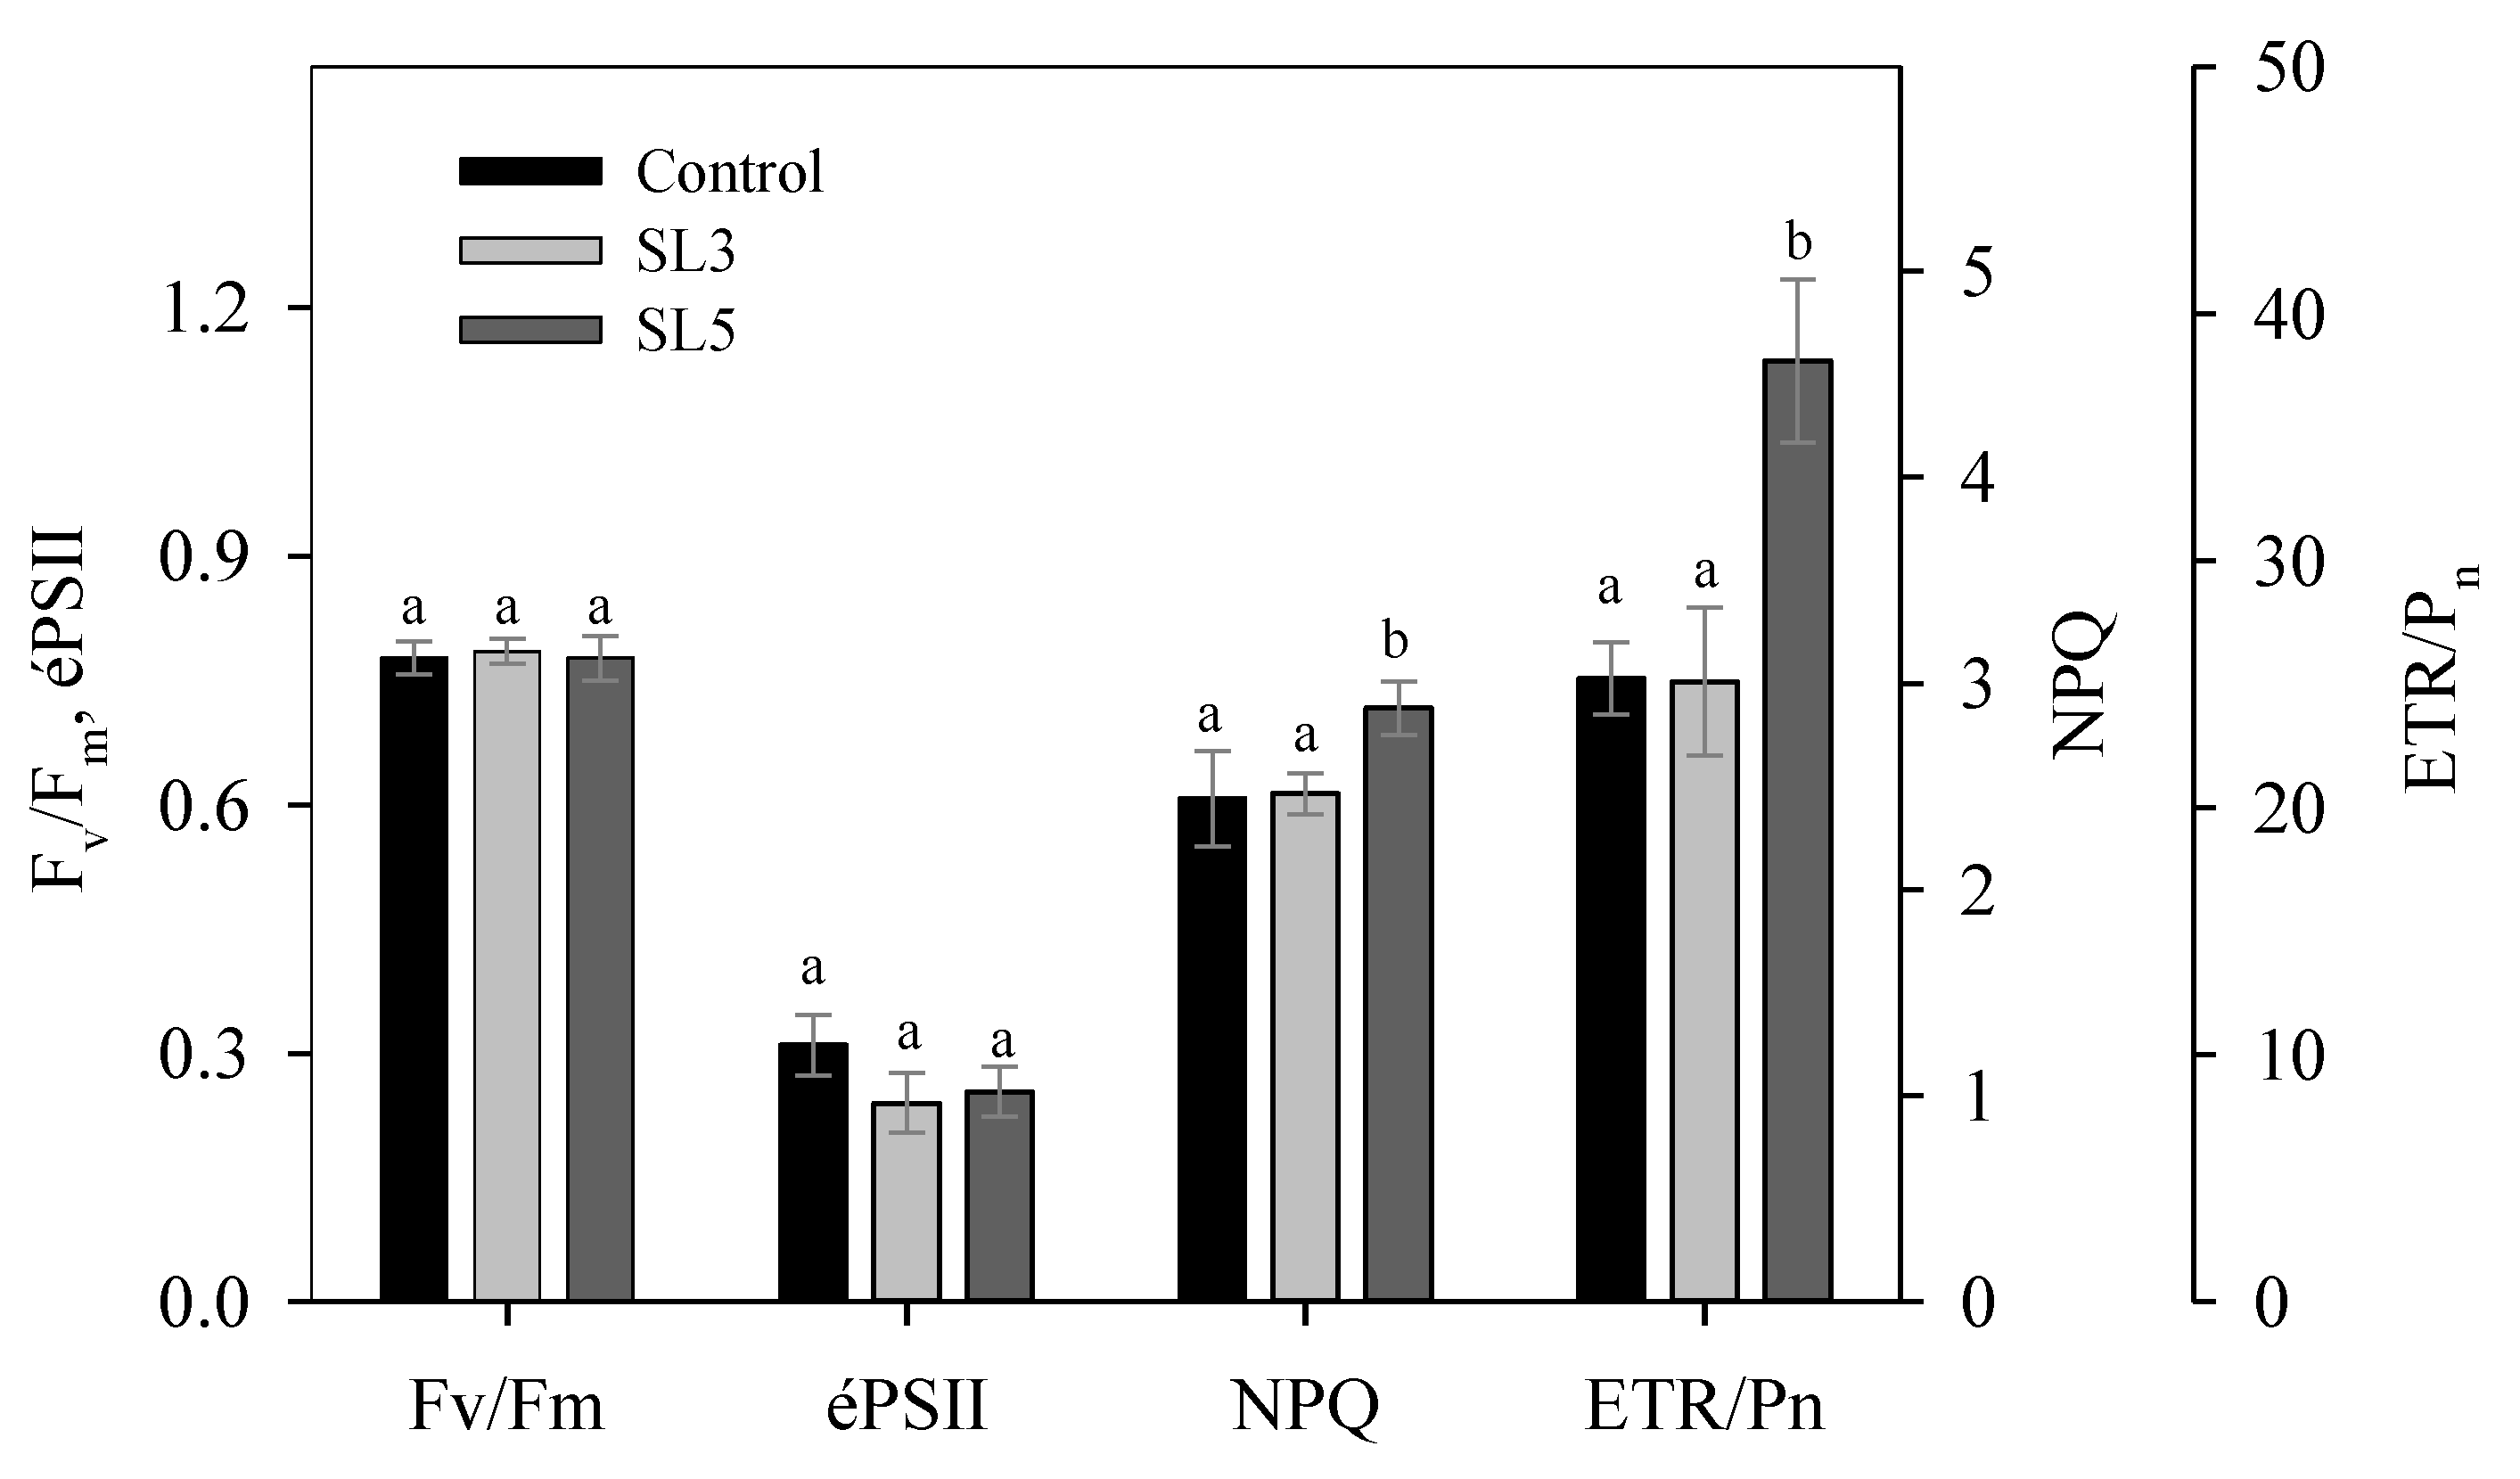
3.6. Chlorophyll Fluorescence

Many studies have shown that moderate to severe salt stress reduces the photosynthetic performance of plants [94,95,96] by impairing the functioning of photosystem II (PSII) [97,98]. In contrast, others have found that salts do not significantly damage the structure and function of PSII [99,100]. The Fv/Fm ratio indicates the maximum photosynthetic capacity of a plant [36]. It is an important chlorophyll fluorescence parameter because it is useful for detecting damage to the photochemical apparatus [101]. In our experiment, the Fv/Fm ratio was not affected by salinity (Figure 6) as all treatments showed values close to 0.8, a value that is related to healthy leaves in most plant species [102]. Therefore, salinized Hebe plants showed a good photochemical function.
The effective quantum yield in PSII (éPSII) measures the linear electron transport rate (ETR), which is an overall indication of the current efficiency of the photochemistry of PSII. Control plants had the highest éPSII, but no statistical differences were found between treatments (Figure 6). In contrast, non-photochemical quenching (NPQ) is a mechanism through which plants dissipate excess excitation energy in the form of heat [103]. SL5 treatment slightly increased its NPQ compared to the control and SL3 (Figure 6). Although the increase was small, an increase NPQ indicates that the photoprotection mechanism of Hebe worked correctly, which prevented the photochemical components of the plant from being damaged [104].
The ETR/Pn ratio in SL5 plants increased relative to control and SL3 plants (Figure 6). This increase was due to a lower photosynthesis rate in SL5 compared to the control and SL3 (Figure 5), as ETR remained stable (since ETR is proportional to éPSII). The increase in ETR/Pn suggests that some of the photochemical excitation energy was used for other non-CO2-assimilative processes and/or dissipated as heat [105,106]. Since the increase in ETR/Pn of SL5 was relatively small, and the excess of energy dissipated as heat (increasing NPQ), the reduced photochemical dissipation was minimized.

4. Conclusions

Hebe andersonii cv. Variegata can be grown with 3 dS m−1 water, with no leaching, without negative effects on its ornamental quality, and with high water use efficiency. Hebe plants irrigated with 5 dS m−1 water showed a moderate loss of their visual quality, producing smaller plants with fewer flowers, but without impairing the overall development of the plant. The photosynthesis of Hebe under salinity conditions was mainly controlled by stomata, which was related to the level of salt stress and water status of the plant. Salinity did not damage the photosystem II, which can be explained by the fact that Hebe was able to dissipate the excess excitation energy as heat effectively. Hebe was able to avoid ion toxicity and maintain a suitable nutrient balance under the salinity levels tested in this experiment.

Author Contributions

Conceptualization, M.J.S.-B., J.J.A. and S.B.; data curation, S.B., M.F.O. and J.O.; formal analysis, D.B. and S.B.; funding acquisition, M.J.S.-B. and M.F.O.; investigation, D.B., B.L. and S.B.; methodology, D.B., B.L. and J.O.; project administration, M.J.S.-B. and M.F.O.; resources, M.J.S.-B.; supervision, M.F.O. and J.J.A.; visualization, D.B. and B.L.; writing—original draft, D.B. and J.O.; writing—review and editing, M.J.S.-B., J.J.A. and S.B. All authors have read and agreed to the published version of the manuscript.

Funding

This research was funded by the Ministry of Science, Innovation, and Universities of Spain (RTI2018-093997-B-I00).

Data Availability Statement

Data sharing not applicable.

Conflicts of Interest

The authors declare no conflict of interest.

References

  1. Fernández García, I.; Lecina, S.; Ruiz-Sánchez, M.C.; Vera, J.; Conejero, W.; Conesa, M.R.; Domínguez, A.; Pardo, J.J.; Léllis, B.C.; Montesinos, P. Trends and Challenges in Irrigation Scheduling in the Semi-Arid Area of Spain. Water 2020, 12, 785. [Google Scholar] [CrossRef] [Green Version]
  2. Murtaza, G.; Zia-ur-Rehman, M.; Rashid, I.; Qadir, M. Use of Poor-Quality Water for Agricultural Production. In Research Developments in Saline Agriculture; Dagar, J.C., Yadav, R.K., Sharma, P.C., Eds.; Springer: Singapore, 2019; pp. 769–783. ISBN 9789811358326. [Google Scholar]
  3. Liu, L.; Wang, T.; Wang, L.; Wu, X.; Zuo, Q.; Shi, J.; Sheng, J.; Jiang, P.; Chen, Q.; Ben-Gal, A. Plant Water Deficit Index-Based Irrigation under Conditions of Salinity. Agric. Water Manag. 2022, 269, 107669. [Google Scholar] [CrossRef]
  4. Shahzad, B.; Fahad, S.; Tanveer, M.; Saud, S.; Khan, B. Plant Responses and Tolerance to Salt Stress. In Approaches for Enhancing Abiotic Stress Tolerance in Plants; CRC Press: Boca Raton, FL, USA, 2019; pp. 61–78. ISBN 978-1-351-10472-2. [Google Scholar]
  5. Hossain, M.A.; Kumar, V.; Burritt, D.J.; Fujita, M.; Mäkelä, P.S.A. Osmoprotectant-Mediated Abiotic Stress Tolerance in Plants: Recent Advances and Future Perspectives; Springer Nature: Cham, Switzerland, 2019; ISBN 978-3-030-27423-8. [Google Scholar]
  6. Cassaniti, C.; Romano, D.; Flowers, J.T. The Response of Ornamental Plants to Saline Irrigation Water. In Irrigation-Water Management, Pollution and Alternative Strategies; Garcia-Garizabal, I., Abrahao, R., Eds.; IntechOpen: London, UK, 2012; ISBN 978-953-51-0421-6. [Google Scholar]
  7. Assaha, D.V.M.; Ueda, A.; Saneoka, H.; Al-Yahyai, R.; Yaish, M.W. The Role of Na+ and K+ Transporters in Salt Stress Adaptation in Glycophytes. Front. Physiol. 2017, 8, 509. [Google Scholar] [CrossRef]
  8. Acosta-Motos, J.; Ortuño, M.; Bernal-Vicente, A.; Diaz-Vivancos, P.; Sanchez-Blanco, M.; Hernandez, J. Plant Responses to Salt Stress: Adaptive Mechanisms. Agronomy 2017, 7, 18. [Google Scholar] [CrossRef] [Green Version]
  9. Álvarez, S.; Gómez-Bellot, M.J.; Castillo, M.; Bañón, S.; Sánchez-Blanco, M.J. Osmotic and Saline Effect on Growth, Water Relations, and Ion Uptake and Translocation in Phlomis purpurea Plants. Environ. Exp. Bot. 2012, 78, 138–145. [Google Scholar] [CrossRef] [Green Version]
  10. Villarino, G.H.; Mattson, N.S. Assessing Tolerance to Sodium Chloride Salinity in Fourteen Floriculture Species. HortTechnology 2011, 21, 539–545. [Google Scholar] [CrossRef] [Green Version]
  11. Parida, A.K.; Das, A.B. Salt Tolerance and Salinity Effects on Plants: A Review. Ecotoxicol. Environ. Saf. 2005, 60, 324–349. [Google Scholar] [CrossRef]
  12. Valdés, R.; Miralles, J.; Ochoa, J.; Sánchez-Blanco, M.J.; Bañón Arias, S. Saline Reclaimed Wastewater Can Be Used to Produce Potted Weeping Fig (Ficus benjamina L.) with Minimal Effects on Plant Quality. Span. J. Agric. Res. 2012, 10, 1167. [Google Scholar] [CrossRef] [Green Version]
  13. Warrington, I.J.; Southward, R.C. Seasonal Frost Tolerance of Hebe Species and Cultivars. N. Z. J. Crop Hortic. Sci. 2010, 23, 437–445. [Google Scholar] [CrossRef] [Green Version]
  14. Morrys, J. Creating a Drought Tolerant Garden. Available online: https://www.mercurynews.com/2014/06/25/creating-a-drought-tolerant-garden/ (accessed on 30 April 2022).
  15. Bañón, D.; Lorente, B.; Bañón, S.; Ortuño, M.F.; Sánchez-Blanco, M.J.; Alarcón, J.J. Control of Substrate Water Availability Using Soil Sensors and Effects of Water Deficit on the Morphology and Physiology of Potted Hebe Andersonii. Agronomy 2022, 12, 206. [Google Scholar] [CrossRef]
  16. Sánchez-Blanco, M.J.; Ferrández, T.; Navarro, A.; Bañon, S.; Alarcón, J.J. Effects of Irrigation and Air Humidity Preconditioning on Water Relations, Growth and Survival of Rosmarinus Officinalis Plants during and after Transplanting. J. Plant Physiol. 2004, 161, 1133–1142. [Google Scholar] [CrossRef] [PubMed]
  17. Hagen, E.; Nambuthiri, S.; Fulcher, A.; Geneve, R. Comparing Substrate Moisture-Based Daily Water Use and on-Demand Irrigation Regimes for Oakleaf Hydrangea Grown in Two Container Sizes. Sci. Hortic. 2014, 179, 132–139. [Google Scholar] [CrossRef]
  18. Easlon, H.M.; Bloom, A.J. Easy Leaf Area: Automated Digital Image Analysis for Rapid and Accurate Measurement of Leaf Area. Appl. Plant Sci. 2014, 2, 1400033. [Google Scholar] [CrossRef] [PubMed]
  19. Romero-Trigueros, C.; Nortes, P.A.; Pedrero, F.; Mounzer, O.; Alarcón, J.J.; Bayona, J.M.; Nicolás, E. Assessment of the Viability of Using Saline Reclaimed Water in Grapefruit in Medium to Long Term. Span. J. Agric. Res. 2014, 12, 1137–1148. [Google Scholar] [CrossRef] [Green Version]
  20. Lorente, B.; Zugasti, I.; Ortuño, M.F.; Nortes, P.; Bañón, S.; Hernández, J.A.; Sánchez-Blanco, M.J. Substrate Composition Affects the Development of Water Stress and Subsequent Recovery by Inducing Physiological Changes in Cistus albidus Plants. Plant Physiol. Biochem. 2021, 158, 125–135. [Google Scholar] [CrossRef]
  21. Sheng, M.; Tang, M.; Chen, H.; Yang, B.; Zhang, F.; Huang, Y. Influence of Arbuscular Mycorrhizae on Photosynthesis and Water Status of Maize Plants under Salt Stress. Mycorrhiza 2008, 18, 287–296. [Google Scholar] [CrossRef]
  22. Brestic, M.; Zivcak, M. PSII Fluorescence Techniques for Measurement of Drought and High Temperature Stress Signal in Crop Plants: Protocols and Applications. In Molecular Stress Physiology of Plants; Rout, G.R., Das, A.B., Eds.; Springer: New Delhi, India, 2013; pp. 87–131. ISBN 978-81-322-0807-5. [Google Scholar]
  23. Akat Saraçoğlu, Ö.; Meriç, M.K.; Tüzel, İ.H.; Kukul Kurttaş, Y.S. Responses of Gerbera Jamesonii Plants to Different Salinity Levels and Leaching Ratios When Grown in Soilless Culture. In Plant Abiotic Stress Tolerance; Hasanuzzaman, M., Hakeem, K.R., Nahar, K., Alharby, H.F., Eds.; Springer International Publishing: Cham, Switzerland, 2019; pp. 357–379. ISBN 978-3-030-06117-3. [Google Scholar]
  24. Escalona, A.; Valverde, J.; Dos Santos Coutinho, C.; Salas, M.C. Preliminary Study of the Response of Ornamental Plants to the NaCl Case I. Tagetes erecta L. Acta Hortic. 2012, 937, 955–962. [Google Scholar] [CrossRef]
  25. Paradiso, R.; De Pascale, S. Morpho-Physiological Response of Garden Roses to Saline Aerosol Stress. Acta Hortic. 2021, 1, 131–138. [Google Scholar] [CrossRef]
  26. Patil, S.T.; Kadam, U.S.; Mane, M.S.; Mahale, D.M.; Dhekale, J.S. Hydroponic Growth Media (Substrate): A Review. Int. Res. J. Pure Appl. Chem. 2020, 21, 106–113. [Google Scholar] [CrossRef]
  27. Al-Busaidi, A.; Al-Rawahy, S.; Ahmed, M. Response of Different Tomato Cultivars to Diluted Seawater Salinity. Asian J. Crop Sci. 2009, 1, 77–86. [Google Scholar] [CrossRef] [Green Version]
  28. Álvarez, S.; Rodríguez, P.; Broetto, F.; Sánchez-Blanco, M.J. Long Term Responses and Adaptive Strategies of Pistacia lentiscus under Moderate and Severe Deficit Irrigation and Salinity: Osmotic and Elastic Adjustment, Growth, Ion Uptake and Photosynthetic Activity. Agric. Water Manag. 2018, 202, 253–262. [Google Scholar] [CrossRef] [Green Version]
  29. Valdés, R.; Miralles, J.; Ochoa, J.; Bañón, S.; Sánchez-Blanco, M.J. The Number of Emitters Alters Salt Distribution and Root Growth in Potted Gerbera. HortScience 2014, 49, 160–165. [Google Scholar] [CrossRef]
  30. Bolla, A.; Voyiatzis, D.; Koukourikou-Petridou, M.; Chimonidou, D. Photosynthetic Parameters and Cut-Flower Yield of Rose ‘Eurored’ (H.T.) Are Adversely Affected by Mild Water Stress Irrespective of Substrate Composition. Sci. Hortic. 2010, 126, 390–394. [Google Scholar] [CrossRef]
  31. Espadafor, M.; Orgaz Rosua, F.; Testi, L.; Lorite, I.J.; González-Dugo, M.P.; Fereres Castiel, E. Responses of Transpiration and Transpiration Efficiency of Almond Trees to Moderate Water Deficits. Sci. Hortic. 2017, 225, 6–14. [Google Scholar] [CrossRef]
  32. Vivaldi, G.A.; Camposeo, S.; Romero-Trigueros, C.; Pedrero, F.; Caponio, G.; Lopriore, G.; Álvarez, S. Physiological Responses of Almond Trees under Regulated Deficit Irrigation Using Saline and Desalinated Reclaimed Water. Agric. Water Manag. 2021, 258, 107172. [Google Scholar] [CrossRef]
  33. Omamt, E.N.; Hammes, P.S.; Robbertse, P.J. Differences in Salinity Tolerance for Growth and Water-use Efficiency in Some Amaranth (Amaranthus spp.) Genotypes. N. Z. J. Crop Hortic. Sci. 2006, 34, 11–22. [Google Scholar] [CrossRef]
  34. Lee, M.K.; van Iersel, M.W. Sodium Chloride Effects on Growth, Morphology, and Physiology of Chrysanthemum (Chrysanthemum × morifolium). HortScience 2008, 43, 1888–1891. [Google Scholar] [CrossRef] [Green Version]
  35. García-Caparrós, P.; Llanderal, A.; Lao, M.T. Effects of Salinity on Growth, Water-Use Efficiency, and Nutrient Leaching of Three Containerized Ornamental Plants. Commun. Soil Sci. Plant Anal. 2017, 48, 1221–1230. [Google Scholar] [CrossRef]
  36. García-Caparrós, P.; Lao, M.T. The Effects of Salt Stress on Ornamental Plants and Integrative Cultivation Practices. Sci. Hortic. 2018, 240, 430–439. [Google Scholar] [CrossRef]
  37. Álvarez, S.; Navarro, A.; Bañón, S.; Sánchez-Blanco, M.J. Regulated Deficit Irrigation in Potted Dianthus Plants: Effects of Severe and Moderate Water Stress on Growth and Physiological Responses. Sci. Hortic. 2009, 122, 579–585. [Google Scholar] [CrossRef] [Green Version]
  38. Miralles, J.; Valdés, R.; Franco, J.A.; Bañón, S.; Sánchez-Blanco, M.J. Irrigation of Hydrangea with Saline Reclaimed Wastewater: Effects of Fresh Water Flushing. Acta Hortic. 2013, 1000, 229–236. [Google Scholar] [CrossRef]
  39. De Pascale, S.; Ruggiero, C.; Barbieri, G.; Maggio, A. Physiological Responses of Pepper to Salinity and Drought. J. Am. Soc. Hortic. Sci. 2003, 128, 48–54. [Google Scholar] [CrossRef] [Green Version]
  40. Nandy, P.; Dasgupta, N.; Das, S. Differential Expression of Physiological and Biochemical Characters of Some Indian Mangroves towards Salt Tolerance. Physiol. Mol. Biol. Plants 2009, 15, 151–160. [Google Scholar] [CrossRef] [PubMed] [Green Version]
  41. Liu, F.; Stützel, H. Biomass Partitioning, Specific Leaf Area, and Water Use Efficiency of Vegetable Amaranth (Amaranthus spp.) in Response to Drought Stress. Sci. Hortic. 2004, 102, 15–27. [Google Scholar] [CrossRef]
  42. Lichtenthaler, H.K.; Ač, A.; Marek, M.V.; Kalina, J.; Urban, O. Differences in Pigment Composition, Photosynthetic Rates and Chlorophyll Fluorescence Images of Sun and Shade Leaves of Four Tree Species. Plant Physiol. Biochem. 2007, 45, 577–588. [Google Scholar] [CrossRef]
  43. Orsini, F.; Alnayef, M.; Bona, S.; Maggio, A.; Gianquinto, G. Low Stomatal Density and Reduced Transpiration Facilitate Strawberry Adaptation to Salinity. Environ. Exp. Bot. 2012, 81, 1–10. [Google Scholar] [CrossRef]
  44. Shabala, L.; Mackay, A.; Tian, Y.; Jacobsen, S.-E.; Zhou, D.; Shabala, S. Oxidative Stress Protection and Stomatal Patterning as Components of Salinity Tolerance Mechanism in Quinoa (Chenopodium quinoa). Physiol. Plant. 2012, 146, 26–38. [Google Scholar] [CrossRef]
  45. Loescher, W.; Chan, Z.; Grumet, R. Options for Developing Salt-Tolerant Crops. HortScience 2011, 46, 1085–1092. [Google Scholar] [CrossRef] [Green Version]
  46. Tanaka, T.; Kurokawa, C.; Oikawa, S. Leaf Shedding Increases the Photosynthetic Rate of the Canopy in N2-Fixing and Non-N2-Fixing Woody Species. Tree Physiol. 2018, 38, 1903–1911. [Google Scholar] [CrossRef]
  47. Moura, R.d.S.; Soares, T.L.; Lima, L.K.S.; Gheyi, H.R.; Jesus, O.N.; Coelho Filho, M.A. Salinity-Induced Changes in Biometric, Physiological and Anatomical Parameters of Passiflora edulis Sims Plants Propagated by Different Methods. Arch. Agron. Soil Sci. 2020, 66, 1692–1706. [Google Scholar] [CrossRef]
  48. Niu, G.; Rodriguez, D.S.; Aguiniga, L.; Mackay, W. Salinity Tolerance of Lupinus havardii and Lupinus texensis. HortScience 2007, 42, 526–528. [Google Scholar] [CrossRef]
  49. Akram, N.A.; Ashraf, M. Improvement in Growth, Chlorophyll Pigments and Photosynthetic Performance in Salt-Stressed Plants of Sunflower (Helianthus annuus L.) by Foliar Application of 5-Aminolevulinic Acid. Agrochimica 2011, 55, 94–104. [Google Scholar]
  50. Khan, M.A.; Shirazi, M.U.; Khan, M.A.; Mujtaba, S.M.; Islam, E.; Mumtaz, S.; Shereen, A.; Ashraf, M.Y. Role of Proline, K/NA Ratio and Chlorophyll Content in Salt Tolerance of Wheat (Triticum aestivum L.). Pak. J. Bot. 2009, 41, 633–638. [Google Scholar]
  51. Ashraf, M.; Shahzad, S.M.; Imtiaz, M.; Rizwan, M.S. Salinity Effects on Nitrogen Metabolism in Plants—Focusing on the Activities of Nitrogen Metabolizing Enzymes: A Review. J. Plant Nutr. 2018, 41, 1065–1081. [Google Scholar] [CrossRef]
  52. De Garcia, G.O.; Ferreira, P.A.; dos Santos, D.B.; de Oliveira, F.G.; Miranda, G.V. Saline Stress in Maize Plants: I-Anionic Macronutrients and Their Relationships with Chloride. Rev. Bras. Eng. Agríc. E Ambient. 2005, 9, 26–30. [Google Scholar] [CrossRef]
  53. Shiyab, S. Effects of NaCl Application to Hydroponic Nutrient Solution on Macro and Micro Elements and Protein Content of Hot Pepper (Capsicum annuum L.). J. Food Agric. Amp Environ. 2011, 9, 350–356. [Google Scholar]
  54. Sacała, E.; Demczuk, A.; Grzyś, E. The Response of Maize Seedlings to Salt Stress under Increasing Levels of Phosphorus. J. Elem. 2016, 21, 185–194. [Google Scholar] [CrossRef]
  55. Rahi, T.S.; Singh, B. Salinity Tolerance in Chrysanthemum morifolium. J. Appl. Hortic. 2011, 13, 30–36. [Google Scholar] [CrossRef]
  56. Al-Karaki, G.N. Growth, Sodium, and Potassium Uptake and Translocation in Salt Stressed Tomato. J. Plant Nutr. 2000, 23, 369–379. [Google Scholar] [CrossRef]
  57. Navarro, A.; Bañón, S.; Conejero, W.; Sánchez-Blanco, M.J. Ornamental Characters, Ion Accumulation and Water Status in Arbutus Unedo Seedlings Irrigated with Saline Water and Subsequent Relief and Transplanting. Environ. Exp. Bot. 2008, 62, 364–370. [Google Scholar] [CrossRef]
  58. Grieve, C.M.; Poss, J.A. Response of Ornamental Sunflower Cultivars ‘Sunbeam’ and ‘Moonbright’ to Irrigation with Saline Wastewaters. J. Plant Nutr. 2010, 33, 1579–1592. [Google Scholar] [CrossRef]
  59. Salachna, P.; Zawadzi, A. Response of Ornithogalum saundersiae Bak. to Salinity Stress. Acta Sci. Pol. Hortorum Cultus 2016, 15, 123–134. [Google Scholar]
  60. Acosta-Motos, J.-R.; Diaz-Vivancos, P.; Álvarez, S.; Fernández-García, N.; Sanchez-Blanco, M.J.; Hernández, J.A. Physiological and Biochemical Mechanisms of the Ornamental Eugenia myrtifolia L. Plants for Coping with NaCl Stress and Recovery. Planta 2015, 242, 829–846. [Google Scholar] [CrossRef] [PubMed] [Green Version]
  61. Fornes, F.; Belda, R.M.; Carrión, C.; Noguera, V.; García-Agustín, P.; Abad, M. Pre-Conditioning Ornamental Plants to Drought by Means of Saline Water Irrigation as Related to Salinity Tolerance. Sci. Hortic. 2007, 113, 52–59. [Google Scholar] [CrossRef]
  62. Colmenero-Flores, J.M.; Franco-Navarro, J.D.; Cubero-Font, P.; Peinado-Torrubia, P.; Rosales, M.A. Chloride as a Beneficial Macronutrient in Higher Plants: New Roles and Regulation. Int. J. Mol. Sci. 2019, 20, 4686. [Google Scholar] [CrossRef] [Green Version]
  63. Chen, S.; Li, J.; Wang, S.; Fritz, E.; Hüttermann, A.; Altman, A. Effects of NaCl on Shoot Growth, Transpiration, Ion Compartmentation, and Transport in Regenerated Plants of Populus euphratica and Populus tomentosa. Can. J. For. Res. 2003, 33, 967–975. [Google Scholar] [CrossRef]
  64. Cuin, T.A.; Tian, Y.; Betts, S.A.; Chalmandrier, R.; Shabala, S.; Cuin, T.A.; Tian, Y.; Betts, S.A.; Chalmandrier, R.; Shabala, S. Ionic Relations and Osmotic Adjustment in Durum and Bread Wheat under Saline Conditions. Funct. Plant Biol. 2009, 36, 1110–1119. [Google Scholar] [CrossRef]
  65. Paz, R.C.; Rocco, R.A.; Reinoso, H.; Menéndez, A.B.; Pieckenstain, F.L.; Ruiz, O.A. Comparative Study of Alkaline, Saline, and Mixed Saline–Alkaline Stresses with Regard to Their Effects on Growth, Nutrient Accumulation, and Root Morphology of Lotus tenuis. J. Plant Growth Regul. 2012, 31, 448–459. [Google Scholar] [CrossRef]
  66. Cassaniti, C.; Leonardi, C.; Flowers, T.J. The Effects of Sodium Chloride on Ornamental Shrubs. Sci. Hortic. 2009, 122, 586–593. [Google Scholar] [CrossRef]
  67. Ashraf, M.Y.; Khan, A.H.; Azmi, A.R. Cell Membrane Stability and Its Relation with Some Physiological Processes in Wheat. Acta Agron. Hung. 1992, 41, 183. [Google Scholar]
  68. Camberato, D.M.; Lopez, R.; Mickelbart, M. PH and Electrical Conductivity Measurements in Soilless Substrates. Purdue Univ. Ext. 2009, HO-237-W, 1–7. [Google Scholar]
  69. García-Caparrós, P.; Llanderal, A.; Pestana, M.; Correia, P.J.; Lao, M.T. Tolerance Mechanisms of Three Potted Ornamental Plants Grown under Moderate Salinity. Sci. Hortic. 2016, 201, 84–91. [Google Scholar] [CrossRef] [Green Version]
  70. Gómez-Bellot, M.J.; Nortes, P.A.; Sánchez-Blanco, M.J.; Ortuño, M.F. Sensitivity of Thermal Imaging and Infrared Thermometry to Detect Water Status Changes in Euonymus Japonica Plants Irrigated with Saline Reclaimed Water. Biosyst. Eng. 2015, 133, 21–32. [Google Scholar] [CrossRef]
  71. Sirault, X.R.R.; James, R.A.; Furbank, R.T. A New Screening Method for Osmotic Component of Salinity Tolerance in Cereals Using Infrared Thermography. Funct. Plant Biol. FPB 2009, 36, 970–977. [Google Scholar] [CrossRef] [PubMed]
  72. Urrestarazu, M. Infrared Thermography Used to Diagnose the Effects of Salinity in a Soilless Culture. Quant. InfraRed Thermogr. J. 2013, 10, 1–8. [Google Scholar] [CrossRef] [Green Version]
  73. Azevedo Neto, A.D.d.; Prisco, J.T.; Enéas-Filho, J.; Lacerda, C.F.d.; Silva, J.V.; da Costa, P.H.A.; Gomes-Filho, E. Effects of Salt Stress on Plant Growth, Stomatal Response and Solute Accumulation of Different Maize Genotypes. Braz. J. Plant Physiol. 2004, 16, 31–38. [Google Scholar] [CrossRef]
  74. Long, R.W.; D’Antonio, C.M.; Dudley, T.L.; Hultine, K.R. Variation in Salinity Tolerance and Water Use Strategies in an Introduced Woody Halophyte (Tamarix spp.). J. Ecol. 2021, 109, 3807–3817. [Google Scholar] [CrossRef]
  75. Sussmilch, F.C.; Roelfsema, M.R.G.; Hedrich, R. On the Origins of Osmotically Driven Stomatal Movements. New Phytol. 2019, 222, 84–90. [Google Scholar] [CrossRef] [Green Version]
  76. Ashraf, M.; Harris, P.J.C. Photosynthesis under Stressful Environments: An Overview. Photosynthetica 2013, 51, 163–190. [Google Scholar] [CrossRef]
  77. Niu, G.; Rodriguez, D.S.; Wang, Y.-T. Impact of Drought and Temperature on Growth and Leaf Gas Exchange of Six Bedding Plant Species Under Greenhouse Conditions. HortScience 2006, 41, 1408–1411. [Google Scholar] [CrossRef]
  78. Passioura, J.B. Plant–Water Relations. In Encyclopedia of Life Sciences; John Wiley & Sons, Ltd: Chichester, UK, 2010; Volume 2, ISBN 978-0-470-01590-2. [Google Scholar]
  79. Centritto, M.; Brilli, F.; Fodale, R.; Loreto, F. Different Sensitivity of Isoprene Emission, Respiration and Photosynthesis to High Growth Temperature Coupled with Drought Stress in Black Poplar (Populus nigra) Saplings. Tree Physiol. 2011, 31, 275–286. [Google Scholar] [CrossRef] [PubMed] [Green Version]
  80. Qin, J.; Dong, W.Y.; He, K.N.; Yu, Y.; Tan, G.D.; Han, L.; Dong, M.; Zhang, Y.Y.; Zhang, D.; Li, A.Z.; et al. NaCl Salinity-Induced Changes in Water Status, Ion Contents and Photosynthetic Properties of Shepherdia argentea (Pursh) Nutt. Seedlings. Plant Soil Environ. 2010, 56, 325–332. [Google Scholar] [CrossRef] [Green Version]
  81. Ammar, A.; Aissa, I.B.; Gouiaa, M.; Mars, M. Fig (Ficus carica L.) Vulnerability to Climate Change: Combined Effects of Water Stress and High Temperature on Ecophysiological Behaviour of Different Cultivars. S. Afr. J. Bot. 2022, 147, 482–492. [Google Scholar] [CrossRef]
  82. He, M.; He, C.-Q.; Ding, N.-Z. Abiotic Stresses: General Defenses of Land Plants and Chances for Engineering Multistress Tolerance. Front. Plant Sci. 2018, 9, 1771. [Google Scholar] [CrossRef] [PubMed] [Green Version]
  83. Chaves, M.M.; Flexas, J.; Pinheiro, C. Photosynthesis under Drought and Salt Stress: Regulation Mechanisms from Whole Plant to Cell. Ann. Bot. 2009, 103, 551–560. [Google Scholar] [CrossRef] [Green Version]
  84. Flexas, J.; Bota, J.; Cifre, J.; Mariano Escalona, J.; Galmés, J.; Gulías, J.; Lefi, E.-K.; Florinda Martínez-Cañellas, S.; Teresa Moreno, M.; Ribas-Carbó, M.; et al. Understanding Down-Regulation of Photosynthesis under Water Stress: Future Prospects and Searching for Physiological Tools for Irrigation Management. Ann. Appl. Biol. 2004, 144, 273–283. [Google Scholar] [CrossRef]
  85. Saibo, N.J.M.; Lourenço, T.; Oliveira, M.M. Transcription Factors and Regulation of Photosynthetic and Related Metabolism under Environmental Stresses. Ann. Bot. 2009, 103, 609–623. [Google Scholar] [CrossRef] [Green Version]
  86. Mittal, S.; Kumari, N.; Sharma, V. Differential Response of Salt Stress on Brassica Juncea: Photosynthetic Performance, Pigment, Proline, D1 and Antioxidant Enzymes. Plant Physiol. Biochem. 2012, 54, 17–26. [Google Scholar] [CrossRef]
  87. Veiga, T.A.M.; Silva, S.C.; Francisco, A.-C.; Filho, E.R.; Vieira, P.C.; Fernandes, J.B.; Silva, M.F.G.F.; Müller, M.W.; Lotina-Hennsen, B. Inhibition of Photophosphorylation and Electron Transport Chain in Thylakoids by Lasiodiplodin, a Natural Product from Botryosphaeria Rhodina. J. Agric. Food Chem. 2007, 55, 4217–4221. [Google Scholar] [CrossRef]
  88. Omoto, E.; Taniguchi, M.; Miyake, H. Effects of Salinity Stress on the Structure of Bundle Sheath and Mesophyll Chloroplasts in NAD-Malic Enzyme and PCK Type C4 Plants. Plant Prod. Sci. 2010, 13, 169–176. [Google Scholar] [CrossRef] [Green Version]
  89. Veatch-Blohm, M.E.; Malinowski, M.; Keefer, D. Leaf Water Status, Osmotic Adjustment and Carbon Assimilation in Colored Calla Lilies in Response to Saline Irrigation. Sci. Hortic. 2012, 144, 65–73. [Google Scholar] [CrossRef]
  90. Zhang, Y.; Fang, J.; Wu, X.; Dong, L. Na+/K+ Balance and Transport Regulatory Mechanisms in Weedy and Cultivated Rice (Oryza sativa L.) Under Salt Stress. BMC Plant Biol. 2018, 18, 375. [Google Scholar] [CrossRef] [PubMed]
  91. Álvarez, S.; Sánchez-Blanco, M.J. Long-Term Effect of Salinity on Plant Quality, Water Relations, Photosynthetic Parameters and Ion Distribution in Callistemon citrinus. Plant Biol. 2013, 16, 757–764. [Google Scholar] [CrossRef] [PubMed] [Green Version]
  92. Cameron, R.W.F.; Harrison-Murray, R.S.; Atkinson, C.J.; Judd, H.L. Regulated Deficit Irrigation—A Means to Control Growth in Woody Ornamentals. J. Hortic. Sci. Biotechnol. 2006, 81, 435–443. [Google Scholar] [CrossRef]
  93. Chaves, M.M.; Miguel Costa, J.; Madeira Saibo, N.J. Chapter 3—Recent Advances in Photosynthesis Under Drought and Salinity. In Advances in Botanical Research; Turkan, I., Ed.; Plant Responses to Drought and Salinity Stress; Academic Press: Cambridge, USA, 2011; Volume 57, pp. 49–104. [Google Scholar]
  94. Najar, R.; Aydi, S.; Sassi-Aydi, S.; Zarai, A.; Abdelly, C. Effect of Salt Stress on Photosynthesis and Chlorophyll Fluorescence in Medicago truncatula. Plant Biosyst. 2019, 153, 88–97. [Google Scholar] [CrossRef]
  95. Da Silva, E.; Ribeiro, R.; Ferreira-Silva, S.; Viégas, R.; Silveira, J. Salt Stress Induced Damages on the Photosynthesis of Physic Nut Young Plants. Sci. Agric. 2011, 68, 62–68. [Google Scholar] [CrossRef]
  96. Wu, Q.-S.; Zou, Y.-N.; He, X.-H. Contributions of Arbuscular Mycorrhizal Fungi to Growth, Photosynthesis, Root Morphology and Ionic Balance of Citrus Seedlings under Salt Stress. Acta Physiol. Plant. 2010, 32, 297–304. [Google Scholar] [CrossRef]
  97. Akram, M.S.; Ashraf, M. Exogenous Application of Potassium Dihydrogen Phosphate Can Alleviate the Adverse Effects of Salt Stress on Sunflower. J. Plant Nutr. 2011, 34, 1041–1057. [Google Scholar] [CrossRef]
  98. Saleem, A.; Ashraf, M.; Akram, N.A. Salt (NaCl)-Induced Modulation in Some Key Physio-Biochemical Attributes in Okra (Abelmoschus esculentus L.). J. Agron. Crop Sci. 2011, 197, 202–213. [Google Scholar] [CrossRef]
  99. Abdeshahian, M.; Nabipour, M.; Meskarbashee, M. Chlorophyll Fluorescence as Criterion for the Diagnosis Salt Stress in Wheat (Triticum aestivum) Plants. Int. J. Nucl. Quantum Eng. 2010, 4, 839–841. [Google Scholar] [CrossRef]
  100. Al-Taweel, K.; Iwaki, T.; Yabuta, Y.; Shigeoka, S.; Murata, N.; Wadano, A. A Bacterial Transgene for Catalase Protects Translation of D1 Protein during Exposure of Salt-Stressed Tobacco Leaves to Strong Light. Plant Physiol. 2007, 145, 258–265. [Google Scholar] [CrossRef] [PubMed] [Green Version]
  101. Prieto, P.; Peñuelas, J.; Llusià, J.; Asensio, D.; Estiarte, M. Effects of Long-Term Experimental Night-Time Warming and Drought on Photosynthesis, Fv/Fm and Stomatal Conductance in the Dominant Species of a Mediterranean Shrubland. Acta Physiol. Plant. 2009, 31, 729–739. [Google Scholar] [CrossRef]
  102. Maxwell, K.; Johnson, G.N. Chlorophyll Fluorescence—A Practical Guide. J. Exp. Bot. 2000, 51, 659–668. [Google Scholar] [CrossRef]
  103. Yamakawa, H.; Itoh, S. Dissipation of Excess Excitation Energy by Drought-Induced Nonphotochemical Quenching in Two Species of Drought-Tolerant Moss: Desiccation-Induced Acceleration of Photosystem II Fluorescence Decay. Biochemistry 2013, 52, 4451–4459. [Google Scholar] [CrossRef]
  104. Chen, C.-I.; Lin, K.-H.; Huang, M.-Y.; Yang, C.-K.; Lin, Y.-H.; Hsueh, M.-L.; Lee, L.-H.; Wang, C.-W. Photosynthetic Physiology Comparisons between No Tillage and Sod Culture of Citrus Farming in Different Seasons under Various Light Intensities. Agronomy 2021, 11, 1805. [Google Scholar] [CrossRef]
  105. D’Ambrosio, N.; Arena, C.; De Santo, A.V. Temperature Response of Photosynthesis, Excitation Energy Dissipation and Alternative Electron Sinks to Carbon Assimilation in Beta vulgaris L. Environ. Exp. Bot. 2006, 55, 248–257. [Google Scholar] [CrossRef]
  106. Arena, C.; Vitale, L.; Virzo de Santo, A. Photosynthesis and Photoprotective Strategies in Laurus nobilis L. and Quercus ilex L. under Summer Drought and Winter Cold. Plant Biosyst. 2008, 142, 472–479. [Google Scholar] [CrossRef]
Figure 1. Evolution of daily average temperature and vapor pressure deficit (VPD) during the experimental period (from November 2020 to June 2021). The arrows indicate the days on which physiological parameters were measured.
Agronomy 12 01696 g001
Figure 2. Example of volumetric water content (VWC) values for the three treatments. Lines represent three different irrigation water ECs: control (solid line, 1.8 dS m−1), SL3 (dotted line, 3.3 dS m−1), and SL5 (dashed line, 4.9 dS m−1). The peaks correspond to the maximum moisture, just after an irrigation event, while the valleys indicate the beginning of an irrigation event.
Agronomy 12 01696 g002
Figure 3. Sample of the stomatal features of the leaves of Hebe at ×400 magnification (abaxial surface).
Agronomy 12 01696 g003
Figure 4. Water relations in Hebe plants (measured at midday): leaf water potential (A), leaf turgor potential (B), and leaf osmotic potential at full turgor (C). Control (1.8 dS m−1), SL3 (3.3 dS m−1), and SL5 (4.9 dS m−1). Data are the mean of six calculations ± standard error. For each measurement date, different letters indicate significant differences between treatments according to the LSD test at p ≤ 0.05.
Agronomy 12 01696 g004
Figure 5. Leaf temperature (A), stomatal conductance at midday (gs) (B), net photosynthesis rate at midday (Pn) (C), and intrinsic water use efficiency (Pn/gs) (D) of Hebe plants during the experiment, for control, SL3, and SL5 treatments. Control (1.8 dS m−1), SL3 (3.3 dS m−1), and SL5 (4.9 dS m−1). Error bars indicate standard errors (n = 6). For each measurement date, different letters indicate significant differences between treatments according to the LSD test at p ≤ 0.05.
Agronomy 12 01696 g005
Figure 6. Effect of irrigation water salinity on chlorophyll fluorescence parameters of Hebe leaves at the end of the experiment. Maximum quantum yield of photosystem II (PSII) (Fv/Fm), effective quantum yield (éPSII), non-photochemical quenching (NPQ), and the ratio of electron transport rate to photosynthesis rate (ETR/Pn). Control (1.8 dS m−1, black), SL3 (3.3 dS m−1, light grey), and SL5 (4.9 dS m−1, dark grey). Values are means (n = 6) and vertical bars indicate ± standard error. Different letters indicate statistically significant differences between means at p < 0.05 according to the least significant difference (LSD) test.
Agronomy 12 01696 g006
Table 1. pH, electrical conductivity (EC), and ion composition of the nutrient solutions: control (1.8 dS m−1), SL3 (3.3 dS m−1), and SL5 (4.9 dS m−1).
MeasurementsTreatments
ControlSL3SL5
pH7.387.597.60
EC (dS m−1)1.813.324.88
NO3 (mg L−1)280.23272.45240.93
NH4+ (mg L−1)1.891.721.81
H2PO4 (mg L−1)17.0915.6014.23
K+ (mg L−1)56.0655.1359.26
Ca2+ (mg L−1)125.72117.93116.50
Mg2+ (mg L−1)57.1853.9053.37
SO42− (mg L−1)258.99258.72258.17
Cl (mg L−1)245.28650.551220.95
Na+ (mg L−1)161.37444.00781.57
HCO3 (mg L−1)105.11111.23108.99
B3+ (mg L−1)0.610.550.52
Mn2+ (mg L−1)0.450.430.41
Fe3+ (mg L−1)0.070.050.06
Zn2+ (mg L−1)0.070.050.05
Cu2+ (mg L−1)0.090.080.08
Table 2. Average volumetric water content (VWC) of the substrate, total applied water (water consumption), daily evapotranspiration (ET), and water use efficiency (WUE). Control (1.8 dS m−1), SL3 (3.3 dS m−1), and SL5 (4.9 dS m−1).
ControlSL3SL5
Substrate VWC (%)49.04 a50.02 a49.03 a
Total applied water (L pot−1)22.9517.2012.25
ET (mL pot−1 day−1)117.8688.3262.89
WUE (g L−1)3.27 b3.50 c4.31 a
Different letters in the same row indicate statistically significant differences between means at p < 0.05 according to the least significant difference (LSD) test.
Table 3. Growth and development parameters of Hebe plants at the end of the experiment. Control (1.8 dS m−1), SL3 (3.3 dS m−1), and SL5 (4.9 dS m−1).
MeasurementsControlSL3SL5
Growth index (cm)42.65 ± 1.83 a38.9 ± 1.04 b36.83 ± 1.11 c
Plant height (cm)42.25 ± 2.12 a40.27 ± 2.25 a34.92 ± 2.09 b
Plant width (cm)39.50 ± 1.64 a36.17 ± 1.49 b33.33 ± 1.34 c
No. of shoots per plant10.00 ± 0.87 a9.67 ± 0.46 a8.83 ± 0.33 b
No. of inflorescences per plant24.07 ± 1.33 a26.33 ± 1.94 a18.83 ± 1.94 b
Total plant dry weight (g)74.97 ± 6.46 a60.22 ± 4.11 b52.77 ± 3.14 c
Leaf dry weight (g)29.38 ± 0.48 a27.19 ± 0.91 b23.2 ± 1.63 c
Stem dry weight (g)20.09 ± 1.65 a17.99 ± 1.22 b15.76 ± 1.03 c
Root dry weight (g)25.5 ± 2.63 a15.05 ± 1.69 b13.8 ± 1.14 b
Root to shoot ratio0.52 ± 0.06 a0.33 ± 0.04 b0.35 ± 0.04 b
No. of leaves per plant336.0 ± 4.33 a287.4 ± 2.97 b269.1 ± 3.11 b
Average blade area (cm2)10.38 ± 0.74 a9.15 ± 0.86 a7.23 ± 0.77 b
Leaf area (dm2)34.86 ± 2.73 a26.3 ± 2.43 b19.45 ± 2.82 c
Specific leaf area (cm2 g−1)118.7 ± 7.23 a96.8 ± 4.17 b83.8 ± 6.32 c
Stomatal density (no. mm−2)318 ± 6.86 a326 ± 4.54 a331 ± 6.36 a
Stomatal pore area (µm2)214 ± 3.99 a206 ± 6.39 a210 ± 5.08 a
Leaf chlorophyll content (mg g−1)0.75 ± 0.04 a0.71 ± 0.06 ab0.68 ± 0.03 b
Different letters in the same row indicate statistically significant differences between means at p < 0.05 according to the least significant difference (LSD) test.
Table 4. Plant macronutrients (N, P, K+) and mineral content (Ca2+, Mg2+, Na+, Cl) in leaves, shoots, and roots of Hebe at the end of the experiment. Control, SL3, and SL5 denote plants grown at (1.8 dS m−1), (3.3 dS m−1), and (4.9 dS m−1), respectively.
Element (mg g−1)Plant OrganControlSL3SL5
NLeaf20.49 ± 1.98 a21.38 ± 2.15 a19.00 ± 1.35 a
Shoot12.68 ± 1.01 a13.47 ± 0.98 a13.05 ± 1.11 a
Root13.72 ± 1.23 a14.32 ± 1.49 a13.66 ± 1.07 a
PLeaf1.86 ± 0.13 a1.99 ± 0.17 a1.81 ± 0.21 a
Shoot0.77 ± 0.06 a1.04 ± 0.06 a0.95 ± 0.05 a
Root1.45 ± 0.14 b2.12 ± 0.16 a1.76 ± 0.19 ab
K+Leaf36.15 ± 2.90 a18.74 ± 1.61 b17.15 ± 1.94 b
Shoot7.82 ± 0.87 a6.19 ± 0.55 b4.07 ± 0.73 c
Root13.96 ± 1.15 a9.81 ± 0.98 b7.69 ± 0.76 c
Ca2+Leaf16.68 ± 1.54 a4.32 ± 0.53 b4.39 ± 0.39 b
Shoot10.83 ± 1.03 a2.62 ± 0.24 b2.05 ± 0.22 b
Root3.93 ± 0.38 a1.12 ± 0.08 b0.85 ± 0.12 b
Mg2+Leaf4.36 ± 0.49 a1.01 ± 0.08 b0.89 ± 0.09 b
Shoot5.28 ± 0.82 a0.93 ± 0.18 b0.62 ± 0.12 b
Root2.58 ± 0.45 a0.53 ± 0.12 b0.34 ± 0.08 b
ClLeaf12.11 ± 0.21 c33.56 ± 2.98 b53.30 ± 5.19 a
Shoot29.49 ± 1.87 b43.33 ± 3.51 a45.76 ± 4.61 a
Root5.21 ± 0.81 c15.96 ± 1.81 b27.46 ± 4.89 a
Na+Leaf2.80 ± 0.29 c4.38 ± 0.68 b9.47 ± 1.06 a
Shoot17.08 ± 1.41 a14.84 ± 1.33 b14.67 ± 0.98 b
Root2.63 ± 0.18 c5.20 ± 0.79 b8.16 ± 0.73 a
K+/Na+Leaf12.91 ± 1.11 a4.28 ± 0.18 b1.81 ± 0.26 c
Shoot0.46 ± 0.03 a0.42 ± 0.04 a0.28 ± 0.03 b
Root5.31 ± 0.73 a1.89 ± 0.20 b0.94 ± 0.14 c
Different letters in the same row indicate statistically significant differences between means at p < 0.05 according to the least significant difference (LSD) test.
Table 5. EC1:2, pH, and ion content of the substrate at the end of the experiment, for control (1.8 dS m−1), SL3 (3.3 dS m−1), and SL5 (4.9 dS m−1).
MeasurementsControlSL3SL5
CE1:2 (dS m−1)1.75 ± 0.21c2.52 ± 0.26b3.27 ± 0.29a
pH5.42 ± 0.52a5.22 ± 0.47a5.66 ± 0.39a
Na+ (mg g−1)11.5 ± 1.02c16.9 ± 1.39b21.7 ± 2.02a
Cl (mg g−1)14.7 ± 1.23c29.5 ± 2.15b34.6 ± 2.98a
K+ (mg g−1)1.8 ± 0.17a1.5 ± 0.16ab1.3 ± 0.11b
NO3 (mg g−1)4.7 ± 0.37a3.3 ± 0.29b1.4 ± 0.14c
Ca2+ (mg g−1)11.2 ± 1.09a8.6 ± 0.99b7.9 ± 0.76b
SO42− (mg g−1)14.5 ± 1.87a9.1 ± 1.02b5.3 ± 0.42c
Different letters in the same row indicate statistically significant differences between means at p < 0.05 according to the least significant difference (LSD) test.
Publisher’s Note: MDPI stays neutral with regard to jurisdictional claims in published maps and institutional affiliations.

