Article

Individual and Combined Effects of High-Temperature Stress at Booting and Flowering Stages on Rice Grain Yield

1
National Engineering and Technology Center for Information Agriculture, Key Laboratory for Crop System Analysis and Decision Making, Ministry of Agriculture, Jiangsu Key Laboratory for Information Agriculture, Nanjing Agricultural University, Nanjing 210095, China
2
National Research Centre of Intercropping, The Islamia University of Bahawalpur, Bahawalpur 63100, Pakistan
3
Department of Agronomy, University of Agriculture Faisalabad, Faisalabad 38000, Pakistan
4
Graduate School of Agricultural and Life Sciences, The University of Tokyo, 1-1-1 Yayoi, Bunkyo, Tokyo 113-8657, Japan
*
Author to whom correspondence should be addressed.
Agronomy 2022, 12(12), 3092; https://doi.org/10.3390/agronomy12123092
Submission received: 25 September 2022 / Revised: 25 November 2022 / Accepted: 28 November 2022 / Published: 6 December 2022
(This article belongs to the Special Issue Adaptation and Mitigation of Environmental Stress on Crops)

Abstract

:
Extreme temperature events as a consequence of global climate change result in a significant decline in rice yield. A two year phytotron experiment was conducted using three temperature levels and two heating durations to compare the effects of heat stress at booting (BT), flowering (FL), and combined (BT + FL) stages on rice yield and yield components. Compared with T1 (Tmean of 27 °C), heat stress at BT + FL and BT stages produced more regenerated tillers and compensated more for yield loss than heat stress at FL. Heat stress at BT + FL stages alleviated spikelet sterility and yield loss of original tillers compared to heat stress at FL. The greater variation of yield per plant (YPP) under heat stress at flowering as compared to BT and BT + FL stages was accompanied by a higher decrease in spikelet fertility, while, at BT and BT + FL stages, spikelet number per plant and 1000-grain weight also contributed well to variation in yield. Furthermore, heat stress during BT and BT + FL stages caused a significant decline in spikelet fertility of the upper part of panicles, followed by middle and lower parts, while heat stress at the FL stage responded inversely. For every 1 °C day increase in heat degree days at BT, FL, and BT + FL stages, YPPO (only original tillers) declined by 2.9%, 2.5%, and 6.0%, and YPPT (including original + regenerated tillers) decreased by 5.8%, 2.7%, and 2.2%, respectively. The projected alleviation effects under BT + FL stages of heat stress in contrast to single-stage heat stress would help to accurately estimate rice yield under extreme temperature events, as well as to develop a heat-tolerant rice cultivar.

1. Introduction

Climate is considered a key yield-determining factor in crop production. The overall surface temperature of the world has risen by approximately 1.1 °C since 1850, and this increase is expected to exceed 1.5 °C in the next few decades [1]. Climate change not only enhances the mean temperature but also intensifies the frequency and severity of heat stress events [2]. The compendium of scientific literature on climate change research indicates that short events of heat stress around the reproductive growth period result in a substantial decline in the yields of cereal crops, particularly in rice (Oryza sativa L.) [3,4,5]. About half of the world’s population feeds on rice [6,7], and it is mostly cultivated in areas where the average temperature range is already touching the threshold limits [8]. It is anticipated that short episodes of heat stress will increase in both frequency and magnitude and cause a threat to more than 120 million hectares of arable area under rice cultivation globally [9]. Therefore, a further increase in global average temperature will cause significant grain yield losses in rice [3,10,11]. A previous report estimated a 41% decline in rice yield by the end of this century due to heat stress [12].
Heat stress causes irreversible injury to crop plants when the temperature exceeds the threshold value and persists for a certain duration [13,14]. However, the severity of stress damage depends on the type of cultivar, growth stage, and physiological processes [15]. According to Espe et al. (2017), grain yield was most affected by short-term heat stress or point stresses during the reproductive growth stages (booting and flowering) [16]. Booting follows panicle initiation, characterized by a swelling of the flag leaf sheath, and it continues for 15 days until a panicle from the boot comes up (heading), whereas flowering occurs upon heading and lasts until the completion of whole-panicle anthesis [17,18,19]. Generally, the flowering stage is the most sensitive stage to heat stress followed by the booting stage [10,19,20,21]. Furthermore, the rice yield reduction due to these point stresses is relatively higher than the seasonal warming losses [16].
Heat stress during the booting stage mainly affects cell division, while, at flowering, it causes the pollen damage or failure of anthers to discharge pollen grain and finally yield reduction [14,22,23,24]. Grain yield losses are mainly determined by different yield components, such as spikelet number per panicle, 1000-grain weight, spikelet fertility, and panicle number per plant. Each component differs not only concerning growth stages but also in terms of relative contribution to yield. Previous studies have shown that yield formation is primarily affected by high-temperature stress during the early reproductive stages rather than during the later reproductive stages [10,17,25]. Therefore, to maintain and increase grain yields under future climate scenarios, it is indispensable to identify the yield components governing the yield variation and mitigate their susceptibility to high temperatures during the early reproductive stages.
Plants can cope with alleviated temperature either by their inherent ability termed as ‘basal thermo-tolerance’ or induced heat acclimation strategies known as ‘acquired thermo-tolerance’ [26,27]. Thus, to develop thermo-tolerance in plants, heat acclimatization is a relatively fast and effective strategy to combat abiotic stresses where the exposure to past stress in plants changes responses to stress events later [28]. During the heat acclimatization phase, changes take place at the physiological, biochemical, molecular, and epigenetic levels, and these changes can be transient or sustained throughout the life of a plant and sometimes can even be inherited by succeeding generations [29]. Heat acclimatization has been achieved in plants by mild heat stress treatment in most of the earlier studies [30,31,32]; however, fewer studies have reported heat acclimation by severe heat stress treatment prior to heat stress at a particular growth stage. Moreover, previous studies were mainly focused on the impact of high-temperature at a particular growth stage of rice [10,22,33,34]; however, evaluation of high-temperature effects at various growth stages simultaneously has hardly been reported.
Hence, this study was conducted to explore the relative influence of yield components to the variation of rice grain yield under heat stress at booting (BT), flowering (FL), and combined (BT + FL) stages, and to establish a relationship of yield, and yield components with heat degree days. The outcomes of this study can assist in accurately estimating yield formation under extreme temperature events, as well as in developing heat-tolerant rice cultivars.

2. Materials and Methods

2.1. Experimental Design

The study was conducted in Rugao City, Jiangsu Province, China (120.33° E, 32.23° N). Two japonica rice genotypes (Wuyunjing 24 and Huaidao 5) were subjected to a two year environmentally controlled plant phytotron experiment from 2016 to 2017. Rice seedlings were transplanted into plastic pots upon reaching the three-leaf stage at the density of three hills per pot and two seedlings per hill. Each pot contained 22.4 L of soil with a diameter of 35.6 cm, a height of 29.8 cm, and a volume of 25.0 L, and it was kept submerged until a week before harvest. Compared with the plant density of japonica rice grown in the area, which varies from 60 to 75 plants per square meter (Jiangsu Agricultural Commission, 2011), the density of potted plants in the present study was about 66 plants per square meter. We planted 2000 pots in total to ensure we had enough resources for heat treatment. Base fertilizers were applied at the rate of 1.5 g N, 1.5 g P2O5, and 2 g K2O per pot, respectively, before transplanting. Supplemental N was added at rates of 0.3 and 1.2 g N per pot during mid-tiller and panicle start, respectively. Other crop husbandry practices such as irrigation and crop protection were carried out following local rice production standards.
All pots were kept under ambient conditions except during heat stress imposition. Pots containing plants with an equal number of tillers were transferred to phytotron chambers (L × D × H; 3.4 m × 3.2 m × 2.8 m) for heat stress treatments at booting (BT) (characterized by the swelling of the flag leaf sheath), flowering (FL) (characterized by 50% of the panicle initiating spikelet opening), and combined (BT + FL) stages. For BT + FL stage heat stress treatment, heat-stressed rice plants at the BT stage were again transferred to phytotrons at the FL stage for similar heat stress treatments. Heat stress treatments included three temperature levels with daily maximum and minimum ranges: 22 °C/32 °C (T1), 30 °C/40 °C (T2), and 34 °C/44 °C (T3), with two temperature durations: 2 days (D2) and 4 days (D4) (Table 1). However, heat stress durations for plants treated at the BT + FL stage were 4 days (D2+2) and 8 days (D4+4). The dynamics of temperature change in phytotrons were simulated with the dynamics of ambient temperature, and these dynamics were consistent for both years. Therefore, we only present the trend of 2016 (Figure 1).
Phytotrons were equipped with 5TM sensors, a VP-3 sensor, and PYR solar radiation sensors from METER Group, Inc. USA to measure air (Ta, °C) and soil temperature (Ts, °C), relative humidity (RH, %), and photosynthetically active radiation (PAR, µmol m−2s−1), respectively. The values of vapor pressure deficit (VPD) were estimated as suggested by Allen et al. (1998). For measuring canopy temperature (Tc, °C) an infrared radiometer (SI-111, Apogee Instruments, Logan, UT, USA) was installed in the middle of each chamber at a height of 1.6 m and directed diagonally downward onto a 0.8 m2 patch of plant surface. The dynamics of all these recorded weather parameters are displayed in Figure 1.

2.2. Measurement of Grain Yield Parameters

To examine the grain yield per plant (YPP, g per plant), panicle number per plant (PNPP), spikelet number per panicle (SNPP), spikelet fertility (SF, %), and 1000-grain weight (TGW, g), five pots per treatment combination were randomly chosen at physiological maturity. Primary branches from each panicle were separated into upper, middle, and lower portions on the basis of their vertical positions. Grains were manually divided into productive and unproductive sections. The ratio of fertile spikelets to the total spikelets was used to compute the SF.
Carbon and nitrogen nutrients transferred to the axillary buds and roots owing to extreme spikelet sterility under T2 and T3 treatments and resulted in the production of new young panicle-bearing tillers from the axillary buds which were named as regenerated tillers [35]. Consequently, the final panicles under the T2 and T3 treatments had original and regenerated tillers. Therefore, the high-temperature effect on grain yield and its components were observed for original and total tillers (original + regenerated tillers). Regenerated tillers were also included in the calculation of yield and yield components.

2.3. Calculation of Heat Degree Days

Heat degree days (HDD) were used to quantify heat stress in this study. HDD reflects the intensity and duration of heat stress across the treatments with different temperature levels and stress durations. Accumulated heat degree days (HDD, °C day) were the accumulated daily heat degree days (HDi) during the stress treatment period from the first day of treatment to the mth day after treatment.
HDD was calculated as follows:
HDD = i = 1 m HD i ,
HD i = 1 24 t = 1 24 HD t ,
HD t = 0   T t < T h T t T h   T t T h ,
Where HDt (°C day) denotes the hourly high-temperature degree days, and Tt is the hourly air temperature at the tth hour of a day which was recorded by an EM50 data logger. Th (°C) specifies the temperature threshold for heat stress; following previous reports, threshold temperatures of 33 °C and 35 °C for booting and flowering were used in this study [10,15]. According to their absolute value, grain yield and its components varied between cultivars and growing seasons. As a result, the relative values of these variables were used to compare the reactions to HDD. Relative values were calculated for the same treatment stage and cultivar as the ratio of absolute values from different treatments and the control treatment (T1) regarding corresponding values.

2.4. Statistical Analysis

The data of yield and yield components acquired from both experiments were subjected to univariate analysis of the variance (ANOVA) using GLM procedures in IBM SPSS Version 19.0 (IBM Corporation, Armonk, NY, USA). The differences between treatment combination temperature level and temperature duration means were assessed using Duncan’s new multiple range test at 95% level of significance. Additionally, the contribution of yield components to yield was measured using multilinear regression to assess grain yield variation under heat stress. Using simple linear regression, relationships between heat degree day (HDD) and yield or yield components (YPP, PNPP, SNPP, SF, and TGW) were also developed to quantify heat stress effects on rice yield formation.

3. Results

3.1. Analysis of Variance for Yield and Yield Components

Increasing temperature levels and duration significantly reduced rice grain yield at all growth stages for both cultivars, except the interactive effects of temperature levels and duration at the BT stage of Wuyunjing-24, which was nonsignificant. The main effects of high-temperature level (T) and duration (D) were significant for all traits except D for PNPP of cultivar Wuyunjing-24 at the FL stage, whereas the interaction T × D was significant for all traits except for YPP of cultivar Wuyunjing-24 at the BT stage (Table 2).

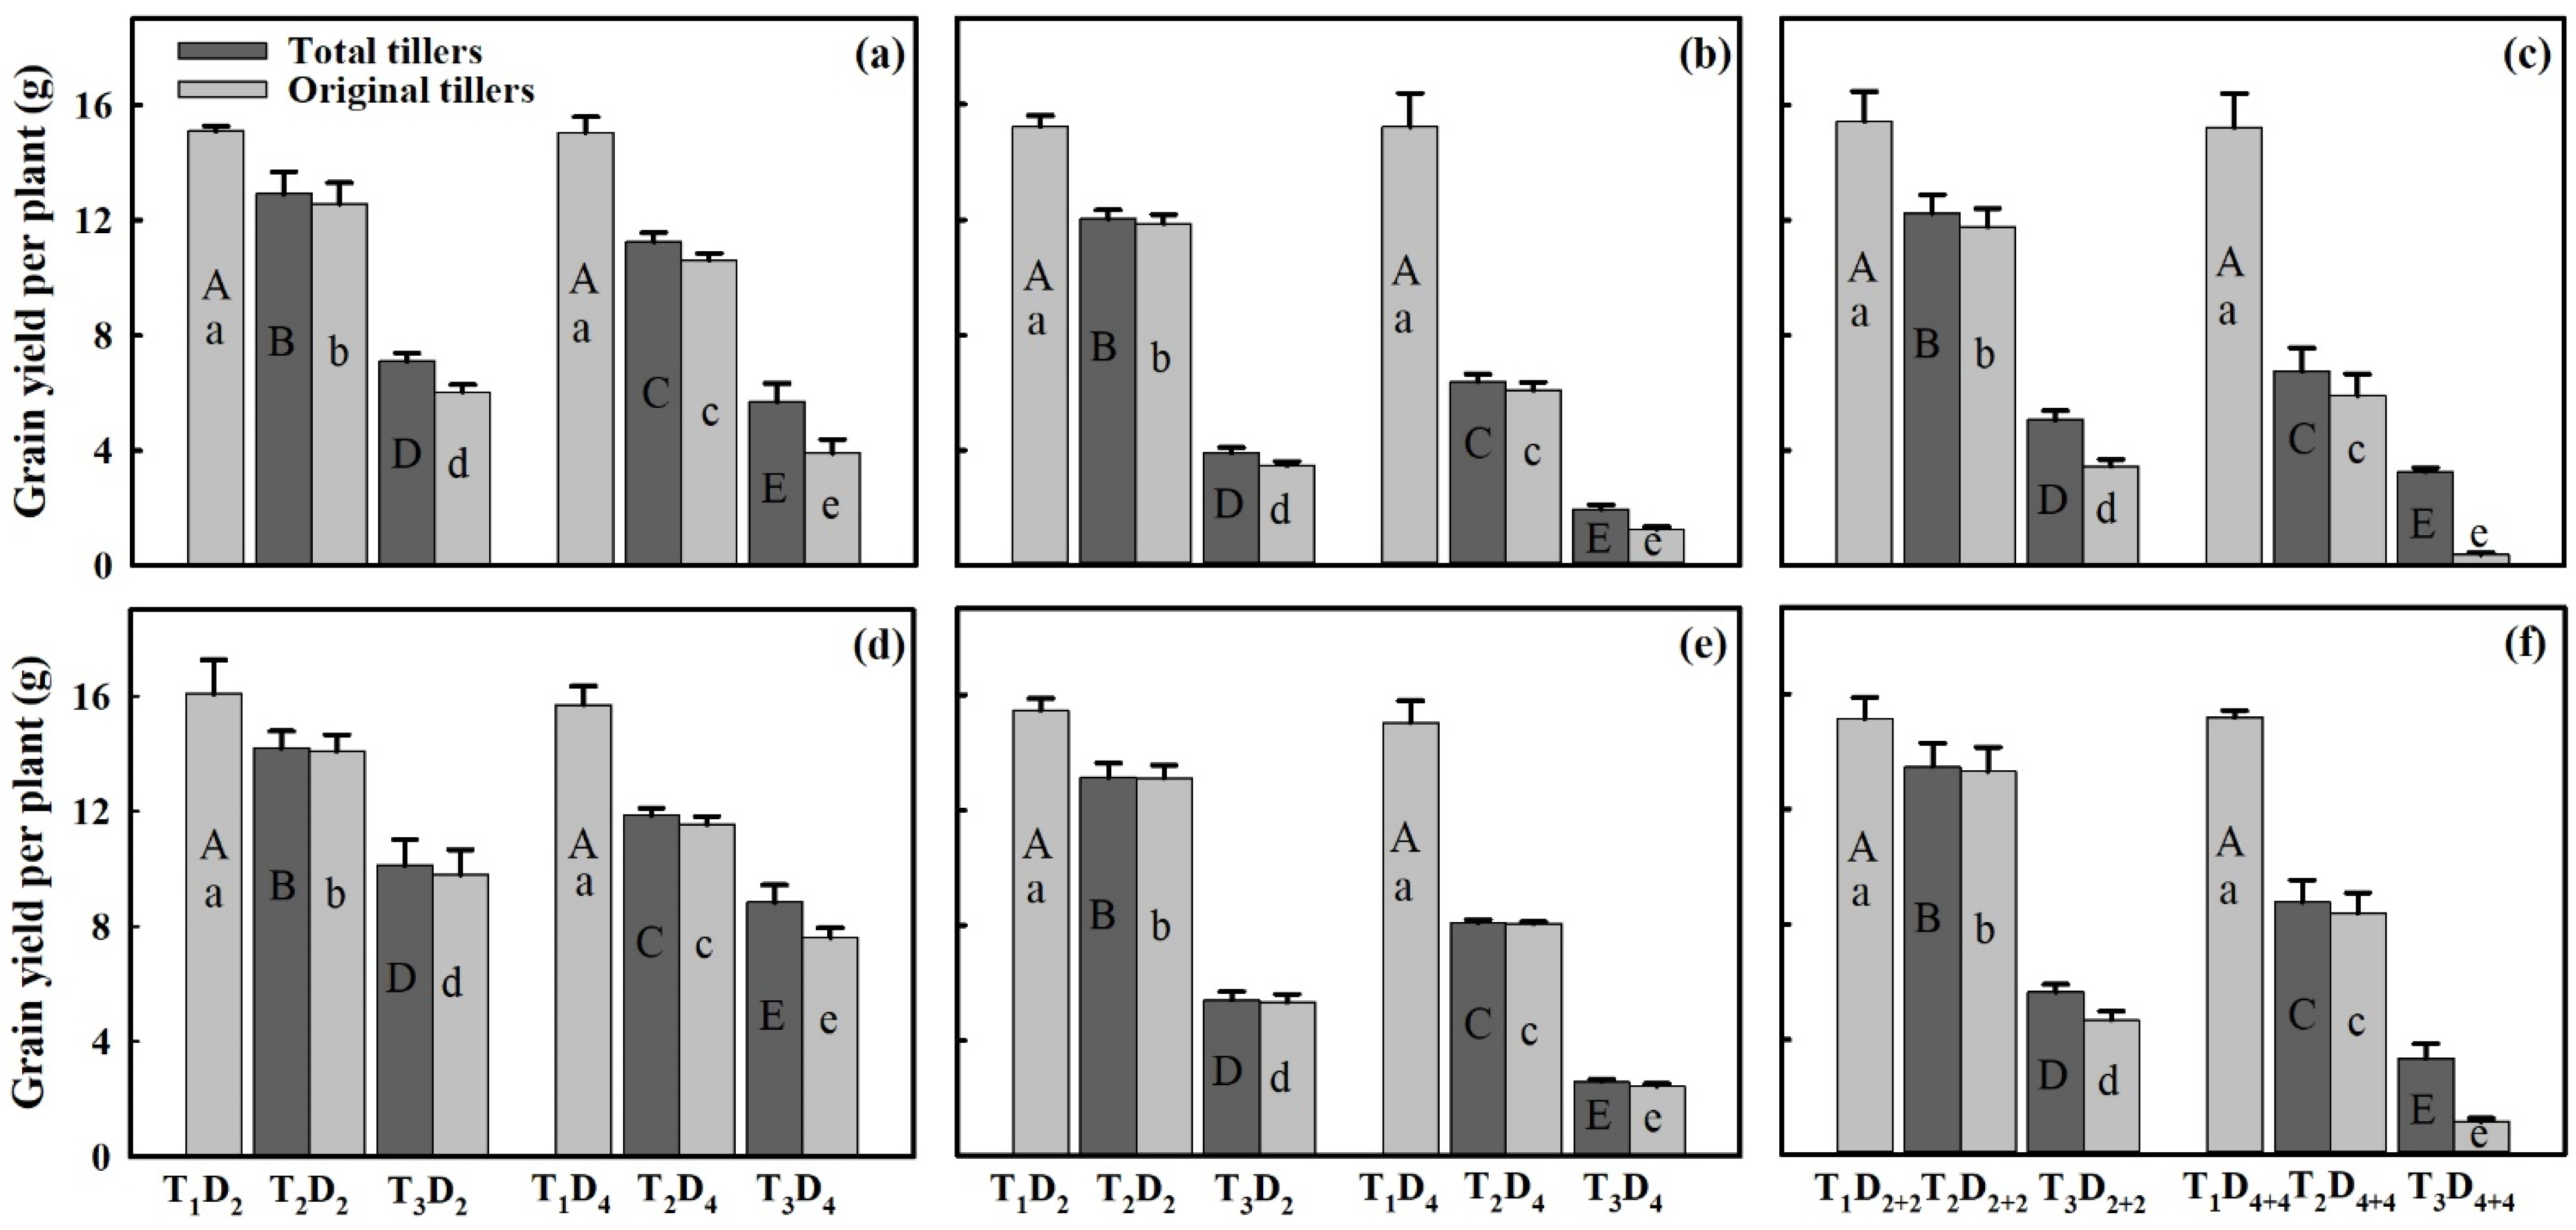
3.2. Effects of Extreme High-Temperature Stress on Grain Yield

With increasing temperature levels and duration at booting (BT), flowering (FL), and combined (BT + FL) stages, yield per plant for original tillers (YPPO) and yield per plant including regenerated tillers (YPPT) exhibited a decreasing trend for both cultivars (Figure 2). The decrease in YPPT for T2 and T3 as compared to the control (T1) at BT, FL, and BT + FL stages for Huaidao-5 was 14.4–62.1%, 21.0–86.8%, and 20.8–78.5% and for Wuyunjing-24 was 11.7–43.7%, 15.1–82.8%, and 11.1–78.1%, respectively. The above ranges include the minimum and maximum values from T2D2 to T3D4 for single stages and T2D2+2 to T3D4+4 for the BT + FL stage. Results revealed that Huaidao-5, despite its higher sensitivity to high temperatures, has a better yield compensation ability achieved through regenerated tillers (RT) as compared to Wuyunjing-24. The outcome, as mentioned above, also implies that yield compensation due to RT followed the trend BT + FL stage > BT stage > FL stage. Furthermore, as compared to T1, YPPO showed distinct alleviation effects only for treatment T2 of Wuyunjing-24 which showed about a 13.8–45.7% decrease at the BT + FL stage and a 15.1–47.7% decrease at FL, whereas, for other treatments, YPPO losses at the BT + FL stage were equal or more than FL.
Moreover, even under the same high-temperature duration, the negative impact of rising high-temperature level on the YPP of Huaidao-5 was higher as compared to Wuyunjing-24 at all stages. Moreover, at the same high-temperature level, YPP showed significant decline at BT, FL, and BT + FL stages under increasing temperature duration in both cultivars.

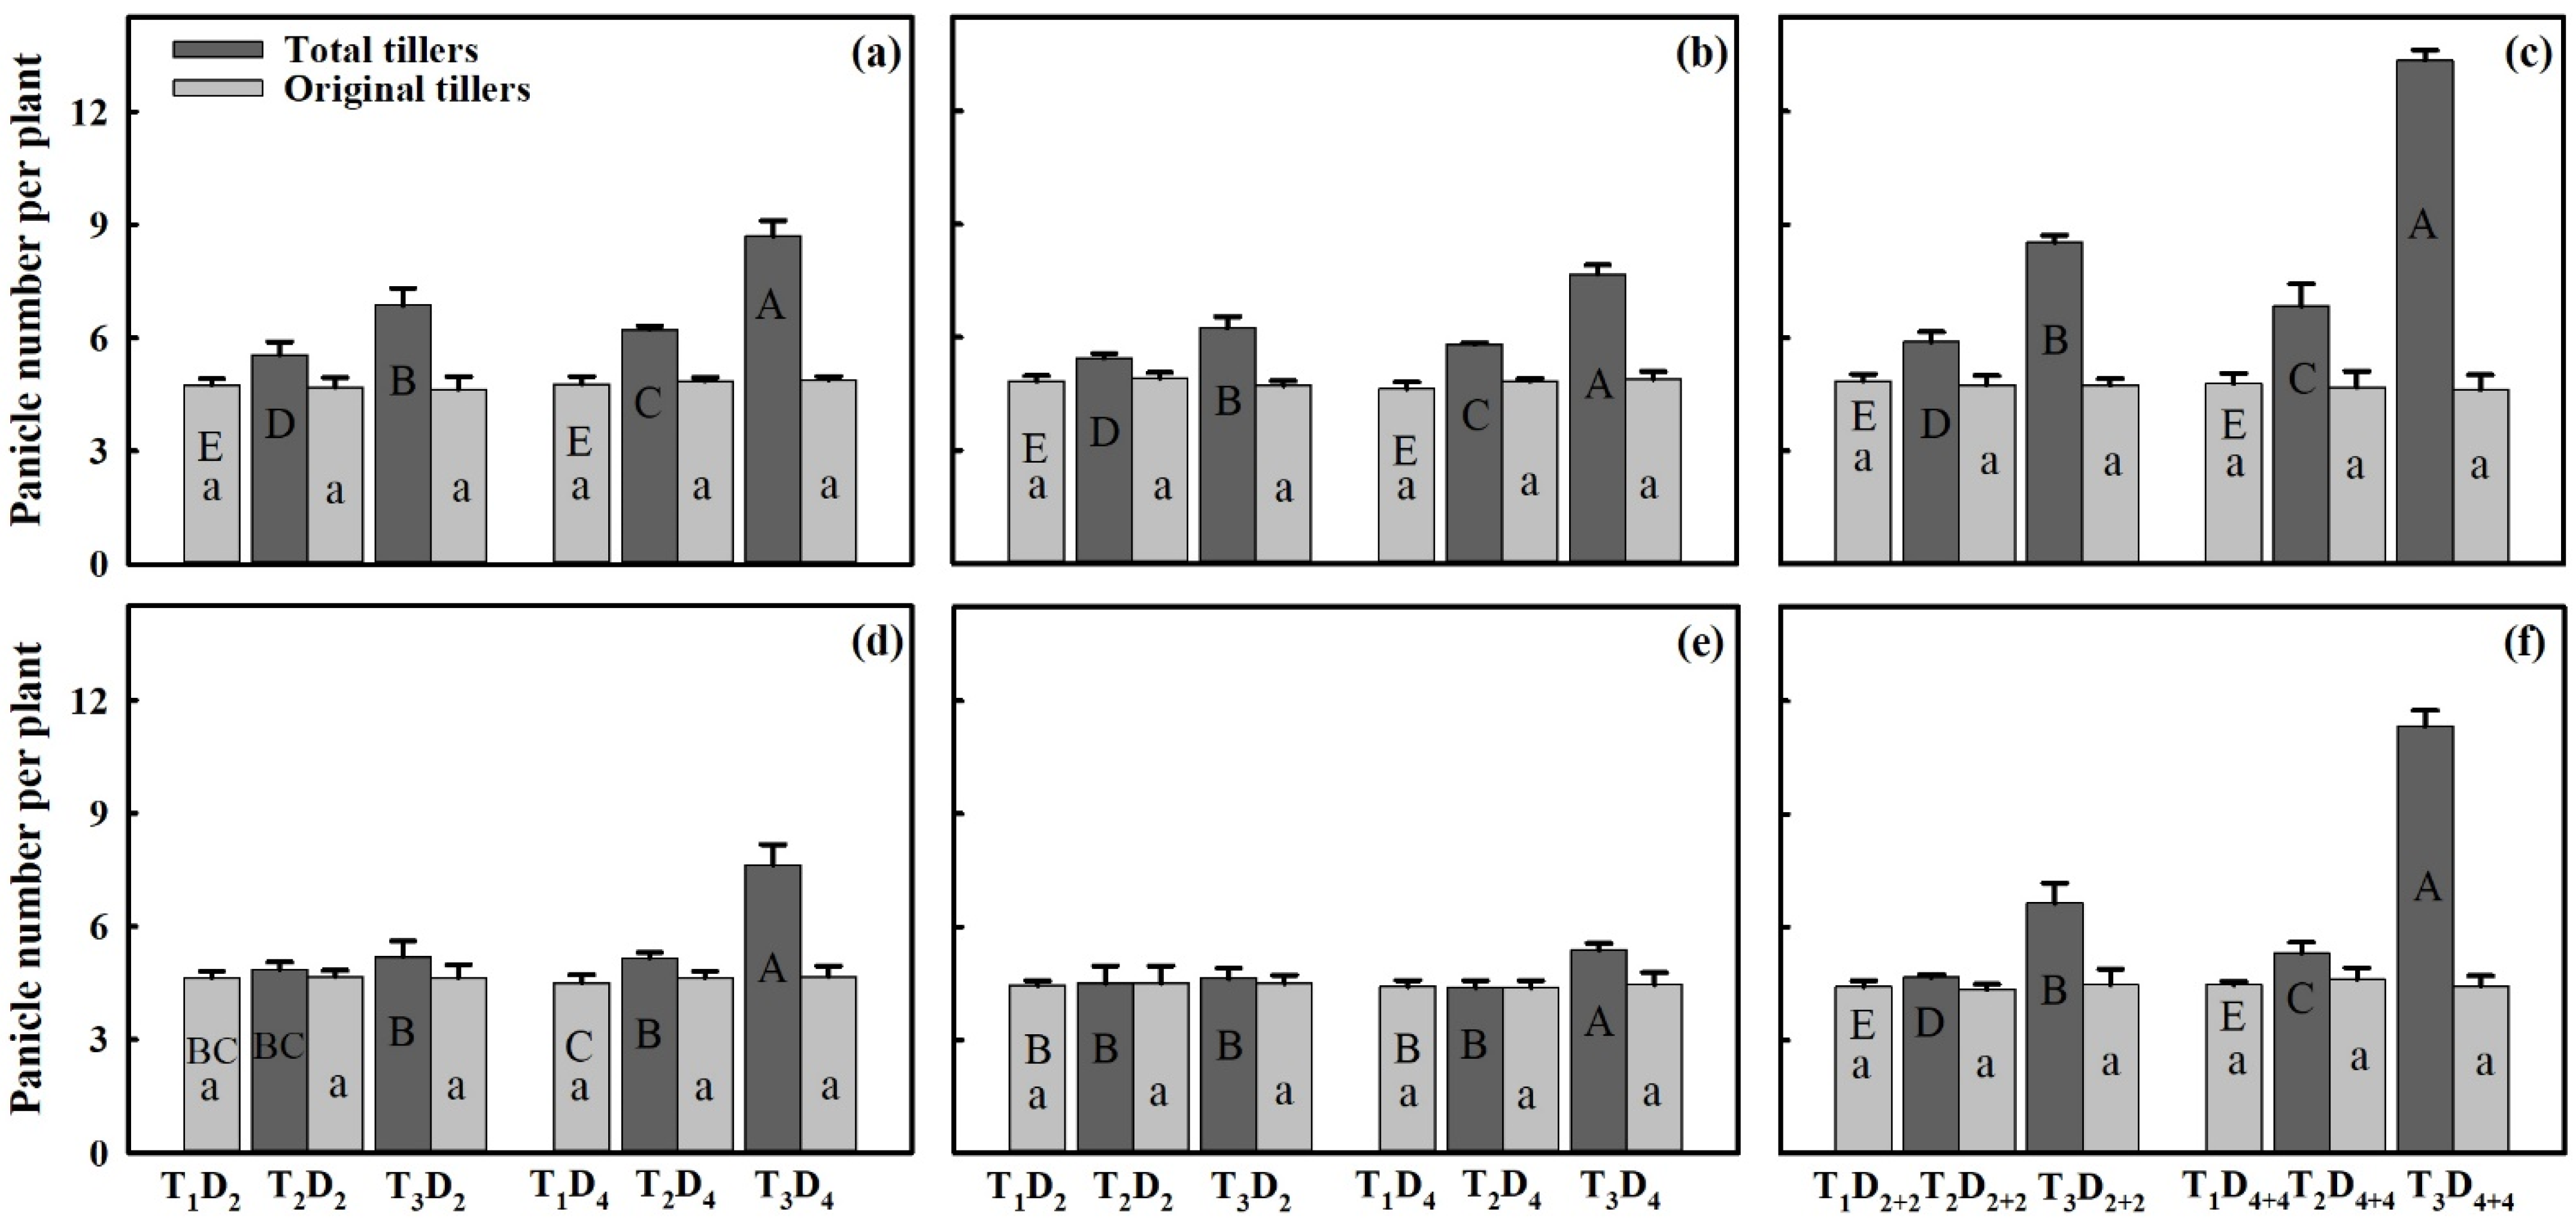
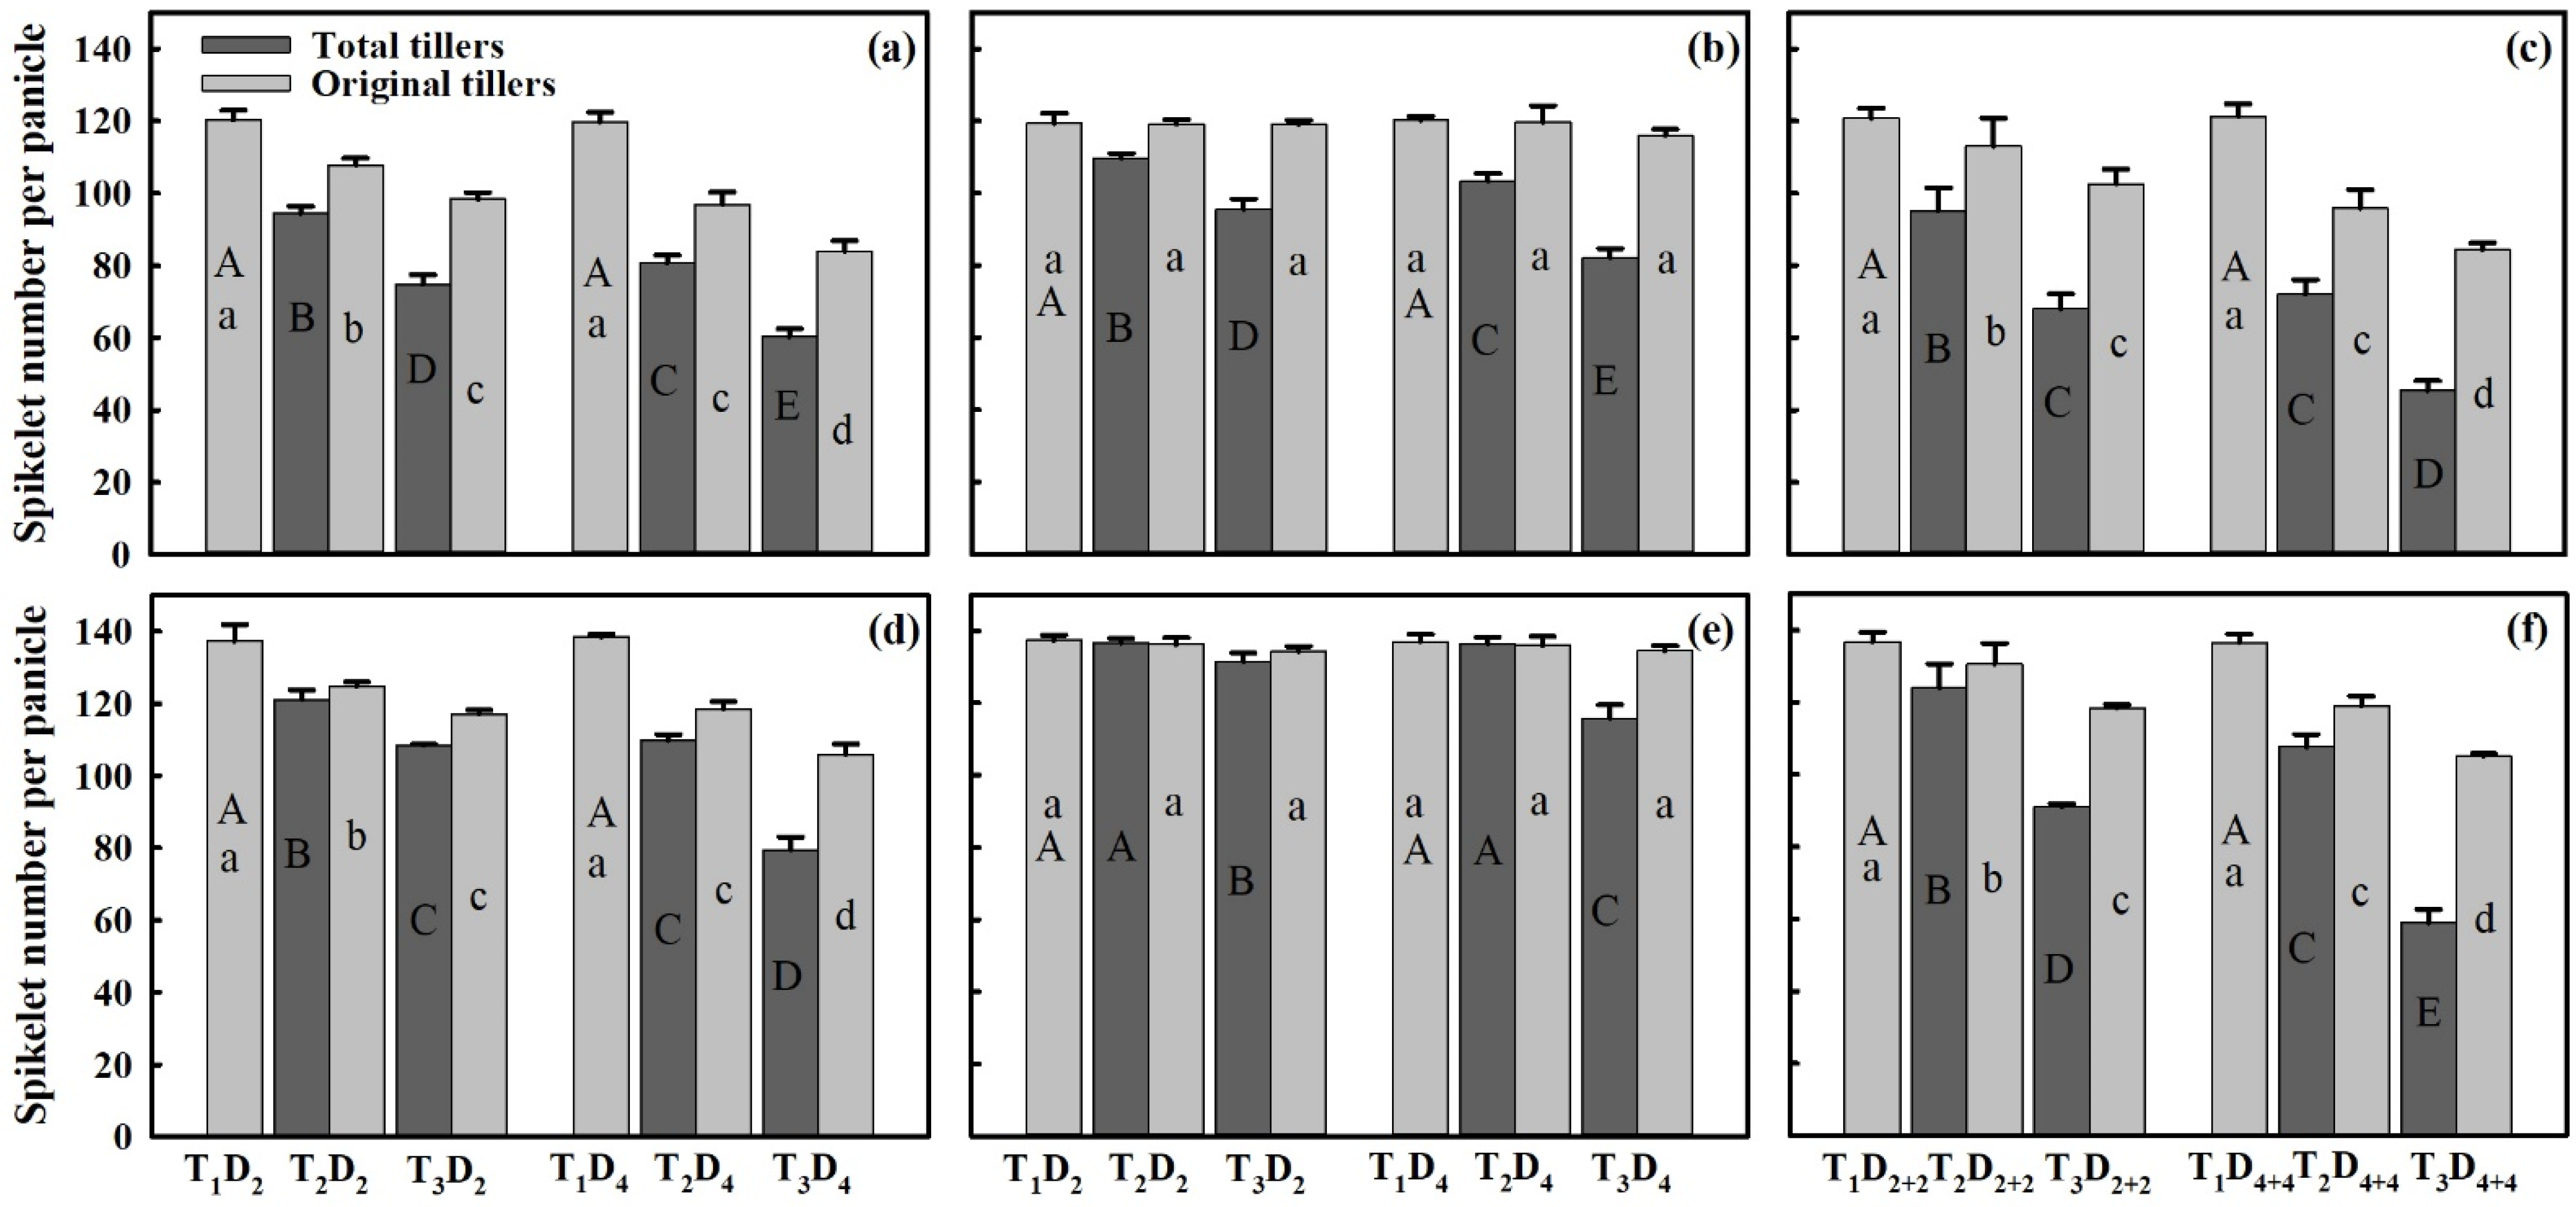
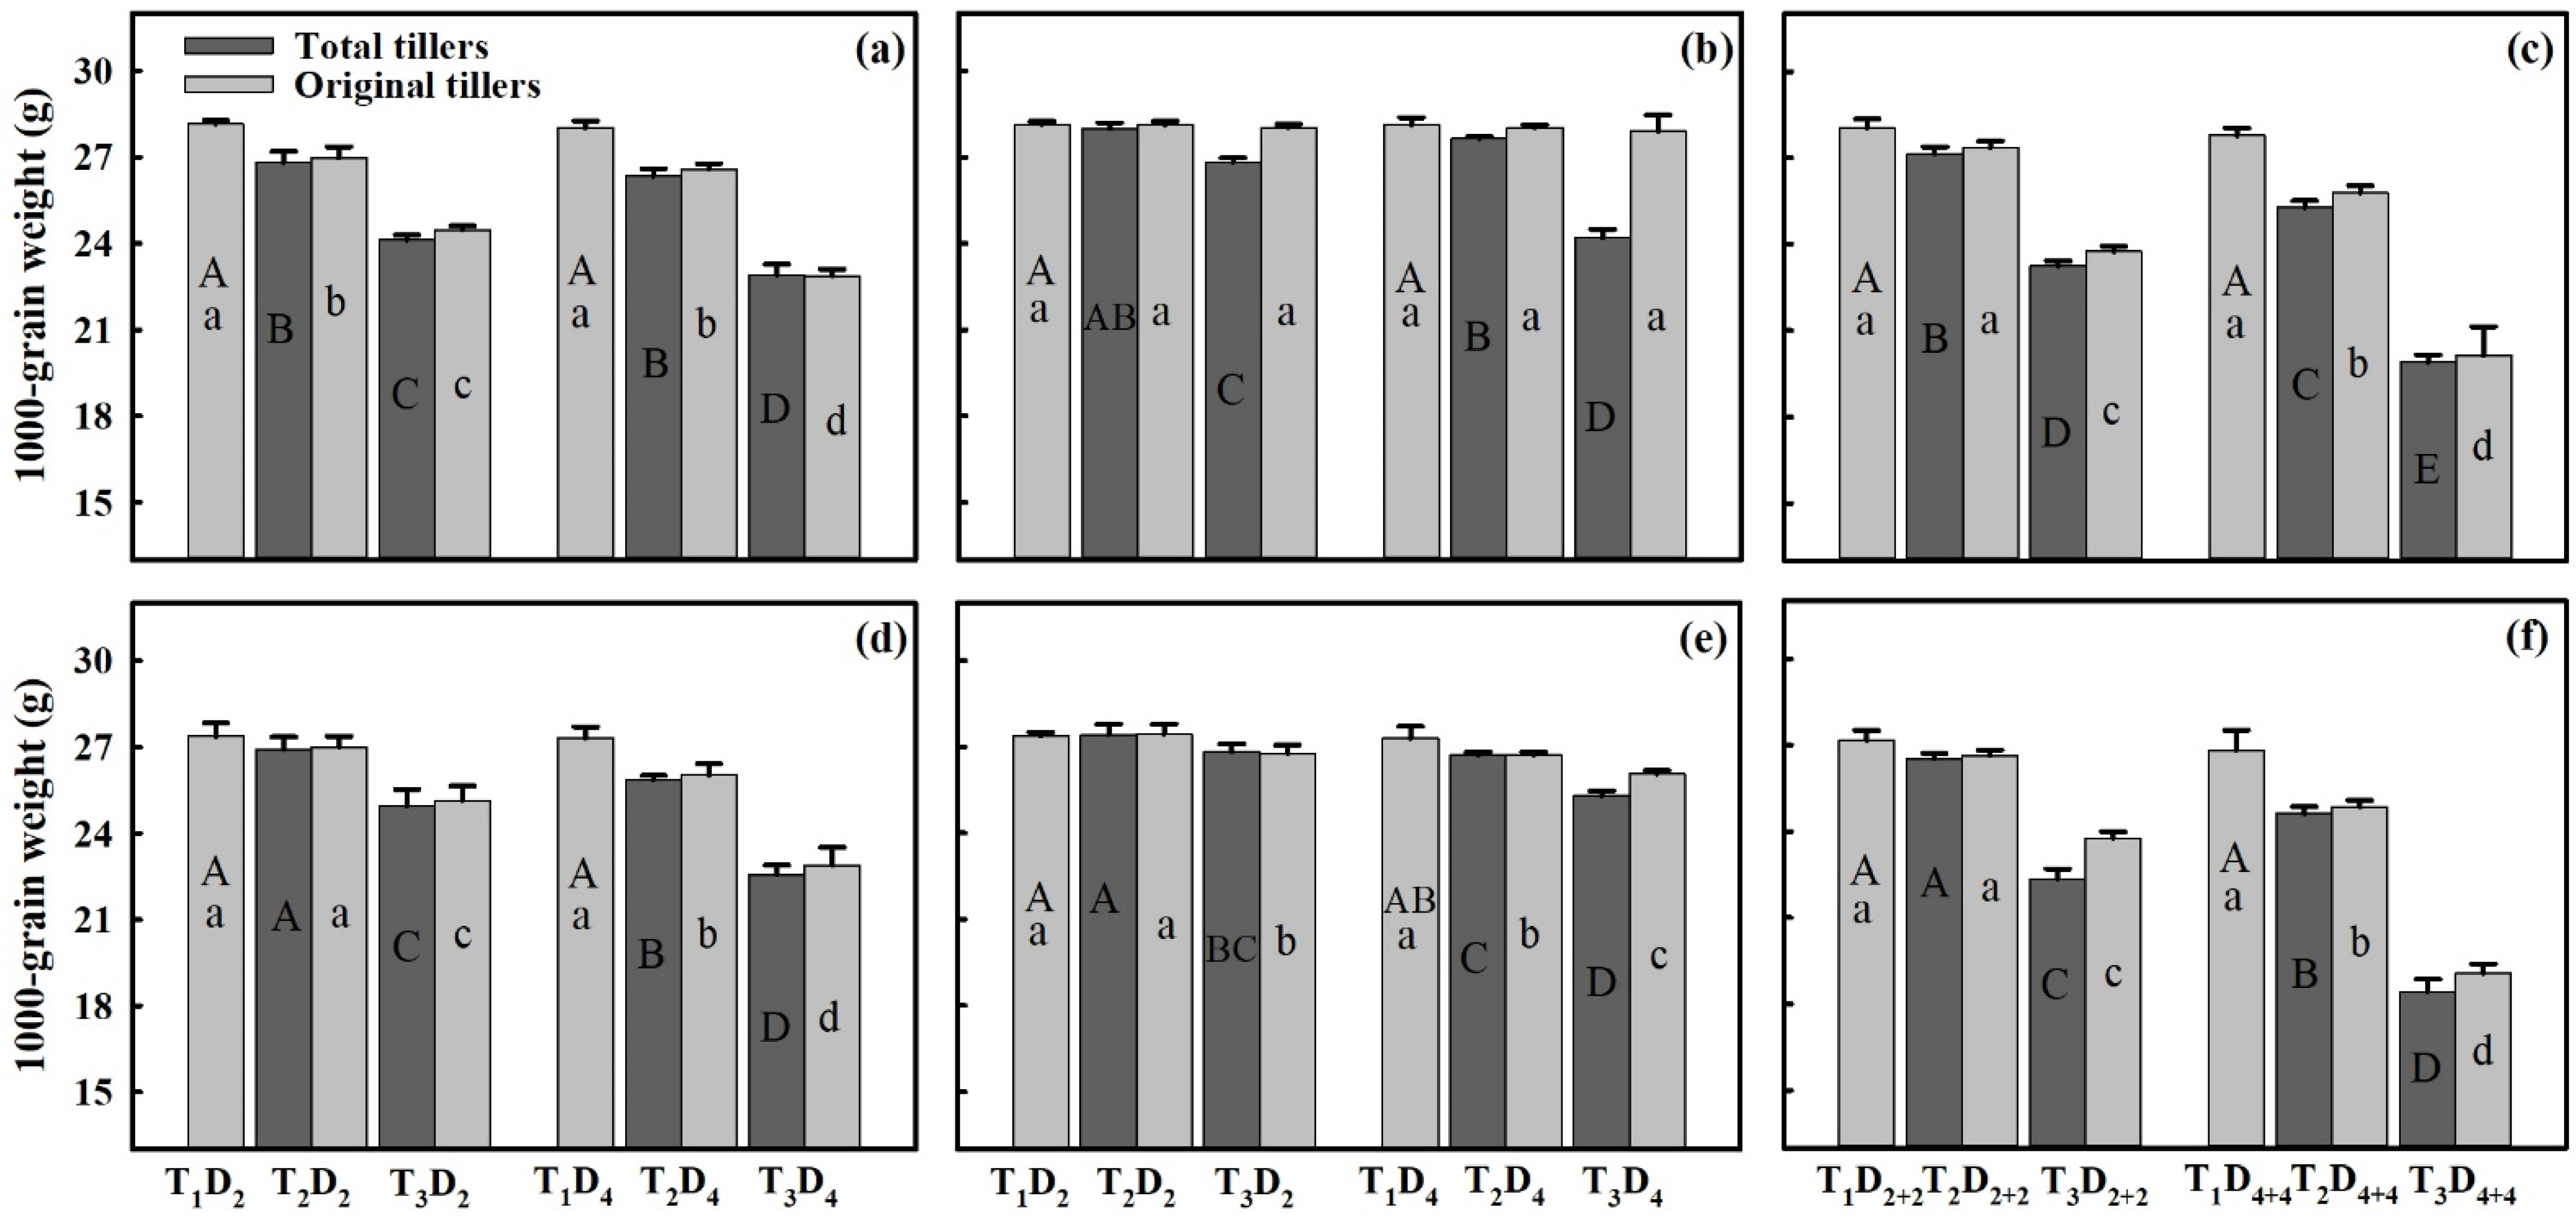
3.3. Effect of Extreme High-Temperature Stress on Yield Components

Results showed that the panicle number per plant of original tillers (PNPPO) was not affected by warming regimes. In contrast, PNPPT (original + regenerated tillers) increased with increasing temperature as compared to T1. The number of regenerated tillers was maximum at the BT + FL stage followed by BT, and FL, and much higher for temperature level T3 than T2 (Figure 3). Compared with T1, SNPPO declined more at BT and BT + FL stages, while, at FL, a nonsignificant difference was observed. As compared to T1, high temperature at BT, FL, and BT + FL stages for T2 and T3 treatments caused a decrease in SNPPT, to 21.5–49.8%, 8.9–31.7%, and 20.9–62.3% in Huaidao-5, and to 11.8–42.1%, 0.5–15.7%, and 9.6–57.1% in Wuyunjing-24, respectively (Figure 4). Moreover, SFO showed significant alleviation effects for BT + FL stage as compared to FL except for treatment T3D4. As compared to T1, high-temperature at BT, FL, and BT + FL stages for T2 and T3 treatments caused a decrease in SFT, to 2.2–49.5%, 23.3–86.6% and 14.3–71.1% % in Huaidao-5, and to 2.7–29.9%, 15.2–82.3%, and 5.0–70.5% in Wuyunjing-24, respectively (Figure 5). Under high-temperature stress, a decrease in TGWO was also more at BT and BT + FL stages; however, less effect was observed under FL. As compared to T1, high-temperature treatments T2 and T3 caused a decrease in TGWT, to 4.4–18.3%, 0.2–13.6%, and 3.2–29.0% in Huaidao-5, and to 1.2–17.3%, 0.6–7.2%, and 2.7–32.4% in Wuyunjing-24 at BT, FL, and BT + FL stages, respectively (Figure 6).
For every 1 °C increase in high temperature under different high-temperature durations at BT, FL, and BT + FL stages, SNPPT, SFT, and TGWT decreased for both cultivars. This reveals that SNPP and TGW were more susceptible to high-temperature level at BT + FL and BT stages, respectively, but SF was more vulnerable at FL, and the yield losses were primarily induced by SF under high temperatures. For every 1 °C increase in high temperature at BT, FL, and BT + FL stages, PNPPT for D4 (D4+4 for BT + FL stage) increased by 6.4%, 5.1%, and 13.5% for Huaidao-5, and increased by 5.2%, 1.6%, and 11.3% for Wuyunjing-24. Additionally, every 1 day increase in high-temperature duration resulted in an obvious decrease in T2 as compared to T3 for FL and BT + FL stages. A significant decline was observed in both cultivars for SNPP, SF, and TGW with increasing high-temperature duration at BT, FL, and BT + FL stages. The decrease in TGWO and TGWT showed non-significant and significant differences for heat stress at FL, respectively. Moreover, for every 1 day increase in high-temperature duration, the decline in TGWT at FL in Huaidao-5 was even more than that at BT. For every 1 day increase in high-temperature duration, the results for PNPPT revealed that T2 produced much lower RT compared to T3.

3.4. Multivariate Analysis between Grain Yield and Yield Components under Heat Stress

The relations obtained through multiple linear regressions among grain yield and yield components (PNPP, SNPP, SF, and TGW) for original and total tillers under different treatments are shown in Table 3. The results revealed that YPP under the control treatment was significantly (p < 0.01) related to PNPP, SNPP, SF, and TGW, and the most robust relations were observed for PNPP followed by SNPP, TGW, and SF, respectively, while, under higher-temperature treatments, opposite trends of these relations were observed. The contribution of PNPPO to YPPO at higher-temperature treatments was not significant, while PNPPT showed a negative contribution to YPPT and its input was higher at BT and BT + FL stages. The variation of SNPPO to YPPO under T2 and T3 treatments in Huaidao-5 and Wuyunjing-24, respectively, accounted for obvious changes at the BT stage (57.2–42.7% and 26.1–36.9%) as compared to BT + FL stage (22.1–5.7% and 21.2–7.0%), while the FL stage showed a nonsignificant contribution of SNPPO to yield. Additionally, the contribution of TGWO to YPPO under T2 and T3 was more significant at BT (2.8–5.7% and 15.2–29.1%) and BT + FL (6.0–25.4% and 15.6–1.9%) stages for Huaidao-5 and Wuyunjing-24 respectively, while, at the FL stage, the contribution was nearly 0. SFO was the most important yield component under high temperature at all growth stages, mainly at the FL stage with variability of 94.3% and 96.7% in Huaidao-5 and 76.0% and 96.7% in Wuyunjing-24 under T2 and T3. Other yield components for total tillers had an almost similar trend to original tillers and were, thus, not discussed.

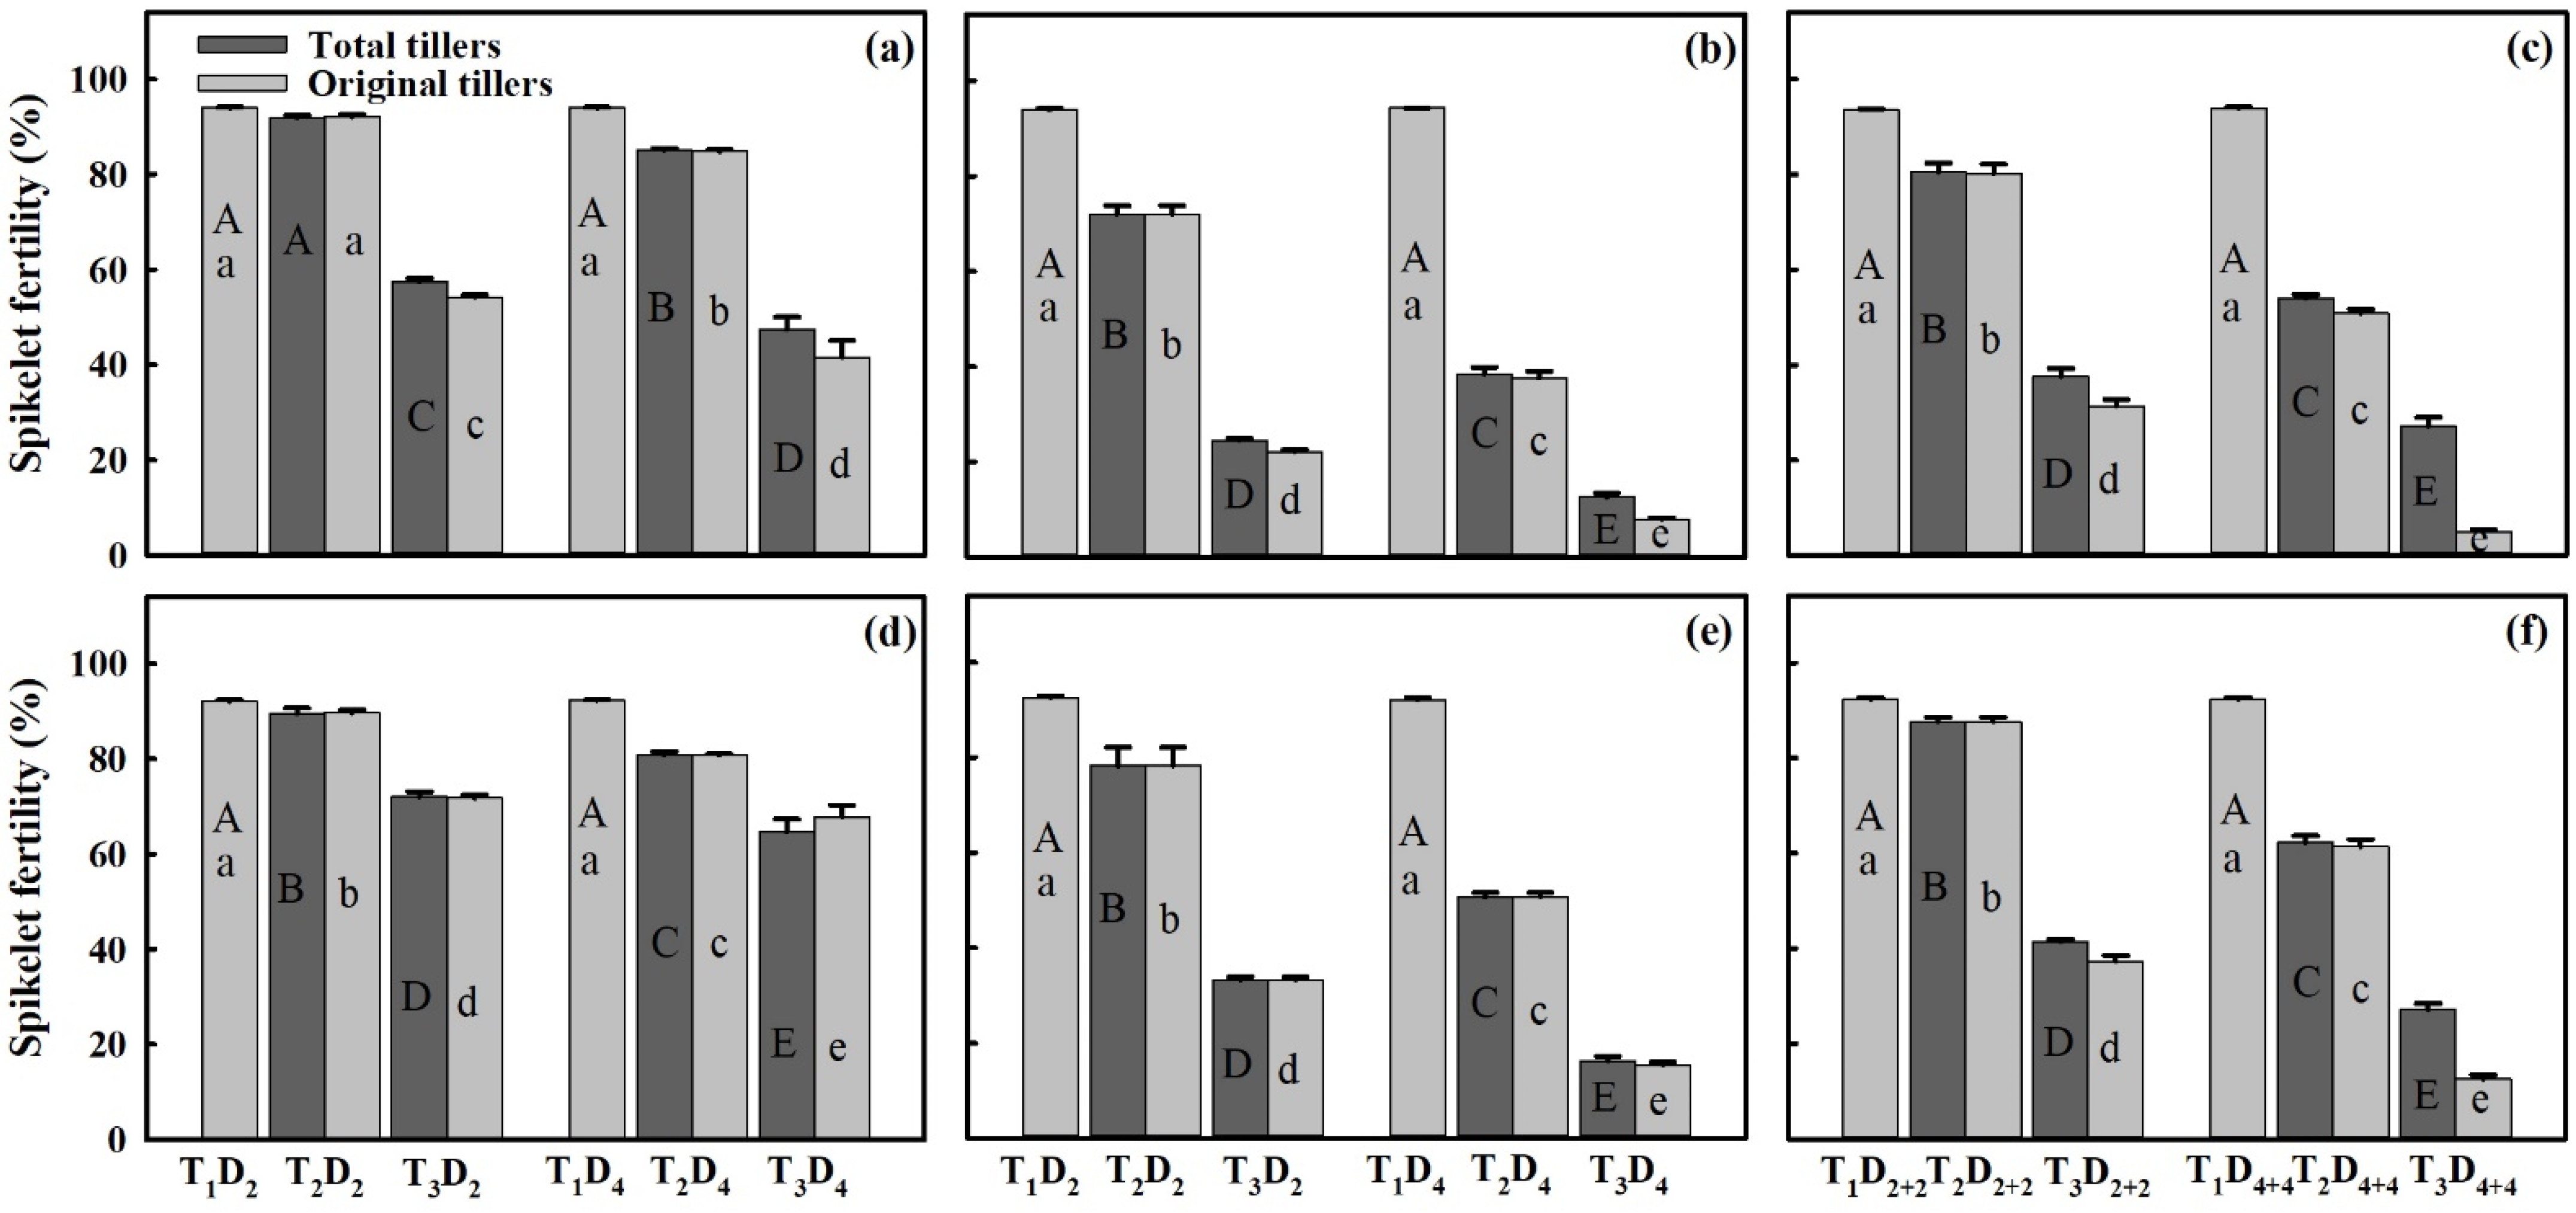
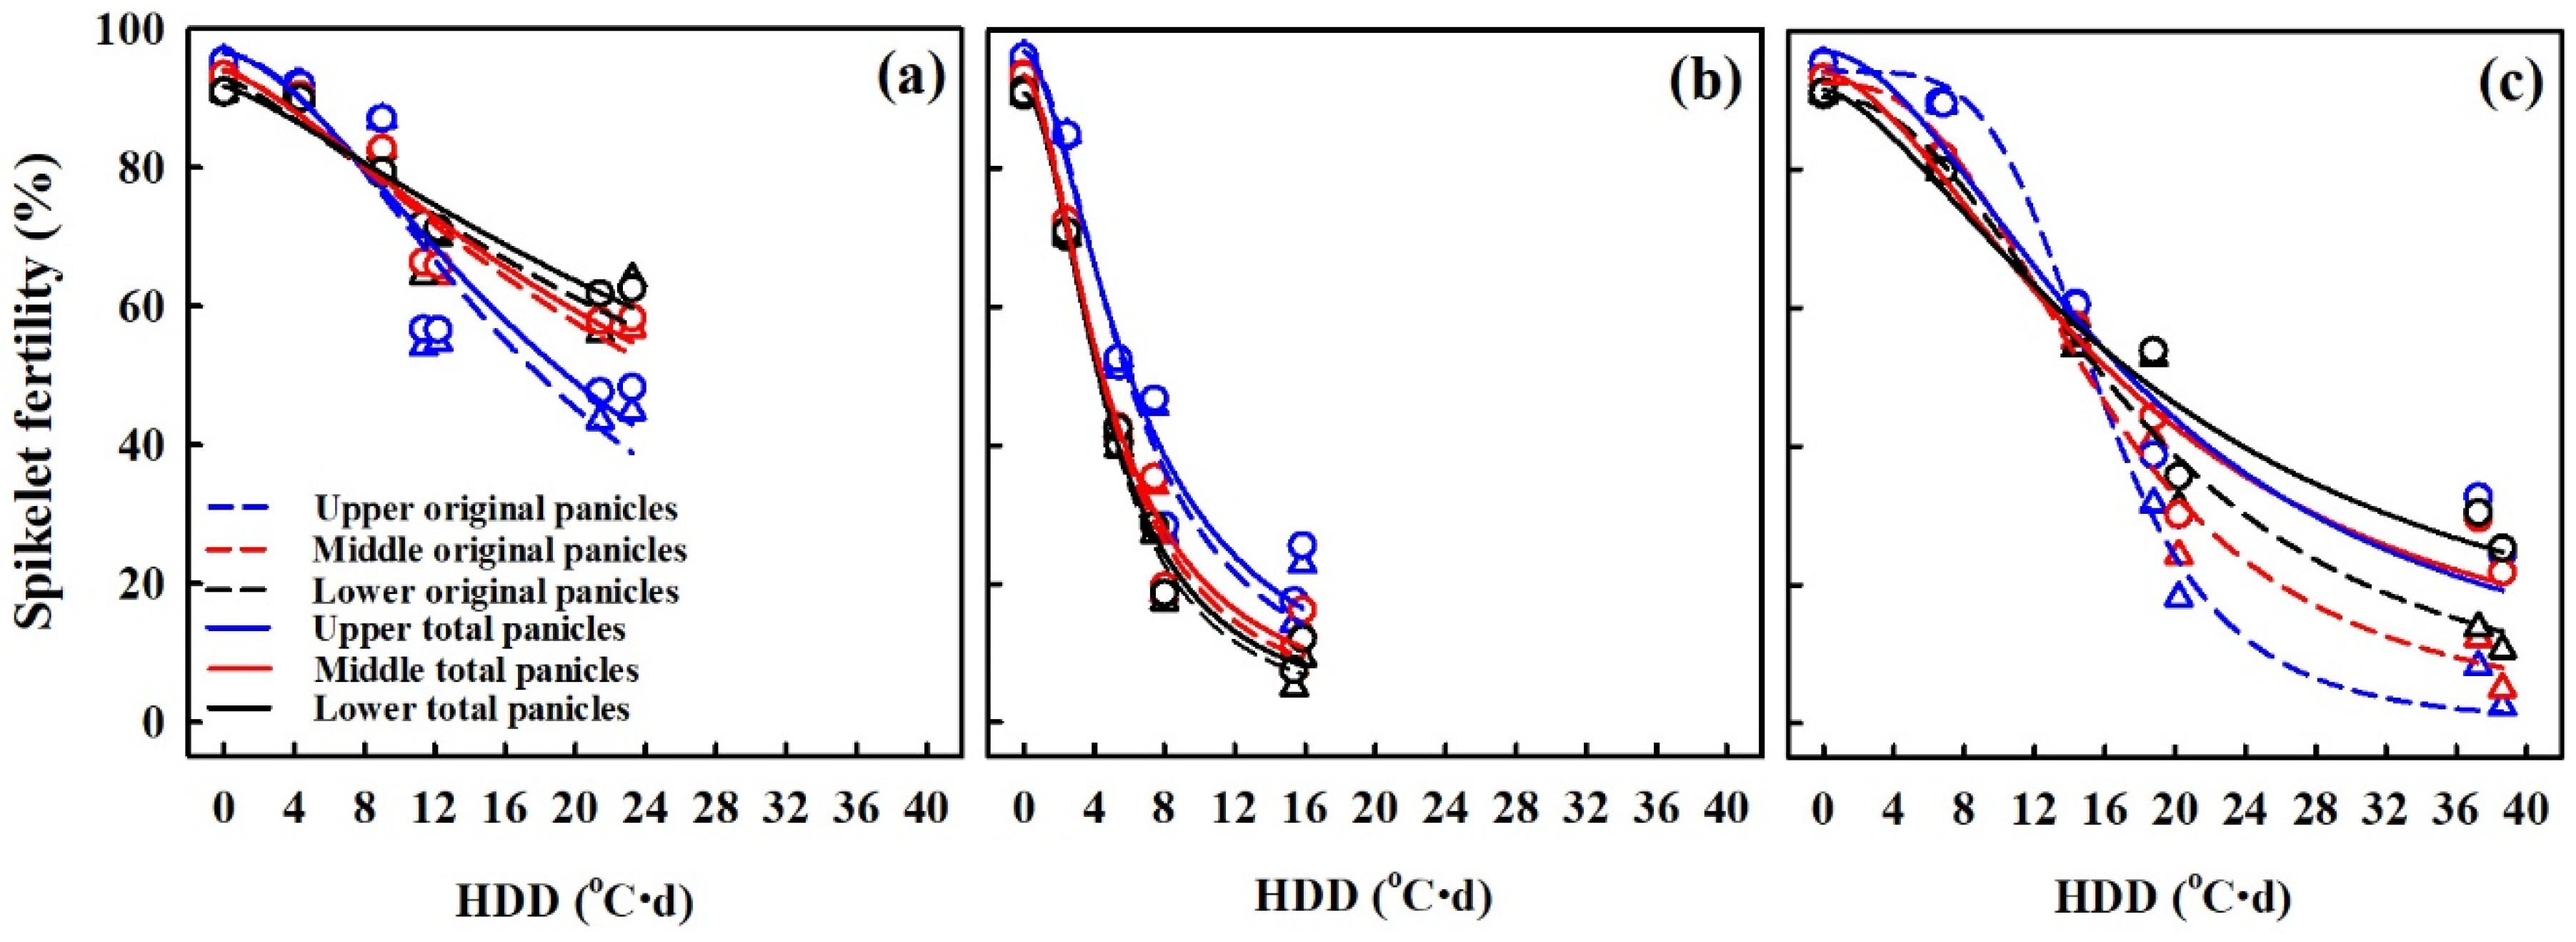
3.5. Spikelet Fertility (%) in Response to HDD at Various Panicle Positions

Spikelet fertility was the most vulnerable yield component at all three stages; therefore, it was analyzed for upper, middle, and lower portions of the rice panicle (Figure 7). SF (%) at varying panicle positions in reaction to high-temperature stress at different stages, fitting well to a logistic equation of HDD. Heat stress at BT and BT + FL stages resulted in an obvious decline in SFO of the upper part of panicles, followed by the middle and lower parts, respectively. Heat stress significantly decreased SFO at FL and BT + FL stages. Compared with SFO, SFT values increased due to regenerating tillers at BT and BT + FL stages, but the increasing proportion of the BT + FL stage was higher. The loss of SFT was much higher under FL treatments due to less RT. Furthermore, the upper part of the panicle was less affected by high-temperature stress than other parts at the FL stage.

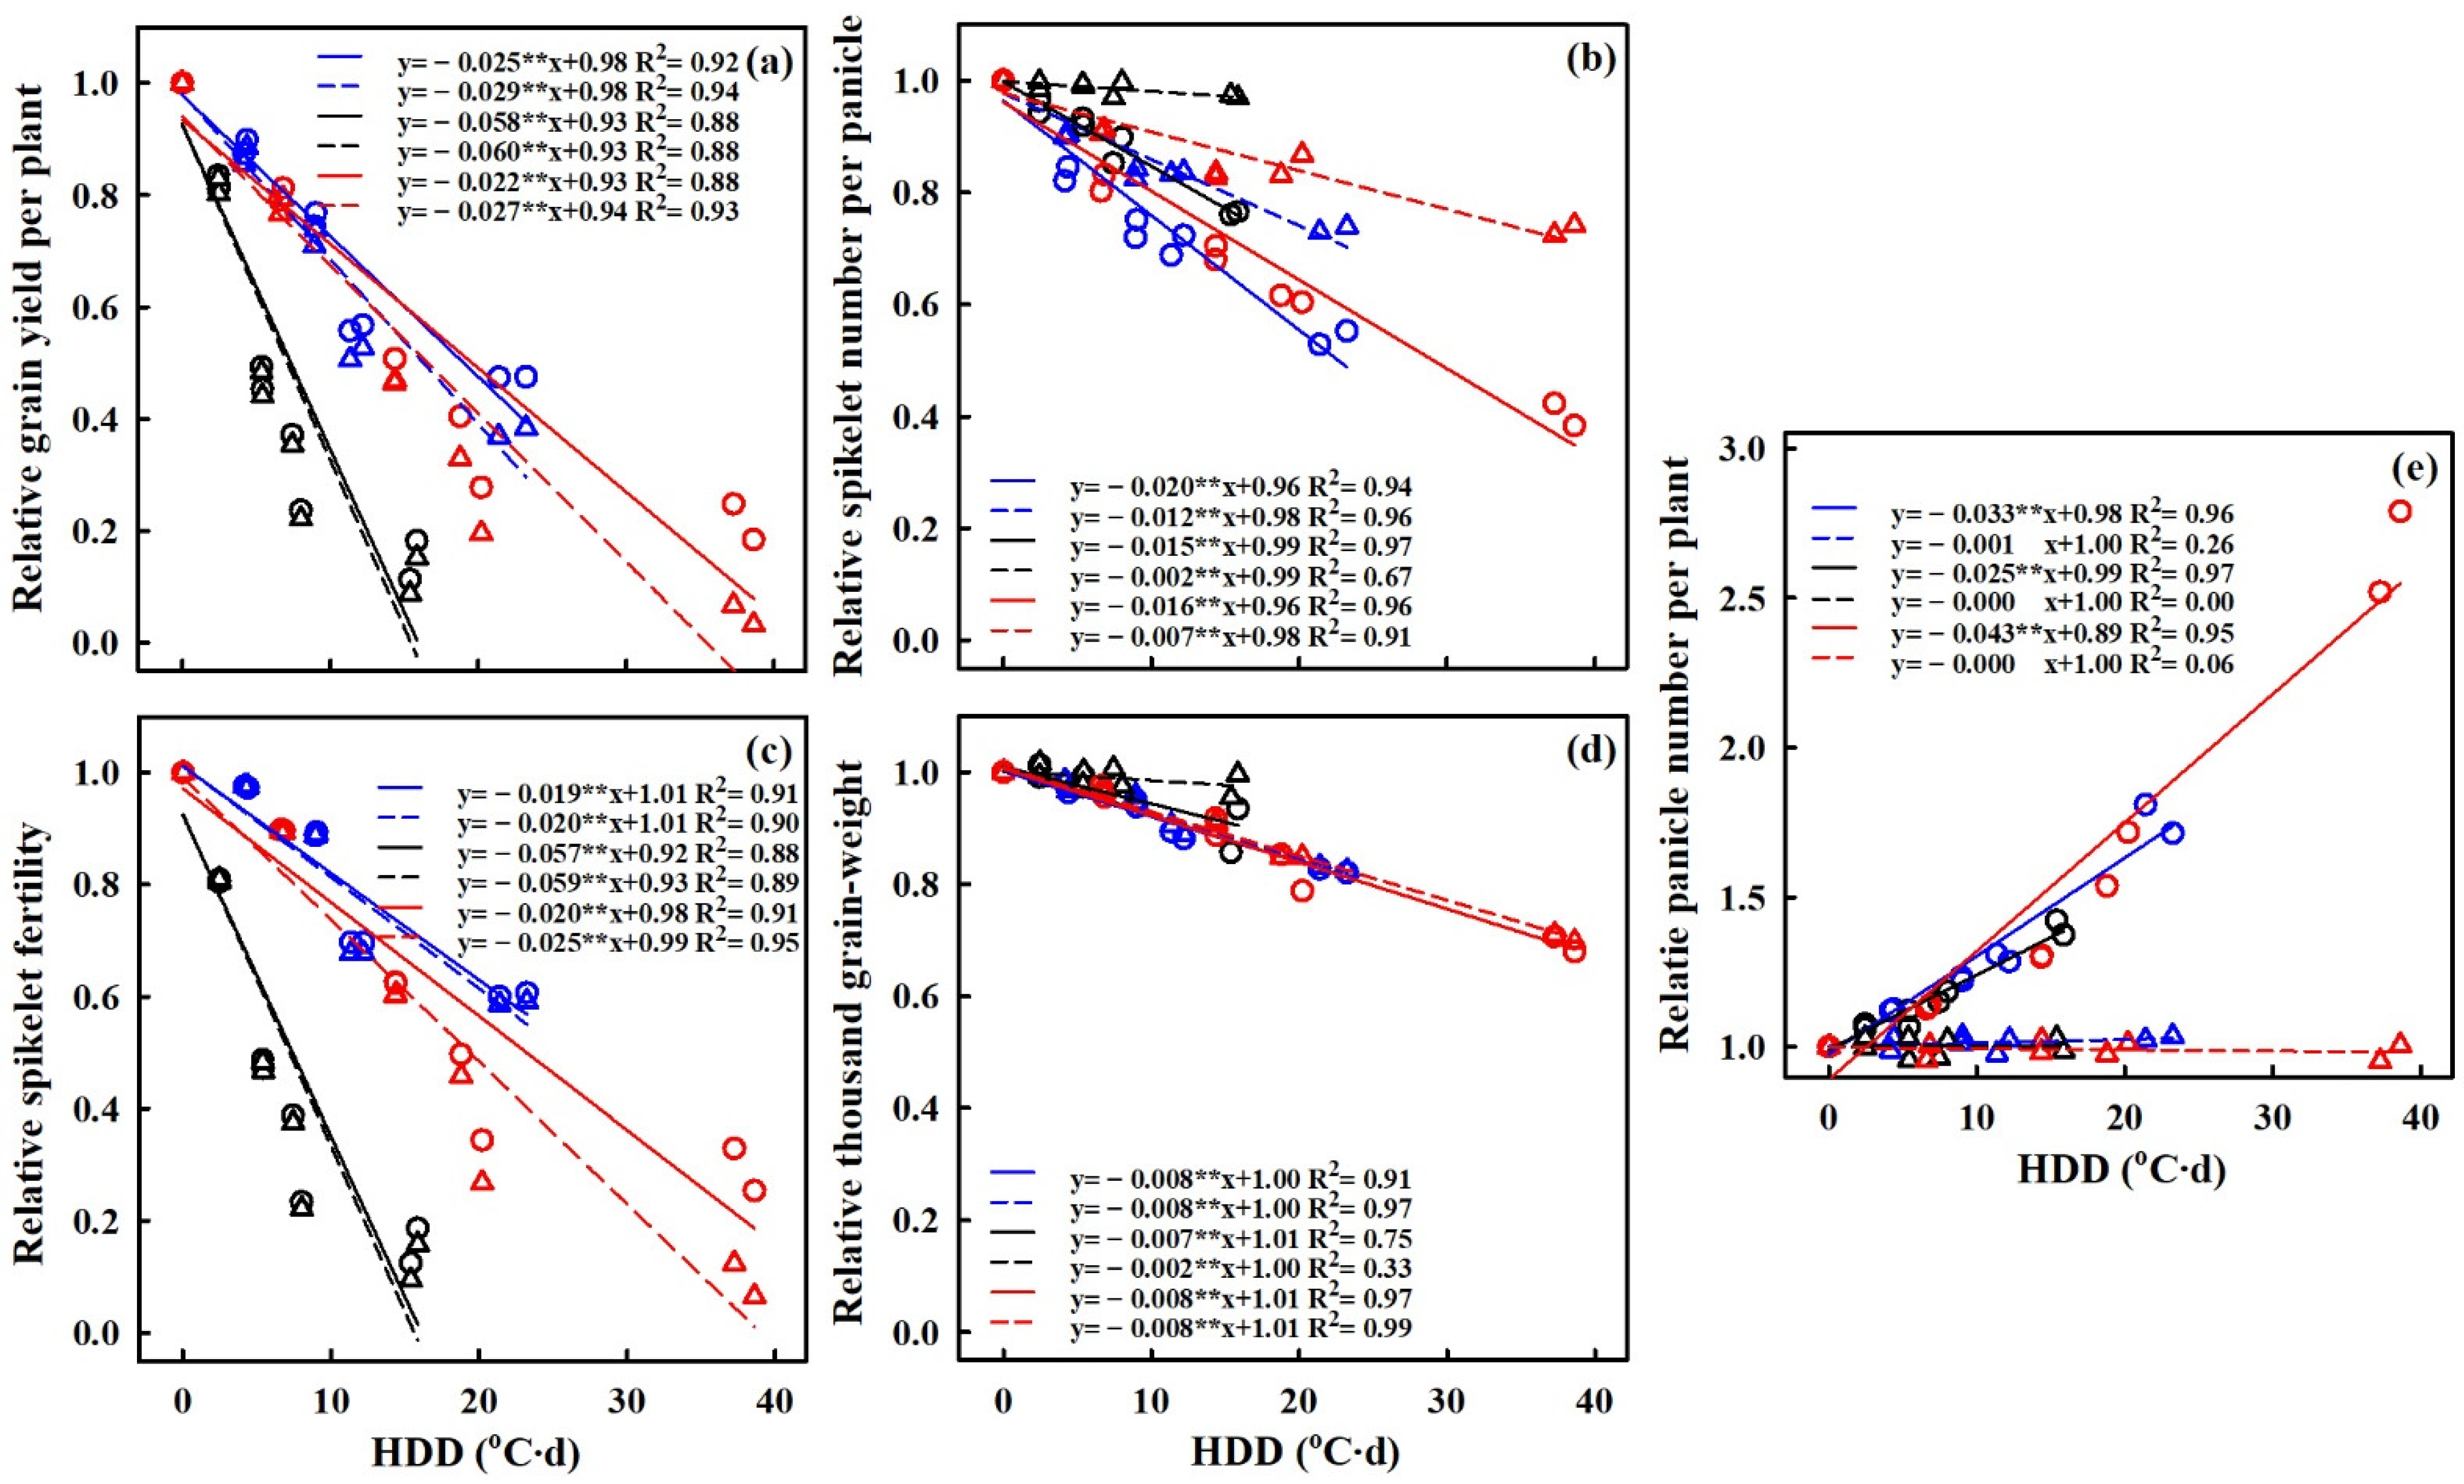
3.6. Quantification of Heat Stress Effects on Grain Yield and Yield Components

HDD–YPP, HDD–SNPP, HDD–TGW, and HDD–SF showed significantly negative (p < 0.05) relationships, while the HDD–PNPPT relationship was significantly positive when both original and regenerated tillers were considered (Figure 8). Despite the differences in high-temperature sensitivity, both cultivars showed similar responses; thus, the average data of both cultivars for total and original tillers were used for the subsequent quantitative analysis. YPPO, SNPPO, SFO, and TGWO decreased at BT, FL, and BT + FL stages by 2.9%, 6.0%, and 2.7%, 1.2%, 0.2%, and 0.7%, 2.0%, 5.9%, and 2.5%, and 0.8%, 0.2%, and 0.8%, respectively for every 1 °C day increase in HDD. Moreover, YPPT, SNPPT, SFT, and TGWT decreased at BT, FL, and BT + FL stages by 2.5%, 5.8%, and 2.2%, 2.0%, 1.5%, and 1.6%, 1.9%, 5.7%, and 2.0%, and 0.8%, 0.7%, and 0.8%, respectively, for every 1 °C day increase in HDD. This implies that higher losses of YPPT and SFT were at the FL stage followed by BT and BT + FL stages, while SNPPT was more affected at BT followed by BT + FL and FL stages. In contrast, TGWT was less affected at all stages. Additionally, PNPPT showed an increasing trend with increasing temperature, having the maximum number of about 4.3% at the BT + FL stage followed by BT (3.3%) and FL (2.5%), respectively. A comparison of original and total tillers indicated an obvious decline in original tillers than total tillers due to compensation from regenerated tillers under high-temperature stress. Despite the higher HDD at the BT + FL stage, the heat stress effects even for original tillers were to a lesser extent than at the FL stage, indicating an alleviation effect at the BT + FL stage.

4. Discussion

4.1. Responses of Rice Yield and Yield Components to High Temperature

Several reactions at cellular, subcellular, and physiological stages were observed in plants in the process of adaptation to stresses [29]. As there was a constant increase in heat stress events, acclimatization effects should be taken into account for heat tolerance [19,32,36]. To compare the combined (BT + FL) stages effects of heat stress with single-stage heat stress during booting (BT) and flowering (FL), yield and related components under heat stress at different stages were analyzed. The present study demonstrated that, with increasing high-temperature levels, durations, and their interactions, a substantial decline was observed in rice grain yield per plant (YPP), similar to previous reports on heat stress at single stage [10,22,37].
The highest decrease in YPPT was observed under heat stress at the FL stage followed by BT + FL and BT stages as compared to T1 (CK), and it compensated more for yield loss under T3 as compared to T2 by producing more RT for T3. Previous studies reported enhanced antioxidant enzymes activities, improved ROS scavenging, better signaling pathways, higher chlorophyll contents and photosynthetic capacity, greater stem reserve remobilization to grain, and more stomatal conductance in heat-adapted plants as compared to non-heat-adapted plants, resulting in improved yield [19,29,31,32,38]. Despite the higher sensitivity of Huaidao-5 toward high temperature (T3D4), it showed higher yield compensation as compared to Wuyunjing-24 owing to its higher number of regenerated tillers. Moreover, as compared to T1, YPPO showed distinct alleviation effects only for the treatment T2 of Wuyunjing-24, whereas, for other treatments, YPPO losses at the BT + FL stage were equal or more than FL. These results indicated that thermotolerance is restricted to a certain cultivar and to certain heat stress levels and durations [39]. These outcomes also revealed that stress scavenging mechanisms failed to maintain the viability of reproductive organs, and the ability of rice plants to retain stress memory was not enough to combat heat stress during the FL stage [10].
In the rice crop, the unaltered number of productive tillers or original tillers at key growth stages of BT and FL under heat stress was consistent with former research [10,21]. However, a considerable increase in RT, especially for the BT + FL stage, was observed in this study. As compared to the original panicles, the shorter differentiation period and grain filling period in regenerated panicles led to a decrease in the number of distinguished spikelets and florets, resulting in lower SNPP, TGW, and SF in regenerated panicles than those in original panicles [19,40]. SNPPT decreased more than SNPPO due to less SNPP in RT than in original tillers. Additionally, the reduction in SNPPO was significant at both BT and BT + FL stages due to the degradation of secondary branches and florets under high temperature [37,41,42], while, at FL, it showed nonsignificant differences, as compared to T1 [10]. However, SNPPT at FL showed substantial results under T3 due to RT having less SNPP than original tillers. The decline in SNPP under high temperature at BT in this study was similar to previous reports [37,43,44].
Moreover, SF was mainly affected by heat stress at BT due to incomplete panicle exertion [37,45]; however, under heat stress at the FL, it was due to the pollen injury or failure of anther to discharge pollen grain [22,42,46]. Heat stress at the BT stage reduced GA1 biosynthesis caused by a drop in IAA, which may be the reason for panicle enclosure in heat-stressed plants [47]. Furthermore, for SF, the FL stage was the most heat-sensitive stage. For SFO, the BT + FL stage showed significant alleviation effects for both cultivars except treatment T3D4 compared to the FL stage. These results revealed that under heat stress at the BT + FL stage, rice plants became thermo-tolerant to high temperature (T2) for both durations and extreme high temperature (T3) only for a short duration. Therefore, according to [48], periods of moderate stress can induce tolerance against high temperature, but there is a limit beyond which even heat-acclimatized plants cannot survive, also in agreement with our findings. Compared with T1, for treatment T3D4, SFO loss at the BT + FL stage that already occurred during the BT stage was about 55.7% and 26.5% for Huaidao-5 and Wuyunjing-24, respectively; however, during FL, Wuyunjing-24 suggested more SFO loss (59.9%) than Huaidao-5 (39%). These results reveal that Wuyunjing-24 has better basal thermo-tolerance and Huaidao-5 has enhanced acquired thermo-tolerance. These findings are consistent with [27], which found that one rice cultivar has a stronger capacity for heat stress memory, while the other has a higher basal thermo-tolerance. The fertility loss at all stages, particularly at the BT + FL stage, was more obvious for SFO than SFT because RT compensated for this loss. The decrease in SF under T2 for every 1 day increase in high-temperature duration was higher than T3 in this study, which was consistent with previous reports and was attributed to the fact that extreme temperature impacts are significant even for a short duration, while the impact of mild temperature increases with the increasing duration of heat [10,22]. Higher yield losses and decreased SF were obvious during all stages, indicating that SF was more closely related to grain yield formation than other yield components under heat stress, as in previous studies [22,49].
The significant decline In TGWO under heat stress at BT and BT + FL stages was mainly because of a reduction in grain size [25,37,44], but there was no significant decrease under heat stress at FL in consensus with the earlier report on rice [10]. Another reason for the decline in TGW due to high temperature during the BT stage was the reduction in translocation of nonstructural carbohydrates through vascular bundles, resulting in a lower grain filling rate [25,37,50]. A considerable reduction in TGWT at FL was attributed to the lower TGW of RT. Moreover, for every 1 day increase in high-temperature duration, the TGWT of Huaidao-5 at FL was even lower than at BT because RT produced at FL had less duration for grain filling [51]. However, the BT + FL stage was the most affected stage for the decline in TGWT owing to the massive production of RT. Previous studies indicated that the emergence of RT in wheat and rice was linked to the intensity/severity of the stress, as we mostly observed RT under T3 for longer duration D4+4 at BT + FL treatment [19,35,52].

4.2. Impact of High Temperature on Grain Yield-Forming Traits

To determine how much each yield component contributes to grain production, a standardized regression coefficient has been widely used [40,53,54]. The higher contribution of filled grains per panicle to YPP than TGW in this study was in agreement with preceding reports [40,54]. The contribution of TGW and SNPP to YPP under heat stress at BT + FL and BT stages was higher than at FL. The importance of yield components to yield under heat stress at BT + FL stage fell between those at FL and BT stages, as the contribution of SF to yield under heat stress at the BT + FL stage was higher than that at BT but lower than that at FL, and the contribution of SNPP and TGW to yield under heat stress at the BT + FL stage was less than that under heat stress at BT but greater than that under heat stress at FL. This also implies that the BT + FL stage obtained resistance against high temperature as its SF was less affected as compared to the FL stage [31,32,38]. Earlier research [22,55] found that SF was the most vulnerable yield component under high-temperature stress during reproductive stages, especially during FL. The higher contribution of SFO to yield under T3 treatment (extremely high temperature) than under T2 treatment (mild high temperature) revealed that the loss of SF was much higher for T3 than T2, perhaps because the extremely high-temperature in T3 directly influences the SF and seed formation even for a short period. On the other hand, RT increased the number of tillers, but they could not compensate for the actual yield loss, which is why the correlation between YPPT and PNPPT was negative.

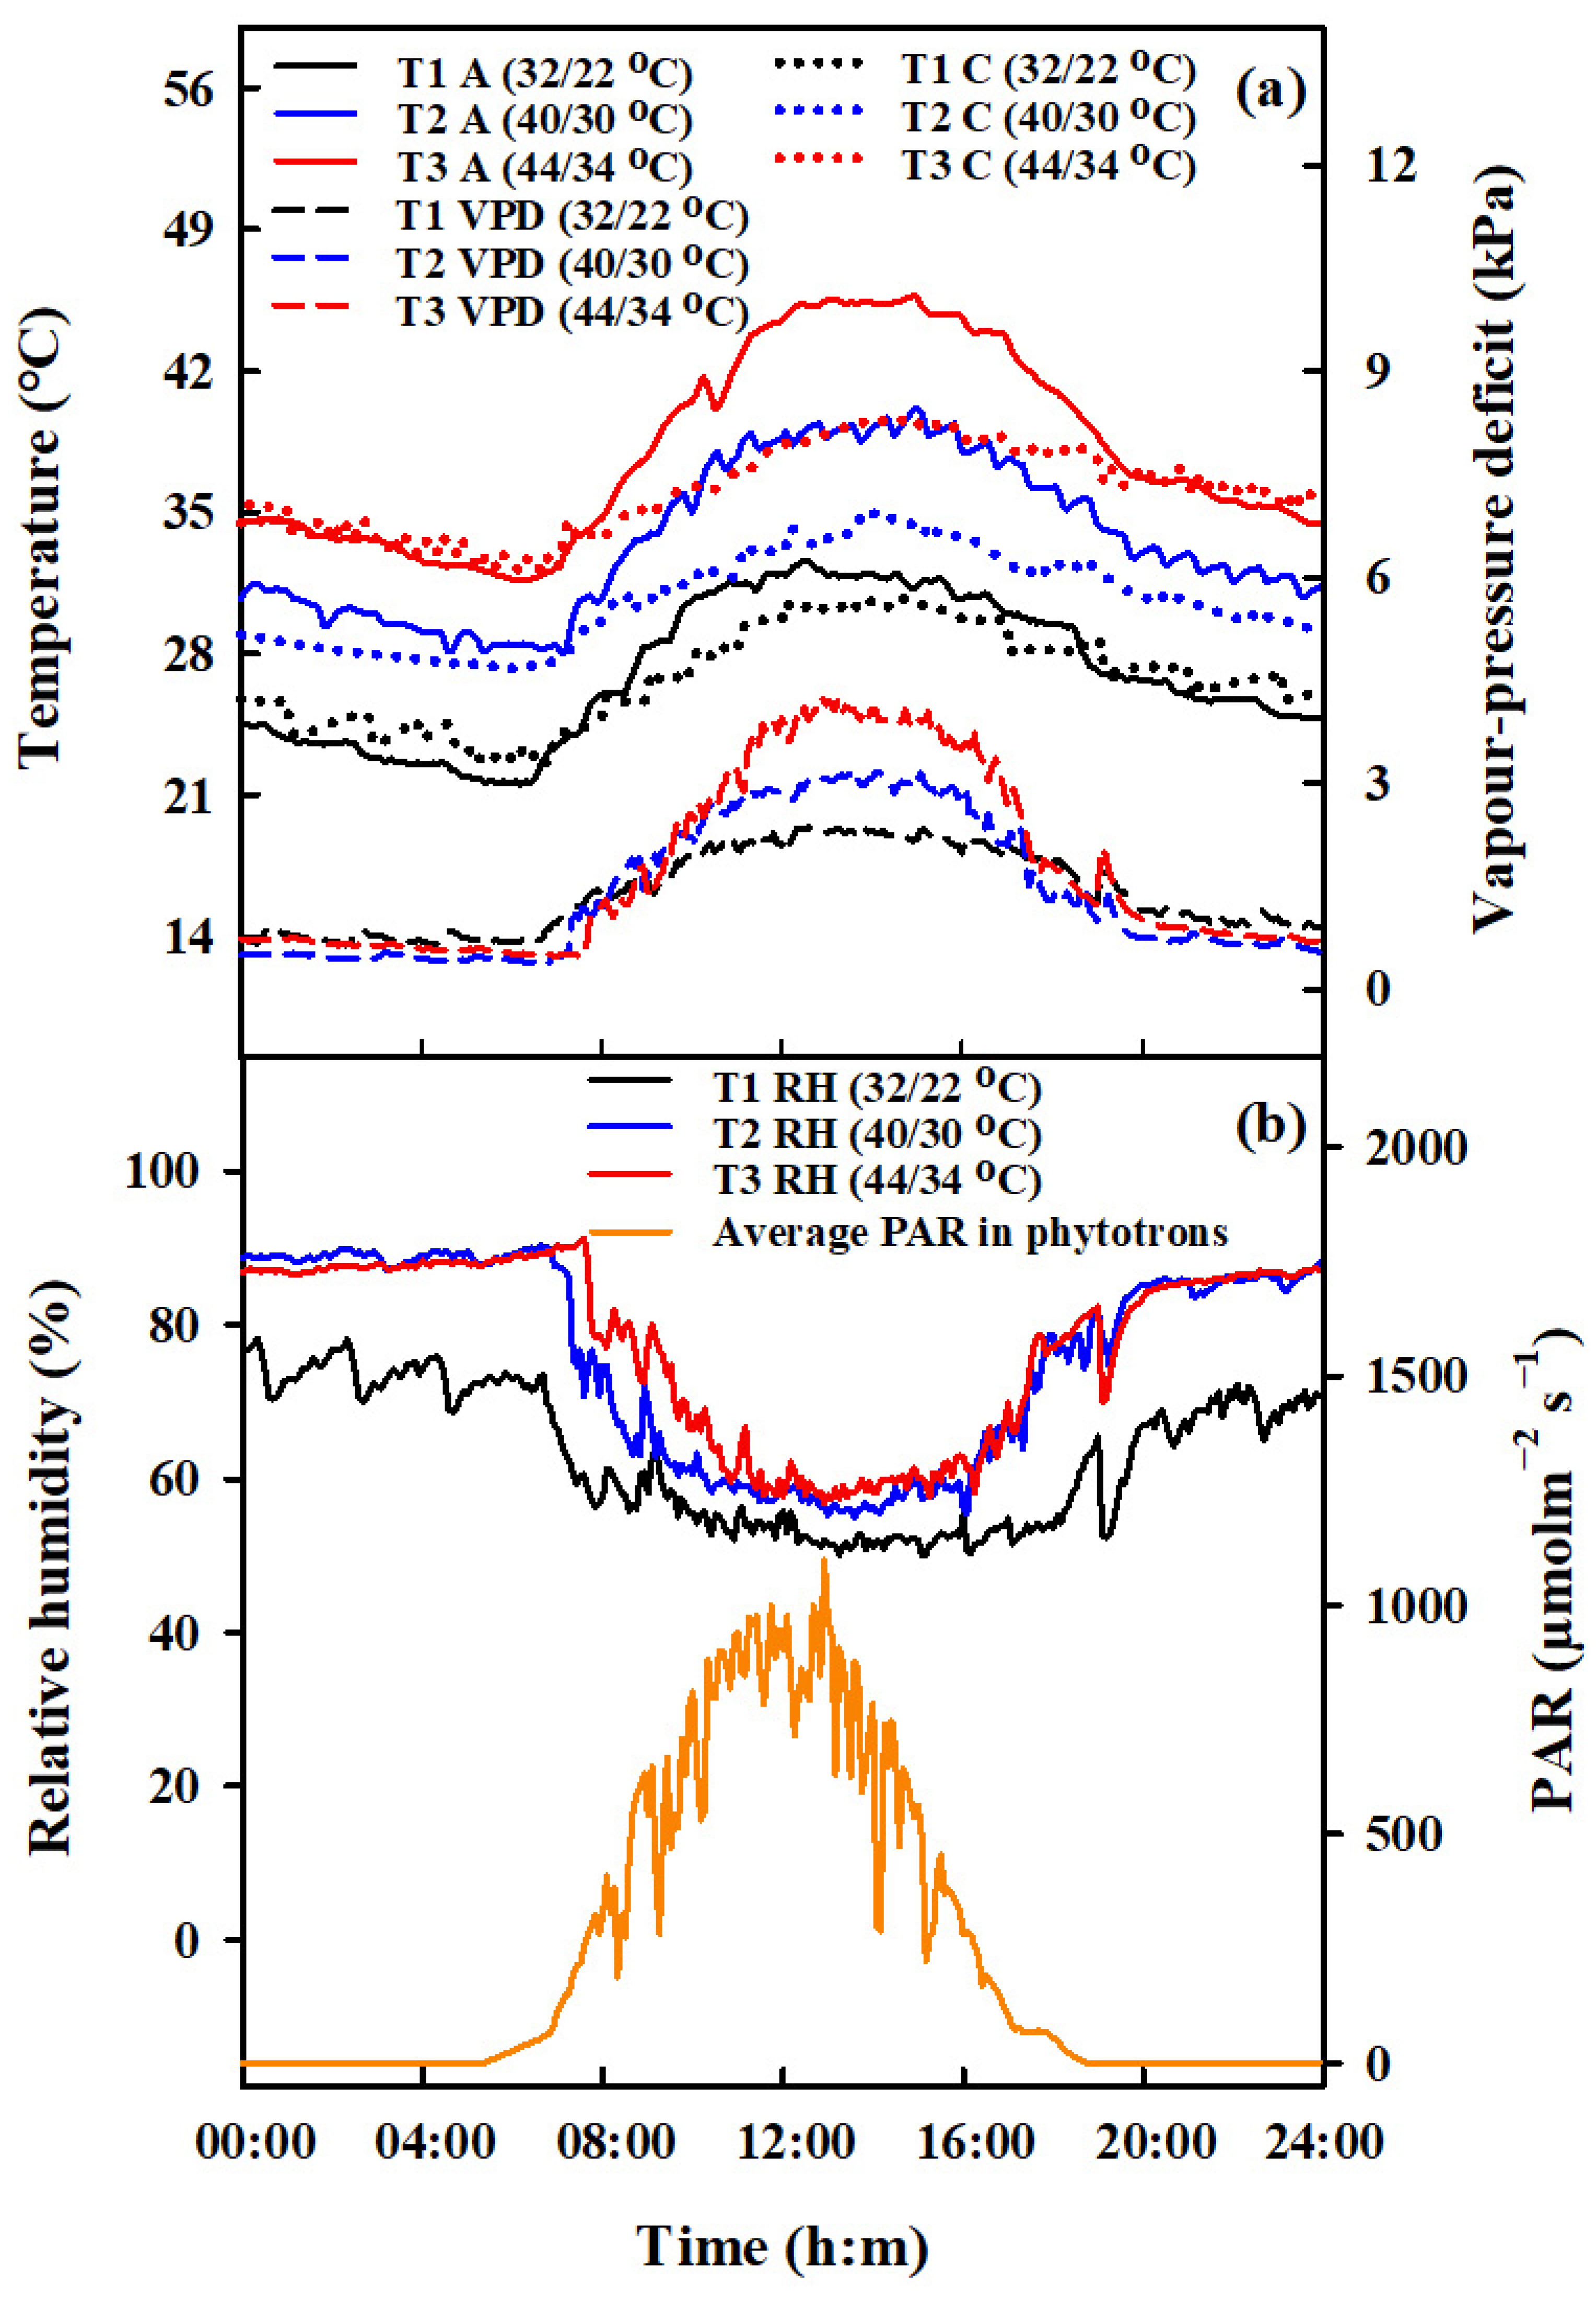
4.3. Comparison of Seed Setting Rate at Various Positions and Relationship of Spikelet Fertility (%) with Vapor Pressure Deficit

The higher spikelet fertility loss in the upper part of panicles than middle and lower parts at early reproductive stages and higher spikelet fertility loss in lower parts of the panicle in late FL stage under high-temperature stress in this study was in line with prior reports [56,57].
Previously, increased sterility was attributed to the variation in humidity under high-temperature stress with less focus on vapor pressure deficit (VPD) [58]. Despite the almost similar increase in relative humidity under T2 and T3 (Figure 1), the loss of SF in T3 was higher than T2. This revealed that a high VPD of about 3.2 and 4.2 under T2 and T3 during the daytime was the primary reason for the lower SF in this study (Table 4), and this lower SF was associated with the fact that most of the physiological and reproductive processes such as flower opening, anther dehiscence, and fertilization occur during the daytime [59,60]. Consequently, the loss in SF at FL was more than at BT because flowers were exposed to higher VPD during the daytime, resulting in the desiccation of anther and pollens [61,62]. Furthermore, desiccation of anther was also attributed to an increase in air temperature, which in turn increased its VPD. Accordingly, air would absorb more water vapors from the surroundings, resulting in higher water loss from the plant body [62]. Significant differences between air temperature and canopy temperature in this study (Figure 1) suggested that transpirational cooling might have reduced canopy temperature, which differed from prior findings [63,64].

4.4. The Relationship of HDD with the Effect of Extreme High-Temperature Stress on Grain Yield and Yield Components

Several studies specified that the threshold temperature was used for the calculation of HDD, yet it remains uncertain whether the threshold temperature differs with crop growth stages. Usually, the same threshold temperature was used to calculate HDD for the entire reproductive phase, while some studies reported that different growth stages had different threshold temperatures [15]. HDD integrates the duration and severity of high temperatures [19,57,65]. YPP and HDD were significantly negatively correlated in both cultivars under heat stress, and HDD at the FL stage had a more adverse effect on rice yield than at BT and BT + FL stages. A previous study on rice reported that every 1 °C day increase in HDD causes about 3.3% yield loss for heat stress at the FL stage [10]; however, according to this study, yield loss was about 5.8%, 2.5%, and 2.2% for FL, BT, and BT + FL stages, respectively. The higher yield loss in this study was accredited to a higher-temperature level (max 44 °C) than the previous research (max 41 °C). Although there was a short period between BT and FL stages, rice plants in this study showed evident resistance at the BT + FL stage despite having much higher HDD than the other two stages. This thermo-tolerance at the BT + FL stage is due to acquired heat stress memories, and these memories have adaptive advantages where short events of heat stress often occur [27,28,29,31]. Moreover, this self-accommodation by rice plants due to RT in this study was also attributed to super-compensatory or compensatory responses in the plants after the heat stress treatment. Super-compensatory responses are universal processes in biology and are usually initiated by stress and injury as a self-accommodation response in reaction to uncertain environments [35]. The crucial stage impacted by high temperatures is anther dehiscence and pollen shedding [66]. It is important to identify the genes that may be responsible for the proper expression of protective chaperones in the anthers because they will make excellent candidates for molecular breeding of highly productive heat-tolerant cultivars. In this trial, physiological pathways of stress tolerance induced by heat acclimatization were discussed, but there is a need to determine the molecular and physiological mechanisms underlying stress-related memories.

5. Conclusions

Heat-acclimatized rice plants recalled a heat stress memory and significantly compensated for damage to yield and yield components for the total number of tillers by enhancing the production of regenerated tillers, as well as alleviating the spikelet sterility of original tillers. Compared to Wuyunjing-24, despite the lower basal thermo-tolerance of Huaidao-5 toward high-temperature, it showed higher acquired thermo-tolerance and yield compensation owing to its higher number of regenerated tillers. The decrease in SF was maximum for temperature level T3 followed by T2 for the same duration at all growth stages, and the corresponding opposite pattern was observed for vapor pressure deficit, showing a much higher increase in T3 than T2, which was the major cause for grain yield loss. The yield loss was substantially greater during the FL stage for every 1 °C day increase in HDD, followed by BT and BT + FL stages. These findings could aid in evaluating and forecasting rice yield in future scenarios involving hot events as a result of climate change, in identifying yield components governing the yield variation and mitigating their susceptibility to high temperature, and in improving rice model algorithms in high-temperature circumstances.

Author Contributions

A.M., L.T., Y.Z. and W.C. planned the experiment. A.M. conducted the study, collected and analyzed the data, and prepared the draft. W.W., S.T.A.-U.-K. and I.A. helped in sampling and measurements of physiological parameters. L.T., L.L., B.L. and Y.Z. assisted in drafting the manuscript and interpretation of the results. All authors have read and agreed to the published version of the manuscript.

Funding

This study was supported by the National Key Research and Development Program of China (2022YFD2001001), the National Natural Science Foundation of China (31571566), the Fundamental Research Funds for the Central Universities (KYZ201703), the National Science Fund for Distinguished Young Scholars (31725020), and the Priority Academic Program Development of Jiangsu Higher Education Institutions (PAPD).

Conflicts of Interest

The authors declare no conflict of interest.

References

  1. IPCC. Special Report in 2018 on the Impacts of Global Warming of 1.5 °C. The Physical Science Basis, Summary for Policymakers; IPCC: Geneva, Switzerland, 2018; Volume 15. [Google Scholar]
  2. Lobell, D.B.; Sibley, A.; Ortiz-Monasterio, J.I. Extreme heat effects on wheat senescence in India. Nat. Clim. Chang. 2012, 2, 186. [Google Scholar] [CrossRef]
  3. Krishnan, P.; Ramakrishnan, B.; Reddy, K.R.; Reddy, V. High-Temperature Effects on Rice Growth, Yield, and Grain Quality. Adv. Agron. 2011, 111, 87–206. [Google Scholar]
  4. Buckley, L.B.; Huey, R.B. Temperature extremes: Geographic patterns, recent changes, and implications for organismal vulnerabilities. Glob. Chang. Biol. 2016, 22, 3829–3842. [Google Scholar] [CrossRef] [PubMed]
  5. Sun, T.; Hasegawa, T.; Liu, B.; Tang, L.; Liu, L.; Cao, W.; Zhu, Y. Current rice models underestimate yield losses from short-term heat stresses. Glob. Chang. Biol. 2021, 27, 402–416. [Google Scholar] [CrossRef] [PubMed]
  6. Fageria, N. Yield physiology of rice. J. Plant Nutr. 2007, 30, 843–879. [Google Scholar] [CrossRef]
  7. Fu, J.; Huang, Z.; Wang, Z.; Yang, J.; Zhang, J. Pre-anthesis non-structural carbohydrate reserve in the stem enhances the sink strength of inferior spikelets during grain filling of rice. Field Crops Res. 2011, 123, 170–182. [Google Scholar] [CrossRef]
  8. Prabhakar, S.V. Climate change impacts in Japan and Southeast Asia: Implications for crop adaptation. In Crop Adaptation to Climate Change; Wiley: Hoboken, NJ, USA, 2011; pp. 131–142. [Google Scholar] [CrossRef]
  9. Gourdji, S.M.; Sibley, A.M.; Lobell, D.B. Global crop exposure to critical high temperatures in the reproductive period: Historical trends and future projections. Environ. Res. Lett. 2013, 8, 024041. [Google Scholar] [CrossRef]
  10. Shi, P.; Zhu, Y.; Tang, L.; Chen, J.; Sun, T.; Cao, W.; Tian, Y. Differential effects of temperature and duration of heat stress during anthesis and grain filling stages in rice. Environ. Exp. Bot. 2016, 132, 28–41. [Google Scholar] [CrossRef]
  11. Zhao, C.; Piao, S.; Wang, X.; Huang, Y.; Ciais, P.; Elliott, J.; Huang, M.; Janssens, I.A.; Li, T.; Lian, X. Plausible rice yield losses under future climate warming. Nat. Plants 2016, 3, 16202. [Google Scholar] [CrossRef] [Green Version]
  12. Ceccarelli, S.; Grando, S.; Maatougui, M.; Michael, M.; Slash, M.; Haghparast, R.; Rahmanian, M.; Taheri, A.; Al-Yassin, A.; Benbelkacem, A. Plant breeding and climate changes. J. Agric. Sci. 2010, 148, 627–637. [Google Scholar] [CrossRef]
  13. Wahid, A. Physiological implications of metabolite biosynthesis for net assimilation and heat-stress tolerance of sugarcane (Saccharum officinarum) sprouts. J. Plant Res. 2007, 120, 219–228. [Google Scholar] [CrossRef]
  14. Wassmann, R.; Jagadish, S.; Heuer, S.; Ismail, A.; Redona, E.; Serraj, R.; Singh, R.; Howell, G.; Pathak, H.; Sumfleth, K. Climate change affecting rice production: The physiological and agronomic basis for possible adaptation strategies. Adv. Agron. 2009, 101, 59–122. [Google Scholar]
  15. Sánchez, B.; Rasmussen, A.; Porter, J.R. Temperatures and the growth and development of maize and rice: A review. Glob. Chang. Biol. 2014, 20, 408–417. [Google Scholar] [CrossRef]
  16. Espe, M.B.; Hill, J.E.; Hijmans, R.J.; McKenzie, K.; Mutters, R.; Espino, L.A.; Leinfelder-Miles, M.; van Kessel, C.; Linquist, B.A. Point stresses during reproductive stage rather than warming seasonal temperature determine yield in temperate rice. Glob. Chang. Biol. 2017, 23, 4386–4395. [Google Scholar] [CrossRef] [PubMed]
  17. Yoshida, S. Fundamentals of Rice Crop Science; The International Rice Research Institute: Manilla, Philippines, 1981. [Google Scholar]
  18. Counce, P.A.; Keisling, T.C.; Mitchell, A.J. A uniform, objective, and adaptive system for expressing rice development. Crop Sci. 2000, 40, 436–443. [Google Scholar] [CrossRef] [Green Version]
  19. Mahmood, A.; Wang, W.; Ali, I.; Zhen, F.; Osman, R.; Liu, B.; Liu, L.; Zhu, Y.; Cao, W.; Tang, L. Individual and Combined Effects of Booting and Flowering High-Temperature Stress on Rice Biomass Accumulation. Plants 2021, 10, 1021. [Google Scholar] [CrossRef]
  20. Peterson, M.; Lin, S.; Jones, D.; Rutger, J. Cool night temperatures cause sterility in rice. Calif. Agric. 1974, 28, 12–14. [Google Scholar]
  21. Satake, T.; Yoshida, S. High temperature-induced sterility in indica rices at flowering. Jpn. J. Crop Sci. 1978, 47, 6–17. [Google Scholar] [CrossRef] [Green Version]
  22. Jagadish, S.; Craufurd, P.; Wheeler, T. High temperature stress and spikelet fertility in rice (Oryza sativa L.). J. Exp. Bot. 2007, 58, 1627–1635. [Google Scholar] [CrossRef] [Green Version]
  23. Endo, M.; Tsuchiya, T.; Hamada, K.; Kawamura, S.; Yano, K.; Ohshima, M.; Higashitani, A.; Watanabe, M.; Kawagishi-Kobayashi, M. High temperatures cause male sterility in rice plants with transcriptional alterations during pollen development. Plant Cell Physiol. 2009, 50, 1911–1922. [Google Scholar] [CrossRef]
  24. Zahra, N.; Wahid, A.; Hafeez, M.B.; Ullah, A.; Siddique, K.H.; Farooq, M. Grain development in wheat under combined heat and drought stress: Plant responses and management. Environ. Exp. Bot. 2021, 188, 104517. [Google Scholar] [CrossRef]
  25. Wu, C.; Cui, K.; Fahad, S. Heat stress decreases rice grain weight: Evidence and physiological mechanisms of heat effects prior to flowering. Int. J. Mol. Sci. 2022, 23, 10922. [Google Scholar] [CrossRef] [PubMed]
  26. Larkindale, J.; Hall, J.D.; Knight, M.R.; Vierling, E. Heat stress phenotypes of Arabidopsis mutants implicate multiple signaling pathways in the acquisition of thermotolerance. Plant Physiol. 2005, 138, 882–897. [Google Scholar] [CrossRef] [Green Version]
  27. Lin, M.-Y.; Chai, K.-H.; Ko, S.-S.; Kuang, L.-Y.; Lur, H.-S.; Charng, Y.-Y. A positive feedback loop between HEAT SHOCK PROTEIN101 and HEAT STRESS-ASSOCIATED 32-KD PROTEIN modulates long-term acquired thermotolerance illustrating diverse heat stress responses in rice varieties. Plant Physiol. 2014, 164, 2045–2053. [Google Scholar] [CrossRef] [PubMed]
  28. Sanyal, R.P.; Misra, H.S.; Saini, A. Heat-stress priming and alternative splicing-linked memory. J. Exp. Bot. 2018, 69, 2431–2434. [Google Scholar] [CrossRef] [Green Version]
  29. Hossain, M.A.; Li, Z.-G.; Hoque, T.S.; Burritt, D.J.; Fujita, M.; Munné-Bosch, S. Heat or cold priming-induced cross-tolerance to abiotic stresses in plants: Key regulators and possible mechanisms. Protoplasma 2018, 255, 399–412. [Google Scholar] [CrossRef]
  30. Wang, X.; Cai, J.; Jiang, D.; Liu, F.; Dai, T.; Cao, W. Pre-anthesis high-temperature acclimation alleviates damage to the flag leaf caused by post-anthesis heat stress in wheat. J. Plant Physiol. 2011, 168, 585–593. [Google Scholar] [CrossRef]
  31. Shi, W.; Lawas, L.; Raju, B.; Jagadish, S. Acquired thermo-tolerance and trans-generational heat stress response at flowering in rice. J. Agron. Crop Sci. 2016, 202, 309–319. [Google Scholar] [CrossRef]
  32. Fan, Y.; Ma, C.; Huang, Z.; Abid, M.; Jiang, S.; Dai, T.; Zhang, W.; Ma, S.; Jiang, D.; Han, X. Heat priming during early reproductive stages enhances thermo-tolerance to post-anthesis heat stress via improving photosynthesis and plant productivity in winter wheat (Triticum aestivum L.). Front. Plant. Sci. 2018, 9, 805. [Google Scholar] [CrossRef]
  33. Shi, C.; Jin, Z.; Zheng, J.; Tang, R. Quantitative analysis on the effects of high temperature at meiosis stage on seed-setting rate of rice florets. Acta Agron. Sin. 2008, 34, 627. [Google Scholar] [CrossRef]
  34. Wu, C.; Cui, K.; Tang, S.; Li, G.; Wang, S.; Fahad, S.; Nie, L.; Huang, J.; Peng, S.; Ding, Y. Intensified pollination and fertilization ameliorate heat injury in rice (Oryza sativa L.) during the flowering stage. Field Crops Res. 2020, 252, 107795. [Google Scholar] [CrossRef]
  35. Zhang, Y.; Wang, Z.; Li, L.; Zhou, Q.; Xiao, Y.; Wei, X.; Zhou, M. Short-term complete submergence of rice at the tillering stage increases yield. PLoS ONE 2015, 10, e0127982. [Google Scholar] [CrossRef] [PubMed]
  36. Xiao, W.; Liu, F.-L.; Jiang, D. Priming: A promising strategy for crop production in response to future climate. J. Integr. Agric. 2017, 16, 2709–2716. [Google Scholar]
  37. Wu, C.; Cui, K.; Wang, W.; Li, Q.; Fahad, S.; Hu, Q.; Huang, J.; Nie, L.; Peng, S. Heat-induced phytohormone changes are associated with disrupted early reproductive development and reduced yield in rice. Sci. Rep. 2016, 6, 34978. [Google Scholar] [CrossRef] [Green Version]
  38. Wang, X.; Cai, J.; Liu, F.; Jin, M.; Yu, H.; Jiang, D.; Wollenweber, B.; Dai, T.; Cao, W. Pre-anthesis high temperature acclimation alleviates the negative effects of post-anthesis heat stress on stem stored carbohydrates remobilization and grain starch accumulation in wheat. J. Cereal Sci. 2012, 55, 331–336. [Google Scholar] [CrossRef]
  39. Hasanuzzaman, M.; Nahar, K.; Alam, M.; Roychowdhury, R.; Fujita, M. Physiological, biochemical, and molecular mechanisms of heat stress tolerance in plants. Int. J. Mol. Sci. 2013, 14, 9643–9684. [Google Scholar] [CrossRef] [PubMed]
  40. Ji, H.; Xiao, L.; Xia, Y.; Song, H.; Liu, B.; Tang, L.; Cao, W.; Zhu, Y.; Liu, L. Effects of jointing and booting low temperature stresses on grain yield and yield components in wheat. Agric. For. Meteorol. 2017, 243, 33–42. [Google Scholar] [CrossRef]
  41. Chimenti, C.; Hall, A. Grain number responses to temperature during floret differentiation in sunflower. Field Crops Res. 2001, 72, 177–184. [Google Scholar] [CrossRef]
  42. Wang, Y.; Wang, L.; Zhou, J.; Hu, S.; Chen, H.; Xiang, J.; Zhang, Y.; Zeng, Y.; Shi, Q.; Zhu, D. Research progress on heat stress of rice at flowering stage. Rice Sci. 2019, 26, 1–10. [Google Scholar] [CrossRef]
  43. Yun-Ying, C.; Hua, D.; Li-Nian, Y.; Zhi-Qing, W.; Shao-Chuan, Z.; Jian-Chang, Y. Effect of heat stress during meiosis on grain yield of rice cultivars differing in heat tolerance and its physiological mechanism. Acta Agron. Sin. 2008, 34, 2134–2142. [Google Scholar]
  44. Zhen, F.; Zhou, J.; Mahmood, A.; Wang, W.; Chang, X.; Liu, B.; Liu, L.; Cao, W.; Zhu, Y.; Tang, L. Quantifying the effects of short-term heat stress at booting stage on nonstructural carbohydrates remobilization in rice. Crop J. 2020, 8, 194–212. [Google Scholar] [CrossRef]
  45. Das, S.; Krishnan, P.; Nayak, M.; Ramakrishnan, B. High temperature stress effects on pollens of rice (Oryza sativa L.) genotypes. Environ. Exp. Bot. 2014, 101, 36–46. [Google Scholar] [CrossRef]
  46. Weerakoon, W.; Maruyama, A.; Ohba, K. Impact of humidity on temperature-induced grain sterility in rice (Oryza sativa L.). J. Agron. Crop Sci. 2008, 194, 135–140. [Google Scholar] [CrossRef]
  47. Wu, C.; Tang, S.; Li, G.; Wang, S.; Fahad, S.; Ding, Y. Roles of phytohormone changes in the grain yield of rice plants exposed to heat: A review. PeerJ 2019, 7, e7792. [Google Scholar] [CrossRef] [PubMed]
  48. Howarth, C.J. Abiotic Stresses: Plant Resistance through Breeding Molecular Approaches; Ashraf, M., Harris, P., Eds.; Food Products Press®, an Imprint of The Howarth Press, Inc.: Binghamton, NY, USA, 2005; Volume 10, p. 1920. [Google Scholar]
  49. Prasad, P.V.; Pisipati, S.; Mutava, R.; Tuinstra, M. Sensitivity of grain sorghum to high temperature stress during reproductive development. Crop Sci. 2008, 48, 1911–1917. [Google Scholar] [CrossRef] [Green Version]
  50. Morita, S.; Nakano, H. Nonstructural carbohydrate content in the stem at full heading contributes to high performance of ripening in heat-tolerant rice cultivar Nikomaru. Crop Sci. 2011, 51, 818–828. [Google Scholar] [CrossRef]
  51. Oh-e, I.; Saitoh, K.; Kuroda, T. Effects of high temperature on growth, yield and dry-matter production of rice grown in the paddy field. Plant Prod. Sci. 2007, 10, 412–422. [Google Scholar] [CrossRef]
  52. Wu, Q.-X.; Yang, L.; Shao, H.; Ran, C.-F.; Yang, Z.-B.; Yu, J.; Li, L.-Q.; Li, X.-J. Effects of low temperature stress at anther connective formation phase on physiological characteristics an yield of wheat. J. Triticeae Crops 2013, 3, 752–757. [Google Scholar]
  53. Talukder, A.; McDonald, G.K.; Gill, G.S. Effect of short-term heat stress prior to flowering and early grain set on the grain yield of wheat. Field Crops Res. 2014, 160, 54–63. [Google Scholar] [CrossRef]
  54. Zheng, D.; Yang, X.; Mínguez, M.I.; Mu, C.; He, Q.; Wu, X. Effect of freezing temperature and duration on winter survival and grain yield of winter wheat. Agric. For. Meteorol. 2018, 260, 1–8. [Google Scholar] [CrossRef]
  55. Prasad, P.; Boote, K.; Allen, L., Jr.; Sheehy, J.; Thomas, J. Species, ecotype and cultivar differences in spikelet fertility and harvest index of rice in response to high temperature stress. Field Crops Res. 2006, 95, 398–411. [Google Scholar] [CrossRef]
  56. Lawas, L.M.; Bheemanahalli, R.; Solis, C.A.; Krishna Jagadish, S. Sheathed panicle phenotype (cv. Sathi) maintains normal spikelet fertility and grain filling under prolonged heat stress in rice. Crop Sci. 2018, 58, 1693–1705. [Google Scholar] [CrossRef]
  57. Sun, T.; Hasegawa, T.; Tang, L.; Wang, W.; Zhou, J.; Liu, L.; Liu, B.; Cao, W.; Zhu, Y. Stage-dependent temperature sensitivity function predicts seed-setting rates under short-term extreme heat stress in rice. Agric. For. Meteorol. 2018, 256, 196–206. [Google Scholar] [CrossRef]
  58. Julia, C.; Dingkuhn, M. Predicting temperature induced sterility of rice spikelets requires simulation of crop-generated microclimate. Eur. J. Agron. 2013, 49, 50–60. [Google Scholar] [CrossRef]
  59. Jagadish, S.; Craufurd, P.; Wheeler, T. Phenotyping parents of mapping populations of rice for heat tolerance during anthesis. Crop Sci. 2008, 48, 1140–1146. [Google Scholar] [CrossRef]
  60. Julia, C.; Dingkuhn, M. Variation in time of day of anthesis in rice in different climatic environments. Eur. J. Agron. 2012, 43, 166–174. [Google Scholar] [CrossRef]
  61. Matsui, T.; Omasa, K.; Horie, T. Mechanism of anther dehiscence in rice (Oryza sativa L.). Ann. Bot. 1999, 84, 501–506. [Google Scholar] [CrossRef] [Green Version]
  62. Jung, W.-S.; Lee, K.-J.; Lee, B.-W. Responses of spikelet fertility to air, spikelet, and panicle temperatures and vapor pressure deficit in rice. J. Crop Sci. Biotechnol. 2015, 18, 209–218. [Google Scholar] [CrossRef] [Green Version]
  63. Matsui, T.; Kobayasi, K.; Yoshimoto, M.; Hasegawa, T. Stability of rice pollination in the field under hot and dry conditions in the Riverina region of New South Wales, Australia. Plant Prod. Sci. 2007, 10, 57–63. [Google Scholar] [CrossRef]
  64. Sathishraj, R.; Bheemanahalli, R.; Ramachandran, M.; Dingkuhn, M.; Muthurajan, R.; Krishna, J.S. Capturing heat stress induced variability in spikelet sterility using panicle, leaf and air temperature under field conditions. Field Crops Res. 2016, 190, 10–17. [Google Scholar] [CrossRef]
  65. Shi, P.; Tang, L.; Lin, C.; Liu, L.; Wang, H.; Cao, W.; Zhu, Y. Modeling the effects of post-anthesis heat stress on rice phenology. Field Crops Res. 2015, 177, 26–36. [Google Scholar] [CrossRef]
  66. González-Schain, N.; Dreni, L.; Lawas, L.M.; Galbiati, M.; Colombo, L.; Heuer, S.; Jagadish, K.S.; Kater, M.M. Genome-wide transcriptome analysis during anthesis reveals new insights into the molecular basis of heat stress responses in tolerant and sensitive rice varieties. Plant Cell Physiol. 2016, 57, 57–68. [Google Scholar] [CrossRef] [PubMed]
Figure 1. Design of the daily dynamics of temperature, vapor pressure deficit, relative air humidity and photosynthetically active radiation in the environment-controlled phytotron. Diurnal variations of air (A, °C, solid lines, (a) left vertical axis), and canopy temperature (C, °C, dotted lines, (a) left vertical axis), vapor pressure deficit (VPD, kPa, dashed lines, (a) right vertical axis), relative air humidity (RH, %, solid lines, (b) left vertical axis), and average photosynthetically active radiation (PAR, μmol m−2s−1, (b) right vertical axis) in phytotrons during heat stress treatments in 2016.
Agronomy 12 03092 g001
Figure 2. Effects of different high-temperature levels treatments on grain yield per plant including total (original and regenerated tillers) and original tillers of Huaidao-5 and Wuyunjing-24 at booting (BT), flowering (FL), and combined (BT + FL) stages. (a) Huaidao-5 at BT treatment; (b) Huaidao-5 at FL treatment; (c) Huaidao-5 at BT + FL treatment; (d) Wuyunjing-24 at BT treatment; (e) Wuyunjing-24 at FL treatment; (f) Wuyunjing-24 at BT + FL treatment. Different uppercase and lowercase letters indicate significant differences at 0.05 level for total and original tillers, respectively. Vertical bars represent the standard deviation of the mean.
Agronomy 12 03092 g002
Figure 3. Effects of different high-temperature levels treatments on panicle number per plant including total (original and regenerated tillers) and original tillers of Huaidao-5 and Wuyunjing-24 at booting (BT), flowering (FL), and combined (BT + FL) stages. (a) Huaidao-5 at BT treatment; (b) Huaidao-5 at FL treatment; (c) Huaidao-5 at BT + FL treatment; (d) Wuyunjing-24 at BT treatment; (e) Wuyunjing-24 at FL treatment; (f) Wuyunjing-24 at BT + FL treatment. Different uppercase and lowercase letters indicate significant differences at 0.05 level for total and original tillers, respectively. Vertical bars represent the standard deviation of the mean.
Agronomy 12 03092 g003
Figure 4. Effects of different high-temperature levels treatments on spikelet number per plant including total (original and regenerated tillers) and original tillers of Huaidao-5 and Wuyunjing-24 at booting (BT), flowering (FL), and combined (BT + FL) stages. (a) Huaidao-5 at BT treatment; (b) Huaidao-5 at FL treatment; (c) Huaidao-5 at BT + FL treatment; (d) Wuyunjing-24 at BT treatment; (e) Wuyunjing-24 at FL treatment; (f) Wuyunjing-24 at BT + FL treatment. Different uppercase and lowercase letters indicate significant differences at 0.05 level for total and original tillers, respectively. Vertical bars represent the standard deviation of the mean.
Agronomy 12 03092 g004
Figure 5. Effects of different high-temperature levels treatments on spikelet fertility including total (original and regenerated tillers) and original tillers of Huaidao-5 and Wuyunjing-24 at booting (BT), flowering (FL), and combined (BT + FL) stages. (a) Huaidao-5 at BT treatment; (b) Huaidao-5 at FL treatment; (c) Huaidao-5 at BT + FL treatment; (d) Wuyunjing-24 at BT treatment; (e) Wuyunjing-24 at FL treatment; (f) Wuyunjing-24 at BT + FL treatment. Different uppercase and lowercase letters indicate significant differences at 0.05 level for total and original tillers, respectively. Vertical bars represent the standard deviation of the mean.
Agronomy 12 03092 g005
Figure 6. Effects of different high-temperature levels treatments on 1000-grain weight including total (original and regenerated tillers) and original tillers of Huaidao-5 and Wuyunjing-24 at booting (BT), flowering (FL), and combined (BT + FL) stages. (a) Huaidao-5 at BT treatment; (b) Huaidao-5 at FL treatment; (c) Huaidao-5 at BT + FL treatment; (d) Wuyunjing-24 at BT treatment; (e) Wuyunjing-24 at FL treatment; (f) Wuyunjing-24 at BT + FL treatment. Different uppercase and lowercase letters indicate significant differences at 0.05 level for total and original tillers, respectively. Vertical bars represent the standard deviation of the mean.
Agronomy 12 03092 g006
Figure 7. Observed and fitted spikelet fertility (%) of upper, middle, and lower parts of the panicles in relation to heat degree day (HDD) at three different growth stages of booting (BT) (a), flowering (FL) (b) and combined (BT + FL) stages (c). Both varieties were used in the graph (τ was set to 33 °C for BT and 35 °C for FL. Total tillers (○ and solid line); original tillers (△ and dashed line).
Agronomy 12 03092 g007
Figure 8. Relationships between the relative grain yield and yield components of Huaidao-5 and Wuyunjing-24 and heat degree days (HDD) at booting (BT), flowering (FL), and combined (BT + FL) stages (ae). Blue, black, and red lines are for BT, FL, and BT + FL stages, respectively. Both varieties were used in the graph (τ was set to 33 °C for BT and 35 °C for FL. Total tillers (○ and solid line); original tillers (△ and dashed line). ** p < 0.01.
Agronomy 12 03092 g008
Table 1. Experimental information.
CultivarTemperature LevelsStageDurations
Huaidao-5 and
Wuyunjing-24
T1 (32/22 °C)
T2 (40/30 °C)
T3 (44/34 °C)
Booting
(BT)
D2 (2 days) and D4 (4 days)
Flowering (FL)D2 (2 days) and D4 (4 days)
Combined
(BT + FL)
D2+2 (4 days = 2 days BT + 2 days FL) and D4+4 (8 days = 4 days BT + 4 days FL)
Table 2. Significance of main effects of high-temperature level (T) and duration (D), as well as their interaction (T × D) for grain yield and yield components (including original and regenerated tillers) of two rice cultivars at booting (BT), flowering (FL), and combined (BT + FL) stages during the 2016–2017 growing seasons.
StageCultivarYield and Yield ComponentsTDT × D
BootingHuaidao-5YPP<0.0010.0010.034
PNPP<0.001<0.0010.001
SNPP<0.001<0.001<0.001
SF<0.001<0.001<0.001
TGW<0.0010.0010.016
Wuyunjing-24YPP<0.0010.003ns
PNPP<0.001<0.001<0.001
SNPP<0.001<0.001<0.001
SF<0.001<0.001<0.001
TGW<0.001<0.0010.001
FloweringHuaidao-5YPP<0.001<0.001<0.001
PNPP<0.001<0.001<0.001
SNPP<0.001<0.0010.001
SF<0.001<0.001<0.001
TGW<0.001<0.001<0.001
Wuyunjing-24YPP<0.001<0.001<0.001
PNPP0.003ns0.025
SNPP<0.001<0.001<0.001
SF<0.001<0.001<0.001
TGW<0.001<0.0010.002
Combined
stages
Huaidao-5YPP<0.001<0.001<0.001
PNPP<0.001<0.001<0.001
SNPP<0.001<0.001<0.001
SF<0.001<0.001<0.001
TGW<0.001<0.001<0.001
Wuyunjing-24YPP<0.001<0.001<0.001
PNPP<0.001<0.001<0.001
SNPP<0.001<0.001<0.001
SF<0.001<0.001<0.001
TGW<0.001<0.001<0.001
YPP: yield per plant; SNPP: spikelet number per panicle; TGW: 1000-grain weight; SF: spikelet fertility (%); PNPP: panicle number per pot. Numbers in the table indicate the p-values of main and interaction effects for which at least one variable was detected as significant (p ≤ 0.05); ns: not significant (p > 0.05).
Table 3. Multiple linear regression analysis between grain yield and yield components (including original and total tillers) of Huaidao-5 and Wuyunjing-24 under different high-temperature levels (T1–T3) at booting (BT), flowering (FL), and combined (BT + FL) stages during 2016–2017 growing seasons.
StageCultivarYield ComponentsOriginal TillersTotal Tillers
T1T2T3T2T3
SRCPartial R2SRCPartial R2SRCPartial R2SRCPartial R2SRCPartial R2
BootingHuaidao-5SNPP0.347 **0.3160.650 **0.5720.465 **0.4271.104 **0.9760.998 **0.844
TGW0.218 **0.0480.119 **0.0280.0620.0570.178 **0.0490.251 *0.191
SF0.041 **0.0060.419 **0.3780.525 **0.5100.504 **0.4450.794 **0.752
PNPP0.679 **0.6310.476 **0.0210.278 **0.0010.931 **−0.4731.095 **−0.798
Wuyunjing-24SNPP0.404 **0.2130.341 **0.2610.511 **0.3690.585 **0.5171.963 **1.305
TGW0.118 **0.0230.259 **0.1520.375 **0.2910.258 **0.1780.555 *0.387
SF0.038 **0.0040.486 **0.4710.178 **0.1480.565 **0.5390.445 *0.363
PNPP0.855 **0.7600.407 **0.1160.537 **0.1900.470 **−0.2342.240 **−1.096
FloweringHuaidao-5SNPP0.348 **0.2690.045 **0.0040.053 *0.0110.087 **0.0700.198 **0.139
TGW0.224 **0.0040.047 **0.0100.0430.0160.037 *0.0210.119 **0.113
SF0.042 **0.0250.950 **0.9430.974 **0.9671.021 **1.0120.966 **0.961
PNPP0.791 **0.7020.134 **0.0430.118 **0.0030.174 **−0.1040.261 **−0.213
Wuyunjing-24SNPP0.211 **0.1780.111 *0.0010.025 **0.0010.103 *0.0020.172 **0.080
TGW0.311 **0.1100.158 *0.0720.044 **0.0290.144 *0.0670.0500.040
SF0.120 **0.0180.803 **0.7600.970 **0.9670.812 **0.7681.025 **1.016
PNPP0.777 **0.6930.447 **0.1650.079 **0.0030.439 **0.1610.211 **−0.138
Combined
stages
Huaidao-5SNPP0.342 **0.3110.239 **0.2210.0690.0570.411 **0.4020.883 *0.771
TGW0.218 **0.0470.076 *0.0600.273 *0.2540.101 **0.0880.1510.142
SF0.033 **0.0030.706 **0.6940.674 **0.6690.680 **0.6650.905 **0.862
PNPP0.686 **0.6390.135 **0.0240.104 *0.0170.224 **−0.1550.869 **−0.778
Wuyunjing-24SNPP0.345 **0.2850.235 **0.2120.0890.0700.444 **0.4241.042 **0.859
TGW0.243 **0.0370.169 *0.1560.0210.0190.200 **0.1850.181 *0.162
SF0.055 *0.0430.648 **0.6200.912 **0.9030.561 **0.5350.906 **0.886
PNPP0.654 **0.6350.205 **0.0070.099 **0.0040.214 **−0.1451.102 **−0.916
YPP: rice yield per plant (including original and total tillers); SNPP: spikelet number per panicle (including original and total tillers); TGW: 1000-grain weight (including original and total tillers); SF: spikelet fertility (%) (including original and total tillers); PNPP: panicle number per pot (including original and total tillers); SRC: standardized regression coefficient; * p < 0.05, ** p < 0.01.
Table 4. Relationship between average spikelet fertility of both durations and both cultivars and vapor pressure deficit (VPD). SFO denotes the spikelet fertility of original tillers, and SFT denotes the spikelet fertility of total tillers. Different letters indicate significant differences at 0.05 level.
TreatmentVPD (Min/Max/Ave)SFO
(Booting)
SFT
(Booting)
SFO
(Flowering)
SFT
(Flowering)
SFO
(Combined)
SFT
(Combined)
T10.64/2.36/1.4293.04a92.97a93.25a93.25a92.97a92.97a
T20.37/3.20/1.4386.84b86.87b59.64b59.85b70.02b71.10b
T30.47/4.22/1.7658.87c60.45c19.73c21.69c21.57c33.30c
Publisher’s Note: MDPI stays neutral with regard to jurisdictional claims in published maps and institutional affiliations.

