
Early Season Growth Responses of Resistant and Susceptible Cotton Genotypes to Reniform Nematode and Soil Potassium Application

 , , and
Abstract
1. Introduction
2. Materials and Methods
2.1. Plant Growth Conditions
2.2. Morphological Measurements
2.3. Reniform Nematode Population Measurements
2.4. Data Analysis
3. Results
3.1. Seedling Emergence and First True Leaf
Genotype
3.2. 30-Day Measurements
3.2.1. Genotype
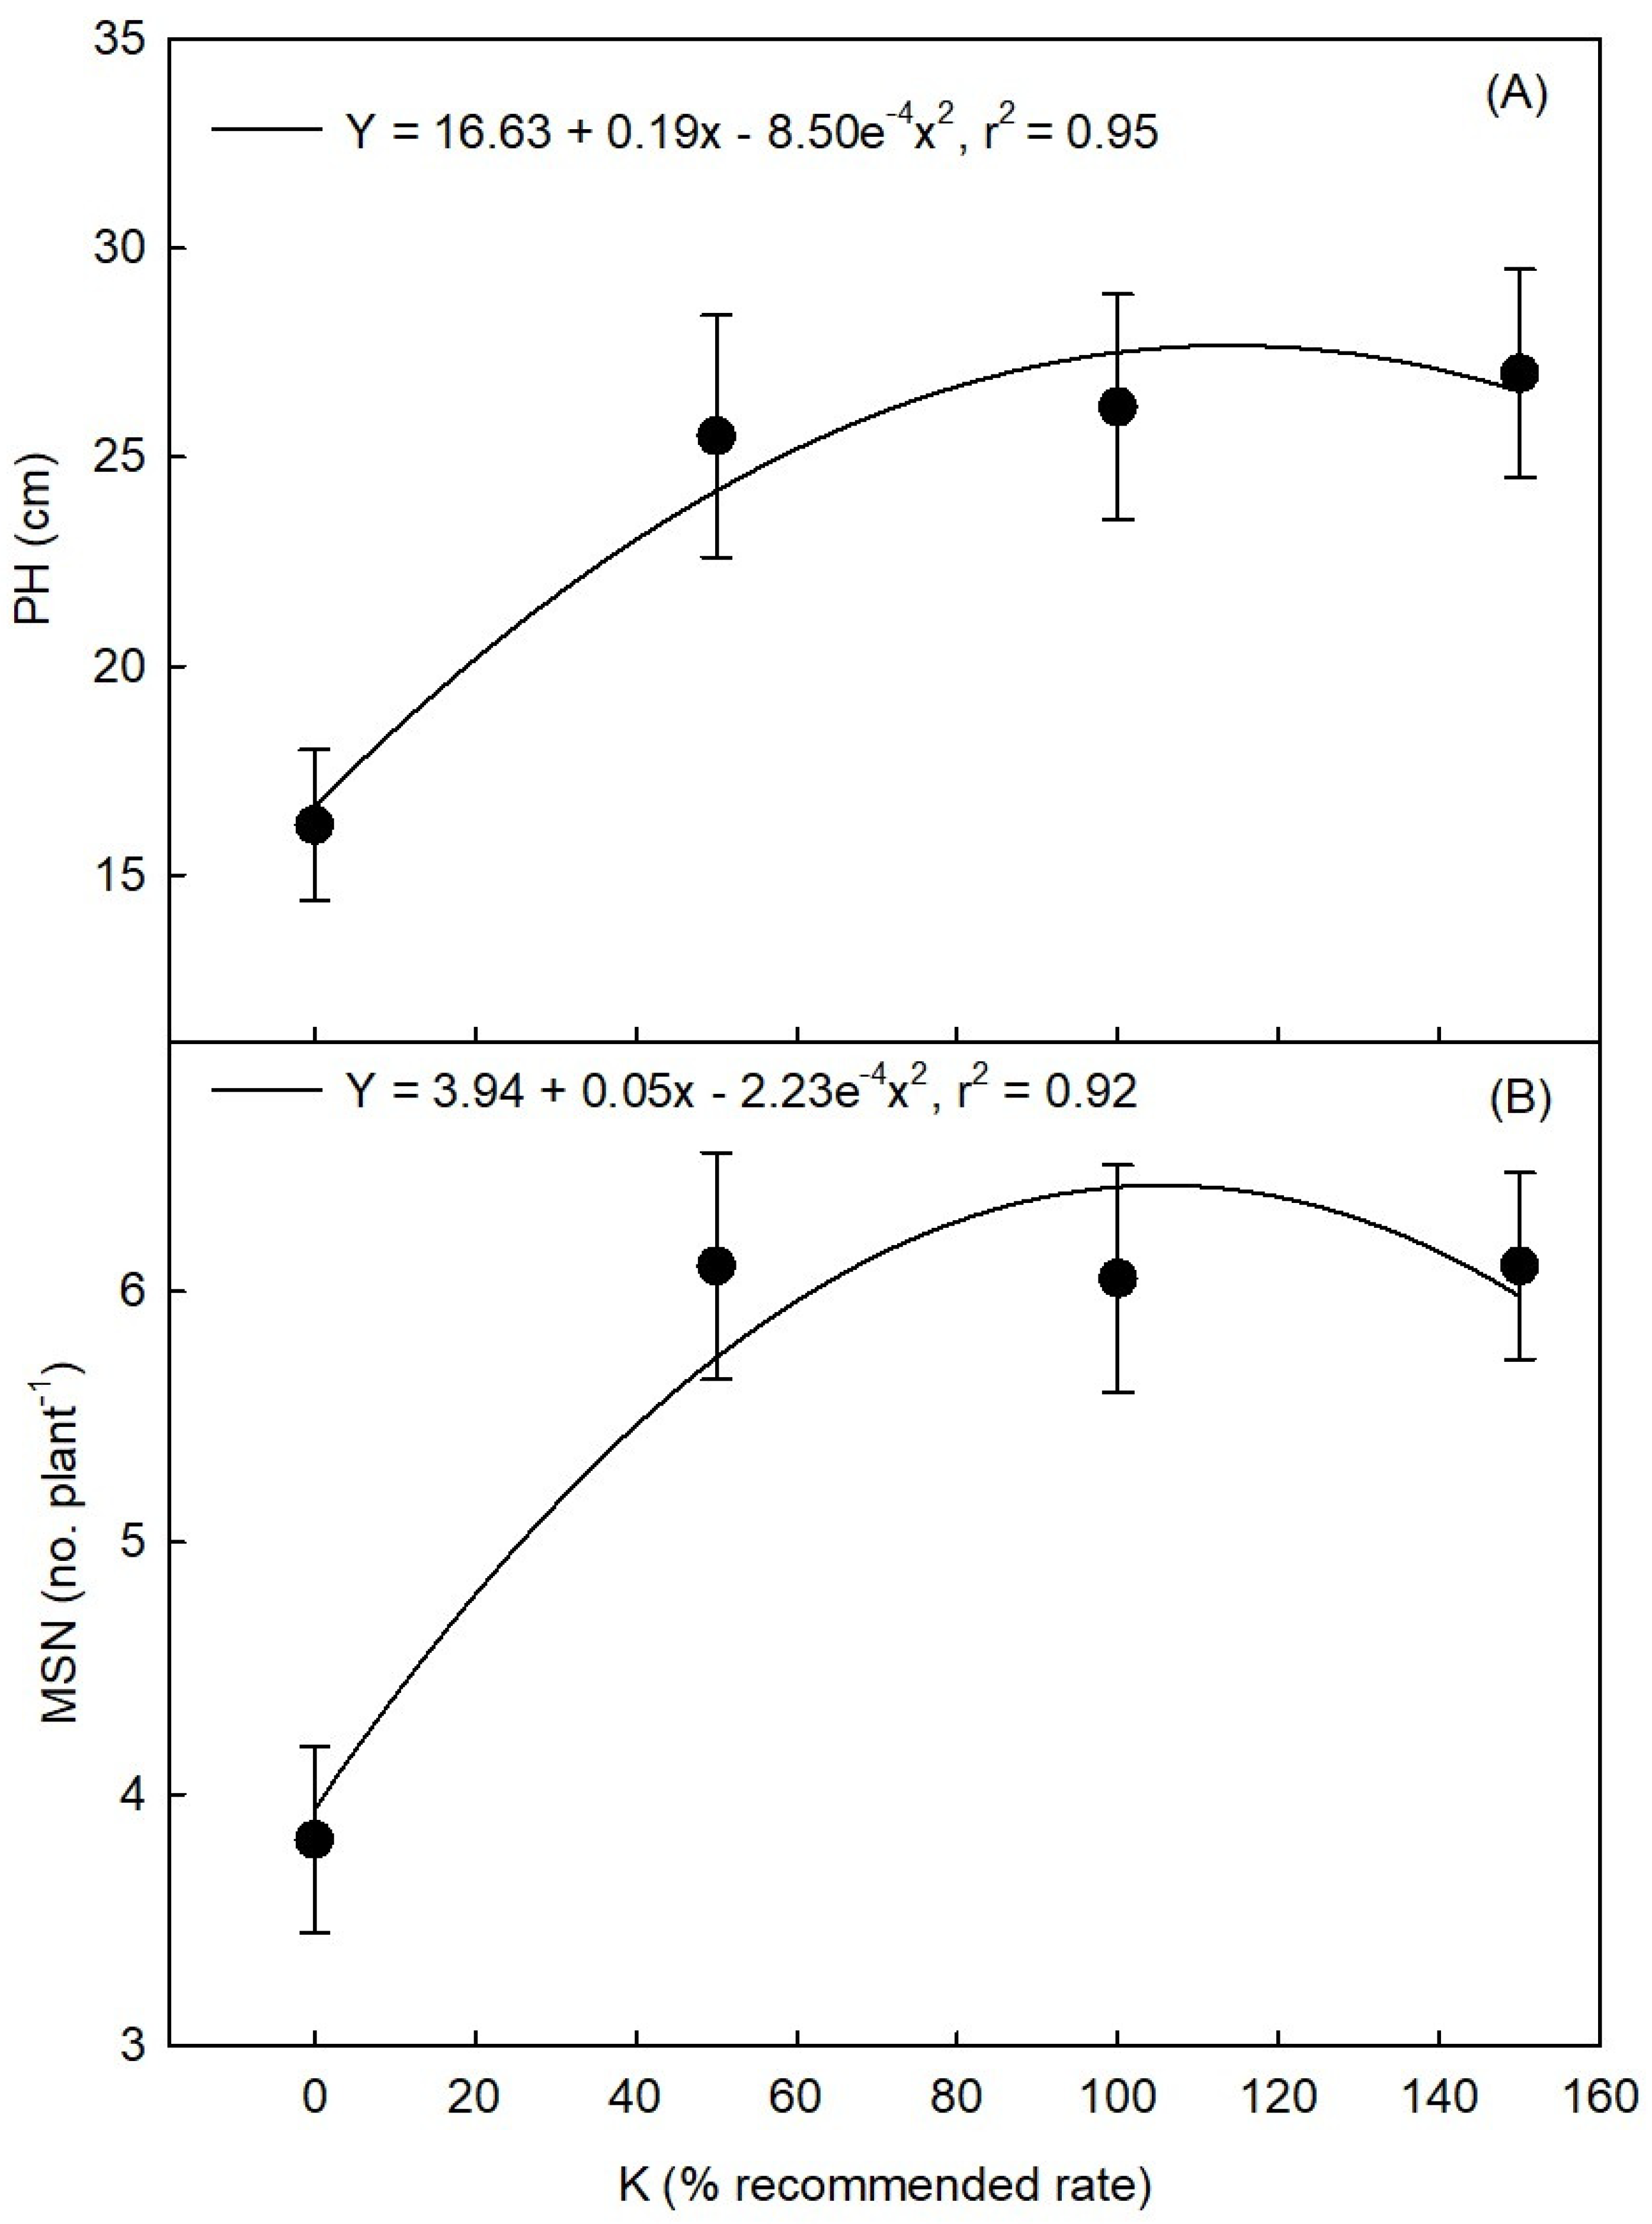
3.2.2. K
3.2.3. Genotype × K Interaction
3.3. 60-Day Measurements
3.3.1. Genotype
3.3.2. K
3.4. Reniform Nematode
3.5. Interaction
4. Discussion
5. Conclusions
Author Contributions
Funding
Data Availability Statement
Acknowledgments
Conflicts of Interest
Disclaimer
Abbreviations
| FTL | time to first true leaf |
| FDW | weight of reproductive structures |
| FN | number of reproductive structures |
| K | potassium |
| LA | leaf area per plant |
| LDW | dry leaf weight |
| MSN | mainstem nodes, N, nitrogen |
| NO | without inoculation of reniform nematode |
| PH | plant height |
| RN | reniform nematode |
| SER | seedling emergence rate |
| TH | leaf thickness |
| RC | reniform nematode population counts |
| RDW | root dry weight |
| SDW | stem dry weight |
| TRL | taproot length |
| TDW | total dry weight |
References
- Yinan, J.; Helin, D.; Pengcheng, L.; Miao, S.; Jingjing, S.; Weina, F.; Wenxiu, X.; Cangsong, Z. Effects of soil potassium level on growth and photosynthetic characteristics of early cotton. Xinjiang Agric. Sci. 2021, 58, 2236–2243. [Google Scholar]
- Read, J.J.; Reddy, K.R.; Jenkins, J.N. Yield and fiber quality of upland cotton as influenced by nitrogen and potassium nutrition. Eur. J. Agron. 2006, 24, 282–290. [Google Scholar] [CrossRef]
- Pettigrew, W.T. Potassium influences on yield and quality production for maize, wheat, soybean and cotton. Physiol. Plant. 2008, 133, 670–681. [Google Scholar] [CrossRef] [PubMed]
- Hussain, S.; Ali, H.; Gardezi, S.T.R. Soil applied potassium improves productivity and fiber quality of cotton cultivars grown on potassium deficient soils. PLoS ONE 2021, 16, e0250713. [Google Scholar] [CrossRef] [PubMed]
- Reddy, K.R.; Zhao, D. Interactive effects of elevated CO2 and potassium deficiency on photosynthesis, growth, and biomass partitioning of cotton. Field Crops Res. 2005, 94, 201–213. [Google Scholar] [CrossRef]
- Girma, K.; Teal, R.K.; Freeman, K.; Boman, R.; Raun, W. Cotton lint yield and quality as affected by applications of N, P, and K fertilizers. J. Cotton Sci. 2007, 11, 12–19. [Google Scholar]
- Magare, P.; Jadhao, S.; Farkade, B.; Mali, D. Effect of levels of potassium on yield, nutrient uptake, fertility status and economics of cotton grown in vertisol. Int. J. Curr. Microbiol. Appl. Sci. 2018, 7, 1292–1300. [Google Scholar] [CrossRef]
- Whitaker, J.; Culpepper, S.; Freeman, M.; Harris, G.; Kemerait, B.; Perry, C.; Porter, W.; Roberts, P.; Shurley, D.; Smith, A. Georgia Cotton Production Guide; The University of Georgia: Athens, GA, USA, 2018; p. 146. [Google Scholar]
- Gardner, F.P. Physiology of Crop Plants; Iowa State University: Ames, IA, USA, 1985. [Google Scholar]
- Oosterhuis, D.M. Potassium management of cotton. In Potassium for Sustainable Crop Production; Pasricha, N.S., Bansal, S.K., Eds.; International Potash Inst.: Basel, Switzerland; Potash Research Institute of India: Gurgaon, Haryana, 2002; pp. 321–346. [Google Scholar]
- Tsialtas, I.T.; Shabala, S.; Baxevanos, D.; Matsi, T. Effect of potassium fertilization on leaf physiology, fiber yield and quality in cotton (Gossypium hirsutum L.) under irrigated Mediterranean conditions. Field Crops Res. 2016, 193, 94–103. [Google Scholar] [CrossRef]
- Robinson, A. Nematode management in cotton. In Integrated Management and Biocontrol of Vegetable and Grain Crops Nematodes; Cianco, A., Mukerji, K.J., Eds.; Springer: Heidelberg, Germany, 2008; pp. 149–182. [Google Scholar]
- Mitchell, C.C.; Gazaway, W.S. The e_ects of K fertilization on reniform nematode damage to cotton. In Proceedings of the Beltwide Cotton Conference, Nashville, TN, USA, 9–12 January 1996; pp. 1430–1432. [Google Scholar]
- Pettigrew, W.; Meredith, W., Jr.; Young, L. Potassium fertilization effects on cotton lint yield, yield components, and reniform nematode populations. Agron. J. 2005, 97, 1245–1251. [Google Scholar] [CrossRef]
- Kularathna, H.M.M.T. Influence of soil nutrients on reproduction and pathogenicity of Rotylenchulus reniformis on cotton. Nematropica 2013, 44, 15–24. [Google Scholar]
- Asmus, G.L.; Inomoto, M.M.; Cargnin, R.A. Cover crops for reniform nematode suppression in cotton: Greenhouse and field evaluations. Trop. Plant Pathol. 2008, 33, 85–89. [Google Scholar] [CrossRef]
- Blessitt, J.A.; Stetina, S.R.; Wallace, T.P.; Smith, P.T.; Sciumbato, G.L. Cotton (Gossypium hirsutum) cultivars exhibiting tolerance to the reniform nematode (Rotylenchulus reniformis). Int. J. Agron. 2012, 2012, 893178. [Google Scholar] [CrossRef]
- Holguin, C.M.; Gerard, P.; Mueller, J.D.; Khalilian, A.; Agudelo, P. Spatial distribution of reniform nematode in cotton as influenced by soil texture and crop rotations. Phytopathology 2015, 105, 674–683. [Google Scholar] [CrossRef]
- Erpelding, J.E.; Stetina, S.R. Genetic characterization of reniform nematode resistance for Gossypium arboreum accession PI 417895. Plant Breed. 2018, 137, 81–88. [Google Scholar] [CrossRef]
- Koenning, S.R.; Wrather, J.A.; Kirkpatrick, T.L.; Walker, N.R.; Starr, J.L.; Mueller, J.D. Plant-parasitic nematodes attacking cotton in the United States: Old and emerging production challenges. Plant Dis. 2004, 88, 100–113. [Google Scholar] [CrossRef] [PubMed]
- Robinson, A.; Bridges, A.; Percival, A. New sources of resistance to the reniform (Rotylenchulus reniformis Linford and Oliveira) and root-knot (Meloidogyne incognita) nematode in upland (Gossypium hirsutum L.) and sea island (G. barbadense L.) cotton cotton. J. Cotton Sci. 2004, 8, 191–197. [Google Scholar]
- Starr, J.; Smith, C.; Ripple, K.; Zhou, E.; Nichols, R.; Faske, T. Registration of TAM RKRNR-9 and TAM RKRNR-12 germplasm lines of upland cotton resistant to reniform and root-knot nematodes. J. Plant. Regist. 2011, 5, 393–396. [Google Scholar] [CrossRef]
- Khanal, C.; McGawley, E.C.; Overstreet, C.; Stetina, S.R. The elusive search for reniform nematode resistance in cotton. Phytopathology 2018, 108, 532–541. [Google Scholar] [CrossRef] [PubMed]
- Jost, P.H.; Cothren, J.T. Growth and yield comparisons of cotton planted in conventional and ultra-narrow row spacings. Crop Sci. 2000, 40, 430–435. [Google Scholar] [CrossRef]
- Koti, S.; Reddy, K.R.; Lawrence, G.; Reddy, V.; Kakani, V. Effect of enhanced UV-B radiation on reniform nematode (Rotylenchulus reniformis Linford and Oliviera) populations in Cotton (Gossypium hirsutum L.). Plant Pathol. J. 2007, 6, 51–59. [Google Scholar] [CrossRef][Green Version]
- Kawakami, E.M.; Oosterhuis, D.M.; Snider, J.L.; Mozaffari, M. Physiological and yield responses of field-grown cotton to application of urea with the urease inhibitor NBPT and the nitrification inhibitor DCD. Eur. J. Agron. 2012, 43, 147–154. [Google Scholar] [CrossRef]
- Oosterhuis, D.M.; Loka, D.A.; Raper, T.B. Potassium and stress alleviation: Physiological functions and management of cotton. J. Soil Sci. Plant Nutr. 2013, 176, 331–343. [Google Scholar] [CrossRef]
- Pettigrew, W.T.; Molin, W.T. Impact of Starter Fertilizer on Cotton Growth, Development, Lint Yield, and Fiber Quality Production for an Early Planted No-Till System. Crop Manag. 2013, 12, 1–7. [Google Scholar] [CrossRef]
- Pettigrew, W.T.; Jones, M.A. Cotton growth under no-till production in the lower Mississippi river valley alluvial flood plain. Agron. J. 2001, 93, 1398–1404. [Google Scholar] [CrossRef]
- Chastain, D.R.; Snider, J.L.; Collins, G.D.; Perry, C.D.; Whitaker, J.; Byrd, S.A. Water deficit in field-grown Gossypium hirsutum primarily limits net photosynthesis by decreasing stomatal conductance, increasing photorespiration, and increasing the ratio of dark respiration to gross photosynthesis. J. Plant Physiol. 2014, 171, 1576–1585. [Google Scholar] [CrossRef] [PubMed]
- Brand, D.; Wijewardana, C.; Gao, W.; Reddy, K.R. Interactive effects of carbon dioxide, low temperature, and ultraviolet-B radiation on cotton seedling root and shoot morphology and growth. Front. Earth Sci. 2016, 10, 607–620. [Google Scholar] [CrossRef]
- Chastain, D.R.; Snider, J.L.; Collins, G.D.; Perry, C.D.; Whitaker, J.; Byrd, S.A.; Oosterhuis, D.M.; Porter, W.M. Irrigation Scheduling Using Predawn Leaf Water Potential Improves Water Productivity in Drip-Irrigated Cotton. Crop Sci. 2016, 56, 3185–3195. [Google Scholar] [CrossRef]
- Reddy, K.R.; Brand, D.; Wijewardana, C.; Gao, W. Temperature effects on cotton seedling emergence, growth, and development. Agron. J. 2017, 109, 1379–1387. [Google Scholar] [CrossRef]
- Smith, H.C.; Ferrell, J.A.; Webster, T.M.; Fernandez, J.V. Cotton response to simulated auxin herbicide drift using standard and ultra-low carrier volumes. Weed Technol. 2017, 31, 1–9. [Google Scholar]
- Singh, K.; Wijewardana, C.; Gajanayake, B.; Lokhande, S.; Wallace, T.; Jones, D.; Reddy, K.R. Genotypic variability among cotton cultivars for heat and drought tolerance using reproductive and physiological traits. Euphytica 2018, 214, 57. [Google Scholar] [CrossRef]
- Agu, C. Effect of phosphorus fertilizer on root-knot nematode disease of soyabean. Trop. Sci. 2003, 43, 178–180. [Google Scholar] [CrossRef]
- Mahmood, I.; Shafi, A.; Rizvi, R. Interaction between Pseudomonas fluorescens and Meloidogyne incognita on tomato plant as influenced by the different levels of phosphorus. Arch. Phytopathol. Plant Prot. 2011, 44, 993–1000. [Google Scholar] [CrossRef]
- Byrd Jr, D.; Barker, K.; Ferris, H.; Nusbaum, C.; Griffin, W.; Small, R.; Stone, C.A. Two semi-automatic elutriators for extracting nematodes and certain fungi from soil. J. Nematol. 1976, 8, 206–221. [Google Scholar]
- Jenkins, W. A rapid centrifugal-flotation technique for separating nematodes from soil. Plant Dis. Rep. 1964, 48, 692–705. [Google Scholar]
- Singh, B.; Norvell, E.; Wijewardana, C.; Wallace, T.; Chastain, D.; Reddy, K.R. Assessing morphological characteristics of elite cotton lines from different breeding programmes for low temperature and drought tolerance. J. Agron. Crop Sci. 2018, 204, 467–476. [Google Scholar] [CrossRef]
- Bhandari, B.; Myers, G.O.; Indest, M.O.; Overstreet, C. Response of five resistant cotton genotypes to isolates of Rotylenchulus reniformis collected from reniform nematode infested fields of Louisiana. Nematropica 2015, 45, 252–262. [Google Scholar]
- Wilson, B.R.; Allen, T.W.; Catchot, A.L.; Krutz, L.J.; Dodds, D.M. Determining the profitability of reniform nematode control practices in the Mississippi cotton production system. Plant Health Prog. 2020, 21, 105–112. [Google Scholar] [CrossRef]
- Moore, S.R.; Lawrence, K.S. The effect of soil texture and irrigation on Rotylenchulus reniformis and cotton. J. Nematol. 2013, 45, 99–105. [Google Scholar]
- Galbieri, R.; Davis, R.F.; Kobayasti, L.; Albuquerque, M.C.; Bélot, J.-L.; Echer, F.R.; Boldt, A.S. Influence of cotton root system size on tolerance to Rotylenchulus reniformis. Plant Dis. 2018, 102, 2473–2479. [Google Scholar] [CrossRef] [PubMed]
- Le Saux, R.; Quénéhervé, P. Differential chemotactic responses of two plant-parasitic nematodes, Meloidogyne incognita and Rotylenchulus reniformis, to some inorganic ions. Nematology 2002, 4, 99–105. [Google Scholar]
- Vestergård, M. Nematode assemblages in the rhizosphere of spring barley (Hordeum vulgare L.) depended on fertilisation and plant growth phase. Pedobiologia 2004, 48, 257–265. [Google Scholar] [CrossRef]
- Reddy, K.R.; Hodges, H.F.; Varco, J.J. Potassium Nutrition of Cotton; Mississippi Agricultural & Forestry Experiment Station: Pontotoc, MS, USA, 2000; Volume 1094. [Google Scholar]
- Simone, D.M.S.-G.; Claudia, R.D.-A.; Miria, R.; Tais, S.D.; Patricia, M.M.; Davi, A.d.O.B. Mineral nutrition in the control of nematodes. Afr. J. Agric. Res. 2013, 8, 2413–2420. [Google Scholar]
- Lawrence, K.S. Reniform nematode (Rotylenchulus reniformis) and its interactions with cotton (Gossypium hirsutum). In Integrated Nematode Management: State-of-the-Art and Visions for the Future; CABI: Wallingford, UK, 2021; pp. 94–99. [Google Scholar]
- Yik, C.P.; Birchfield, W. Resistant germplasm in Gossypium species and related plants to Rotylenchulus reniformis. J. Nematol. 1984, 16, 146–153. [Google Scholar]
- Singh, B.; Chastain, D.; Reddy, K.R.; Snider, J.; Krutz, L.J.; Stetina, S.; Sehgal, A. Agronomic characterization of cotton genotypes susceptible and resistant to reniform nematode in the United States Midsouth. Agron. J. 2021, 113, 4280–4291. [Google Scholar] [CrossRef]
- Singh, B.; Chastain, D.R.; Reddy, K.R.; Snider, J.L.; Krutz, L.J.; Stetina, S.R.; Sehgal, A. EarlySeason morphological and physiological responses of resistant and susceptible cotton genotypes to reniform nematode and soil nitrogen. Agronomy 2020, 10, 1974. [Google Scholar] [CrossRef]
- Zia-ul-hassan, M.A.; Basra, S.; Rajpar, I.; Shah, A.; Galani, S. Response of potassium-use-efficient cotton genotypes to soil applied potassium. Int. J. Agric. Biol. 2014, 16, 771–776. [Google Scholar]
- Jiang, C.-C.; Ying, X.; Fang, C.; Lu, J.-W.; Wang, Y.-H. Plant growth, yield components, economic responses, and soil indigenous K uptake of two cotton genotypes with different K-efficiencies. Agric. Sci. China 2011, 10, 705–713. [Google Scholar] [CrossRef]


| Source of Variation | SER | FTL | TH | PH | MSN | TH | PH | MSN | LA | FN | TRL | RC | FDW | RDW | SDW | LDW | TDW |
|---|---|---|---|---|---|---|---|---|---|---|---|---|---|---|---|---|---|
| 30 Days | 60 Days | ||||||||||||||||
| Genotype | †NS | † ** | ** | ** | *** | NS | *** | *** | NS | NS | NS | ** | ** | ** | ** | † * | ** |
| K | NS | NS | NS | † *** | *** | NS | *** | *** | *** | *** | *** | NS | *** | *** | *** | *** | *** |
| Genotype and K | NS | NS | ** | NS | NS | NS | NS | NS | NS | NS | NS | NS | NS | NS | NS | NS | NS |
| RN | NS | NS | NS | NS | NS | NS | NS | NS | NS | ** | NS | *** | *** | ** | ** | NS | NS |
| Genotype and RN | NS | NS | NS | NS | NS | NS | NS | NS | NS | NS | NS | ** | NS | NS | NS | NS | NS |
| K and RN | NS | NS | NS | NS | NS | NS | NS | NS | NS | NS | NS | NS | NS | NS | NS | NS | NS |
| Genotype and K and RN | NS | NS | NS | NS | NS | NS | NS | NS | NS | NS | NS | NS | NS | NS | NS | NS | NS |
| Genotype | FTL | PH | MSN |
|---|---|---|---|
| Hours | Cm | No. Plant−1 | |
| 08SS110-NE06.OP | 150 ± 26 b† (83–217) * | 25.4 ± 7.0 a (11–40) | 5.85 ± 1.2 a (3–8) |
| 08SS100 | 147 ± 17 b (101–169) | 23.5 ± 6.0 b (6–32) | 5.40 ± 1.1 bc (3–7) |
| Deltapine 16 | 151 ± 17 b (101–193) | 23.6 ± 7.1 b (11–40) | 5.66 ± 1.4 ab (2–8) |
| PHY 490 W3FE | 160 ± 20 a (97–221) | 22.3 ± 6.0 b (9–33) | 5.16 ± 1.2 c (2–7) |
| Genotype | PH | MSN | RDW | SDW | FDW | LDW | TDW |
|---|---|---|---|---|---|---|---|
| Cm | No. Plant−1 | G Plant−1 | |||||
| 08SS110-NE06.OP | 38.7 ± 12.5 a† (14–62) * | 8.13 ± 1.8 a (4–11) | 1.85 ± 0.8 a (0.3–2.9) | 3.30 ± 1.8 a (0.1–7.1) | 0.23 ± 0.1 ab (0–2.1) | 3.35 ± 1.4 a (0.3–6.1) | 8.50 ± 4.0 a (0.7–15.3) |
| 08SS100 | 38.1 ± 11.1 b (12–57) | 7.26 ± 1.6 b (3–10) | 1.59 ± 0.7 a (0.1–3.1) | 3.08 ± 1.8 a (0.3–7.1) | 0.59 ± 0.2 a (0–2.9) | 3.29 ± 1.6 a (0–5.6) | 8.58 ± 4.2 a (0–14.8) |
| Deltapine 16 | 33.2 ± 10.2 bc (13–57) | 7.10 ± 1.6 b (2–9) | 1.80 ± 1 b (0.2–5.6) | 2.89 ± 1.8 ab (0.2–8.0) | 0.34 ± 0.1 a (0–2.8) | 3.11 ± 1.5 ab (0.3–6.16) | 8.13 ± 4.3 a (0.8–19.5) |
| PHY 490 W3FE | 32.2 ± 10.0 c (10–57) | 7.06 ± 1.7 b (3–11) | 1.54 ± 0.7 b (0.2–2.8) | 2.48 ± 1.4 b (0.2–5.7) | 0.22 ± 0.1 b (0–1.7) | 2.87 ± 1.4 b (0.2–6.9) | 7.14 ± 3.5 b (0.7–14.8) |
| RN | FN | FDW | RDW | SDW |
|---|---|---|---|---|
| No. Plant−1 | G Plant−1 | |||
| Without incoulation | 0.65 ± 0.2 a† (0–3) | 0.52 ± 0.3 a (0–2.9) | 1.59 ± 0.7 b (0–0.2) | 3.16 ± 1.9 a (0–7.9) |
| With inoculation | 0.38 ± 0.1 b (0–2) | 0.19 ± 0.1 b (0–2.4) | 1.81 ± 0.8 a (0–0.1) | 2.72 ± 1.6 b (0.2–6.5) |
| Genotype | RC Nematodes kg−1 | |
|---|---|---|
| With Inoculation | Without Inoculation | |
| Deltapine 16 | 9793 ± 1199 a† | 866 ± 297 b |
| PHY 490 W3FE | 8891 ± 952 a | 1576 ± 73 b |
| 08SS100 | 5787 ± 748 a | 360 ± 62 b |
| 08SS110-NE06.OP | 1744 ± 439 b | 974 ± 236 b |
Publisher’s Note: MDPI stays neutral with regard to jurisdictional claims in published maps and institutional affiliations. |
© 2022 by the authors. Licensee MDPI, Basel, Switzerland. This article is an open access article distributed under the terms and conditions of the Creative Commons Attribution (CC BY) license (https://creativecommons.org/licenses/by/4.0/).
Share and Cite
Singh, B.; Chastain, D.R.; Stetina, S.R.; Gardiner, E.S.; Snider, J.L. Early Season Growth Responses of Resistant and Susceptible Cotton Genotypes to Reniform Nematode and Soil Potassium Application. Agronomy 2022, 12, 2895. https://doi.org/10.3390/agronomy12112895
Singh B, Chastain DR, Stetina SR, Gardiner ES, Snider JL. Early Season Growth Responses of Resistant and Susceptible Cotton Genotypes to Reniform Nematode and Soil Potassium Application. Agronomy. 2022; 12(11):2895. https://doi.org/10.3390/agronomy12112895
Chicago/Turabian StyleSingh, Bhupinder, Daryl R. Chastain, Salliana R. Stetina, Emile S. Gardiner, and John L. Snider. 2022. "Early Season Growth Responses of Resistant and Susceptible Cotton Genotypes to Reniform Nematode and Soil Potassium Application" Agronomy 12, no. 11: 2895. https://doi.org/10.3390/agronomy12112895
APA StyleSingh, B., Chastain, D. R., Stetina, S. R., Gardiner, E. S., & Snider, J. L. (2022). Early Season Growth Responses of Resistant and Susceptible Cotton Genotypes to Reniform Nematode and Soil Potassium Application. Agronomy, 12(11), 2895. https://doi.org/10.3390/agronomy12112895