Estimation of Fruit Load in Australian Mango Orchards Using Machine Vision
Abstract
:1. Introduction
2. Materials and Methods
2.1. Orchards
2.2. Manual Estimates of Orchard Fruit Load
2.3. Machine Vision System
2.4. Experimental Exercises
2.5. Statistics
3. Results and Discussion
3.1. Machine Vision Method Validation
3.1.1. Repeatability and Time of Day
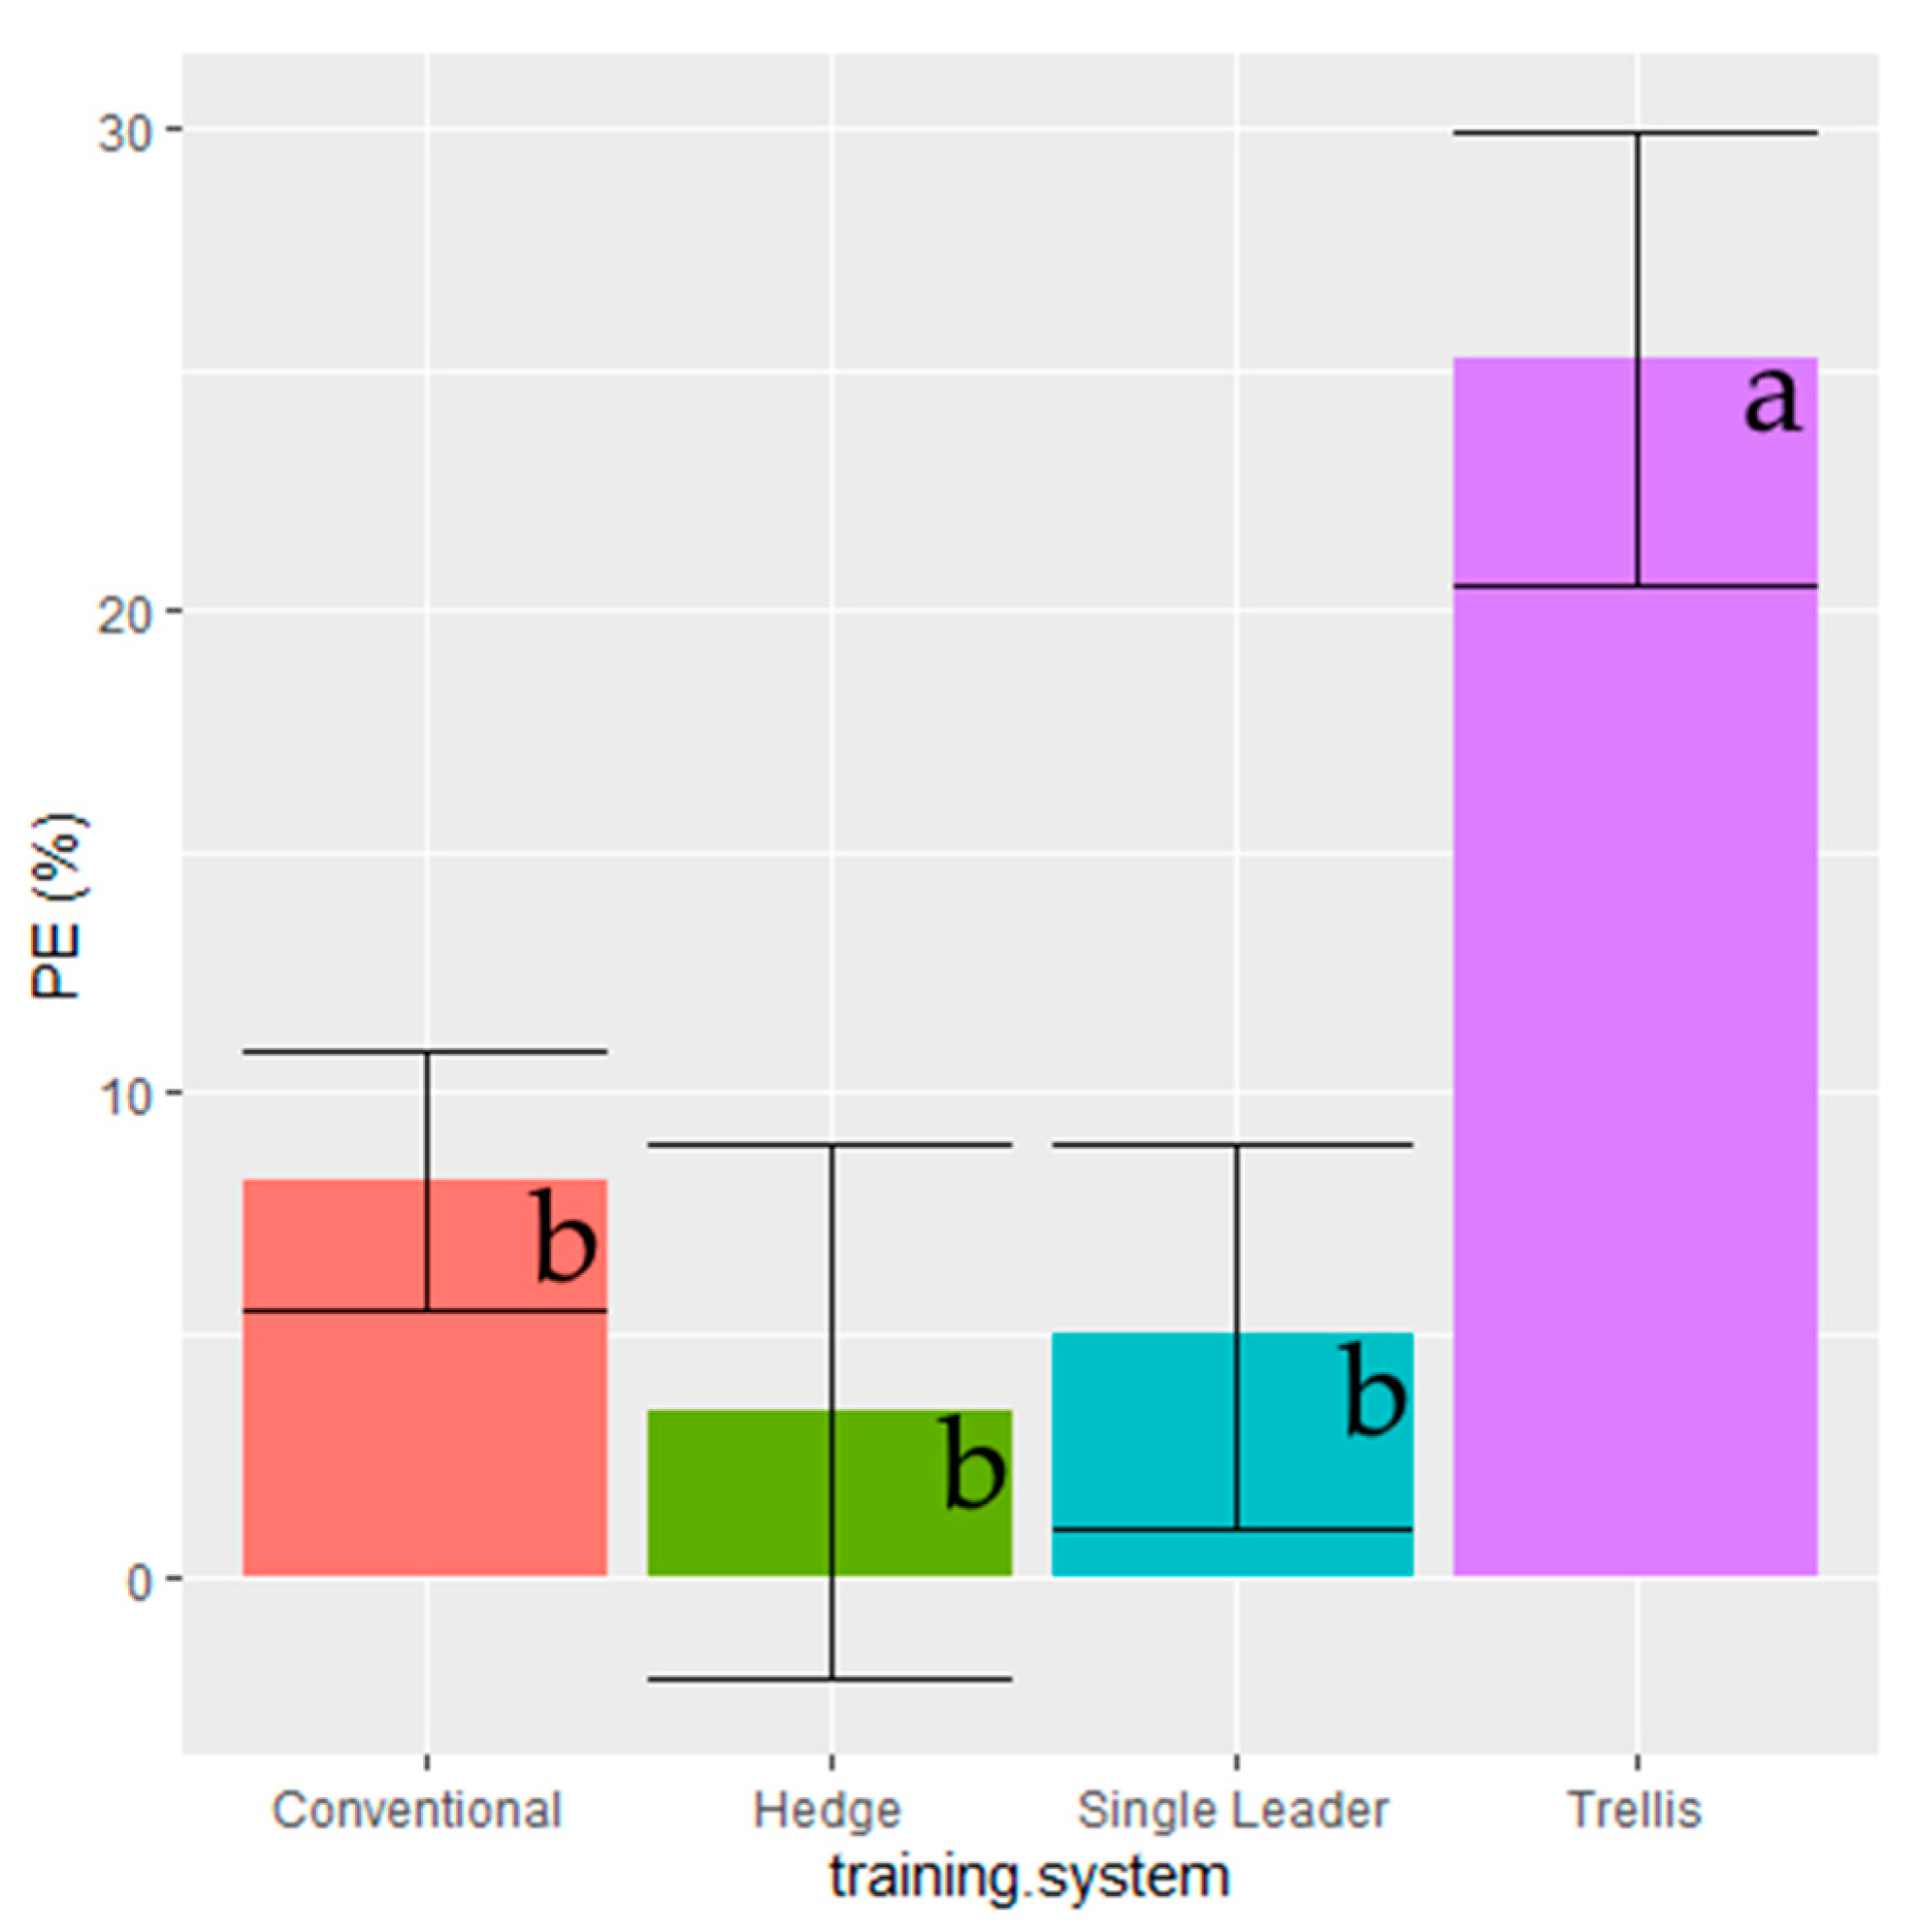
3.1.2. Impact of Canopy Management on Machine Vision Estimation
3.1.3. Down Sampling for Machine Vision Estimation of Fruit Load
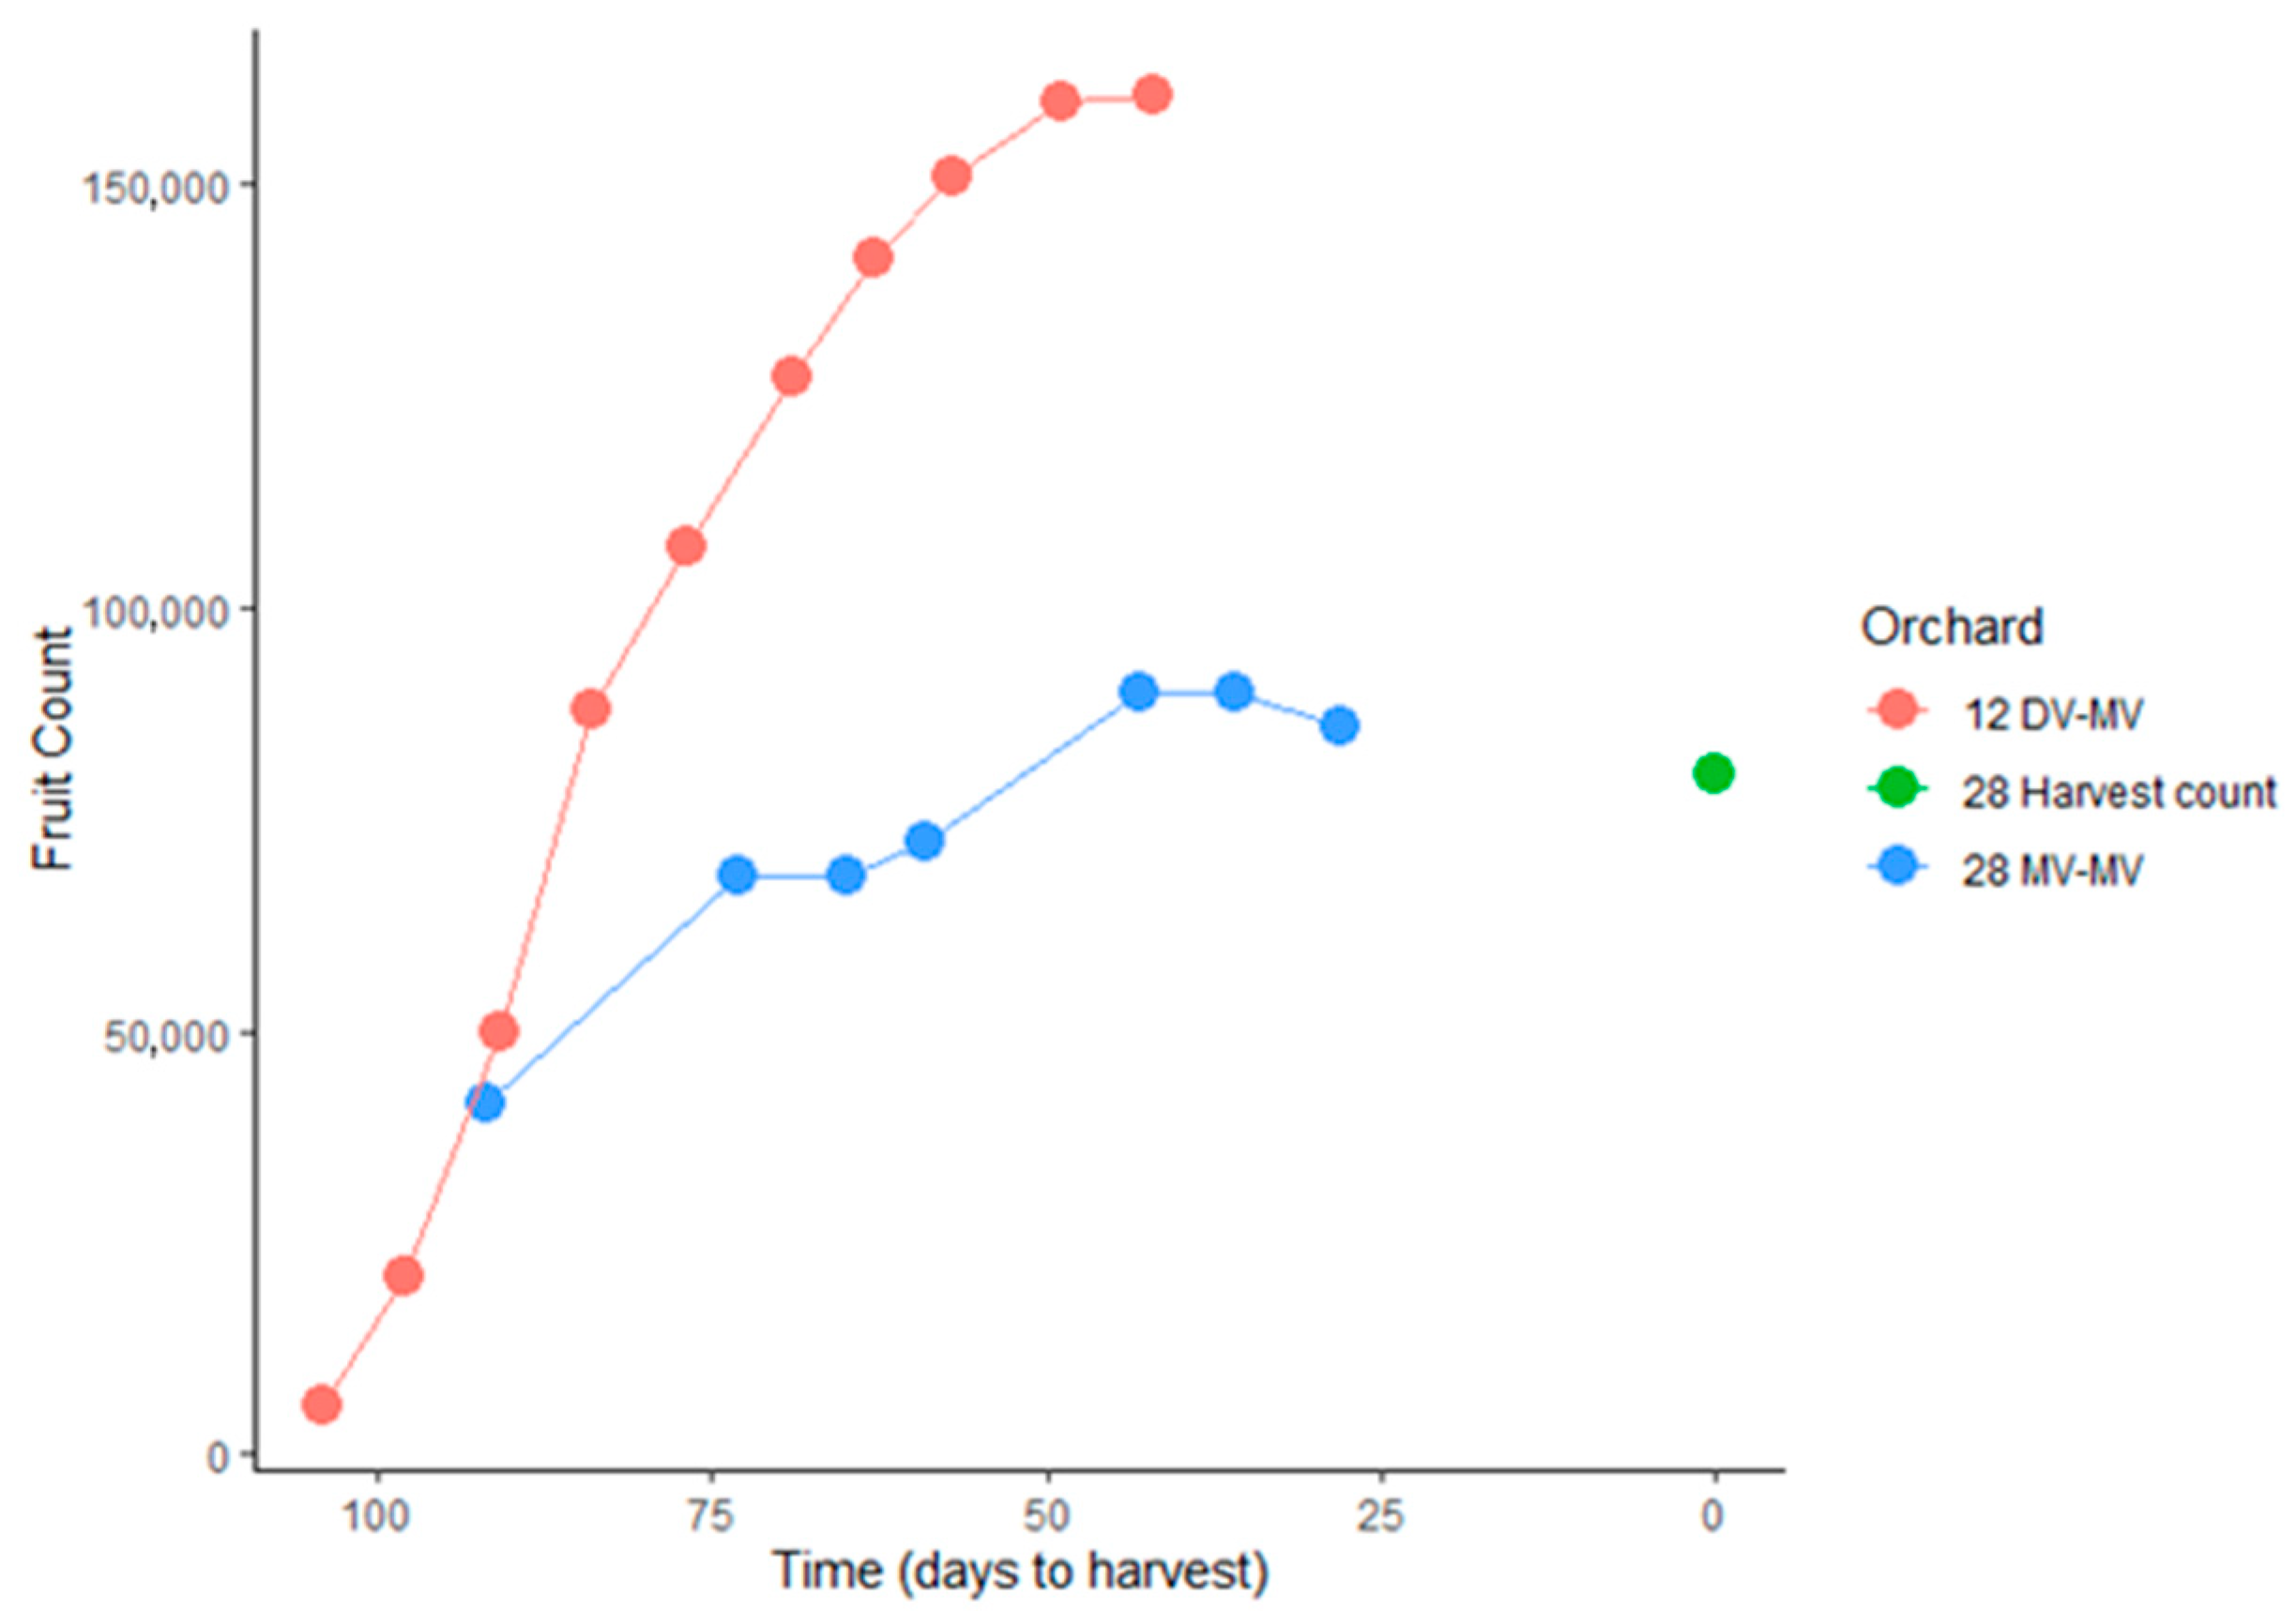
3.1.4. Crop Timing
3.2. Orchard Estimates
3.2.1. Method Comparisons 2019–2020
3.2.2. Method Comparisons 2020–2021
3.3. Use Cases
- (i)
- Per tree fruit load can used to generate a frequency distribution of tree fruit load. For example, Figure 8 displays the frequency distribution for a single orchard in two seasons. The agronomic use of such information remains to be explored.
- (ii)
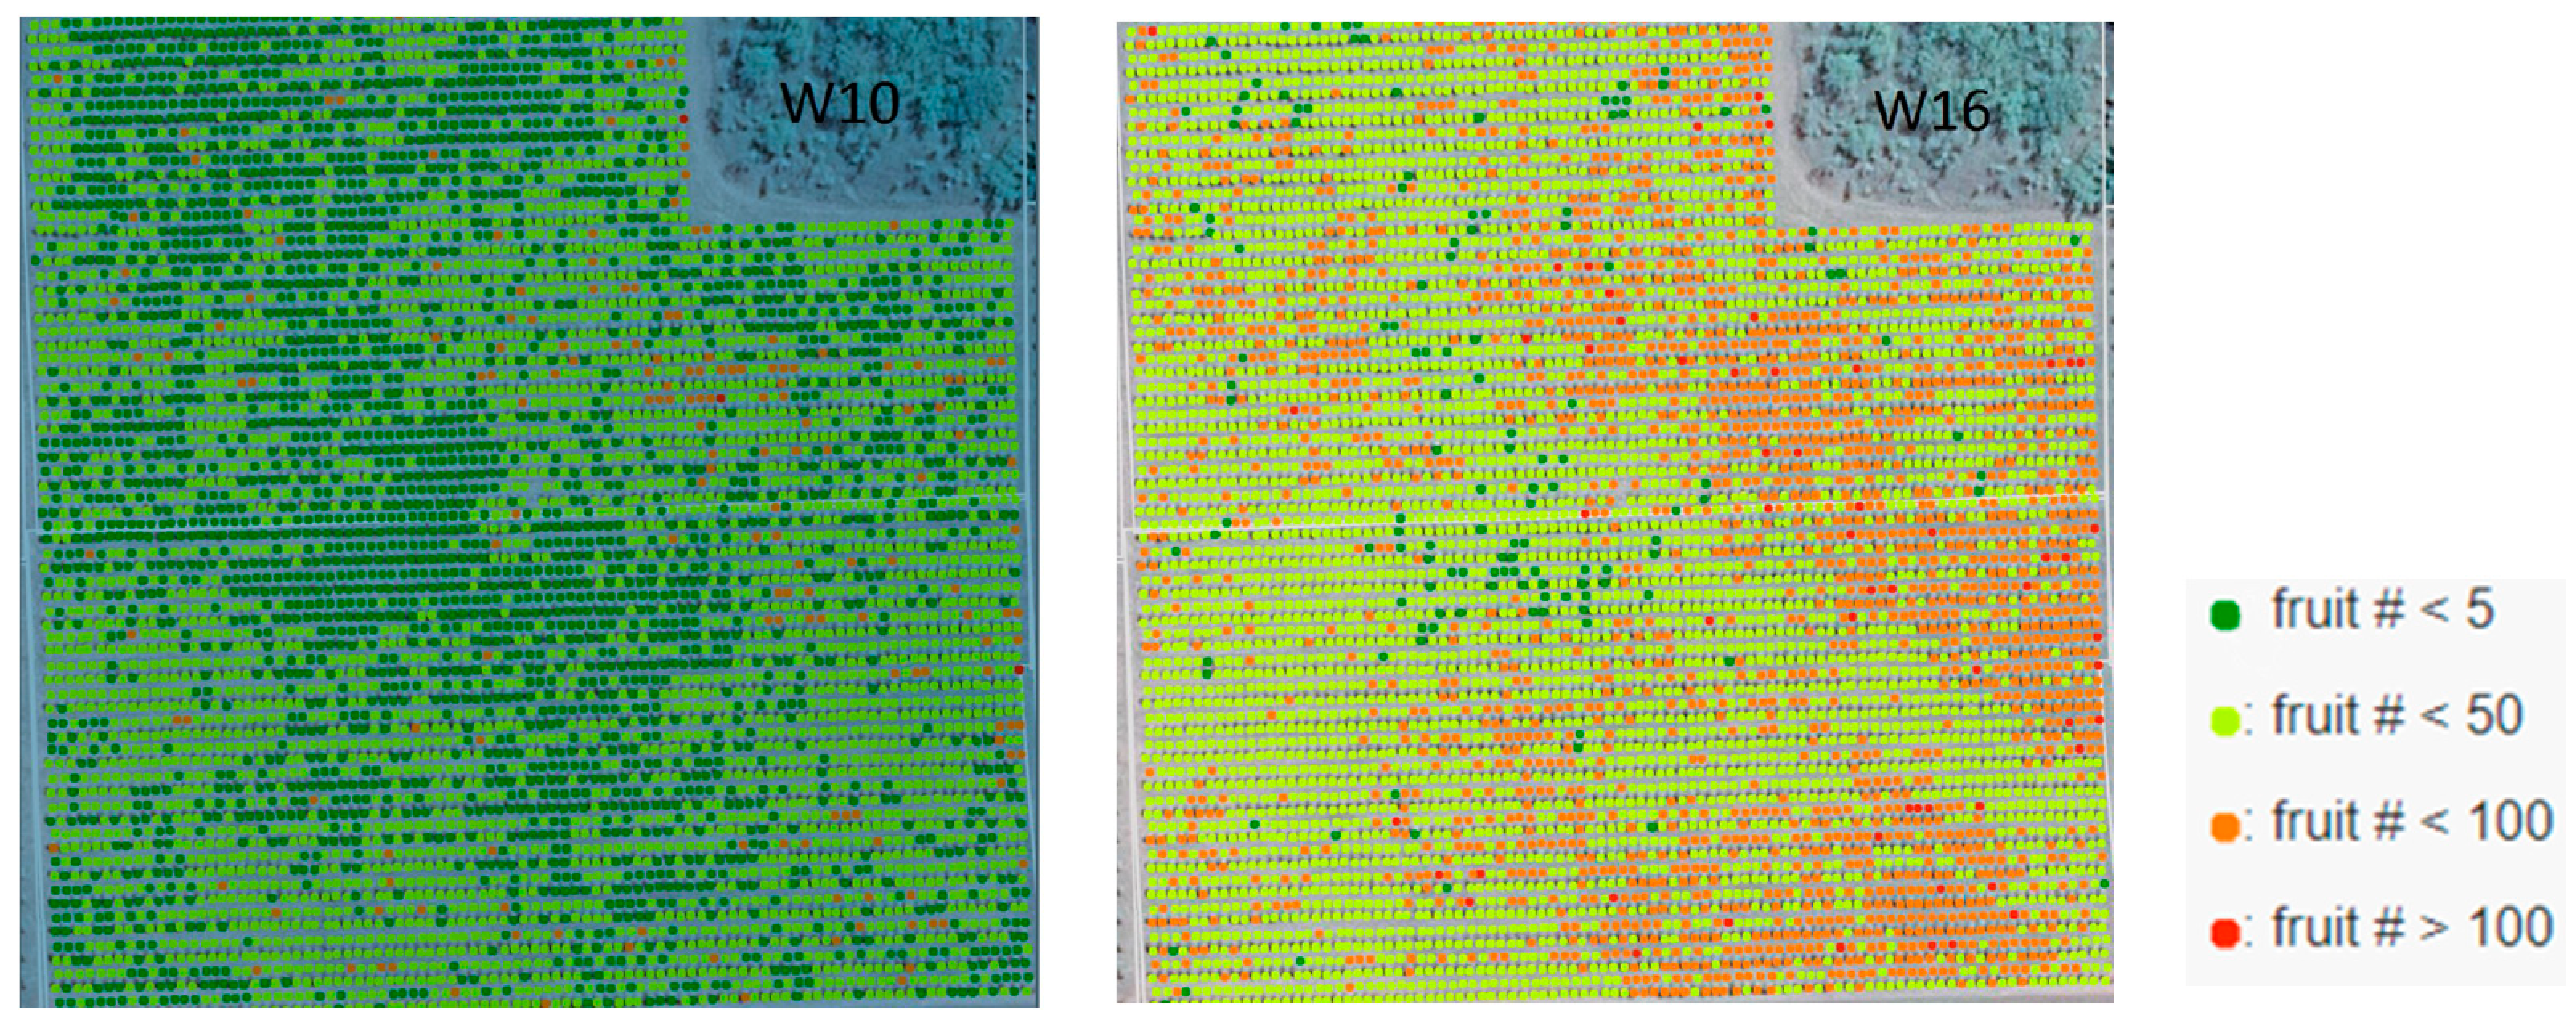
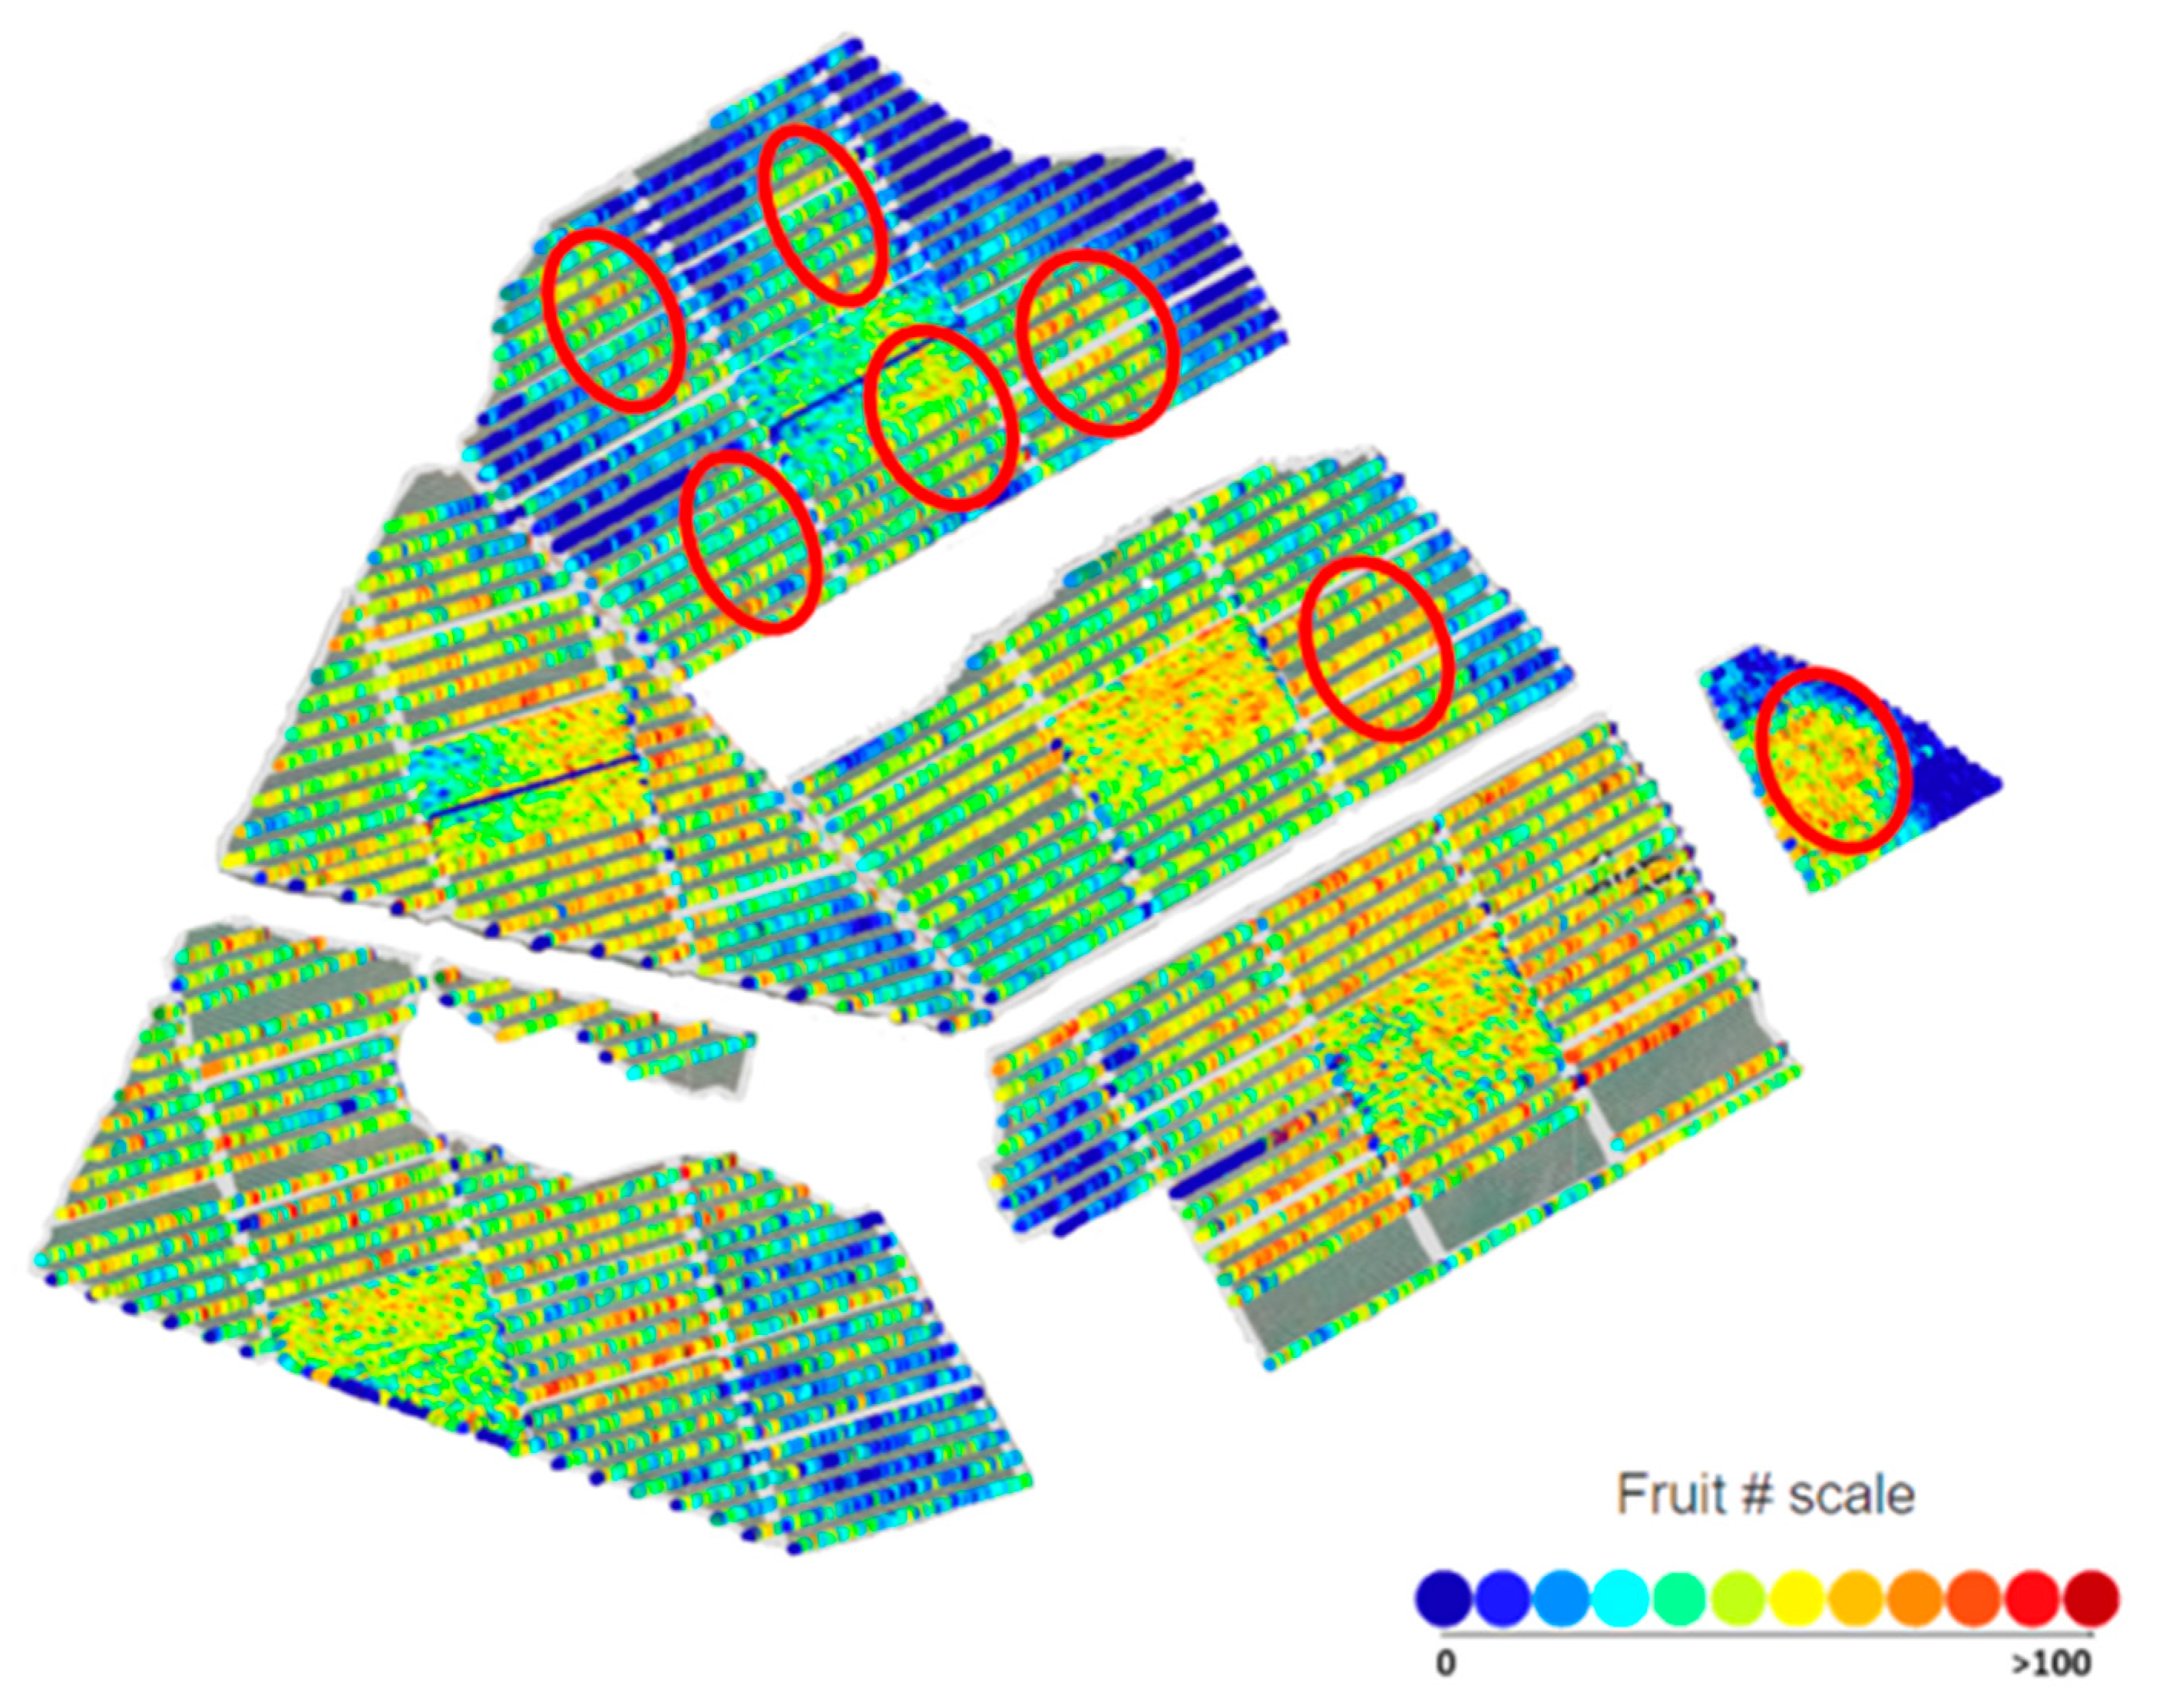
- A count increment at the tree spacing interval allows for display of a ‘heat map’ of fruit load across a farm. In one farm this display was interpretable in terms of the location and speed of operation of fans that had protected flowers on the farm during a frost event, with the display used to guide the subsequent placement of additional fans (Figure 9, top panel).
- (iii)
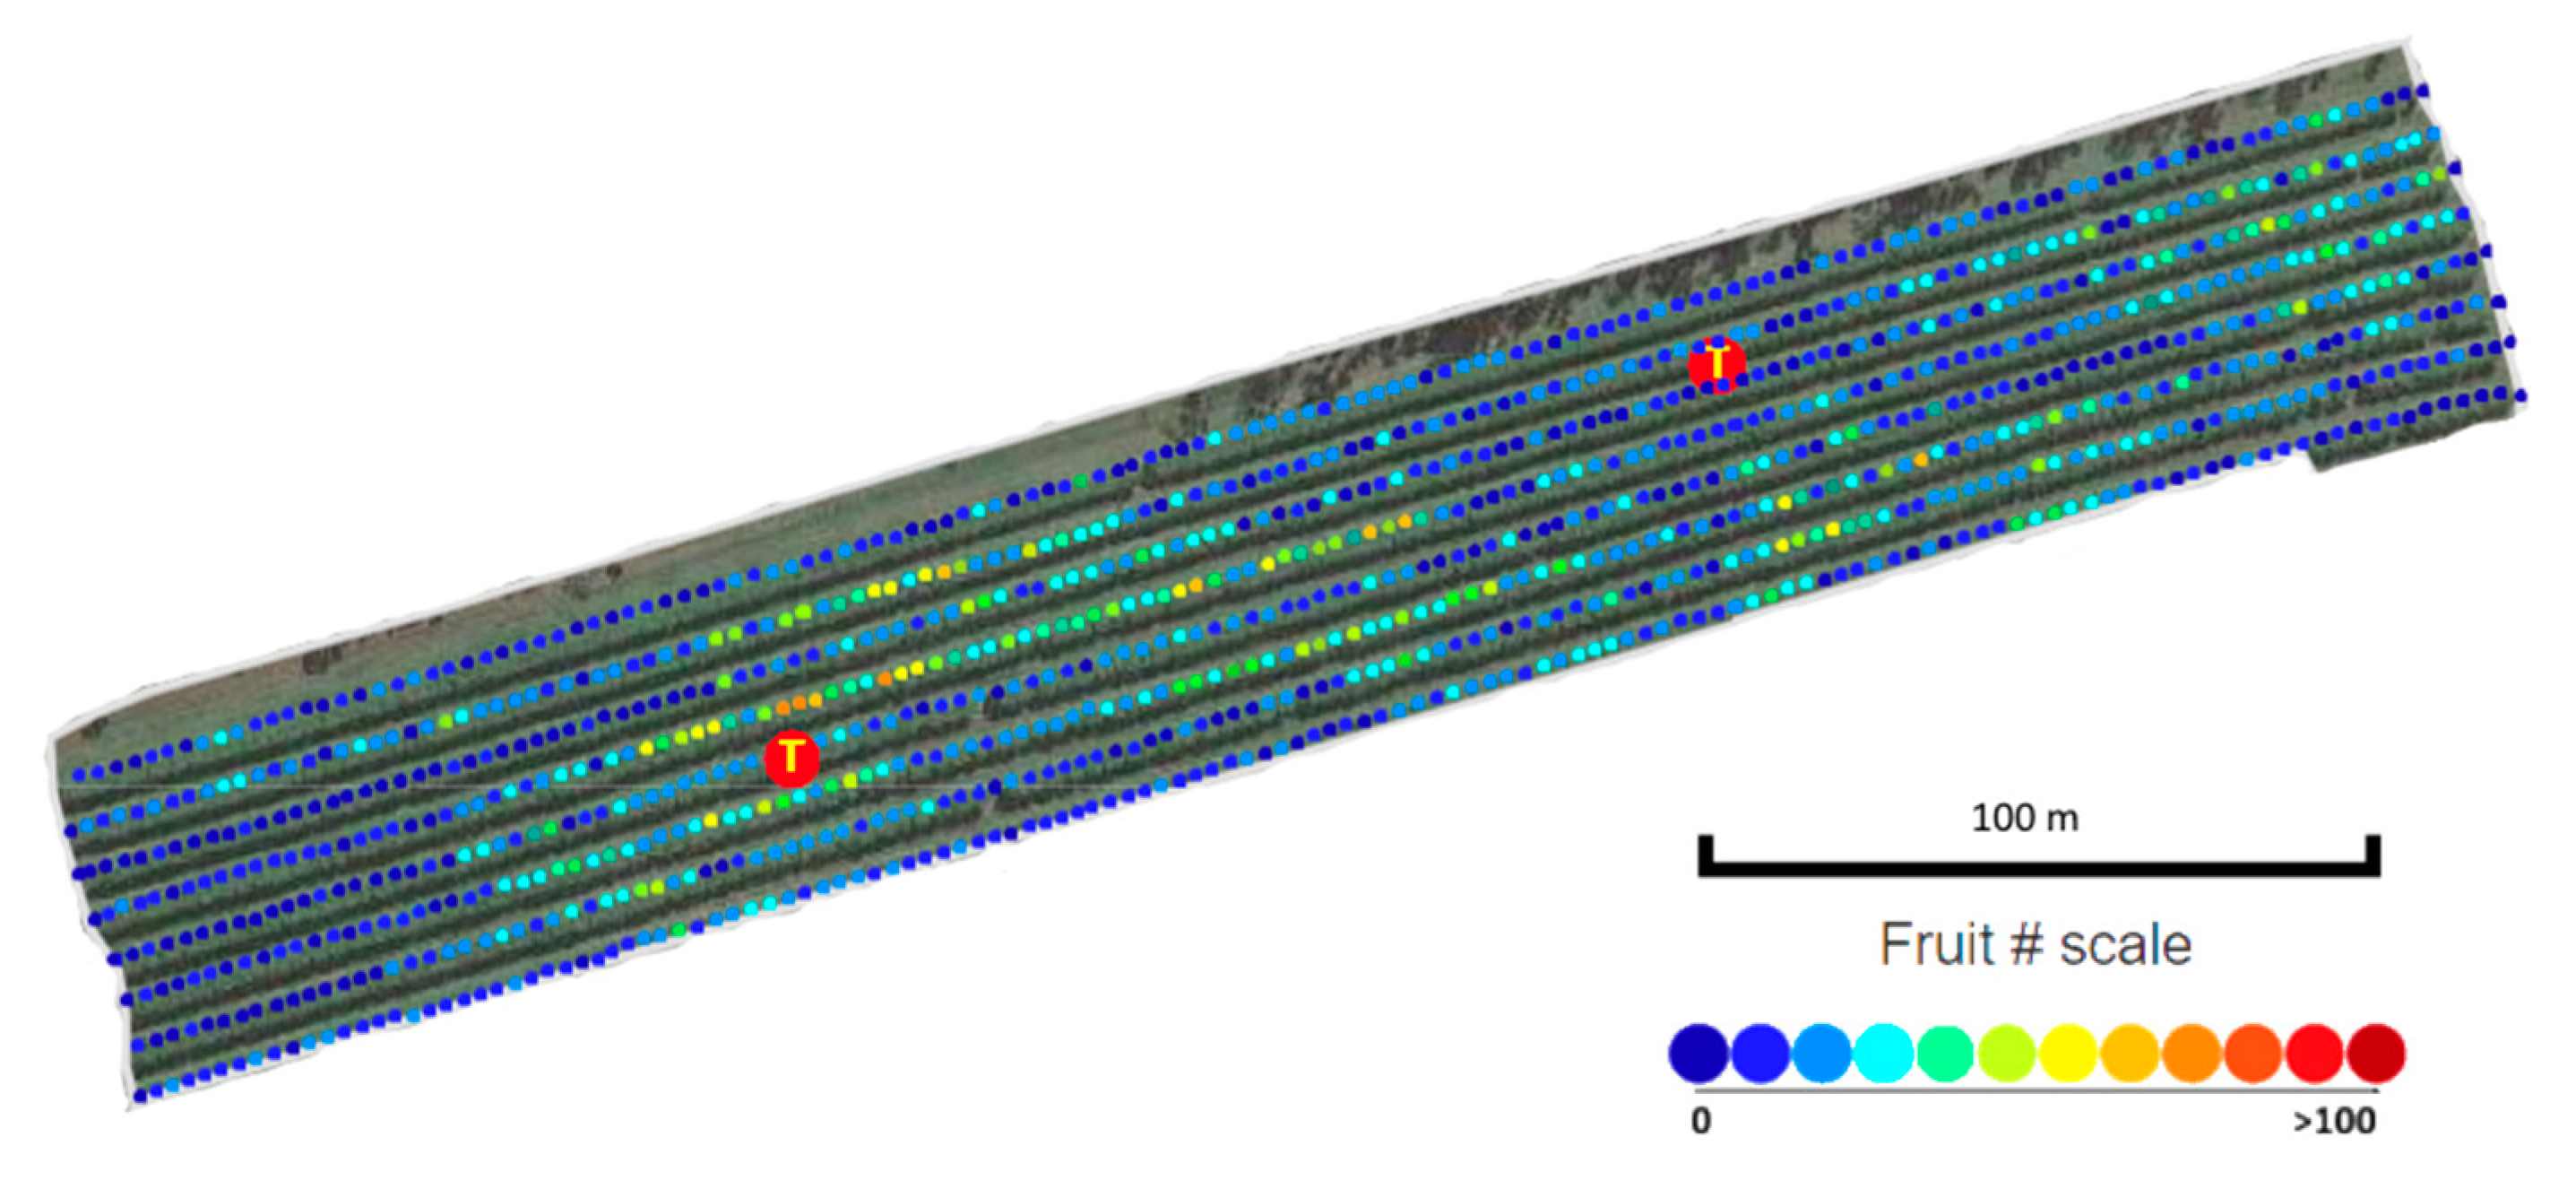
- An imaging event early in the fruit development period captured the location of early maturing fruit, associated with early flowering trees (Figure 9, bottom panel). This information was used by farm management to guide a selective early harvest event, responding to market demand.
4. Conclusions
Author Contributions
Funding
Acknowledgments
Conflicts of Interest
Appendix A
| Density | System | Cultivar | MV/Harvest | SD | n (Rows) |
|---|---|---|---|---|---|
| High | Hedge | 1243 | 1.32 | 0.22 | 8 |
| High | Hedge | Caly | 0.85 | 0.18 | 8 |
| High | Hedge | Keitt | 0.96 | 0.18 | 8 |
| High | Trellis | 1243 | 1.47 | 0.18 | 8 |
| High | Trellis | Caly | 1.16 | 0.11 | 9 |
| High | Trellis | Keitt | 1.21 | 0.29 | 10 |
| Medium | Single Leader | 1243 | 1.22 | 0.16 | 6 |
| Medium | Single Leader | Caly | 1.13 | 0.14 | 10 |
| Medium | Single Leader | Keitt | 0.87 | 0.15 | 10 |
| Medium | Conventional | 1243 | 1.22 | 0.23 | 7 |
| Medium | Conventional | Caly | 1.14 | 0.18 | 10 |
| Medium | Conventional | Keitt | 0.98 | 0.13 | 8 |
| Low | Conventional | 1243 | 0.99 | 0.17 | 6 |
| Low | Conventional | Caly | 1.15 | 0.14 | 9 |
| Low | Conventional | Keitt | 0.98 | 0.10 | 7 |
Appendix B
Appendix B.1. Variable Importance for the Ratio of Multi-View to Packhouse Count
Appendix B.1.1. Method
| Orchard # | Region | Cultivar | Tree Spacing (m) | Inter Row Spacing (m) | Tree Planting Date | Average Tree Crown Area (m2) | SD Tree Crown Area (m2) |
| 6 | NT | Caly | 3 | 8 | 2010 | 8.65 | 2.73 |
| 8 | NT | Caly | 3 | 8 | 2008 | 7.76 | 2.46 |
| 10 | NT | Caly | 3 | 8 | 2010 | 8.64 | 2.31 |
| 11 | NT | Caly | 3 | 8 | 2010 | 7.04 | 2.35 |
| 12 | NT | Caly | 3 | 8 | 2010 | 7.55 | 2.70 |
| 13 | NT | Caly | 3 | 8 | 2010 | 5.99 | 2.16 |
| 14 | NT | Caly | 4 | 9 | 2003 | 15.88 | 4.99 |
| 15 | NT | Caly | 3 | 8 | 2000 | 15.40 | 4.28 |
| 20 | NQLD | Caly | 4.5 | 8 | 2007 | 13.48 | 4.12 |
| 22 | NQLD | R2E2 | 5 | 8 | 2001 | 18.35 | 5.90 |
| 23 | NQLD | Keitt | 5 | 7.5 | 1996 | 9.46 | 3.46 |
| 28 | CQLD | HG | 3 | 7 | 2001 | - | - |
| 30 | CQLD | HG | 3.75 | 7 | 2013 | - | - |
| 31 | SQLD | Caly | 3.5 | 9.5 | 2014 | 3.94 | 2.13 |
| 33 | SQLD | Caly | 3.5 | 9.5 | 2014 | 4.98 | 3.16 |
| 35 | SQLD | Caly | 4 | 9 | 2004 | - | - |
| 36 | SQLD | Caly | 4 | 9 | 2004 | - | - |
| 37 | SQLD | Caly | 4 | 9 | 2004 | 19.77 | 6.87 |
| 38 | SQLD | HG | 4 | 8 | 2012 | 13.15 | 3.00 |
| Walkamin | NQLD | multiple | multiple | multiple | 2013 | - | - |
Appendix B.1.2. Results
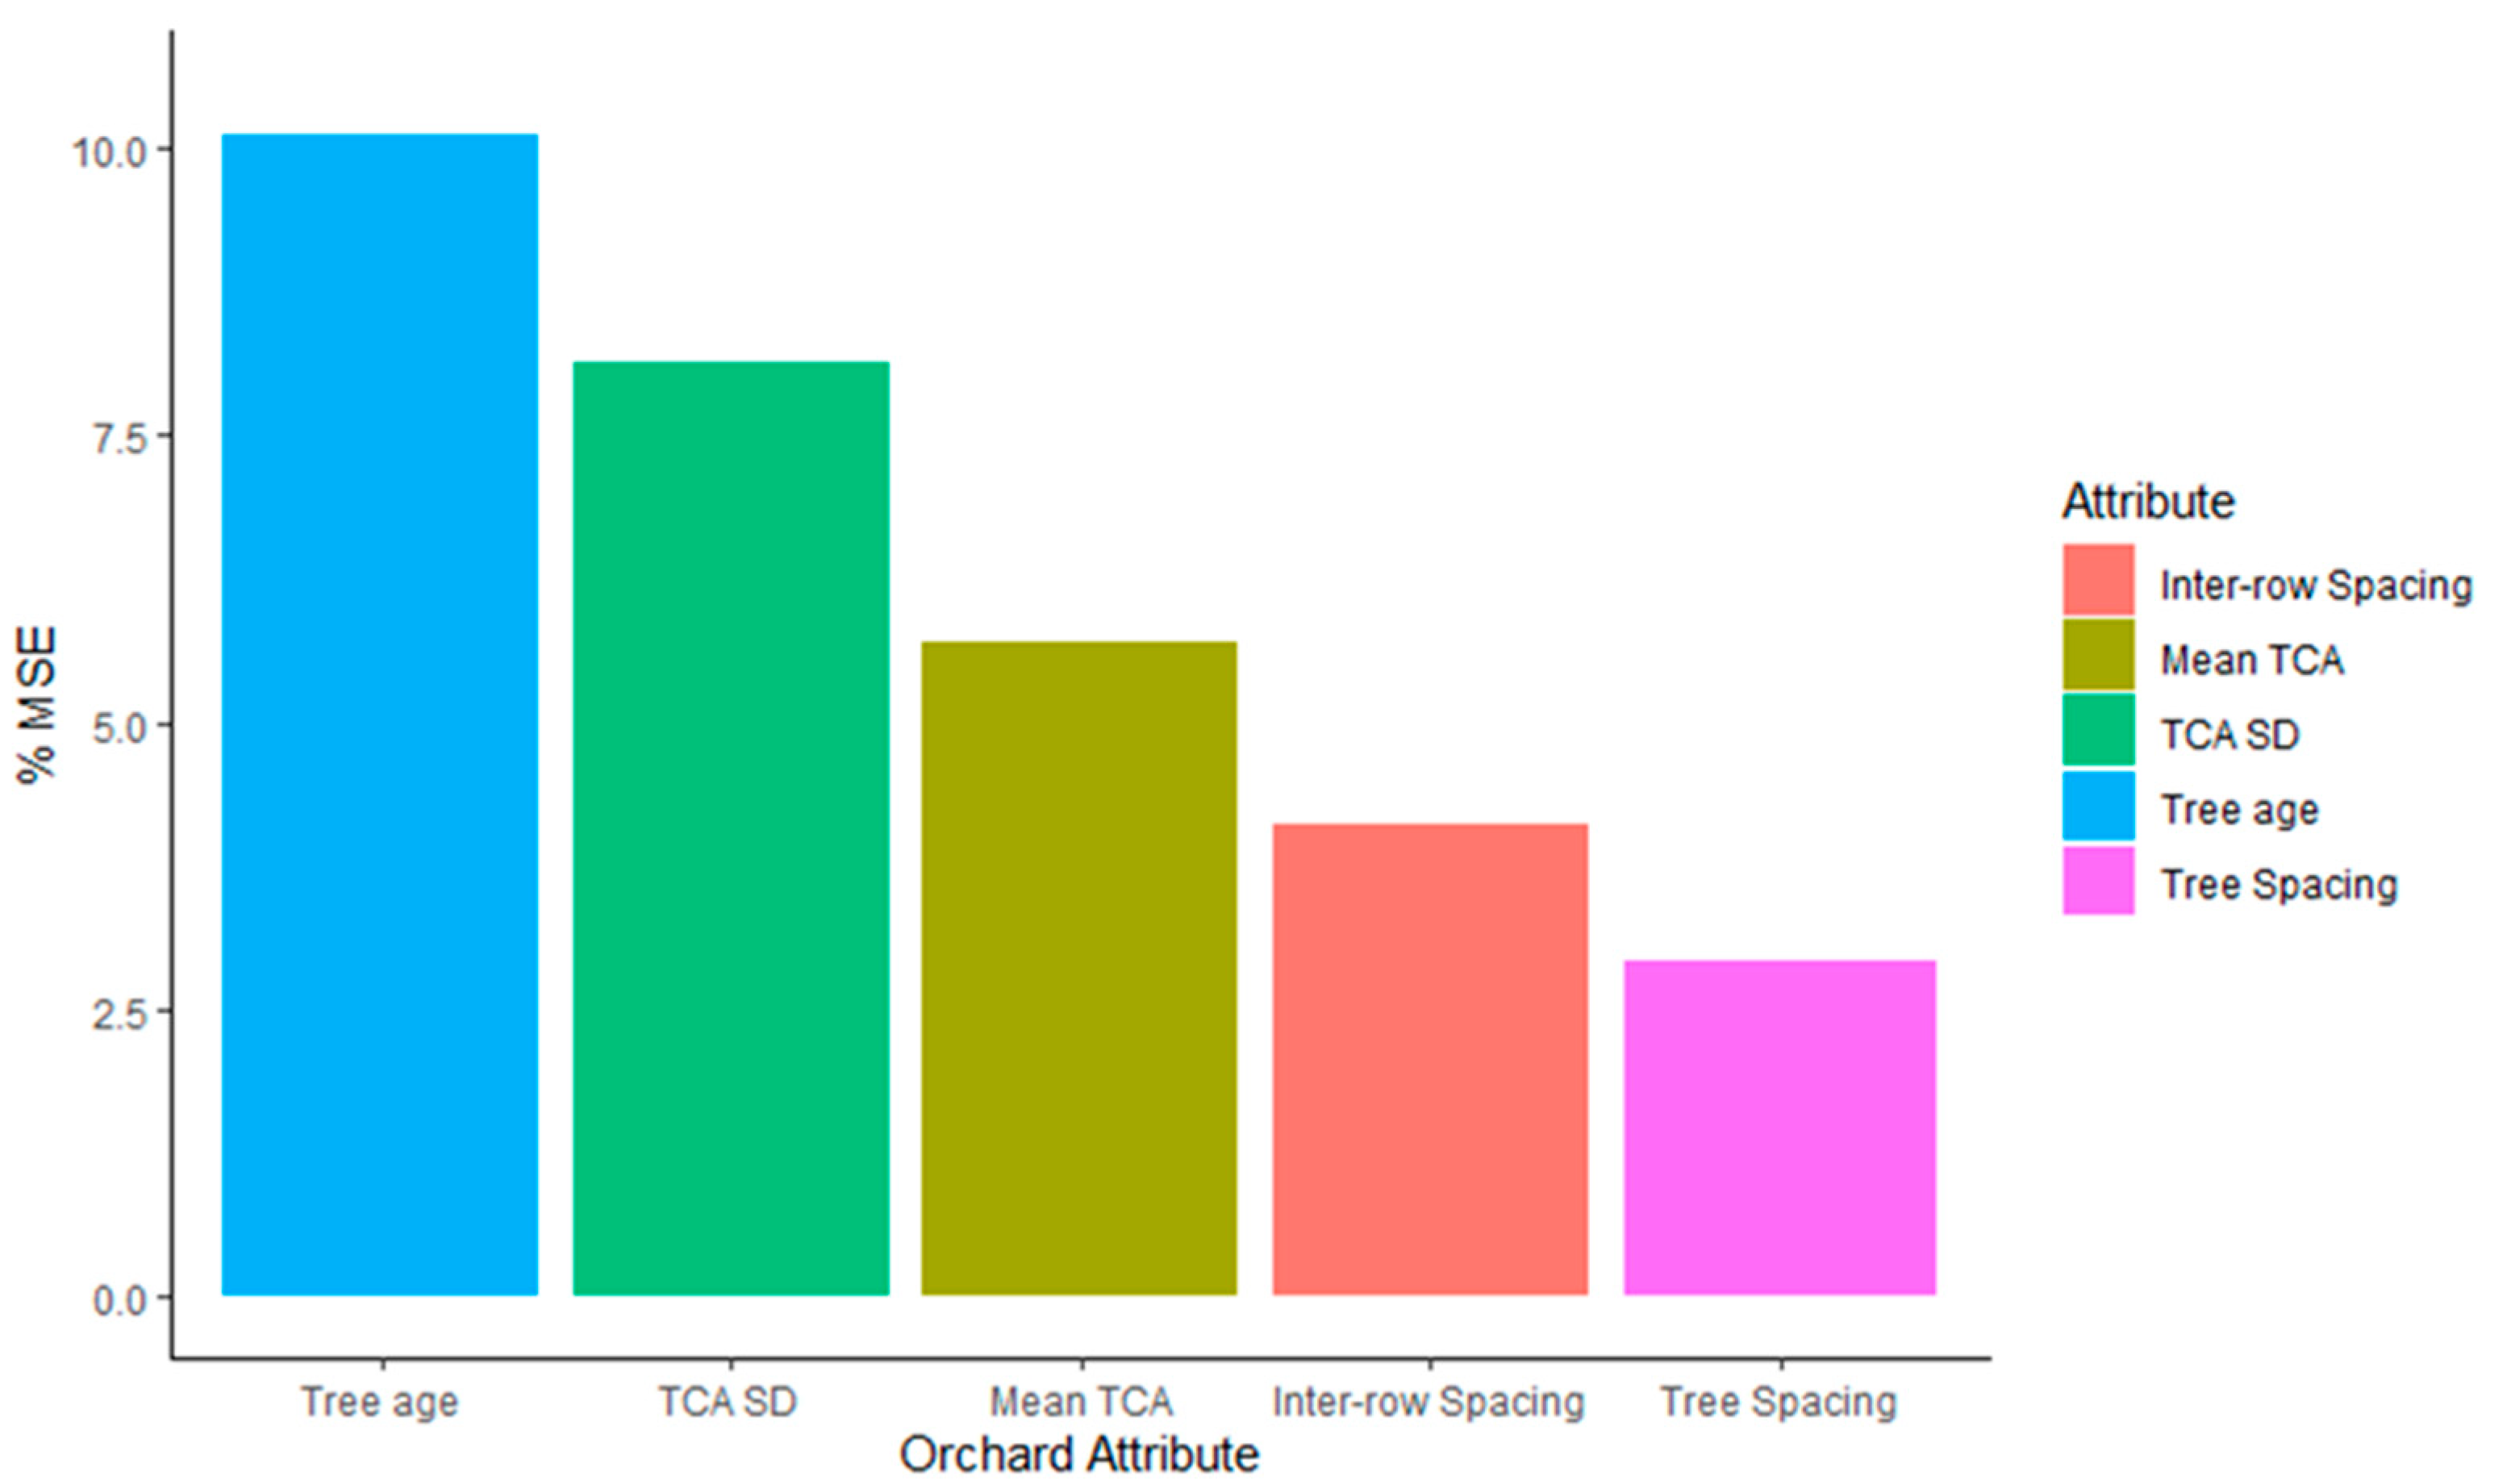
References
- Gongal, A.; Silwal, A.; Amatya, S.; Karkee, M.; Zhang, Q.; Lewis, K. Apple crop-load estimation with over-the-row machine vision system. Comput. Electron. Agric. 2015, 120, 26–35. [Google Scholar] [CrossRef]
- Stein, M.; Bargoti, S.; Underwood, J. Image based mango fruit detection, localisation and yield estimation using multiple view geometry. Sensors 2016, 16, 1915. [Google Scholar] [CrossRef] [PubMed]
- Linker, R. Machine learning based analysis of night-time images for yield prediction in apple orchard. Biosyst. Eng. 2018, 167, 114–125. [Google Scholar] [CrossRef]
- Koirala, A.; Walsh, K.; Wang, Z.; McCarthy, C. Deep learning for real-time fruit detection and orchard fruit load estimation: Benchmarking of ‘MangoYOLO’. Precis. Agric. 2019, 20, 1107–1135. [Google Scholar] [CrossRef]
- Anderson, N.; Walsh, K.; Wulfsohn, D. Technologies for forecasting tree fruit load and harvest timing—from ground, sky and time. Agronomy 2021, 11, 1409. [Google Scholar] [CrossRef]
- Koirala, A.; Walsh, K.B.; Wang, Z.; McCarthy, C. Deep learning—Method overview and review of use for fruit detection and yield estimation. Comput. Electron. Agric. 2019, 162, 219–234. [Google Scholar] [CrossRef]
- Payne, A.; Walsh, K.; Subedi, P.; Jarvis, D. Estimating mango crop yield using image analysis using fruit at ‘stone hardening’ stage and night time imaging. Comput. Electron. Agric. 2014, 100, 160–167. [Google Scholar] [CrossRef]
- Gutiérrez, S.; Wendel, A.; Underwood, J. Ground based hyperspectral imaging for extensive mango yield estimation. Comput. Electron. Agric. 2018, 157, 126–135. [Google Scholar] [CrossRef]
- Wang, Z.; Walsh, K.; Koirala, A. Mango fruit load estimation using a video based MangoYOLO—Kalman filter—Hungarian algorithm method. Sensors 2019, 19, 2742. [Google Scholar] [CrossRef] [PubMed] [Green Version]
- Mekhalfi, M.L.; Nicolò, C.; Ianniello, I.; Calamita, F.; Goller, R.; Barazzuol, M.; Melgani, F. Vision system for automatic on-tree kiwifruit counting and yield estimation. Sensors 2020, 20, 4214. [Google Scholar] [CrossRef] [PubMed]
- Sarron, J.; Malézieux, É.; Sané, C.A.B.; Faye, E. Mango yield mapping at the orchard scale based on tree structure and land cover assessed by UAV. Remote Sens. 2018, 10, 1900. [Google Scholar] [CrossRef] [Green Version]
- Anderson, N.T.; Underwood, J.; Rahman, M.M.; Robson, A.; Walsh, K. Estimation of fruit load in mango orchards: Tree sampling considerations and use of machine vision and satellite imagery. Precis. Agric. 2018, 20, 823–839. [Google Scholar] [CrossRef]
- Underwood, J.; Rahman, M.; Robson, A.; Walsh, K.; Koirala, A.; Wang, Z. Fruit load estimation in mango orchards—A method comparison. In Proceedings of the ICRA 2018 Workshop on Robotic Vision and Action in Agriculture, Brisbane, QLD, Australia, 21–25 May 2018; pp. 1–6. [Google Scholar]
- Ibell, P.; Kolala, R.; Wright, C.; Wilkie, J.; Bally, I. The effects of alternative training and planting systems on light relations in mango (Mangifera indica) orchards in Far North Queensland. Acta Hortic. 2018, 67–76. [Google Scholar] [CrossRef]
- Rahman, M.M.; Robson, A.; Bristow, M. Exploring the potential of high resolution WorldView-3 imagery for estimating yield ofmMango. Remote Sens. 2018, 10, 1866. [Google Scholar] [CrossRef] [Green Version]
- Koirala, A.; Walsh, K.; Wang, Z. Attempting to estimate the unseen—correction for occluded fruit in tree fruit load estimation by machine vision with deep learning. Agronomy 2021, 11, 347. [Google Scholar] [CrossRef]
- de Mendiburu, F. ‘Agricolae’: Statistical Procedures for Agricultural Research. 1.3-3, R Package. 2020. Available online: https://CRAN.R-project.org/package=agricolae (accessed on 15 January 2021).
- Wulfsohn, D. Sampling techniques for plants and soil. In Advanced Engineering Systems for Specialty Crops: A Review of Precision Agriculture for Water, Chemical, and Nutrient Application, and Yield Monitoring; Johann Heinrich von Thünen-Institut: Braunschweig, Germany, 2010; pp. 3–30. [Google Scholar]
- Johansen, K.; Raharjo, T.; McCabe, M.F. Using multi-spectral UAV imagery to extract tree crop structural properties and assess pruning effects. Remote Sens. 2018, 10, 854. [Google Scholar] [CrossRef] [Green Version]
- Tu, Y.-H.; Johansen, K.; Phinn, S.; Robson, A. Measuring canopy structure and condition using multi-spectral UAS imagery in a horticultural environment. Remote Sens. 2019, 11, 269. [Google Scholar] [CrossRef] [Green Version]
- Blaschke, T. Object based image analysis for remote sensing. ISPRS J. Photogramm. Remote. Sens. 2010, 65, 2–16. [Google Scholar] [CrossRef] [Green Version]





| Orchard | 8 | 23 | 28 | 31 | 38 |
| Region | NT | NQLD | CQLD | SQLD | SQLD |
| Cultivar | Caly | Keitt | HG | Caly | HG |
| # rows | 18 | 24 | 8 | 20 | 36 |
| # trees | 3474 | 1406 | 2128 | 4650 | 3068 |
| Mean (fruit #/tree side) | 41.8 | 50 | 29.6 | 45.7 | 36.8 |
| SD (fruit #/tree side) | 13.9 | 21.9 | 11.8 | 17.8 | 15.7 |
| SD of row average (fruit #/tree side) | 2.3 | 8.9 | 3.4 | 3.9 | 6.8 |
| # rows > ±10% of orchard fruit #/tree side | 0 | 13 | 3 | 1 | 25 |
| Row sampling interval | # estimates > ±10% of row mean (fruit #/tree side) | ||||
| every second row | 0 | 0 | 0 | 0 | 0 |
| every third row | 0 | 0 | 0 | 0 | 0 |
| every fourth row | 0 | 0 | 0 | 0 | 0 |
| every fifth row | 0 | 0 | 0 | 0 | 0 |
| every sixth row | 0 | 1 | 0 | 0 | 0 |
| every seventh row | 0 | 0 | 2 | 0 | 0 |
| every eighth row | 0 | 2 | 2 | 0 | 0 |
| every ninth row | 0 | 2 | 3 | 0 | 0 |
| # fruit/tree side | |||||
| Sampling every 6th row, given start row: | |||||
| 1 | 42.1 | 49.8 | 28.3 | 44.7 | 34.3 |
| 2 | 42.6 | 46.1 | 27.0 | 46.3 | 37.3 |
| 3 | 40.4 | 48.0 | 32.5 | 44.1 | 39.2 |
| 4 | 40.5 | 50.8 | 30.1 | 46.6 | 39.0 |
| 5 | 42.6 | 55.9 * | 32.0 | 47.7 | 37.4 |
| 6 | 42.7 | 52.3 | 28.6 | 45.3 | 33.4 |
| 2019–2020 | ||||||
| Zone | Orchard | Packhouse (#Fruit) | FARM (%) | CAL (%) | MV-Raw (%) | MV-CAL (%) |
| 1 | 1 * | 188,296 | 35 | 20 | ||
| 1 | 2 * | 173,303 | 30 | 9 | ||
| 1 | 3 * | 83,660 | 23 | 4 | ||
| 1 | 4 * | 52,651 | 8 | 23 | ||
| 2 | 5 * | 277,982 | 26 | 16 | ||
| 2 | 6 * | 308,838 | 24 | 16 | 6 | 8 |
| 2 | 7 * | 162,579 | 57 | 19 | ||
| 3 | 8 * | 172,059 | 14 | 28 | 16 | 1 |
| 3 | 9 * | 640,277 | 8 | 4 | ||
| 4 | 10 * | 242,197 | 14 | 6 | 5 | 20 |
| 4 | 11* | 326,706 | 38 | 1 | 1 | 20 |
| 4 | 12* | 326,426 | 40 | 10 | 3 | 16 |
| 4 | 13 * | 120,424 | 36 | 12 | 5 | 20 |
| 14 * | 494,141 | 9 | 7 | 5 | 8 | |
| 5 | 15 * | 499,587 | 27 | 12 | 34 | 30 |
| 5 | 16 * | 241,627 | 19 | 18 | ||
| 18 * | 1,911,894 | 11 | 2 | |||
| 19 * | 352,368 | 46 | 81 | |||
| 20 * | 1,640,236 | 29 | 21 | 25 | 29 | |
| 21 * | 919,219 | 39 | 2 | |||
| 22 * | 43,888 | 23 | 9 | 26 | ||
| 23 * | 71,596 | 42 | 2 | 5 | ||
| 24 | 190,966 | 28 | ||||
| 25 | 60,416 | 17 | ||||
| 26 | 87,750 | 28 | ||||
| 27 | 252,870 | 1 | ||||
| 28 * | 68,572 | 5 | 19 | 5 | ||
| 30 * | 97,480 | 8 | 53 | |||
| 31 | 194,511 | 26 | 9 | 13 | ||
| 32 | 149,145 | 10 | ||||
| 33 | 151,740 | 9 | 18 | 6 | ||
| 34 | 233,546 | 26 | ||||
| 35 * | 84,635 | 10 | 9 | 15 | ||
| 36 * | 101,766 | 34 | 10 | 15 | ||
| 37 * | 264,801 | 32 | 10 | 14 | ||
| 38 * | 104,642 | 26 | 8 | 8 | ||
| Walkamin | 87,240 | 8 | ||||
| AVG | 26.7 | 17.9 | 10.5 | 16.4 | ||
| STD | 13.7 | 15.2 | 8.2 | 12.1 | ||
| AVG (9 orchards) | 25.7a | 12.6ab | 11.1b | 16.9ab | ||
| STD (9 orchards) | 11.3 | 8.2 | 11.4 | 9.7 | ||
| 2020–2021 | ||||||
| Zone | Orchard | Packhouse (#Fruit) | FARM (%) | CAL (%) | MV-Raw (%) | MV-CAL (%) |
| 1–16 * | 3,039,052 | 35 | 17 | 32 | 9 | |
| 18 * | 1,814,684 | 23 | 22 | 20 | 23 | |
| 19 * | 1,533,868 | 14 | 10 | 24 | 19 | |
| 20 * | 1,263,408 | 22 | 25 | 36 | 23 | |
| 21 * | 1,206,123 | 35 | 24 | 26 | 13 | |
| 24 | 23,807 | 41 | 41 | 76 | ||
| 28 * | 80,333 | 7 | ||||
| 30.1 * | 76,531 | 12 | ||||
| 30.2 * | 59,461 | 19 | ||||
| 31 | 186,234 | 2 | ||||
| 32 | 142,798 | 31 | 1 | |||
| 33 | 223,608 | 8 | ||||
| 34 | 223,608 | 17 | ||||
| 35–36 | 191,902 | 46 | 27 | |||
| 37 | 91,998 | 41 | 5 | |||
| 38 | 89,389 | 27 | 10 | |||
| 40–41 | 589,800 | 2 | 7 | 4 | ||
| 42 | 2,052,195 | 17 | 17 | |||
| 43 | 199,656 | 28 | 3 | 3 | 6 | |
| AVG | 27 | 23 | 17 | 22 | ||
| STD | 10 | 14 | 12 | 23 | ||
| AVG (6 orchards) | 26.2a | 16.8a | 23.5a | 15.5a | ||
| STD (6 orchards) | 8.2 | 8.8 | 11.6 | 7.3 |
Publisher’s Note: MDPI stays neutral with regard to jurisdictional claims in published maps and institutional affiliations. |
© 2021 by the authors. Licensee MDPI, Basel, Switzerland. This article is an open access article distributed under the terms and conditions of the Creative Commons Attribution (CC BY) license (https://creativecommons.org/licenses/by/4.0/).
Share and Cite
Anderson, N.T.; Walsh, K.B.; Koirala, A.; Wang, Z.; Amaral, M.H.; Dickinson, G.R.; Sinha, P.; Robson, A.J. Estimation of Fruit Load in Australian Mango Orchards Using Machine Vision. Agronomy 2021, 11, 1711. https://doi.org/10.3390/agronomy11091711
Anderson NT, Walsh KB, Koirala A, Wang Z, Amaral MH, Dickinson GR, Sinha P, Robson AJ. Estimation of Fruit Load in Australian Mango Orchards Using Machine Vision. Agronomy. 2021; 11(9):1711. https://doi.org/10.3390/agronomy11091711
Chicago/Turabian StyleAnderson, Nicholas Todd, Kerry Brian Walsh, Anand Koirala, Zhenglin Wang, Marcelo Henrique Amaral, Geoff Robert Dickinson, Priyakant Sinha, and Andrew James Robson. 2021. "Estimation of Fruit Load in Australian Mango Orchards Using Machine Vision" Agronomy 11, no. 9: 1711. https://doi.org/10.3390/agronomy11091711
APA StyleAnderson, N. T., Walsh, K. B., Koirala, A., Wang, Z., Amaral, M. H., Dickinson, G. R., Sinha, P., & Robson, A. J. (2021). Estimation of Fruit Load in Australian Mango Orchards Using Machine Vision. Agronomy, 11(9), 1711. https://doi.org/10.3390/agronomy11091711


