Article

Physical, Nutritional and Functional Properties of Walnuts Genotypes (Juglans regia L.) from Romania

1
Faculty of Horticulture and Forestry, Banat’s University of Agricultural Sciences and Veterinary Medicine, “King Michael I of Romania” from Timisoara, Calea Aradului 119, RO-300645 Timișoara, Romania
2
Faculty of Agriculture, Banat’s University of Agricultural Sciences and Veterinary Medicine, “King Michael I of Romania” from Timisoara, Calea Aradului 119, RO-300645 Timișoara, Romania
3
Faculty of Food Engineering, Banat’s University of Agricultural Sciences and Veterinary Medicine, “King Michael I of Romania” from Timisoara, Calea Aradului 119, RO-300645 Timișoara, Romania
*
Authors to whom correspondence should be addressed.
Agronomy 2021, 11(6), 1092; https://doi.org/10.3390/agronomy11061092
Submission received: 19 April 2021 / Revised: 24 May 2021 / Accepted: 24 May 2021 / Published: 28 May 2021
(This article belongs to the Special Issue Agricultural Products: Nutritional Value and Functional Properties)

Abstract

:
Walnut (Juglans regia L.) is the oldest fruit grown in the world and grows spontaneously almost throughout Romania. In this study, the physical properties and chemical composition of twenty types of walnuts from three different locations in Romania were studied. The physical analyzes that were performed were: walnut dimensions and shape properties (nut diameter, nut length, nut shape and nut size), fruit properties (walnut weight, walnut kernel weight and percentage of kernel) and external properties of walnut (walnut kernel extraction, kernel color and shell roughness). The proximate chemical composition (content of water, ash, lipids, proteins and carbohydrates) was determined by standardized AOAC methods, while fatty compounds were determined by GSMS. Water content ranged from 1.23% to 5.00%, mineral content between 1.31% and 2.49%, lipids content between 56.09% and 66.56% and protein content ranged between 12.73% and 20.413%. Based on these, the carbohydrate content and nutritional value of the 20 walnut samples were calculated. In all samples, saturated palmitic acid (C16:0) and stearic acid (C18:0) as well as unsaturated oleic (C18:1), linoleic (C18:2) and linolenic (C18:3) fatty acids were determined. A statistical analysis was also performed correlating the results obtained from the chemical analyzes of the walnuts.

1. Introduction

Native to Central Asia (Iran, Afghanistan and Turkey), as well as from some countries of the Balkan Peninsula, the walnut tree (Juglans regia L.) is one of the most important fruit species grown worldwide, both for fruit production and for the exceptional quality of the wood.
Walnut kernel is one of the most concentrated foods with a high energy value (630 kcal/100 g). It has a high content of nutrients such as: fats 52.0–77.5%; protein 11.0–25.0%; carbohydrates 5.0–24.0%; mineral substances 1.3–2.5% (phosphorus 500 mg/100 g; potassium 600 mg/100 g and traces of sulphur); microelements (Ca, Mg, Fe, Cu, Zn and I), as well as vitamins: E (46.0 mg/100 g), C (30–55 mg/100 g), B1 (0.34–0.8) mg/100 g) and lower amounts of vitamins B2, A and PP [1,2,3,4].
Hayes et al. [5] consider that the consumption of walnut kernel brings many benefits for human health, such as: reducing the risk of cardiovascular disease and coronary heart disease, treating type II diabetes, preventing and treating certain types of cancer, reducing the symptoms attributed to aging and certain neurological disorders. Another study finds that the numerous phytochemicals present in walnuts, including large amounts of polyunsaturated fatty acids, offer potential benefits for brain health [6]. Furthermore, the benefits of walnut kernel consumption in the prevention of hypercholesterolemia have been studied [4].
A lot of walnut genotypes were studied in relation to soil and climatic conditions and fruit quality [7]. In the context of climate change, only valuable genotypes that have good adaptability to soil and climatic conditions, which succeed in exploiting their productive potential regardless of the changes of environmental factors. The quality of the walnut kernel is genotype dependent, but it is influenced both by the cultivation area, as well as by ecological and technological factors [8,9,10].
In Romania, the walnut occupies an extensive area of cultivation, from the Black Sea to altitudes of 700–800 m, but being more frequent in the area of semi-high hills at 250–400 m altitude. Walnut culture in villages or their proximity is widespread throughout the country. Until the First World War, walnut ranked third, after plum and apple, in terms of the number of trees grown, the yields obtained and the importance in the country’s economy [11]. Nowadays, although there are walnut orchards in areas favorable to their cultivation, most walnuts trees in Romania are still found through vineyards, old orchards, road alignments and village fencing, which makes it difficult to maintain trees but also to obtain a large fruit crop. Many Romanian researchers consider that the important phenological and tree characteristics were found in the native trees that have seedlings origin [11,12,13,14].
In this regard, the investigation was performed to determine the physico-chemical parameters related to both the quality of the fruits and the nutritional value of the nuts for several genotypes grown in western and north-western part of Romania. This study represents a first evaluation of domestic walnut genotypes grown in western and nort-western Romania, in terms of their physico-chemical composition. Moreover, the results obtained can be a useful database for highlighting the local features of walnut varieties for processors around the world.

2. Materials and Methods
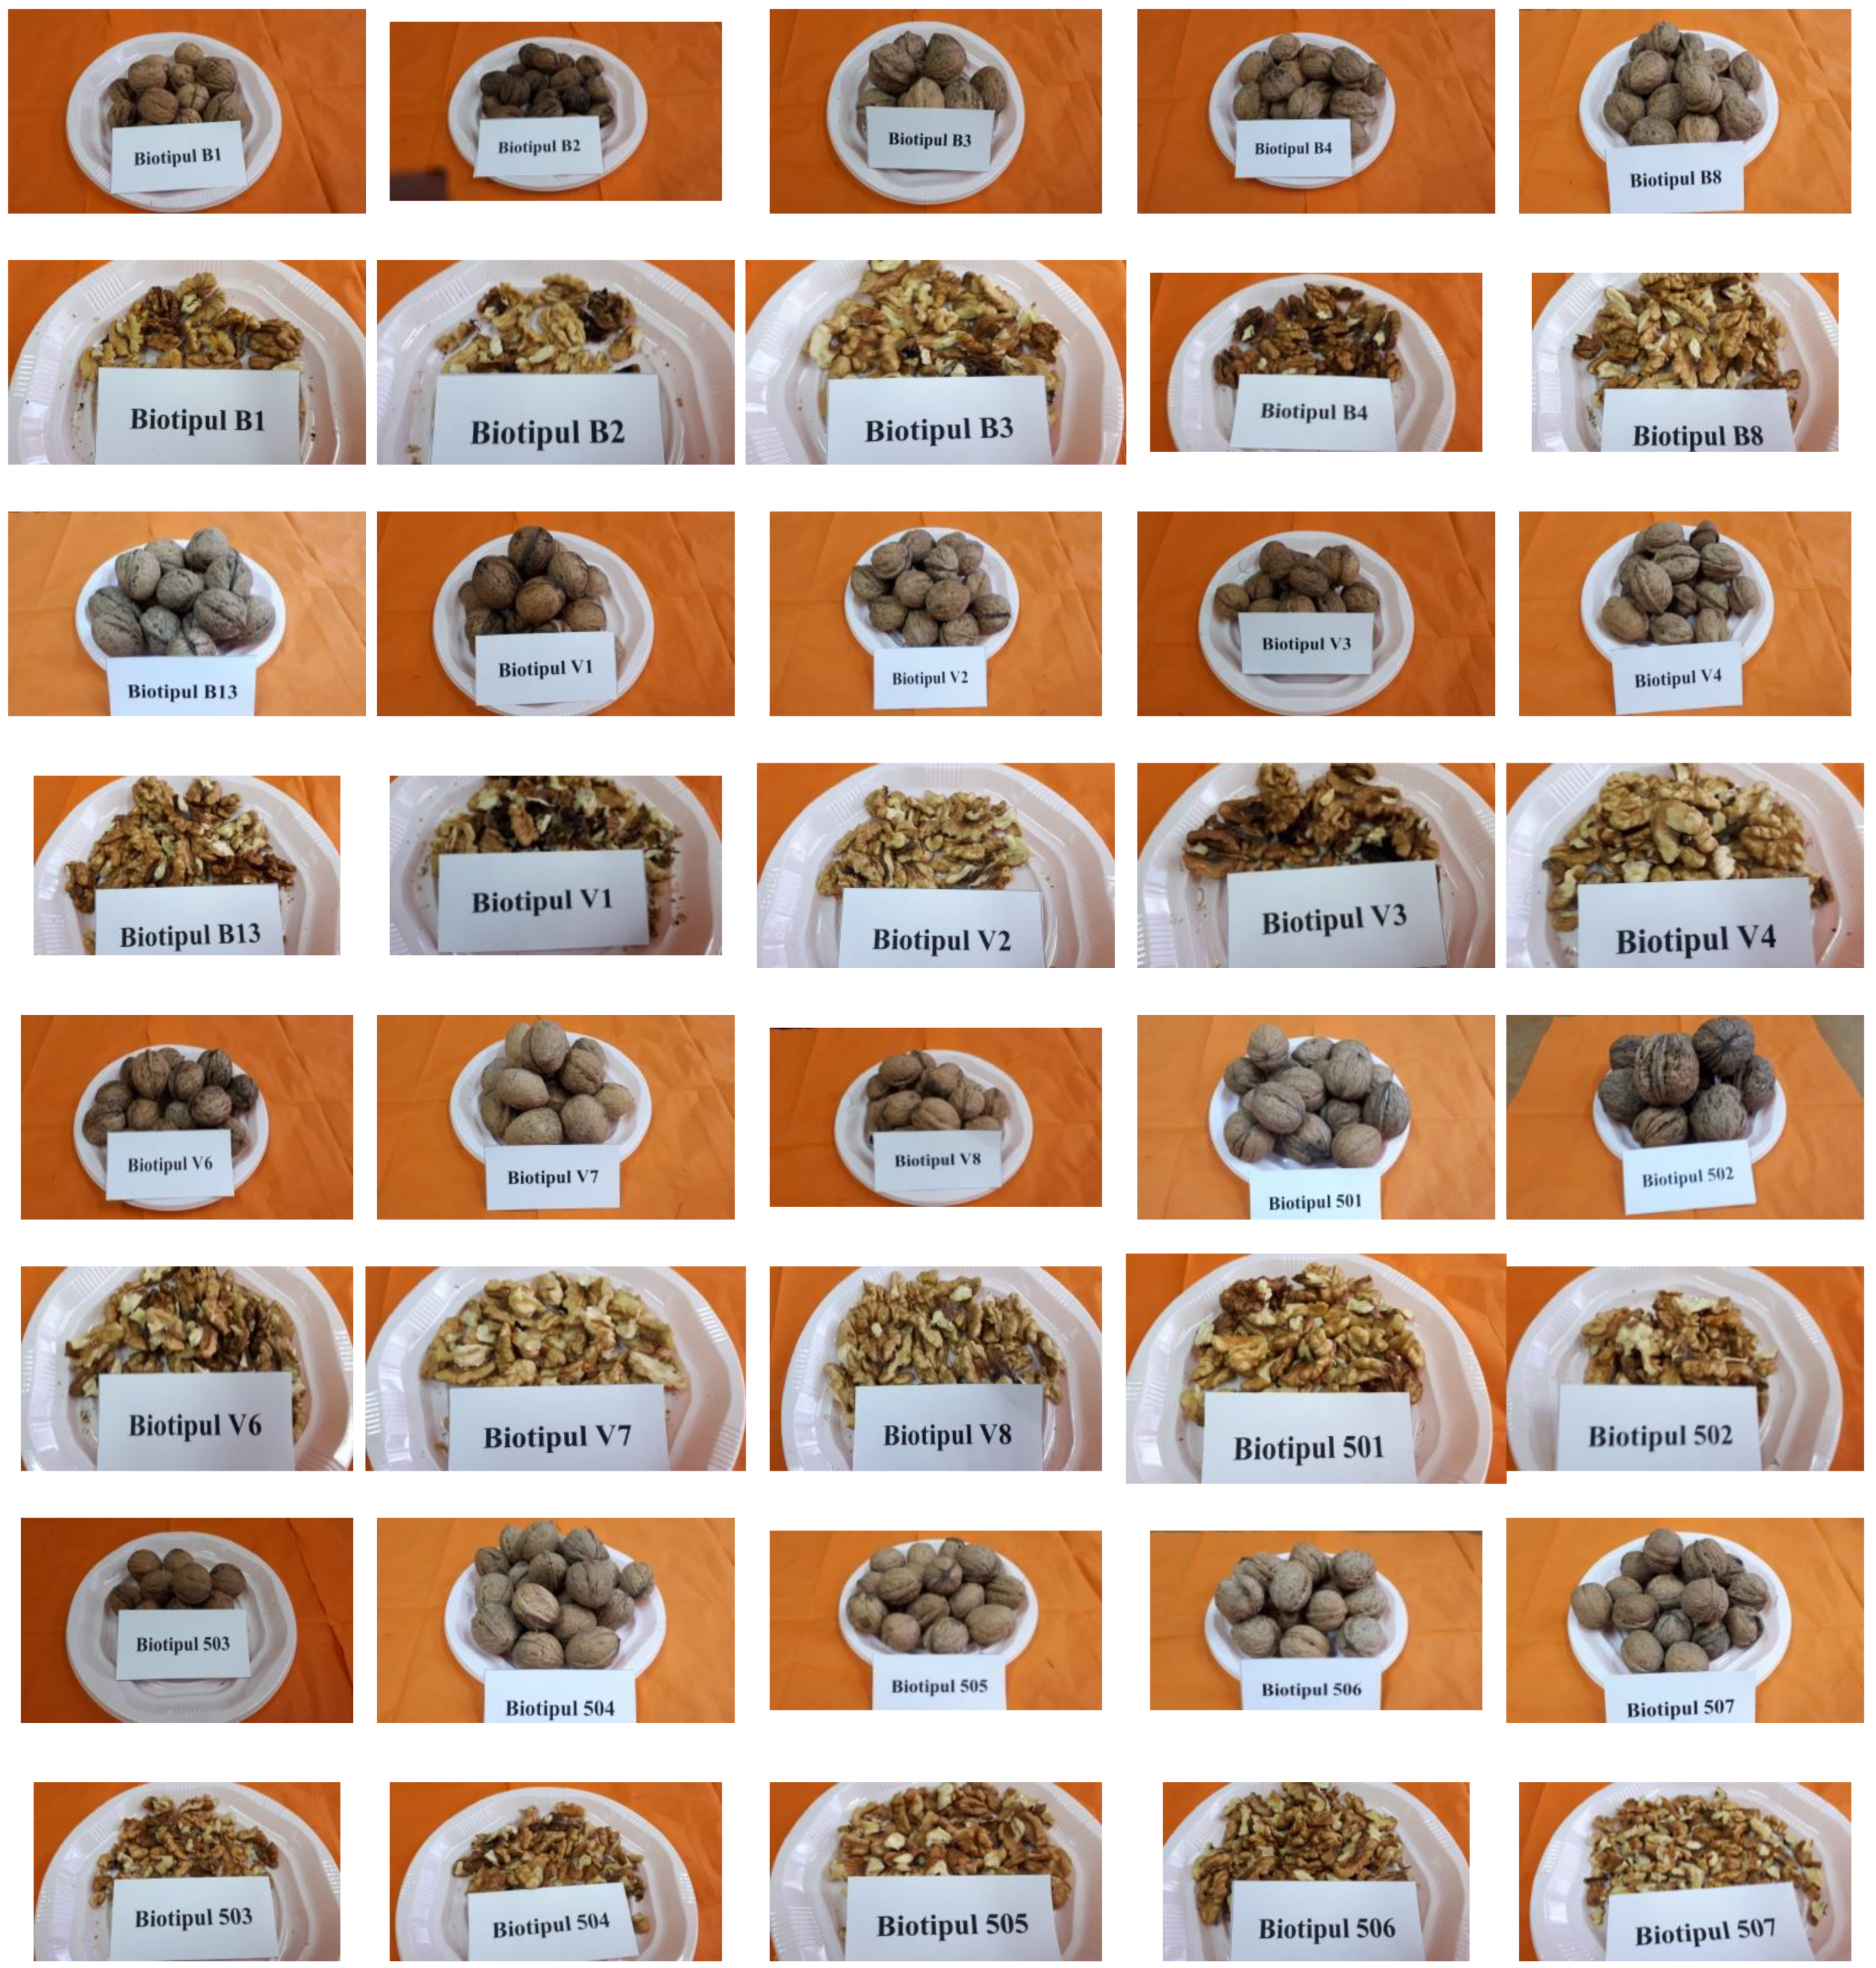
2.1. Plant Material

The biological material was collected from three different locations: two located in the area of Somcuța Mare in Maramureș County, namely Buciumi (47°28′3″ N, 23°29′21″ E) and Vălenii Șomcuței (47°28′22″ N, 23°27′4″ E), and the third location was the neighboring area of Timișoara city, Timiș county (45°47′58″ N, 21°17′38″ E).
The genotypes identified in the Buciumi area were coded: B1, B2, B3, B4, B8 and B13; those from Valea Somcutei area: V1, V2, V3, V4, V6, V7 and V8 and those from Timisoara: T501, T502, T503, T504, T505, T506 and T507 (Figure 1).
In both the Maramures and Timis areas, the walnut finds optimum conditions for growth and fruiting. Moreover, both regions of Romania having a rich germplasm for walnut species. For this reason, valuable genotypes need to be identified, collected and sampled, as they can be the main material for breeding and creating new varieties.
For all determination the control sample was the average of all determinations.

2.2. Physical Analysis

The following physical properties of the walnut were studied: in-shell walnut dimensions and shape properties (walnut diameter, walnut length and walnut size), fruit properties (weight of whole walnut, weight of walnut kernel and percentage of walnut kernel) and external properties of walnut kernel (release of the kernel, extraction of the kernel, color of the kernel and shell roughness) [15].
The physical walnut properties were tested according to the classification proposed by Cosmulescu and Baciu [16]. Index size is given by the average of the three fruit dimensions: big diameter, small diameter and length of fruit (Im = D + d + H/3) [16]. Shape index was calculated with the formula: H×00/(D + d/2). This index was evaluated as follows: shape index <110 –fruit is spherical, shape between 111–125 fruit is oval and shape index ≥125 fruit is elongated [16]. The weight of walnut and of the kernel was determined by weighing, using the electronic scales. 30 fruits were weighed from each genotype.
Kernel percentage (%) was determined by calculation: (kernel weight/nut weight) × 100. The kernel colors were determined as light (golden), medium (dark gold) and dark (brown) and shell roughness were determined as smooth, medium and rough [17].

2.3. Chemical Analysis

2.3.1. Proximate Composition

The proximate composition of the walnut kernel (moisture, protein content, lipids and ash) was made using standardized methods for moisture (ISO 665:2020), protein (ISO 16634-1:2008), lipids (ISO 22630:2015) and ash (ISO 749:1977) [18]. Carbohydrate content was estimated by difference of other components. Energy values were calculated from the data on protein, carbohydrates and fats by means of factors of 4, 4 and 9 kcal/g, respectively [19].

2.3.2. Composition of Fatty Acids

Fatty acids from total lipids extracted from walnuts were analyzed as fatty acid methyl esters (FAME), after derivatizing the fatty acids contained in 0.1 g lipids with 3 mL of 3% boron trifluoride 20%. The derivatization was performed for 1 h at 80 degrees in an ultrasonic bath. After cooling, 2.5 mL of 10% NaCl solution was added, and FAME was extracted in 2 mL of hexane. The organic layer was separated by centrifugation at 3000 rpm for 15 min. The FAMEs were analyzed using Shimadzu GCMS-QP2010PLUS (Kyoto Japan) equipment and an AT-WAX column (30 m, 0.32 mm i.d., 1 µm thick). The temperature program was initially isothermal: 140 °C for 10 min, then the temperature was raised by 7 °C/min up to 250 °C, this temperature being maintained for 10 min. (tot 128 run: 35.71 min.). The partition ratio was 1:10, and the injection port temperature was set at 250 °C. The source temperature was 210 °C and ionic interface temperature was 255 °C. For FAME determination hexane was used as a solvent, and helium was used as a carrier gas with a flow rate of 1.00 mL/min and a linear velocity of 37.8 cm/s. FAME peaks were identified using NIST05 library and quantified by area normalization method. The percentage of various lipid compounds was determined by reporting the peak area corresponding to a specific compound to the total peak area (for all identified components).
The program used to separate the volatile compounds was: maintaining the temperature of 40 °C for 1 min, increasing the temperature at a rate of 5 °C/min up to 210 °C, this temperature was maintained for 5 min. The injection source and ion source temperatures were 250 °C and 220 °C, respectively. The injection volume was 1 µL at a partition ratio of 1:50. The NIST 02 and Wiley 275 spectrum libraries were used to identify volatile compounds. The linear retention indices (LRI) were determined in relation to a homologous series of n-alkanes (C8–C24) under the same operating conditions [20].
Saturated fatty acids (SFA) were calculated based on sum of C16:0 and C18:0, monounsaturated fatty acids (MUFA) were represented by C18:1 and polyunsaturated fatty acids (PUFA) were calculated as sum of C18:2 and C18:3.

2.4. Statistical Analysis

The data obtained for the physical characterization were statistically processed and interpreted using the least significant differences (LSD) at a probability of 0.05.
The chemical data are presented as mean values ± SD and were analyzed using the t test. Values p < 0.05 were considered statistically significant. Principal component analysis (PCA) was applied to FAME values and Ward’s clustering method was performed using Euclidean distance, according to Statistics 10.0 (StatSoft Inc., Tulsa, OK, USA).

3. Results and Discutions

3.1. Physical Characterization

The main objectives pursued in the improvement of walnut species were: high productivity and good quality of the walnuts, lateral fructification, late flowering, tolerance or resistance to bacteriosis, etc. In our country, many researchers pointed out that a fruit weighing more than 15 g has minimum percentage of the kernel of 40–42% [11].
In this study, the choice of genotypes was made in relation to the fact that they all have some clearly defined properties, such as: productivity, adaptability to climate and soil conditions, lateral fructification or tolerance to diseases and pests.
Studying in-shell walnut properties and determining the chemical composition of the kernels we wanted to select the best genotypes that could form the basis for obtaining new varieties with adaptability to climate change in recent years.
The weight of the studied walnuts was between 4.77 g in B2 genotype and 18.8 g in B502 genotype with an average value of 10.14 g. Higher values comparing to the control were registered to genotypes: V1, V2, V7, B8, B13, T501, T502, T506 and T507; all nine had statistically significantly heavier fruits compared to the control sample. A higher value comparing with control was also registered in genotype B3, but no statistical significance exists. At the opposite pole, the lowest values of the walnut weight were registered in the case of genotypes: B1, B2, V3, V6, T503, T504 and T505; all seven being significantly negative comparing to the control (Table 1).
According to the classification proposed by Cosmulescu and Baciu [16], the studied genotypes, in terms of weight, are as follows: very large walnuts genotype T502; large walnuts, genotypes T506, V7, B8, T501 and B13; medium walnuts: V1,V2, T507,V6, T505, B3, B4,V8 and T504; small walnuts: V3, B1, T503 and B2.
Cosmulescu and Botu [21] showed that the fruit weight of walnut genotypes in south-western Romania varied between 6.8 and 18.4 g, while kernel weight varied between 1.7 and 8.8 g, and average weight of fruit was 10.6 g. The average weight of fruits, in the same genotype, ranged from a year to another with slight differences. Part of variation can be the result of fluctuations in environmental factors. A considerable genetic variation of the measured traits has been found among native seedling trees. As reported by Cosmulescu et al. [13], fruit weight ranged from 7.6 to 20.9 g, fruit length from 31.2 to 53.6 mm, fruit diameter I from 24.8 to 37.5 mm and fruit diameter II from 23.6 to 36.2 mm.
Previous studies reported walnut weight between 7.5–12 g [22,23,24]. Aslantaş [17] pointed out that genotypes from north-eastern Anatolia in Turkey had a weight between 9.7 and 16.0 g. Ozkhan and Koyuncu [1] highlighted that genotypes collected from Isparta, a region situated between the South and Middle Anatolia, had a weight that ranged between 8.4 and 11.1 g.
As is presented in Table 2 the kernel percentage of the walnuts was between 26.66% in genotype V1 and 54.66% in genotype V8 with an average value of 38.98%. For all determination the control sample was the average of all determinations.
Of the genotypes studied, 11 have exceeded the control value, registering percentages of over 40% kernel, genotype had a statistically significantly higher kernel percentage. Regarding the kernel percentage, the following genotypes stood out: V8, T506, T505, B3 and B4, which exceeded the value of 45% kernel, but also the genotypes: V6, T504, V4, V7, B13 and B8 which had 40–45% kernel.
The previous research made on assessment of some Romanian walnut cultivars has indicated that average kernel percentage has varied between 48.0% and 53.0% [25].
In Turkey, researchers have pointed out that in the studied walnut genotypes, the kernel ratio was 40–60% [26] and 45.66–67.14% [27]. Yarigac et al. [24], show in their study a kernel percentage between 49.09% and 59.27%.
Higher values for kernel percentage (51–70%) were found also in China’s cultivars [27]. Akca et al. [28] reported that the kernel percentage varied from 42.85% (Pedro) to 47.33% (“Fernette”), the walnut weight ranged from 12.79 g (“Fernor”) to 15.35 g (“Midland”) and the kernel weight from 5.80 g (“Fernor”) to 7.22 g (“Fernette”).
Variation values for walnut weight, kernel weight, kernel ratio, and shell thickness, have been reported by Arzani et al. [29] in the range of 6.0–15.2 g, 2.6–9.1 g, 38.4–79.6% and 0.4–1.4 mm.
It can be seen from the Table 3 that the fruit size index varied between 28.02 mm in B1 genotype and 42.5 mm in T502 genotype. Most of the genotypes had middle sized fruits, with the exception of: T502, V2 and T501, which had large fruits, while only one genotype had small fruits under the value of 25.0 mm.
Regarding the walnut biodiversity in south-western Romania, Cosmulescu and Botu [21], who studied germplasm from the Oltenia region, located in the south-western part of Romania, showed that fruit shape is broad ovate, round and the index size (average of three dimensions) varies between 27.73–41.8 mm. The same authors highlighted that variability found in kernel weight/walnut weight ratio varied between 23.6% and 71.7%.
Other studies reported the size of walnuts over 27.7 mm in the original sample from Turkey [1], Akca and Sen [30] reported the walnut length of 39.97 mm and the diameter of 33.59 mm.
Akca and Sen [22], registered diameter values between 22.30 ± 0.12 mm and 32.26 ± 2.95 mm, and Khadivi et al. [31] pointed out diameter for walnut ranging from 20.00 to 43.35 mm, while walnut length ranged from 22.20 to 47.42 mm.
Akcaet al. [28] showed that the average walnut diameter varied from 35.24 mm (“Fernor”) to 38.47 mm (“Fernette”), walnut height from 33.73 mm (“Fernor”) to 36.86 mm (“Fernette”) and walnut length from 60.62 mm (“Fernor”) to 46.82 mm (“Midland”).
The release of the kernel represents an important feature which influences, on one hand the appearance of the kernel which can be whole or crushed and on the other hand eases the procedure of release of the kernel for industrialization. From all genotypes studied it was observed that nine of them had an easy release, eight a moderate release and only three genotypes had problems at the kernel release, which led to its crushing. the Table 4 it can be observed that in the majority of genotypes the kernel was extracted in halves or quarters, only in the three genotypes: B2, V1 and T507 the kernel crushed between cracking. The genotypes: B4, B8, B13, V3, T501, T502, T505 and T506 stand out for the easiness of the kernel release in halves. They can be consumed fresh or candied.
The color and the appearance of the kernel peel represent as well an important feature which influences the usage of the fruits. The B13, V4 and V8 genotypes had an excellent appearance–bright color (golden) and smoothness of shell; the B8 genotype had darker color (yellowish brown) and smooth of peel, whilst the T501 and T505 genotypes had brown and smooth peel. In addition to those, ten other genotypes had pleasant colors and a moderate shell appearance, only four genotypes had a rough shell (B2, B4, V3 and T507).
Kazankaya et al. [23] also noted light colored kernels in the studied walnut genotypes. Similarly, Wu et al. [32], described walnut cultivars in which the kernel could be taken out whole or in two halves, and the color was light yellow.

3.2. Chemical Analysis

3.2.1. Proximate Analysis

The proximate analysis of the walnut involved the determination of the moisture content, minerals, lipids and proteins. Carbohydrate content and nutritional value were obtained by calculation, as explained in the Material and Methods.
Regarding the moisture content the registered values were between 1.23–5.00%, the lowest value being recorded for the genotype T505 and the highest value for the genotype V8 (Table 5).
The mineral content of the analyzed walnuts was within the range of 1.31–2.49%, the lowest value being recorded for genotype V7 and the highest for the T507 genotype. The lipid content showed a high variation, ranging from 56.09% to 66.56%, the lowest content being recorded in the case of genotype B2 and the highest one in the genotype B1.
The protein content has also varied quite a lot, the values being between 12.73% and 20.41%, the lowest value being recorded in genotype B3 and the highest value in the genotype T503. Following calculations on carbohydrate content were obtained values ranging from 9.95% to 25.25%, the smallest value being recorded in the genotype T501 and the highest in B2. The nutritional values were calculated, being between 645.05 kcal/100g in the genotype B2 and 718.77 kcal/100 g in the genotype V3.
The results are consistent with the study made by Cardoso et al. [33] who reported a protein content in studied walnuts between 8.7% and 25.2%, lipids between 46.4% and 76%, carbohydrates from 11.8% to 28.6% and the energy value between 496 and 741 kcal/100 g.
Yang [34] reports similar values to those obtained in the present paper, namely: 3.5% water, 12.3% carbohydrates, 14.3% protein and 66.4% lipids.

3.2.2. Fatty Acids Composition

Experimental results on walnuts fatty acids composition are shown in Table 6. The fatty acid identified in all walnut sample was palmitic acid (C16:0) and stearic acid (C18:0), which belong to the group of saturated fatty acids, together with unsaturated oleic acid (C18:1), linoleic (C18:2) and linolenic (C18:3) acids. In the case of palmitic acid (C16: 0), values between 10.6% and 15.64% and for stearic acid (C18:0) between 3.28% and 4.86% were recorded. Regarding the unsaturated fatty acid content, the following values were obtained: 15.00–21.03% for oleic acid (C18:1); 43.45–49.97% for linoleic acid (C18:2) and 14.85–19.18% for linolenic acid (C18:3).
From all walnut samples studied, the highest amount of fatty acids identified were PUFAs (C16:0 and C18:0) (59.85–66.46%). For saturated fatty acids (SFA) (C16:0) and C18:0) and monounsaturated (C18:1), the values obtained did not show significant differences, being 14.12–20.19% for SFA and 15–21.03% for MUFA.
Cardoso et al. [33] reported in their study the following values for fatty acids: 16.74% C16:0; 9.97% C18:0; 28.52% C18:1; 36.04% C18:2; 0.11% C18:3. In our study, the highest proportion was obtained for C18:2 followed by C18:1.
Yang [34] reports in its study made on several walnut types values ranging from 5.82 to 13.50% for C16:0; 0.86–11.77% C18:0; 21–79.3% C18:1; 2.31–57.46% C18:2; 0.06–11.58% C18:3.
It is well known today that the role of fats in the production of atherosclerosis is in fact related to their composition in saturated and unsaturated fatty acids. The study of fatty acids tends to shed light on many unknowns that persist regarding the role of dietary factors and especially fats in the genesis of atheroma. Previous research has established key differences between the behavior of saturated and unsaturated fatty acids. Thus, it has been shown that, using certain vegetal matrices rich in unsaturated fatty acids, a net decrease in plasma lipids is obtained. Ahrens [35] and Bronte-Stewart [36] demonstrate another fundamental fact, namely that these vegetable oils decrease plasma lipids only when absorbed in the natural state and that, on the contrary, after hydrogenation, i.e., after saturation, they increase, plasma lipids behaving like animal fats.
In this context, the intake of unsaturated fatty acids (MUFA and PUFA) provided by the consumption of walnut kernels contributes to ensuring a healthy diet and increases the quality of life of the consumer.

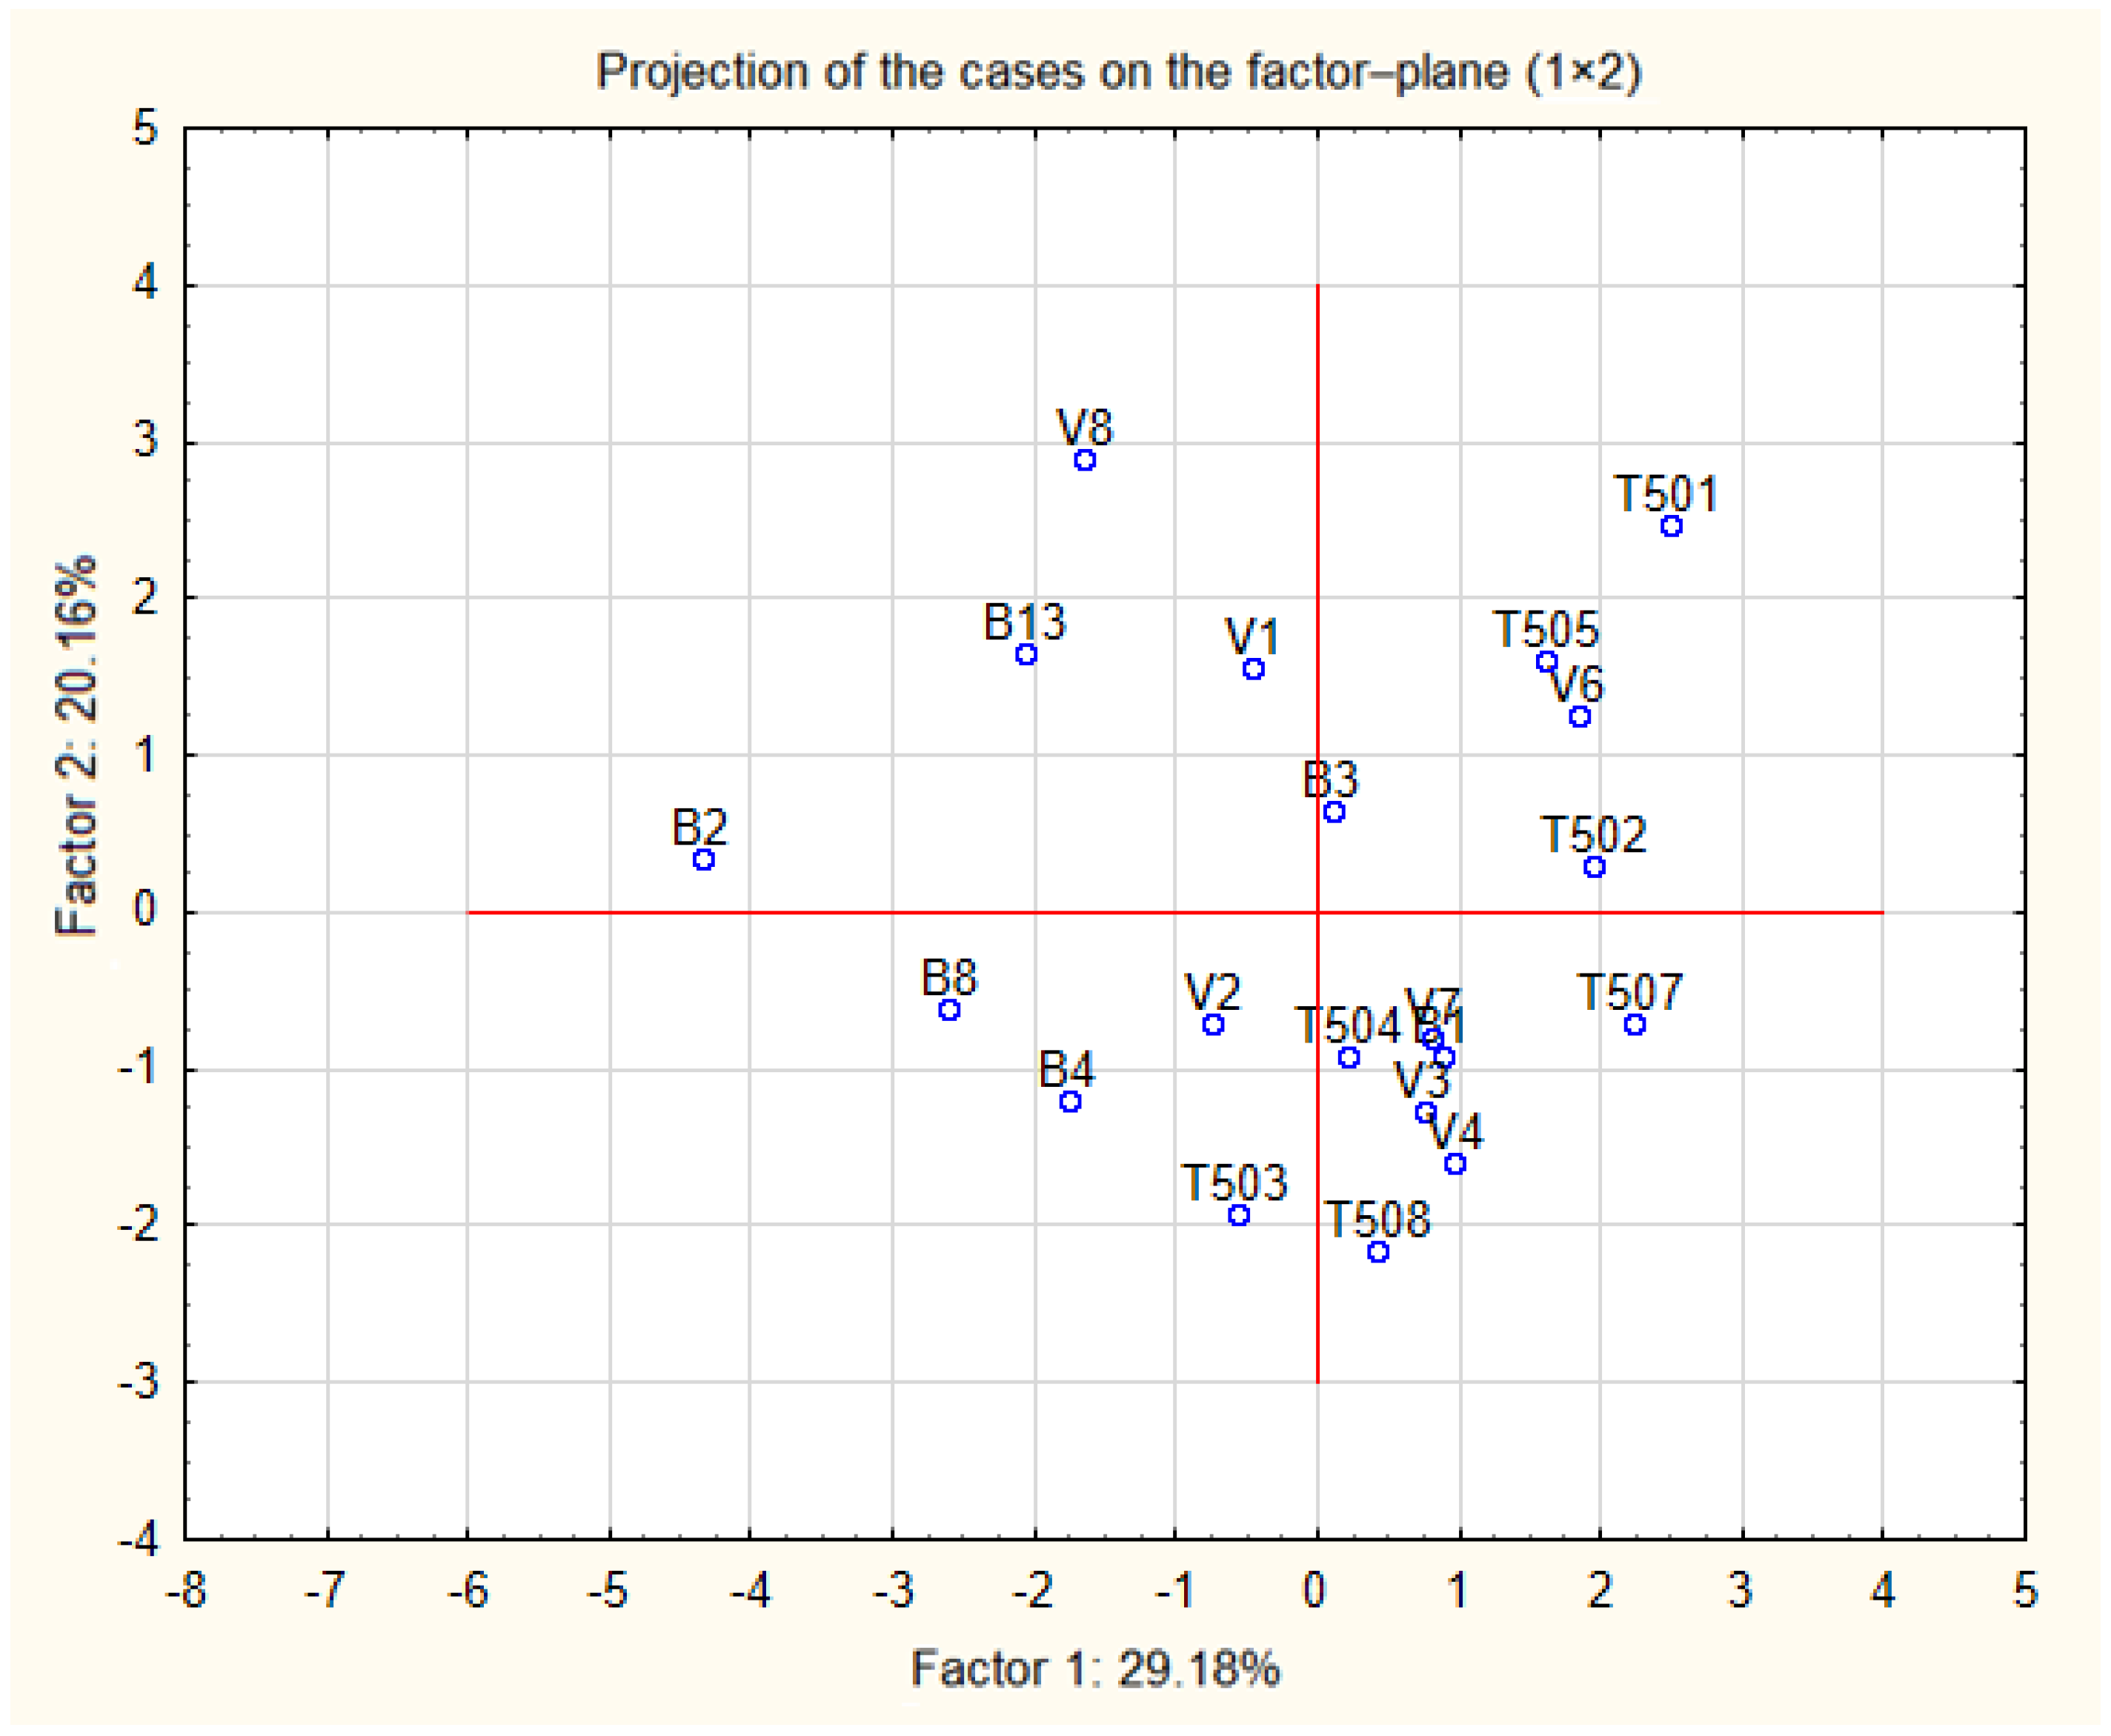
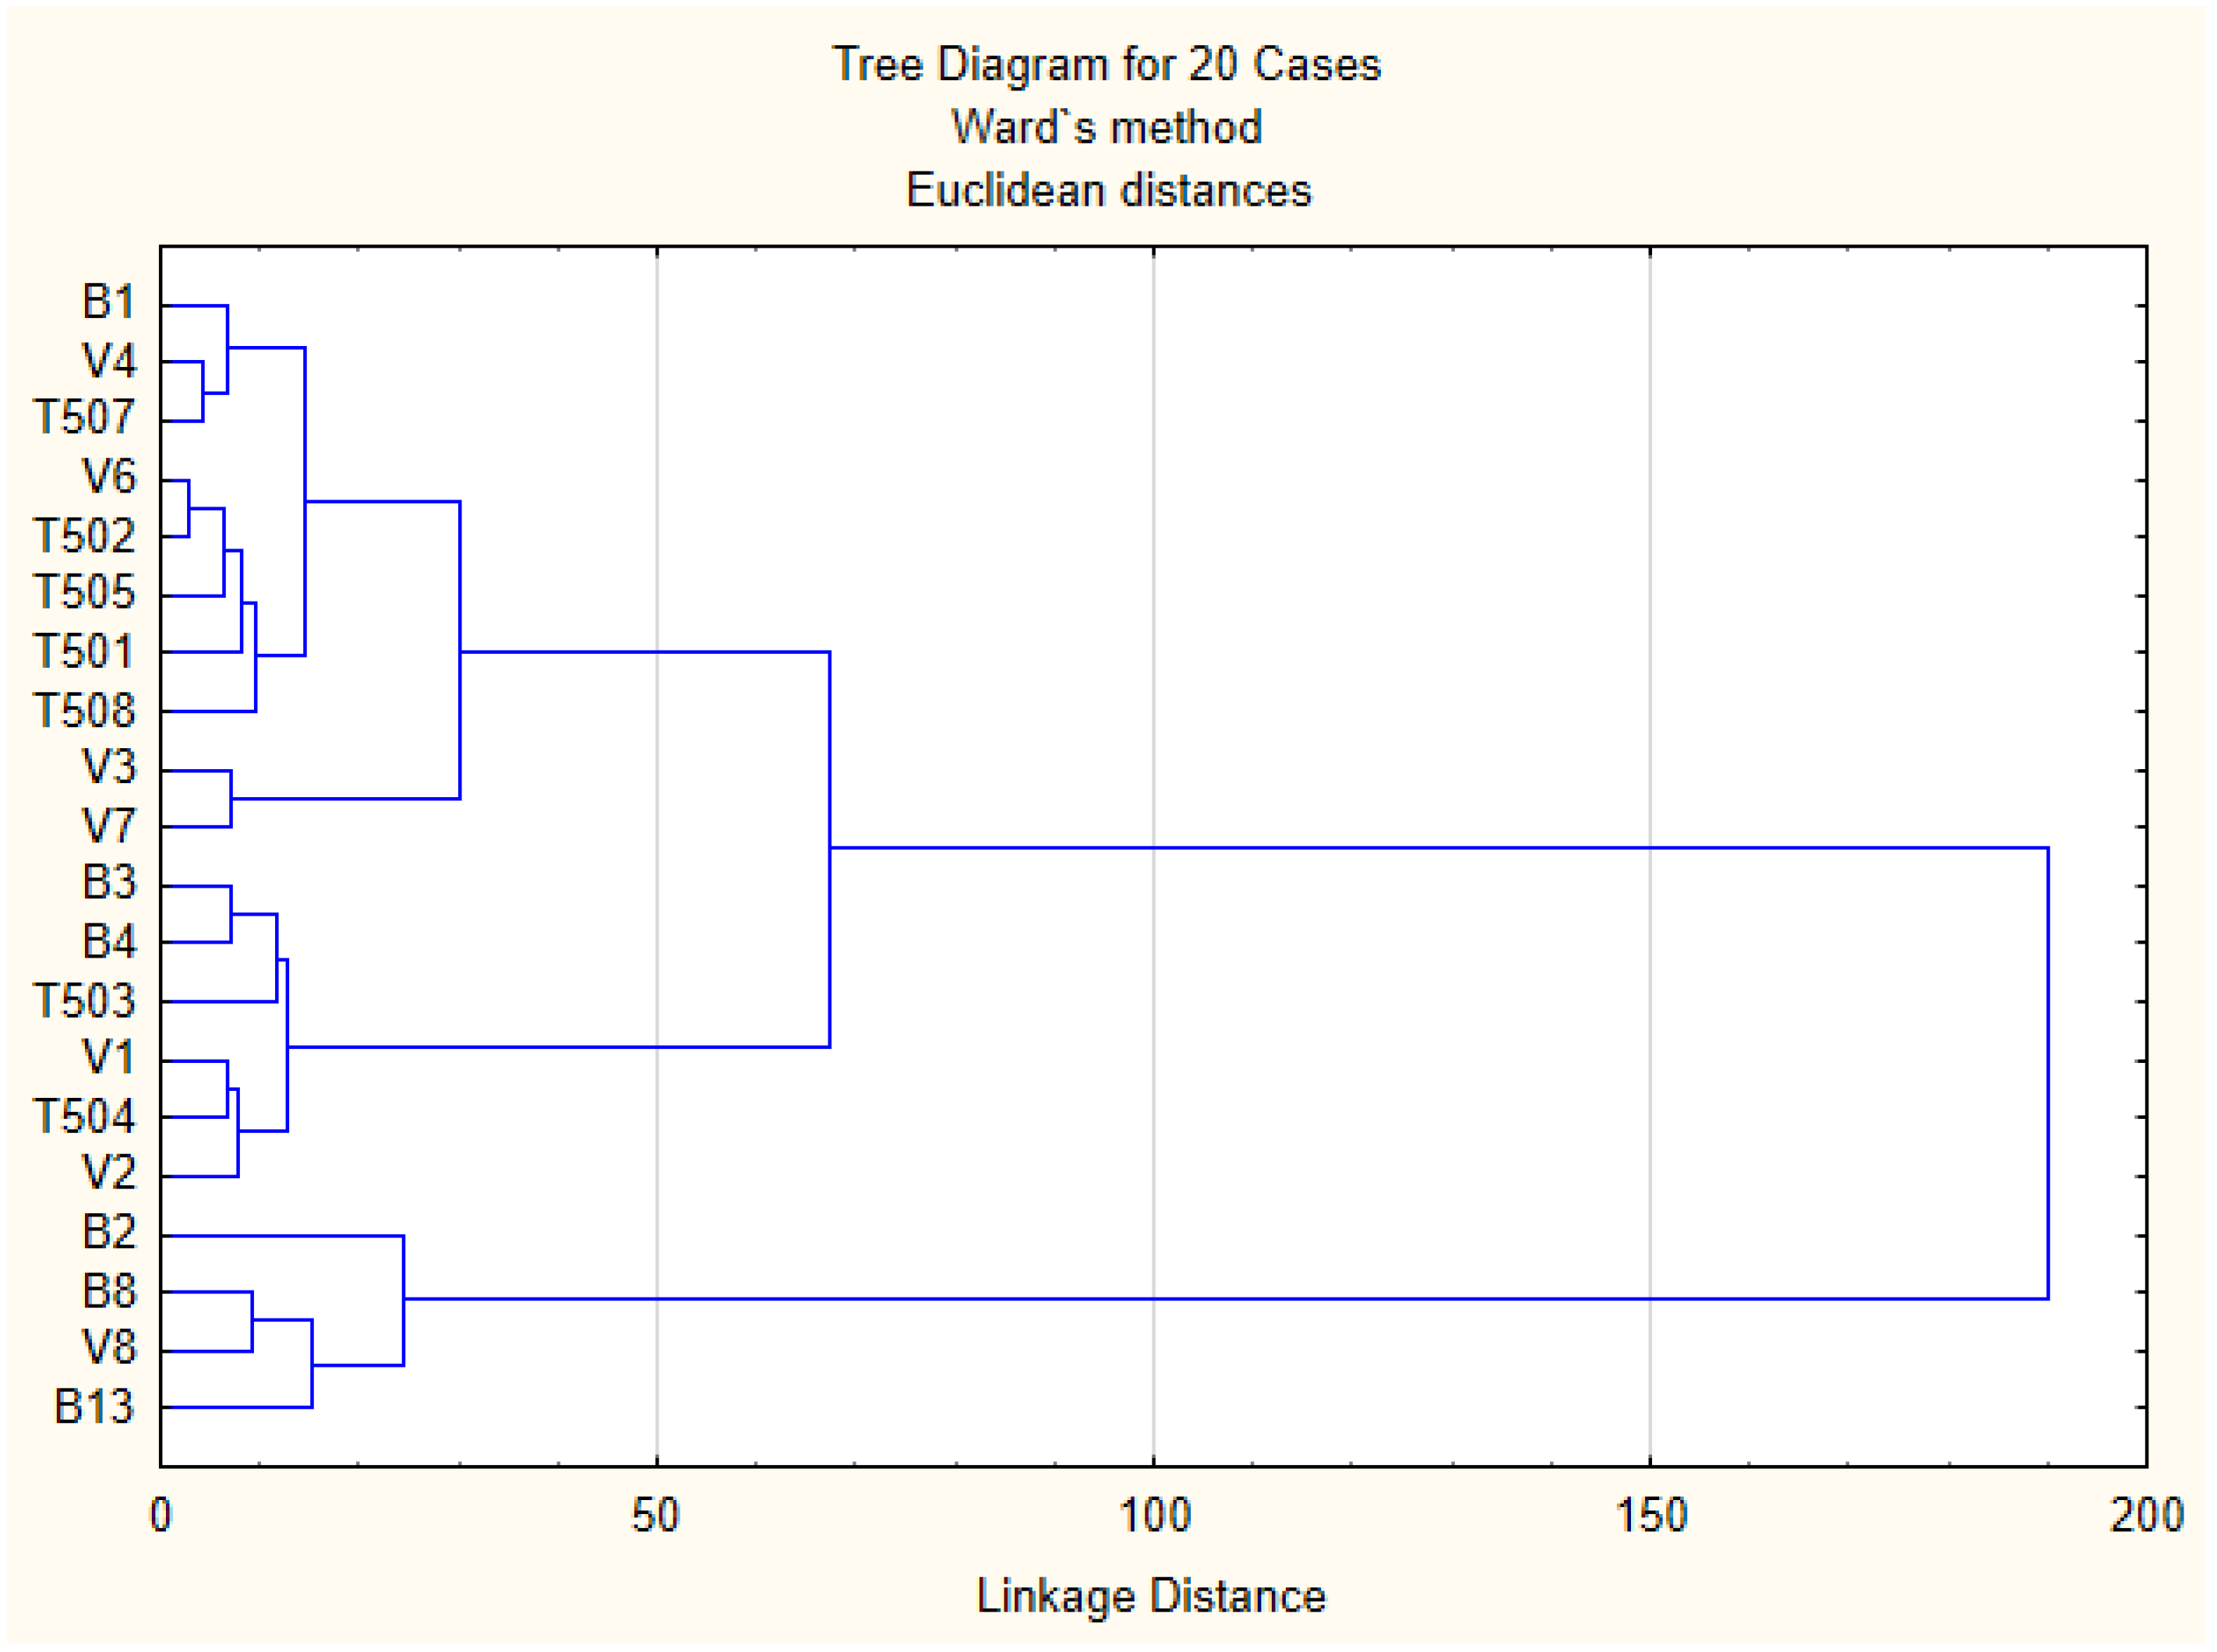
3.3. Correlations between Variables

The appearance of food, including plant matrices, is an important argument in consumer choices. In order to highlight possible interdependencies between the nutritional value and the appearance of the walnut kernel, Pearson correlations were made between the parameters that define the chemical composition and the physical indices.
The analysis of correlation (Table 7) highlights a strong (r > 0.7) positive correlation between lipids/nutritional value (r = 0.832) and walnut weight/ size index (r = 0.822), a strong negative correlation (r > −0.7) between the pairs lipids/carbohydrates (r = −0.765) and carbohydrates/nutritional value (r = −0.743). No moderate (r > 0.5) positive correlation was recorded for any of the pairs. A moderate (r > −0.5) negative correlation for the pairs SFA/MUFA (r = −0.506), SFA/PUFA (r = −0.628) were determined, as well as protein/carbohydrates (r = −0.604). We determined mutual correlations between individual variables, which can prove dependence between chemical compounds. The most closely related variables were lipids/energy, indicating that the high lipid content is responsible for the high energy value of walnuts.
In addition, the multi-parametric statistical evaluation method using PCA (Figure 2) and CA (Figure 3) were used for further data analysis.
Based on a linear correlation matrix, PCA was applied to the mean values of the measured traits to study which parameters contributed the most to total data variation. The PCA produced nine components. The first two principal components accounted for 29.18% and 20.16% of the variance, respectively, for a total of 49.34%. The most important variables integrated in the first component were lipids and energy, which were positively correlated with this component; on the other hand, C18:3 and carbohydrates were negatively correlated with this first component. The second component was positively correlated with C18:1, C18:2 and moisture, and negatively correlated with C16:0 and C18:0.
The similarity regarding the chemical composition was examined when each sample was plotted using the first and second principal components, which retained 49.34% of the total variance (Figure 3) and showed a clustering tendency. This led us to perform CA and represent the case by a simplified dendrogram plot. We can clearly identify the walnuts with distant values by this data presentation.
Using CA, we were able to suggest a dendrogram that divides individual walnuts into 3 representative clusters based on the mutual similarity of their measured parameters. Clusters classify individual walnuts into six groups based on similar characteristics:
Group 1: B1, V4, T507, V6, T502, T505, T501, T508, V3 and V7;
Group 2: B3, B4, T503, V1, T504 and V2;
Group 3: B2, B8, V8 and B13;
It is noted that group similarity is based on the chemical composition.

4. Conclusions

This study was performed in order to characterize the physical and chemical proprieties of several walnuts’ genotypes cultivated in the west and north-west of Romania. The results highlight the important nutritional value of different genotypes.
From the analysis of correlation resulted that the high correlation between lipids and energy value is rather obvious, indicating that the high lipid content is responsible for the high energy value of walnuts. In the PCA analysis the most important variables integrated in the first component were lipids and energy, which were positively correlated. The cluster dendrogram of walnuts chemical composition indicated that group similarity is based on the chemical composition.
The correlations obtained between physical-chemical parameters of different genotypes can be a useful database for breeders, growers, traders and consumers to highlight the regional particularities of walnut.

Author Contributions

Conceptualization, O.A.I., I.R. and D.S.P.; methodology, I.P.B., I.C., A.A.B. and I.P., D.S.P.; software, D.L.; validation, O.A.I., I.R. and D.C.; data curation, O.A.I.; writing—original draft preparation, O.A.I., I.P.B., I.C., A.A.B.; writing—review and editing, O.A.I., I.R., D.C. All authors have read and agreed to the published version of the manuscript.

Funding

This paper is published from the own funds of the Banat’s University of Agricultural Sciences and Veterinary Medicine from Timisoara.

Institutional Review Board Statement

Not applicable.

Informed Consent Statement

Not applicable.

Data Availability Statement

The report of the analyzes performed for the samples in the paper can be found at the Interdisciplinary Research Platform (PCI) belonging to the Banat University of Agricultural Sciences and Veterinary Medicine “King Michael I of Romania” from Timisoara, being registered with number 3c/17.01.2018.

Acknowledgments

We have been able to carry out this research with the support of Interdisciplinary Research Platform (PCI) belonging to the Banat University of Agricultural Sciences and Veterinary Medicine “King Michael I of Romania” from Timisoara, where the experiments were made.

Conflicts of Interest

The authors declare no conflict of interest.

References

  1. Ozkan, G.; Koyuncu, M.A. Physical and chemical composition of some walnut (Juglans regia L.) genotypes grown in Turkey. Grasas Aceites 2005, 56, 141–146. [Google Scholar] [CrossRef]
  2. Martinez, M.L.; Maestri, D. Oil chemical variation in walnut (Juglans regia L.) genotypes grown in Argentina. Eur. J. Lipid Sci. Technol. 2008, 110, 1183–1189. [Google Scholar] [CrossRef]
  3. Ruggeri, S.; Cappelloni, M.; Gambelli, L.; Nicoli, S.; Carnovale, E. Chemical composition and nutritive value of nuts grown in Italy. Ital. J. Food Sci. 1996, 3, 243–252. [Google Scholar]
  4. Savage, G.P. Chemical composition of walnut (Juglans regis L) grown in New Zealand. Plant Foods Hum. Nutr. 2001, 56, 75–82. [Google Scholar] [CrossRef] [PubMed]
  5. Hayes, D.K.; Angove, M.J.; Tucci, J.; Dennis, C.M. Walnuts (Juglans regia) Chemical Composition and Research in Human Health. Crit. Rev. Food Sci. Nutr. 2015, 56, 1231–1241. [Google Scholar] [CrossRef]
  6. Poulose, S.M.; Miller, M.; Shukitt-Hale, B. Role of Walnuts in Maintaining Brain Health with Age. J. Nutr. 2014, 144, 561S–566S. [Google Scholar] [CrossRef] [Green Version]
  7. Khadivi-Khub Ebrahimi, A.; Mohammadi, A.; Kari, A. Characterization and selection of walnut (Juglans regia L.) genotypes from seedling origin trees. Tree Genet. Genomes 2015, 11, 54. [Google Scholar] [CrossRef]
  8. Koyuncu, M.A.; Ekinci, K.; Gun, A. The effects of altitude on fruit quality and compression load for cracking of walnuts (Juglans regia L.). J. Food Qual. 2005, 27, 407–417. [Google Scholar] [CrossRef]
  9. Ercisli, S.; Sayinci, B.; Kara, M.; Yildiz, C.; Ozturk, I. Determination of size and shape features of walnut (Juglans regia L.) cultivars using image processing. Sci. Hortic. 2012, 133, 47–55. [Google Scholar] [CrossRef]
  10. Yarilgaç, T.; Balta, M.F.; Borasan, L.; Bülbül, C. Fruit characteristics of natural walnut (Juglans regia L.) genotypes of Catak and Taspinar Villages (Corum). Acta Hortic. 2013, 981, 135–140. [Google Scholar] [CrossRef]
  11. Cociu, V. Culturile Nucifere; Ceres: Bucureşti, Romania, 2003; pp. 79–85. [Google Scholar]
  12. Botu, M.; Botu, I.; Achim, G.; Godeanu, I. Genetic variability of the Juglans regia L. natural populations from Oltenia—Romania. In Proceedings of the Fourth International Walnut Symposium, Bordeaux, France, 13–16 September 1999. [Google Scholar]
  13. Cosmulescu, S.; Stefanescu, D.; Ionescu, M.B. Genetic Diversity among Juglans Regia Genotypes Based on Morphological Characters of Nut. Erwerbs Obstbau 2018, 60, 137–143. [Google Scholar] [CrossRef]
  14. Iordanescu, O.; Bala, M.; Sala, F.; Scedei, D.; Toth, M. Characterization of Some Walnut (Juglans regia L.) Biotypes Based on the Biometrical and Biochemical Parameters of Nuts. Agrolife Sci. J. 2018, 7, 68–75. [Google Scholar]
  15. UPOV, TG/125/7(proj.3), Walnut, UPOV Code: JUGLA_REG Juglans regia L. Available online: https://www.upov.int/edocs/mdocs/upov/en/twf_46/tg_125_7_proj_3.pdf (accessed on 15 September 2020).
  16. Cosmulescu, S.; Baciu, A. Pomologie—Descriere de Sortiment; Editoral Universitaria: Craiova, Romania, 2003. [Google Scholar]
  17. Aslantaş, R. Identification of superior walnut (Juglans regia) genotypes in northeastern Anatolia. Turk. N. Zeal. J. Crop Hortic. Sci. 2006, 34, 231–237. [Google Scholar] [CrossRef]
  18. ISO 665:2020; ISO 16634-1:2008; ISO 22630:2015; ISO 749:1977.
  19. Publications Office of the European Union. Regulation (EU) No 1169/2011 of the European Parliament and of the Council; Publications Office of the European Union: Luxembourg, 2011.
  20. Duca, A.; Alexa, E.; Dehelean, C.A.; Șoica, C.; Danciu, C.; Popescu, I.; Cocan, I.; Lalescu, D.; Muntean, D.M. Assessment of Lipid Profile of Eight Propolis Samples from Western Romania. Farmacia 2019, 67, 126–132. [Google Scholar] [CrossRef]
  21. Cosmulescu, S.; Botu, M. Walnut biodiversity in south-western Romania resource for perspective cultivars. Pak. J. Bot. 2012, 44, 307–311. [Google Scholar]
  22. Akca, Y.; Sen, S.M. Study on the selection of superior walnut trees in Hizan (Bitlis) populations. In Proceedings of the Fourth International Walnut Symposium, Bordeaux, France, 13–16 September 1999; ACTA Horticulturae: Leuven, Belgium, 2001; Volume 544, pp. 115–118. [Google Scholar] [CrossRef]
  23. Kazankaya, A.; Koyuncu, M.A.; Koyuncu, F.; Yarilgac, T.; Sen, S.M. Some nut properties of walnuts (Juglans regia L.) of Edremit country. In Proceedings of the Fourth International Walnut Symposium, Bordeaux, France, 13–16 September 1999; ACTA Horticulturae: Leuven, Belgium, 2015; Volume 44, pp. 97–100. [Google Scholar] [CrossRef]
  24. Yarilgac, T.; Koyuncu, F.; Koyuncu, M.A.; Kazankaya, A.; Sen, S.M. Some Promising Walnut Selections (Juglans regia L.), Proceedings of the Fourth International Walnut Symposium, Bordeaux, France, 13–16 September 1999; ACTA Horticulturae: Leuven, Belgium, 2001; Volume 544, pp. 93–96. [Google Scholar] [CrossRef]
  25. Botu, M.; Tudor, M.; Papachatzis, A. Evaluation of some walnut cultivars with different bearing habits in the ecological conditions of Oltenia—Romania. Acta Hortic. 2010, 861, 119–126. [Google Scholar] [CrossRef]
  26. Balci, I.; Balta, F.; Kazankaya, A.; Sen, S.M. Promising native walnut genotypes (Juglans regia L.) of the east Black Sea Region of Turkey. J. Am. Pomol. Soc. 2001, 55, 204–208. [Google Scholar]
  27. Baojun, Z.; Yonghong, G.; Liqun, H. Overview of walnut culture in China. Acta Hortic. 2010, 861, 39–44. [Google Scholar] [CrossRef] [Green Version]
  28. Akca, Y.; Unal, B.; Celik, M.; Okay, Y. Comparison of Some Promising Turkish and Foreign Walnut Cultivars. VII Int. Walnut Symp. ACTA Hortic. 2014, 1050, 143–149. [Google Scholar] [CrossRef]
  29. Arzani, K.; Mansouri-Ardakan, H.; Vezvaei, A.; Roozban, M.R. Morphological variation among Persian walnut (Juglansregia) genotypes from central Iran. N. Z. J. Crop Hortic. Sci. 2008, 36, 159–168. [Google Scholar] [CrossRef] [Green Version]
  30. Akca, Y.; Sen, S.M. Relationship between and yield-nut characteristic in Juglans regia. Acta Hort. 1995, 442, 81–82. [Google Scholar]
  31. Khadivi, A.; Montazeran, A.; Rezaei, M.; Ebrahimi, A. The pomological characterization of walnut (Juglans regia L.) to select the superior genotypes—An opportunity for genetic improvement. Sci. Hortic. 2019, 248, 29–33. [Google Scholar] [CrossRef]
  32. Wu, G.L.; Hou, L.Q.; Zhang, Z.H.; Tian, J.B. New Chinese Cultivar Resources of Juglans with Special Characteristics. In Proceedings of the VI International Walnut Symposium, Melbourne, Australia, 25–27 February 2009; ACTA Horticulturae: Leuven, Belgium, 2010; Volume 861, pp. 155–161. [Google Scholar]
  33. Cardoso, B.R.; Duarte, G.B.S.; Reis, B.Z.; Cozzolino, S.M. Brazil nuts: Nutritional composition, health benefits and safety aspects. Food Res. Int. 2017, 100, 9–18. [Google Scholar] [CrossRef] [PubMed]
  34. Yang, J. Brazil nuts and associated health benefits: A review. LWT Food Sci. Technol. 2009, 42, 1573–1580. [Google Scholar] [CrossRef]
  35. Ahrens, E.H. Nutritional factors and serum lipid levels. Am. J. Med. 1957, 23, 928–952. [Google Scholar] [CrossRef]
  36. Bronte-Stewart, B.; Krut, H.L. The interdependence of prospective and retrospective studies in research on ischaemic heart disease. J. Atheroscler. Res. 1962, 2, 317–331. [Google Scholar] [CrossRef]
Figure 1. The walnut genotypes from west and north-west of Romania.
Agronomy 11 01092 g001
Figure 2. Projection of the cases on the plane spanned by the first and second principal components.
Agronomy 11 01092 g002
Figure 3. Cluster dendrogram of walnuts chemical composition.
Agronomy 11 01092 g003
Table 1. Walnut weight of different genotype from west and north-west of Romania.
GenotypeNut Weight (g)Difference to the ControlSignificance
B16.30−3.84000
B24.77−5.37000
B310.180.04-
B49.91−0.23-
B812.602.46XXX
B1312.021.88XXX
V111.701.56XXX
V211.701.56XXX
V37.86−2.28000
V410.01−0.13-
V610.850.71000
V712.722.58XXX
V89.80−0.340
T50112.202.06XXX
T50218.808.66XXX
T5036.10−4.04000
T5048.20−1.94000
T5059.20−0.94000
T50614.264.12XXX
T50711.501.36XXX
Average value of the experiment10.140.00control
LSD test—values very close to control; 000—strong negative against control; 00—moderate negative against control; 0—low negative against control; XXX—strong positive against control; XX—moderate positive against control; X—low positive against control.
Table 2. Kernel percentage of different genotype from west and north-west of Romania.
GenotypeKernel Percentage (%)Difference to the ControlSignificance
B139.520.54-
B231.44−7.54000
B347.158.17XXX
B445.506.52XXX
B840.041.06-
B1341.002.02XX
V126.66−12.32000
V235.12−3.86000
V334.86−4.12000
V440.821.84XX
V643.694.71XXX
V740.731.75XX
V854.6615.68XXX
T50134.00−4.98000
T50227.00−11.98000
T50337.50−1.480
T50441.002.02XX
T50548.009.02XXX
T50648.339.35XXX
T50730.00−8.98000
Average value of the experiment38.980.00control
LSD test—values very close to control; 000—strong negative against control; 00—moderate negative against control; 0—low negative against control; XXX—strong positive against control; XX—moderate positive against control; X—low positive against control.
Table 3. Size and shape index of walnut of different genotype from west and north-west of Romania.
GenotypeSize Index
mm
SizeShape IndexShape
B128.02Middle108.09Spherical
B225.46Middle107.42Spherical
B333.03Middle111.73Oval
B432.12Middle118.15Oval
B834.03Middle126.18Elongated
B1333.79Middle121.38Oval
V132.43Middle112.94Oval
V238.00Large121.83Oval
V329.62Middle109.31Spherical
V432.09Middle132.35Elongated
V632.06Middle119.94Oval
V734.46Middle121.31Oval
V832.93Middle119.69Oval
T50135.00Large115.23Oval
T50242.50Extremely large117.91Oval
T50323.50Small110.91Oval
T50434.70Middle126.71Oval
T50532.80Middle122.53Elongated
T50632.40Middle113.54Oval
T50729.30Middle111.56Oval
Table 4. External properties of kernel of different genotype from west and north-west of Romania.
GenotypeThe Release of the KernelKernel’s ExtractionKernel’s ColorShell Appearance
B1moderatehalvesmediummedium
B2moderatecrushedmediumrough
B3moderatequartersmediummedium
B4easyhalvesdarkrough
B8easyhalvesmediumsmooth
B13moderatehalveslightmedium
V1hardcrushedmediummedium
V2hardquarterslightmedium
V3moderatehalvesdarkrough
V4easyquarterslightsmooth
V6moderatequartersmediummedium
V7easyquarterslightsmooth
V8easyquarterslightsmooth
T501easyhalvesdark smooth
T502easyhalvesmedium medium
T503moderatequartersmediummedium
T504moderatequartersmediummedium
T505easyhalvesdarksmooth
T506easyhalvesdark medium
T507hardcrusheddarkrough
Table 5. Proximate composition of the walnut of different genotype from west and north-west of Romania.
GenotypeHumidity (%)Ash (%)Lipid (%)Protein (%)Carbohydra-Tes (%)Nutritional Value (kcal)
B11.63 ± 0.08 b,c2.21 ± 0.10 e66.56 ± 1.64 c13.12 ± 0.37 a16.48705.84
B23.28 ± 0.14 f1.54 ± 0.07 b56.09 ± 1.84 a13.84 ± 0.41 a25.25645.05
B31.28 ± 0.15 a2.25 ± 0.11 e63.29 ± 2.23 b,c12.73 ± 0.79 a20.45689.77
B41.67 ± 0.11 b,c1.78 ± 0.11 c60.33 ± 1.99 b15.85 ± 0.75 b20.37686.45
B82.60 ± 0.22 d,e1.63 ± 0.08 b,c58.01 ± 2.17 a,b16.81 ± 0.76 b,c20.95663.21
B131.95 ± 0.07 c2.26 ± 0.06 e58.06 ± 1.60 a,b15.77 ± 0.76 b21.96671.54
V13.86 ± 0.15 g2.02 ± 0.13 d59.55 ± 1.49 a,b18.10 ± 0.70 c,d16.43693.99
V22.61 ± 0.14 d,e2.06 ± 0.09 d,e60.63 ± 2.18 b,c16.02 ± 0.94 b18.68693.19
V31.81 ± 0.10 c1.85 ± 0.09 c62.57 ± 2.39 b,c17.87 ± 0.75 c,d15.90718.77
V42.85 ± 0.07 e1.73 ± 0.06 c64.56 ± 2.38 c15.87 ± 0.67 b14.99704.56
V62.70 ± 0.17 e2.13 ± 0.09 d,e64.91 ± 1.86 c16.20 ± 0.56 b14.06702.79
V71.49 ± 0.07 b1.31 ± 0.07 a61.95 ± 2.71 b,c19.29 ± 0.59 d,e15.96712.63
V85.00 ± 0.19 h1.83 ± 0.06 c58.19 ± 1.46 a,b16.26 ± 0.69 b,c18.73656.26
T5013.87 ± 0.09 g2.20 ± 0.10 e64.77 ± 2.01 c19.21 ± 0.65 d,e9.95699.57
T5022.41 ± 0.12 d2.14 ± 0.10 d,e64.08 ± 1.53 c17.70 ± 0.68 c13.67702.20
T5032.42 ± 0.06 d1.48 ± 0.08 b60.11 ± 1.45 b20.41 ± 0.73 e15.58684.95
T5042.44 ± 0.10 d1.81 ± 0.09 c62.29 ± 1.56 b,c15.65 ± 0.60 b17.81694.45
T5051.23 ± 0.11 a2.03 ± 0.08 d62.53 ± 1.80 b,c17.53 ± 0.92 c16.68699.61
T5071.93 ± 0.06 c2.49 ± 0.12 f65.04 ± 1.88 c16.98 ± 0.90 b,c13.56707.52
T5082.47 ± 0.09 d1.87 ± 0.08 c63.42 ± 1.18 b19.06 ± 0.80 d13.18699.74
Different letters in columns indicate significant differences between values according to the t test (p < 0.05).
Table 6. Fatty acids content in walnuts (%).
SampleC16:0C18:0C18:1C18:2C18:3SFAMUFAPUFA
B113.09 ± 0.42 h4.81 ± 0.12 j18.80 ± 0.48 j45.51 ± 0.58 e17.79 ± 0.69 i17.9018.8063.30
B213.84 ± 0.53 k4.24 ± 0.10 g18.01 ± 0.70 g45.83 ± 0.88 f18.08 ± 0.62 k18.0818.0163.91
B312.57 ± 0.46 g4.14 ± 0.08 f,g19.46 ± 0.51 k47.50 ± 1.08 j16.33 ± 0.52 f16.7119.4663.88
B411.15 ± 0.56 c6.50 ± 0.13 k16.59 ± 0.47 c47.79 ± 1.08 k17.97 ± 0.46 j17.6516.5965.75
B813.87 ± 0.63 k4.69 ± 0.13 i16.75 ± 0.63 d46.66 ± 0.86 h18.03 ± 0.46 j,k18.5616.7564.69
B1310.94 ± 0.79 b3.74 ± 0.09 d21.03 ± 0.47 p45.11 ± 0.92 d19.18 ± 0.44 n14.6821.0364.29
V111.72 ± 0.39 e3.54 ± 0.17 c20.24 ± 0.51 m45.83 ± 0.89 f18.67 ± 0.57 m15.2620.2464.50
V213.86 ± 0.41 k4.70 ± 0.17 i15.00 ± 0.40 a48.30 ± 1.14 l18.14 ± 0.65 k18.5615.0066.44
V313.21 ± 0.57 i4.73 ± 0.19 i,j17.65 ± 0.41 e46.60 ± 1.05 h17.81 ± 0.51 i17.9417.6564.41
V415.39 ± 0.44 m4.80 ± 0.10 j16.06 ± 0.33 b47.82 ± 0.97 k15.93 ± 0.52 d20.1916.0663.75
V612.40 ± 0.61 f3.42 ± 0.08 b17.77 ± 0.46 f49.69 ± 0.88 m16.72 ± 0.47 g15.8217.7766.35
V713.05 ± 0.62 h4.10 ± 0.13 f,g20.34 ± 0.51 n46.29 ± 0.87 g16.22 ± 0.39 e17.1520.3462.51
V811.32 ± 0.40 d4.06 ± 0.08 f18.72 ± 0.38 j49.97 ± 0.86 o15.93 ± 0.35 d15.3818.7265.90
B50110.60 ± 0.38 a3.52 ± 0.12 c19.42 ± 0.48 k49.74 ± 1.31 m,n16.72 ± 0.54 g14.1219.4266.46
B50213.65 ± 0.47 j3.93 ± 0.16 e18.49 ± 0.52 i48.25 ± 1.01 l15.68 ± 0.56 c17.5818.4963.93
B50315.64 ± 0.48 n4.46 ± 0.09 h18.38 ± 0.47 h44.33 ± 0.57 b17.19 ± 0.60 h20.1018.3861.52
B50414.93 ± 0.62 l4.76 ± 0.07 i,j20.46 ± 0.48 o45.00 ± 0.86 c14.85 ± 0.39 a19.6920.4659.85
B50511.68 ± 0.40 e3.28 ± 0.09 a19.75 ± 0.60 l49.80 ± 1.12 n15.49 ± 0.51 b14.9619.7565.29
B50714.92 ± 0.50 l4.16 ± 0.21 g17.60 ± 0.48 e46.98 ± 0.86 i16.34 ± 0.46 f19.0817.6063.32
B50814.91 ± 0.41 l4.86 ± 0.12 j18.33 ± 0.34 h43.45 ± 0.69 a18.45 ± 0.42 l19.7718.3361.90
Different letters in columns indicate significant differences between values according to the t test (p < 0.05).
Table 7. Correlations between variables.
SFAMUFAPUFAHumidity (%)Ash (%)Lipid (%)Protein (%)Carbohydrates (%)nutritional Value (kcal)Walnut Weight (g)Kernel Percentage (%)Size Index (mm)
SFA1
MUFA−0.5061.000
PUFA−0.628−0.3531.000
Humidity (%)−0.224−0.0520.2881.000
Ash (%)−0.3700.0960.316−0.0991.000
Lipid (%)0.111−0.032−0.093−0.3380.4801.000
Protein (%)0.0080.109−0.1100.154−0.3000.0241.000
Carbohydrates (%)−0.002−0.0320.034−0.077−0.272−0.765−0.6041.000
Nutritional value (kcal)0.1220.015−0.147−0.4630.2640.8320.312−0.7431.000
walnut weight (g)−0.183−0.0010.2000.0090.3700.2290.306−0.3910.2671.000
Kernel
percentage (%)
−0.1530.0060.162−0.1490.1170.031−0.3100.183−0.130−0.1511.000
Size index (mm)−0.2720.0040.2920.0230.3450.1730.031−0.1910.2070.822−0.0481
Publisher’s Note: MDPI stays neutral with regard to jurisdictional claims in published maps and institutional affiliations.

