Article

Geographical Distribution and Risk Assessment of Volatile Organic Compounds in Tributaries of the Han River Watershed

Han River Environment Research Center, National Institute of Environmental Research, 42, Dumulmeori-gil 68beon-gil, Yangseo-myeon, Yangpyeong-gun 12585, Korea
*
Author to whom correspondence should be addressed.
Agronomy 2021, 11(5), 956; https://doi.org/10.3390/agronomy11050956
Submission received: 20 April 2021 / Revised: 7 May 2021 / Accepted: 10 May 2021 / Published: 12 May 2021

Abstract

:
Volatile organic compounds (VOCs), with negative impacts on the aquatic ecosystem, are increasingly released into the environment by anthropogenic activities. Water samples were collected from five areas of the Han River Watershed (HRW) tributaries, South Korea, to detect 11 VOCs, which were classified as halogenated aliphatic hydrocarbons (HAHs) and aromatic hydrocarbons (AHs). Among the 11 VOCs, 1,1-dichloroethylene, 1,1,1-trichloroethane, and vinyl chloride were undetected. The highest concentration compounds were chloroform (0.0596 ± 0.1312 µg/L), trichloroethylene (0.0253 ± 0.0781 µg/L), and toluene (0.0054 ± 0.0139 µg/L). The mean concentration (0.0234 µg/L) and detection frequency (37.0%) of HAHs were higher than those of AHs (0.0036 µg/L, 21.0%, respectively). The Imjin Hantan River area exhibited the highest mean concentration (0.2432 µg/L) and detection frequency (22.9%), because it is located near industrial complexes, thus, highlighting their role as important VOC sources. However, the detected VOCs had lower concentrations than those permitted by the EU, WHO, USA, and South Korea drinking water guidelines. Ecological risks associated with the VOCs were estimated by risk quotient (RQ); consequently, the predicted no-effect concentration was 0.0029 mg/L, and the toluene and styrene RQ values were >1 and >0.5, respectively. The findings may facilitate policymakers in designing pollution control strategies.

1. Introduction

Owing to the rapid development achieved in recent years, human activities (industrial, agricultural production, and urbanization) have increased, and a significant amount of artificial organic pollutants have been released into rivers [1,2]. These rivers are regularly subjected to elevated levels of micropollutants arising from anthropogenic activities and natural processes [3]. Among the various micropollutants, volatile organic compounds (VOCs) are primarily recognized as atmospheric pollutants, yet water pollution caused by these compounds is also gaining increasing interest [4].
The anthropogenic sources of VOC pollutants evoke more concern than natural sources. Paint and coatings, oil, solvents, agricultural and municipal wastewater, urban and rural effluents, and atmospheric deposits are the primary sources of anthropogenic VOCs in aquatic ecosystems [5,6].
When VOCs are introduced into water, they can be diluted, become toxic, and biodegradable due to the physical and chemical properties of the water, which can have various effects on the aquatic environment. In particular, VOCs are not readily degraded in water systems, such as surface water and groundwater due to their mobility [7,8].
The most common VOCs are halogenated organics, monocyclic aromatic hydrocarbons (AHs), organic sulfides, BTEXs (benzene, toluene, ethylbenzene and xylenes), and trihalomethanes (THMs) [9]. Due to their chemical properties of low water solubility, high lipid solubility, and semi-volatility, VOCs are widely associated with the manufacture and use of clothes, toys, paints and inks, adhesives, cosmetics, interior and automotive decoration items, etc. [10]. As it is primarily used in household goods, it is often detected in municipal wastewater treatment plants (MWTPs) [11].
VOC exposure can cause sensory irritability, liver and kidney toxicity, nervous system dysfunction, asthma, cancer, and other health hazards. To protect human health, VOCs have been classified as priority pollutants and are considered in drinking water quality requirements [12]. They are included in the category of aesthetic and hazardous organic compounds in the national water quality standard for domestic drinking water in Korea. Thus, pollution caused by VOCs in the water systems has received considerable attention with the advancement of VOC research [13].
The quality of surface water is deteriorating because of high population density and industrial development [12]. Currently, several studies have been investigating the concentration of VOCs in surface water [14,15,16,17,18].
Much information is lacking on the reduction of currently controlled VOCs and the possible health effects of untreated pollutants. Thus, present concentration data and relative risk statistics are inadequate to define the most critical parameters and do not include detailed hazard information [19]. Recently, studies on possible ecological risk and exposure to aquatic species have been conducted to obtain an in-depth understanding of the risks associated with individual VOCs, particularly through ecological risk assessments [17].
In the Han River Watershed (HRW), VOCs could be discharged into surface water in downstream areas, specifically as non-point pollutants in agricultural areas and point pollutants in wastewater discharge facilities in industrial complexes. Therefore, extensive analysis is required to determine the toxic effects of VOCs on surface water quality. A study was conducted in 2010 by Cho et al. [5] on VOCs in water. Although 11 VOCs were investigated in the main streams of the four major rivers of South Korea, additional investigations for new VOCs, as well as studies on the tributaries where pollutants are generated, are needed. Therefore, the present study was conducted as part of a national research project to understand the current status of VOC concentrations in surface water in the HRW by investigating 11 VOCs, namely halogenated aliphatic hydrocarbons (HAHs) and AHs. The objectives were to: (1) evaluate the general trends of VOCs and compare them with VOC standards in different countries, (2) determine the distribution of VOC concentrations of HAHs and AHs, (3) evaluate the geographical distribution and causes of VOC pollutants and identify potential pollution sources, such as MWTP and industrial wastewater treatment plants (IWTPs), and (4) perform an ecological risk assessment. The findings of this study may help identify the VOC distribution in the HRW and contribute to the design of pollution control strategies by policymakers.

2. Literature Review of VOCs in Water

With industrialization and urbanization, VOCs have been widely produced and used in the United States since the 1940s. Therefore, the concentration of VOCs in the environment is increasing, and most VOCs that have been studied are in the atmosphere [4,20,21]. Recently, research on various environmental media has been conducted in the order of atmosphere > water > indoor > groundwater > sediment > rainwater (Figure S1). However, VOCs in the atmosphere are not only soluble in water in their natural state, but also act as pollutants in the aquatic ecosystem, as well as affecting human health. Such VOCs can have negative effects, so it is necessary to also study VOCs in the water environment [12,13,14,17].
Research is being conducted in the water environment in various countries: the Netherlands (surface water and river) [22], Greece (surface water) [23], Portugal (surface water) [24], Belgium (surface water) [25], Japan (rainwater) [26,27], the USA (rainwater) [28], Austria (rainwater) [29], Serbia (rainwater) [30], Nigeria (surface water, effluent of M/IWTP) [18], Taiwan (effluent of M/IWTP, rainwater, surface water) [31,32], China (effluent of M/IWTP) [6], and South Korea (surface water, effluent of M/IWTP) [5]. The reported concentration range of VOCs in the water environment ranged from several ng/L to mg/L, and was mainly the highest in the effluent of IWTP.
The most important aspects of monitoring research are that well-managed analytical equipment, and various application methods for gas and liquid chromatography (GC and LC) are used. The method detection limit (MDL) and limit of quantitation (LOQ) differ for each compound, but are mainly between several ng/L and tens of ng/L [5,6,18,22,23,24,25,26,27,28,29,30,31,32]. The most important method for water environment management is obtaining accurate monitoring and analysis results, and the accumulated results will be used as important data for policy decisions.

3. Materials and Methods

3.1. Chemicals Used

The 11 target VOCs belong to two different groups: (1) HAHs, namely 1,1-dichloroethylene (1,1-DCE), 1,1,1-trichloroethane (1,1,1-TCA), bromoform, chloroform, tetrachloroethylene (PCE), trichloroethylene (TCE), and vinyl chloride; and (2) AHs, including naphthalene, styrene, toluene, and (m,p,o-)xylenes. Table S1 lists their compositions and chemical formulas. Internal standards used in the experiments were fluorobenzene, 1,4-dichlorobenzene-d4, and chlorobenzene-d5 purchased from Accu Standard Chemicals (New Haven, CT, USA). All the standards and internal standards were prepared in methanol and refrigerated before use; however, they were also used fairly quickly. A Purelab DV35 water filtration device generated ultrapure deionized water (ELGA LabWater, Buckinghamshire, UK). The chemicals used in this study were of analytical grade or higher, unless stated otherwise.

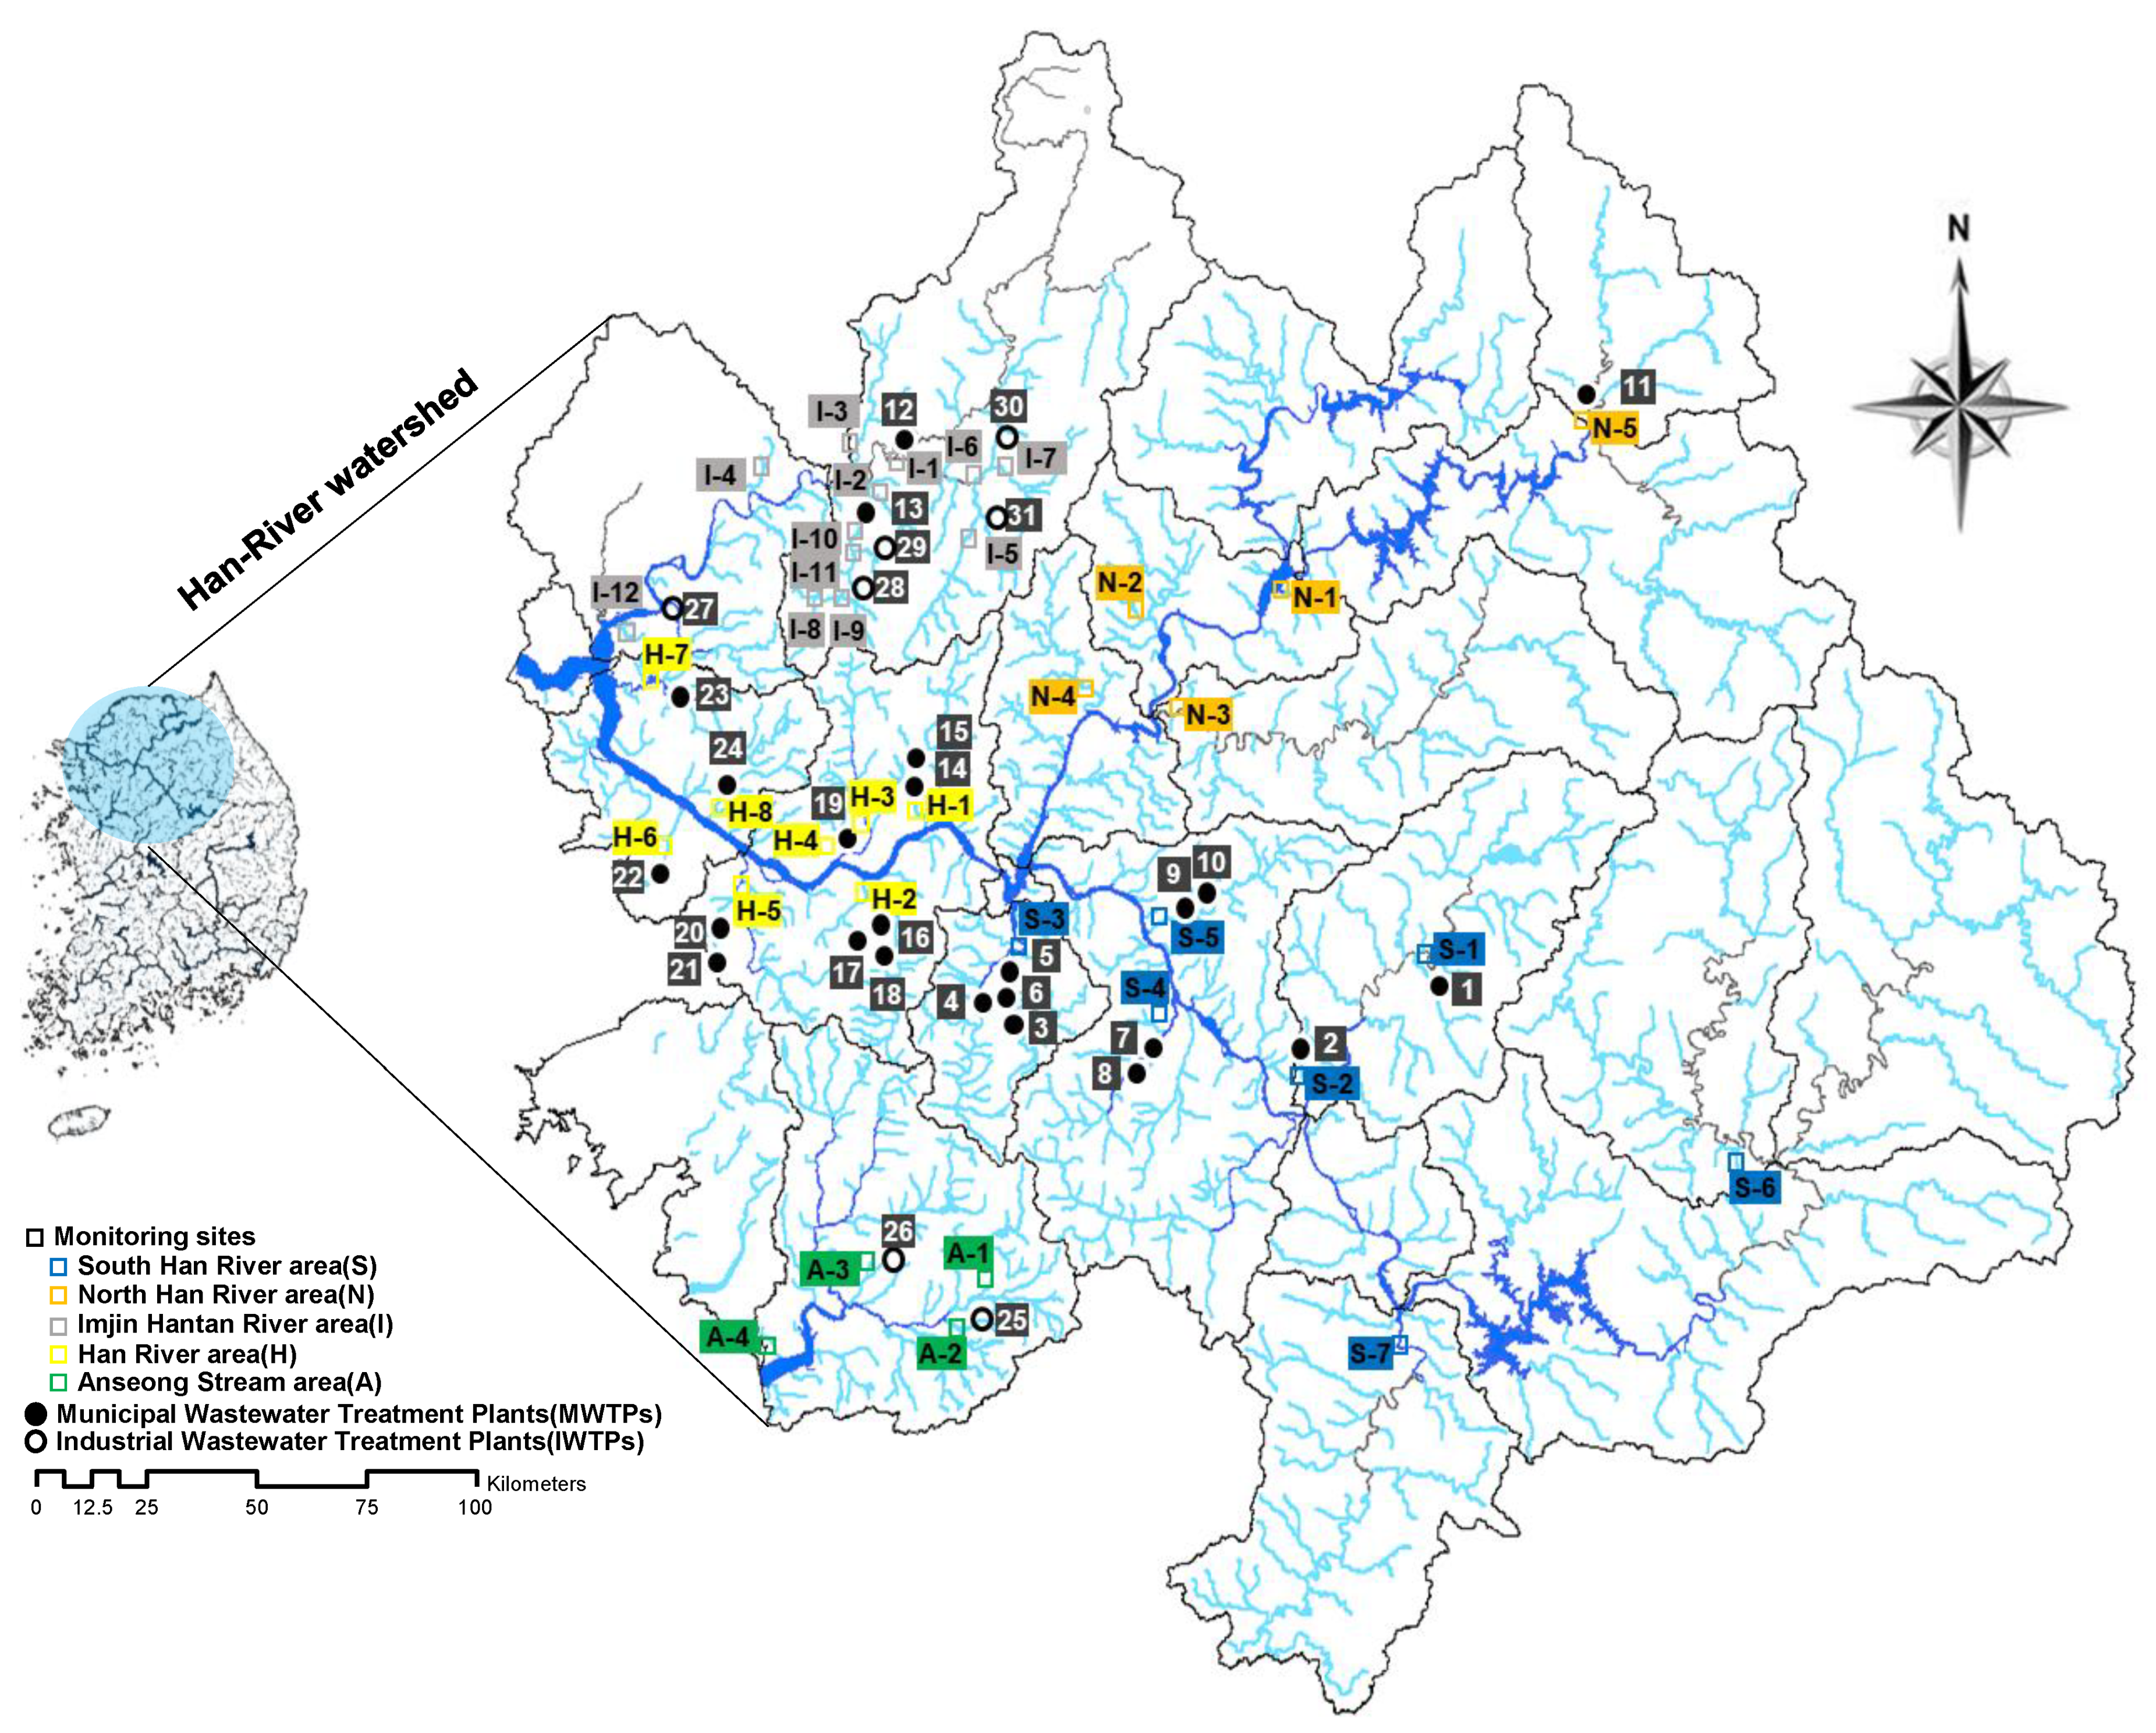
3.2. Sample Collection

Among the four major watersheds in South Korea, the HRW is an important drinking water source for the largest number of people in the region, including the capital. In this study, the watershed was geographically divided into five areas: seven sites at the South Han River (S), five at the North Han River (N), eight at the Han River (H), 12 at the Imjin Hantan River (I) and four at the Anseong Stream (A). Thus, a total of 36 sites were selected to represent the upstream and downstream sites of MWTP and IWTP, as well as the confluence of tributaries (Figure 1). One water sampling was conducted in October 2016. Geographic coordinates were measured at each sampling site using a handheld global positioning system and summarized in Table S2. The sampling points and the coordinates of the MWTP and IWTP are described in Table S3.
Water samples were collected in a Teflon bailer (1536-STDB-VT, ESS, San Jose, CA, USA), transferred to pre-cleaned 40 mL brown amber glass vials with open-top screwcaps and Teflon-lined septa without headspace. Collected samples were immediately stored at 4 °C in the ice-filled cooler transported to the laboratory prior to analysis and were analyzed after four days. Water quality was measured with a YSI-556 MPS water quality meter (YSI Inc., Yellow Springs, OH, USA) during sampling, and the results are shown in Table S4.

3.3. Analytical Method and Quality Analysis

Before the analysis, 50 µL of IS mixed solution (0.2 µg/mL in methanol) was added to each 40 mL sample. The analytes were separated using an Agilent DB-624 column (length = 60 m, internal diameter = 0.32, and film thickness = 1.8 µm) installed in a Scion SQ 456-gas chromatography/mass spectrometry (GC/MS) system (Bruker, Billerica, MA, USA) combined with purge-and-trap (P and T) automatic sampler (AQUATek 100, Teledyne Tekmar, Mason, OH, USA) and by following the standard methods in US EPA 524.2/8260. The injector was run in splitless mode at 250 °C for 5 min before being purged. The carrier gas used was 1.0 mL helium (air gas, 99.999% purity) at a steady flow rate. The temperature of the column was varied as follows: set at 30 °C for 2 min, then raised to 140 °C at 8 °C/min for 10 min, and finally raised to 220 °C at 30 °C/min for 4 min. The ionization was achieved at 70 eV in the electron impact mode and the data were obtained in selected ion monitoring mode (Table 1). VOCs were detected by comparing retention times between samples and a standard solution containing individual VOCs. To test and determine the precision of the VOCs analysis, we performed spike and recovery tests and verified the linearity of the dilution experiment. Field samples and quality assurance/quality control (QA/QC) samples were processed similarly. Linear calibrations were obtained with correlation coefficients greater than 0.99 in the range of 0.03–100 µg/L. The average recoveries for the target VOCs ranged from 89–118%, with relative standard deviations ranging from 1.1% to 6.7%, and the MDL and LOQ for the target compounds ranged from 0.005–0.012 µg/L and from 0.016–0.038 µg/L, respectively. Reagent blank analysis shows no pollutant in the analysis system and glass products. Table 1 presents detailed information on the aforementioned experiments.

3.4. Data Analyses

Excel 2016 (Microsoft Co., Redmond, WA, USA) was used to compute descriptive statistics (minimum, maximum, mean, and frequency of detection), while Sigmaplot 12.0 (Systat Inc., Point Richmond, CA, USA) was used to plot graphs. To assess variations in prescription residual quantities, a one-way analysis of variation and two-sample paired t-test were used. Using Minitab 15 (Minitab Inc., State College, PA, USA), variations were deemed significant if they were less than 0.05. ArcGIS 9.2 (ESRI, Redlands, CA, USA) was used to construct a visual map of the HRW.

3.5. Evaluation of Ecological Risks

Based on the maximum value of measured environmental concentration (MEC), we calculated the risk quotients (RQs) of the detected VOCs to estimate their ecological risks. Briefly, the predicted no-effect concentration (PNEC) value was derived using toxicity data from the US Environmental Protection Agency (US EPA) ECOTOX database (http://cfpub.epa.gov/ecotox (accessed on 26 March 2021)) and the assessment factor (AF) was determined based on the technical guidance of the European Commission (2018) [33]. The RQ values of each VOC were obtained by dividing the highest MECs by the PNEC. If the RQ value was greater than one, the existence of a potential ecological risk can be inferred. Detailed calculations are described in Table 2.

4. Results and Discussion
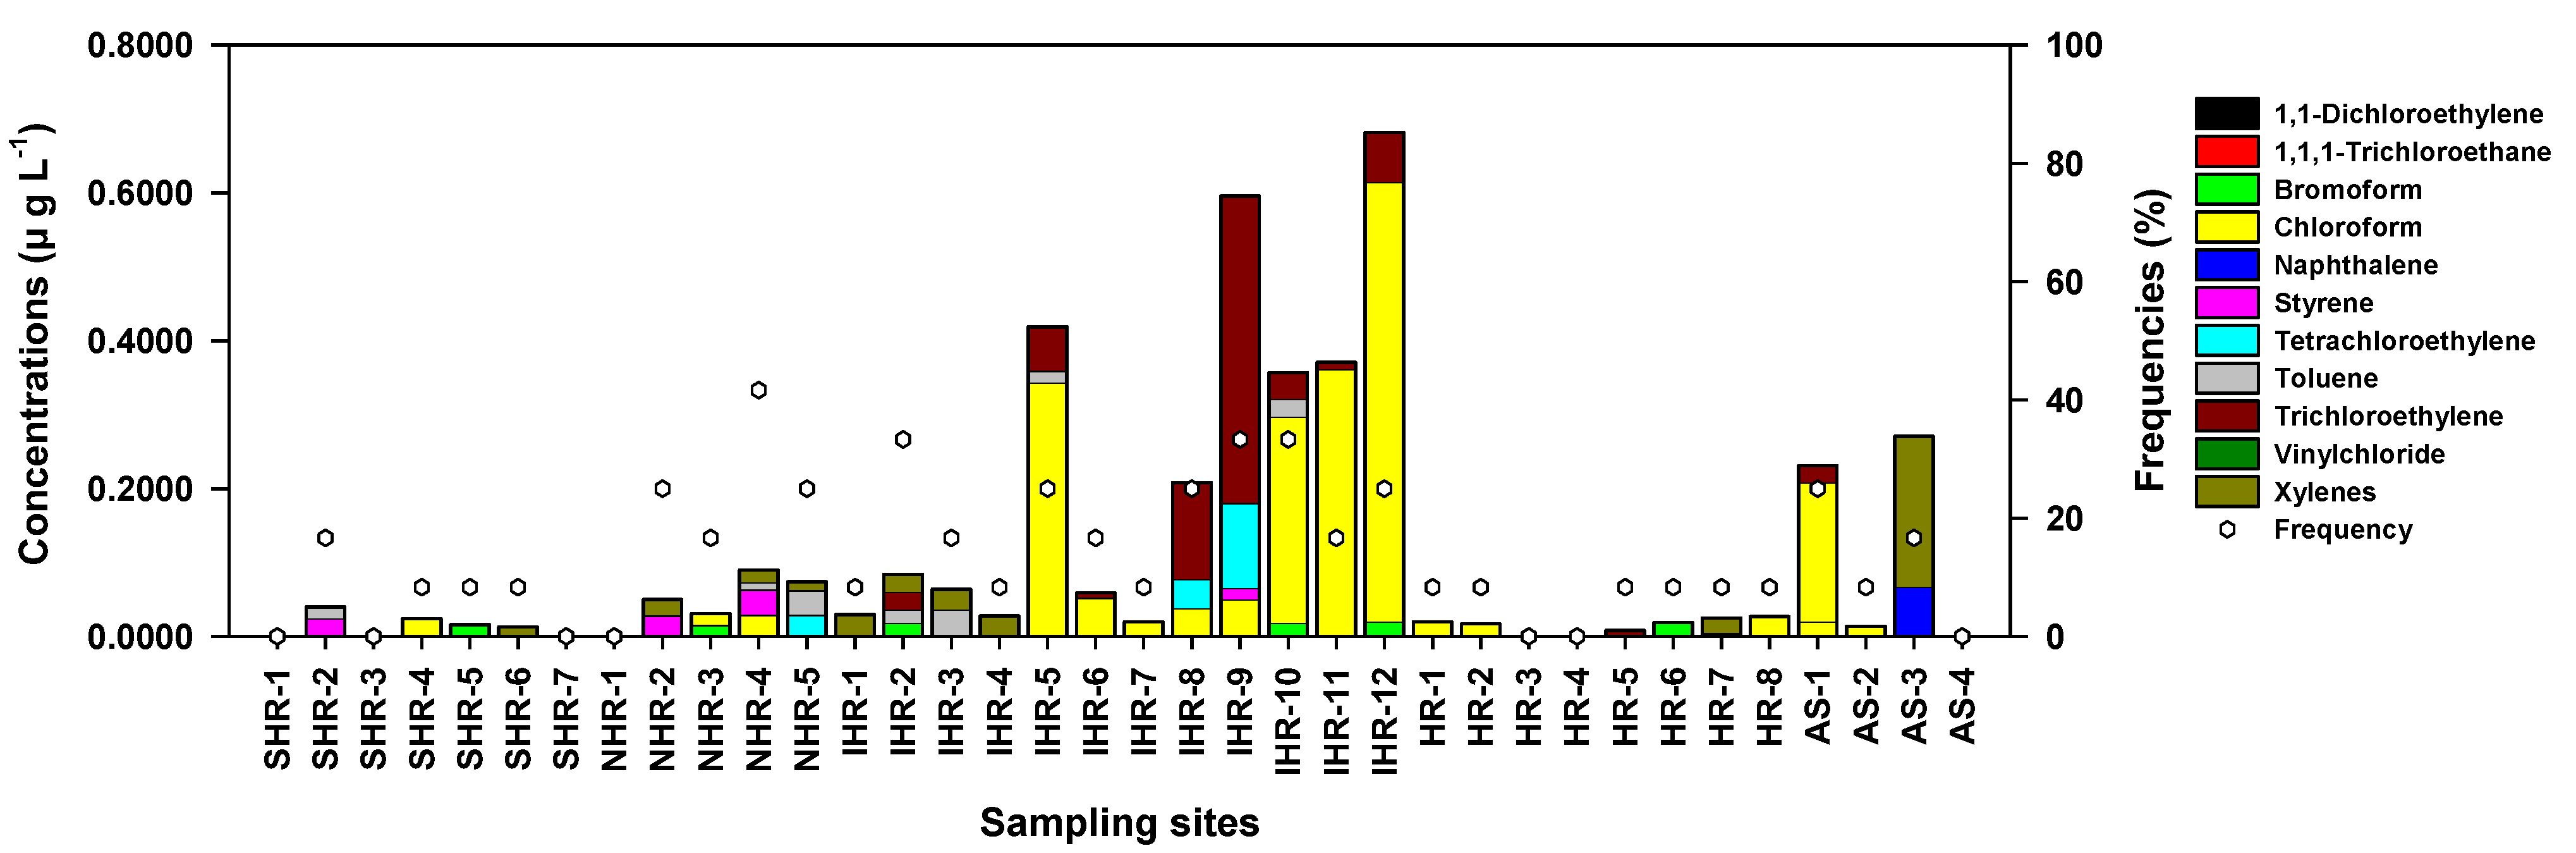
4.1. General Trends

The concentrations and detection frequencies of all target VOCs detected in the samples collected from the HRW are shown in Table 3. All the analyzed VOCs, except for 1,1-DCE, 1,1,1-TCA and vinyl chloride, were detected indicating the widespread occurrence of VOCs in the tributaries in the HRW. In contrast with our results, 1,1-DCE in the HRW and in the Yeongsan River Watershed ranging from 0.014 to 0.231 µg/L with a median concentration of 0.03 ± 0.0525 µg/L at frequencies of 11.5% and 2.2%, respectively, were detected by Cho et al. [5].
Of the 11 detected VOCs at 36 sites, chloroform had the highest concentration level at a mean of 0.0596 ± 0.1312 µg/L, followed by TCE with a mean of 0.0253 ± 0.0781 µg/L, and toluene with a mean of 0.0054 µg/L. This showed that the three high total VOC concentrations accounted for 83.6% of all the VOC concentrations, which may be attributed to their extensive use and pseudo-persistence in aquatic environments [6,42].
On the basis of the detection frequencies, the five most frequently detected compounds (>15%) were chloroform, TCE, xylenes, bromoform, and toluene. Meanwhile, naphthalene, styrene, and PCE were detected less frequently.
Target VOCs were classified into HAH and AH according to the properties of the compound, and the mean concentration and detection frequency of HAHs (0.0234 µg/L, 37.0%) were comparatively higher than those of AHs (0.0036 µg/L, 21%). These results could be attributed to the considerably high-water solubility of HAHs, despite their high vapor pressures. This occurrence is consistent with the results of numerous studies conducted outside Korea [43,44,45].

4.2. Halogenated Aliphatic Hydrocarbons (HAHs)

HAHs are organic chemicals in which one or more hydrogen atoms have been substituted by a halogen and they do not contain a benzene ring [46]. The HAHs commonly used in industries are mostly volatile liquids. Most HAHs are not flammable and explosive, commonly used as solvents, chemical raw materials or intermediates, and widely used in industries [6].
Furthermore, as their use and production are governed by the Montreal and Kyoto Protocols, halogen-containing VOCs are possible greenhouse gases and ozone depletors [47].
The detected HAHs were 19.4% of bromoform, 47.2% of chloroform, 8.3% of PCE, and 27.8% of TCE, with the total concentrations at 2.1450 µg/L for chloroform and 0.1310 µg/L for bromoform (Table 3). These compounds are highly volatile and have a high resistance to degradation [6].
For several years, PCE and TCE were widely used as synthetic solvents, degreasing agents, and dry-cleaning agents. Moreover, the intermediate vinyl chloride is commonly observed in both anaerobic and aerobic conditions [48]. It is more easily biodegraded through oxidative pathways, either cometabolically or metabolically [49], than its highly chlorinated parent compounds (PCE and TCE). Therefore, despite the presence of PCE and TCE, the intermediate vinyl chloride was not detected in the study sites.
Among the HAHs in all industrial areas, chloroform was detected at maximum concentration. As the pollutant has anthropogenic sources, this finding can be explained by the results of McCulloch’s study, which shows that chloroform occurs in pulp and paper manufacturing, waste incinerators, and other industrial activities [42,50]. The chloroform generated in water diffuses into the atmosphere because of its low solubility in water and high vapor pressure [51]. An overall overview of environmental monitoring throughout different sites across China, including the Beijing, Shanghai, and Yangtze delta and Pearl River delta, indicates that HAHs, particularly chloroform, PCE, and TCE, are among the most commonly recognized pollutants [43,44,52,53]. Furthermore, chloroform is a representative pollutant recognized by more than half of the sites in the United States Environmental Protection Agency (US EPA) National Priority List (NPL), and it is the most commonly-identified pollutant, as indicated by the US Geographical Survey [54,55,56]. Another possible reason for the highest chloroform concentration in water may be partly due to natural emissions, such as from marine seawater [57,58], soil processes [59], and geological distribution [60]. The concentrations of HAHs detected in this study were below the water quality guidelines of EU, USA, WHO, and South Korea (Table S4).
Target VOCs were classified in HAH and AH according to the properties of the compound, and the mean concentration and detection frequency of HAHs (0.0234 µg/L, 37.0%) were comparatively higher than those of AHs (0.0036 µg/L, 21%). These results could be attributed to the considerably high water solubility of HAHs, despite their high vapor pressures. This occurrence is consistent with the results of numerous studies conducted outside Korea [43,44,45].

4.3. Aromatic Hydrocarbons (AHs)

Among the VOCs investigated in this study, AHs are a typical class of priority organic pollutants, produced in substantial amounts by human activities, that are carcinogenic and prioritized due to their persistence and long-distance transport properties [46]. AHs commonly occur in various components of global ecosystems [61]. They are ubiquitous in the environment due to various anthropogenic activities in industrial and agricultural production processes [1,62]. The frequency of target AHs varied from 2.8% to 25.0%, with mean concentrations ranging from 0.0004 ± 0.0025 µg/L (naphthalene) to 0.0054 ± 0.0139 µg/L (toluene) (Table 3). Although AHs have a lower concentration and frequency rate than HAHs, they are toxic, mutagenic, and carcinogenic to ecosystems and humans, which generates an increasing attention to their environmental and public health impacts [1,63]. Toluene, also known as a BTEX compound, is a monocyclic aromatic compound present in crude oil. It is a VOC and a major component of petrochemicals [64], BTEX, when discharged into a water body, alters its chemical structure, and causes adverse impacts on biota [65].
The toluene and xylenes concentrations in the HRW surface water were lower by several orders than those of not only the Netherland surface water from Rhine, Meuse, Northern Delta area, Western Scheldt rivers [22], surface waters of Greece [23], Portugal [24], Belgium [25], Taiwan [32], and Nigeria [18], but also the rainwater of Japan [26,27], USA [28], Australia [29], and Serbia [30]. This implied that wet deposition could be partially considered as a reason for the increased VOC concentrations in surface water and rainwater. In this study, the HRW could be affected by numerous factors, including the volatility of emissions, distance from the emission source, biodegradation instability, and photochemical systems. The comparatively low concentrations of BTEX observed in surface water could be attributed to BTEX oxidation and reduction by natural microbial biodegradation activity [66,67] or the photochemical conversion of BTEX into other compounds, such as benzaldehyde, benzoic acids, phenol, and formic acid, which are finally mineralized [68,69]. The surface water concentrations of naphthalene, styrene, toluene, and xylenes in the HRW were lower than all the listed standards (Table S5). Although low concentrations of VOCs and BTEX were detected, as in Iordache [70], it is necessary to assess pollutant dynamics using a fugacity-based model to comprehensively understand the transport of pollutants in the environment in the future.

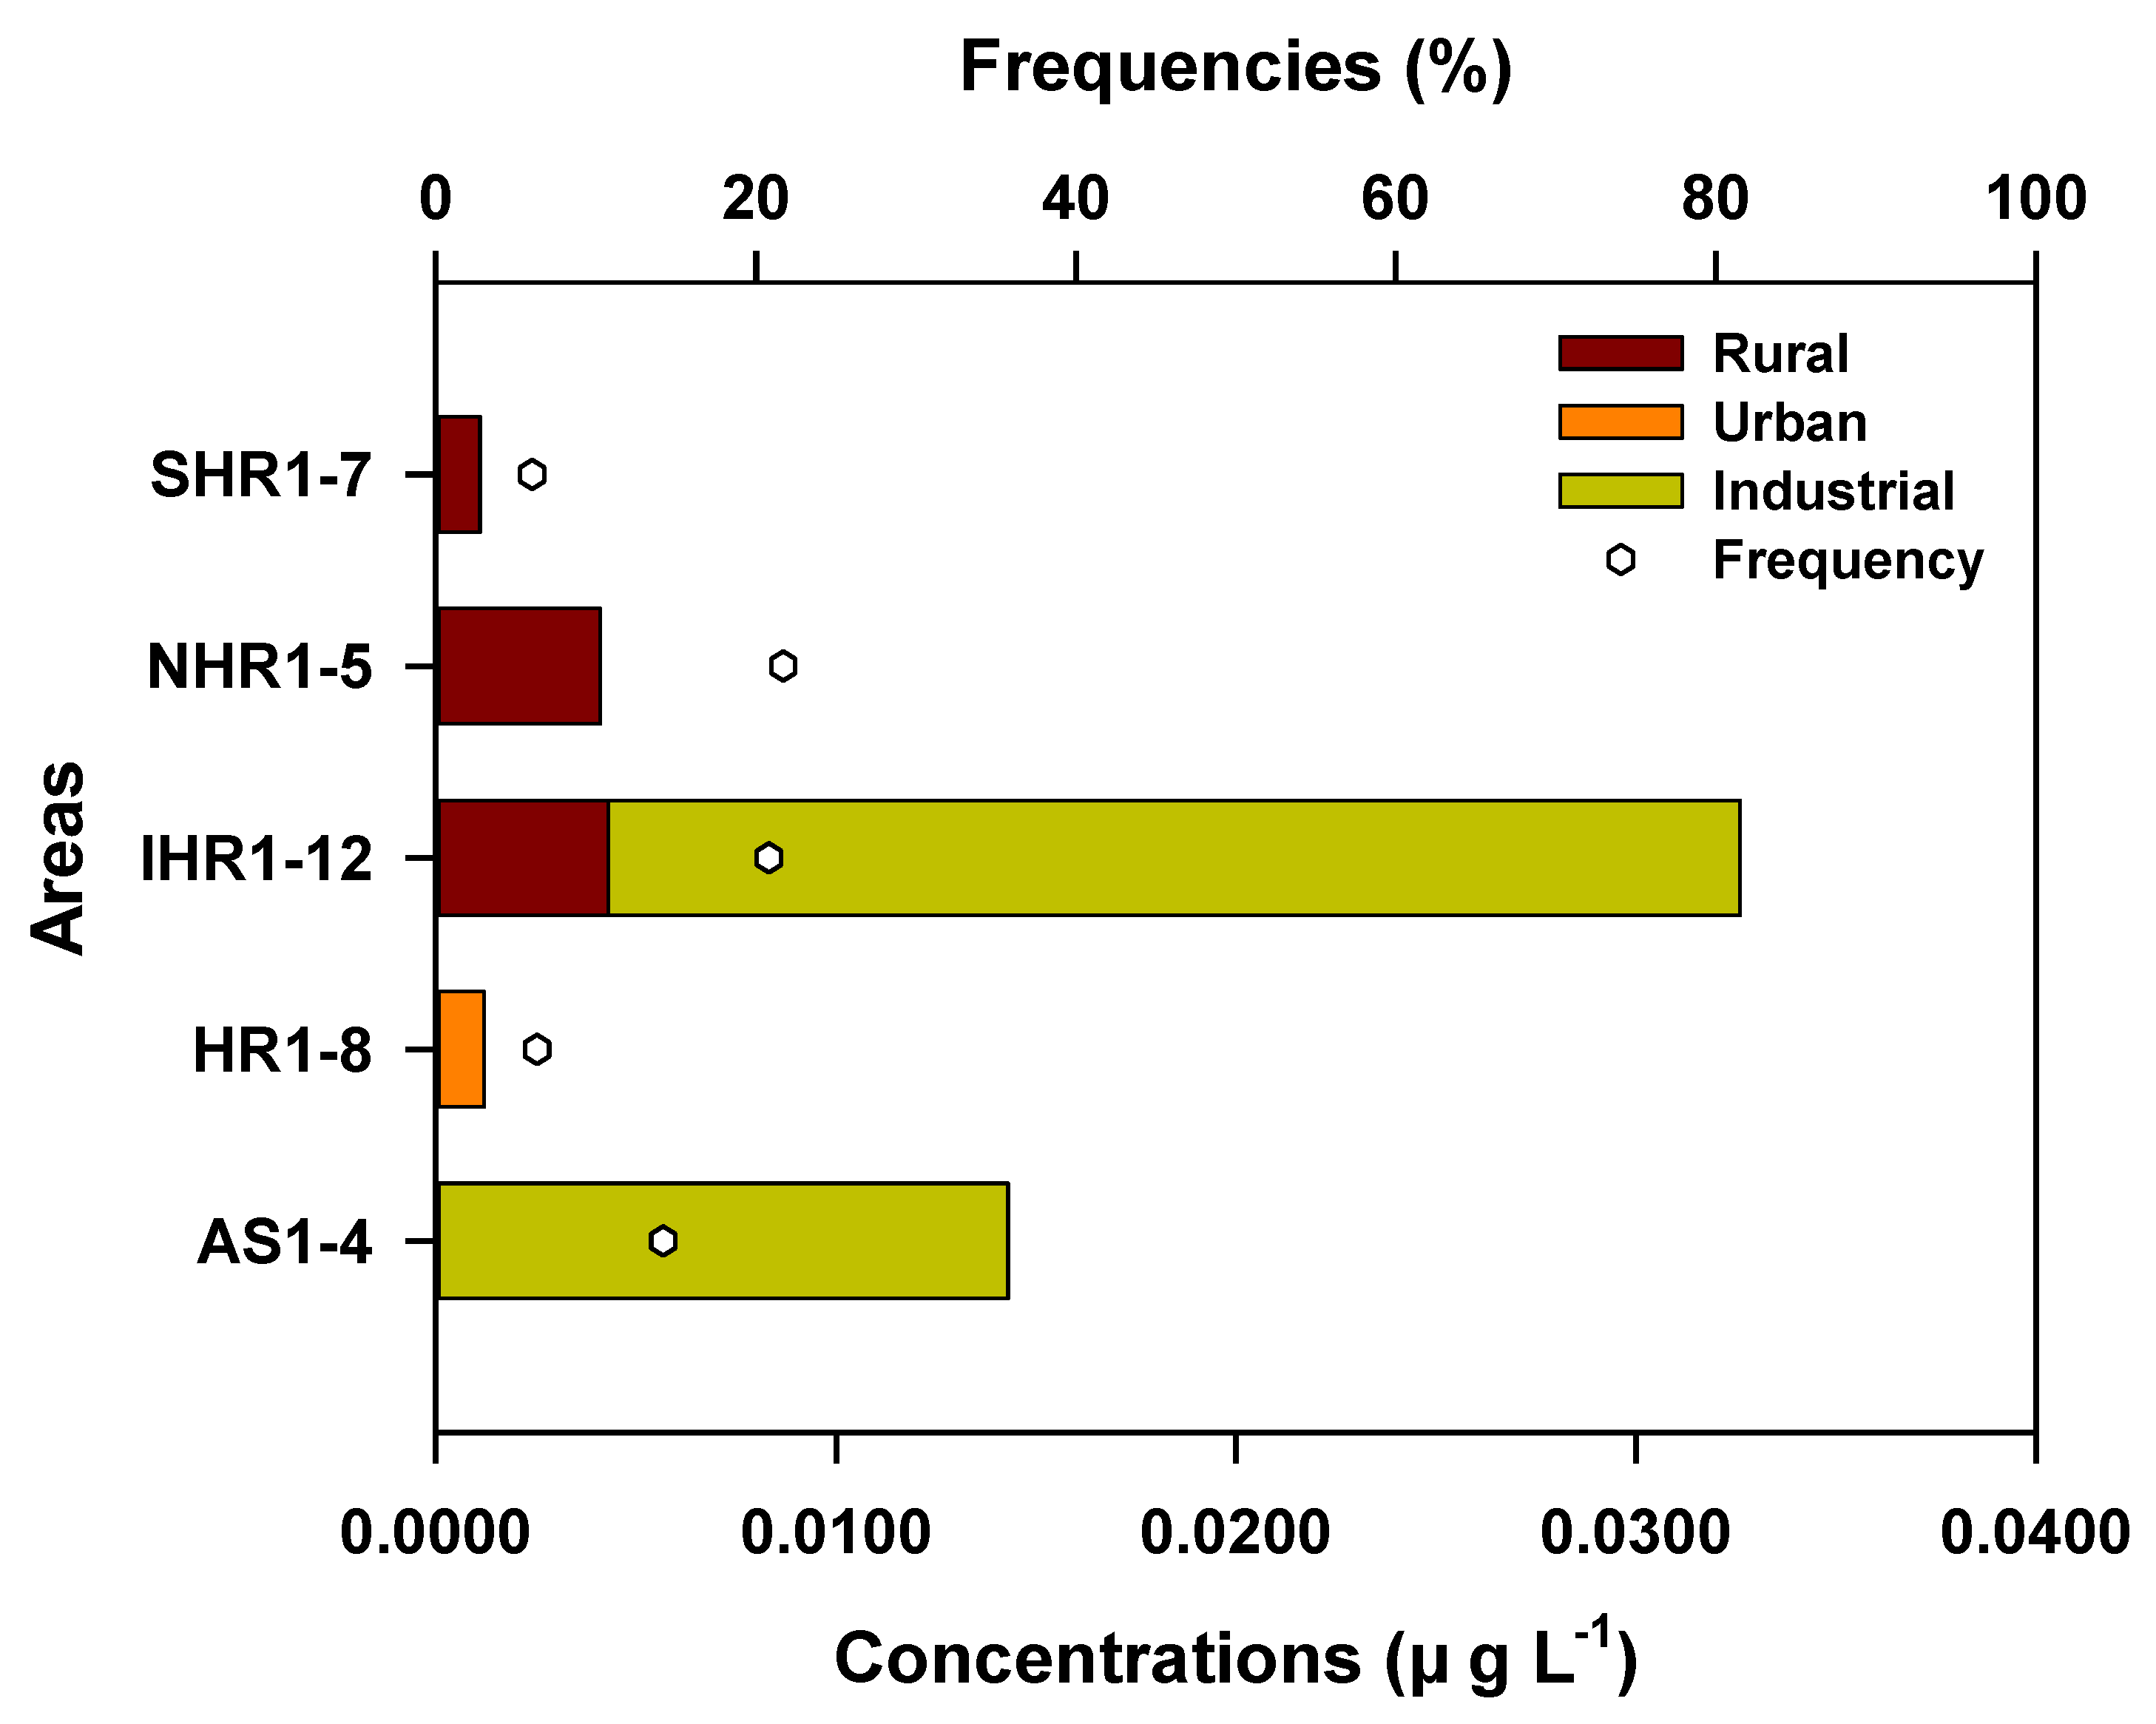
4.4. Geographic Distribution and Sources of VOCs

The geographic distribution of VOCs in the HRW is shown in Figure 2 and Table S6. The VOC concentrations of collected water samples and the main sources are listed in Tables S2 and S3. At the sampling sites S-1–S-7, N-1–N-5, H-1–H-8, and A-1–A-4, the concentrations of 11 target VOCs were n.d.–0.0400 µg/L (at a mean of 0.0133 µg L−1), n.d.–0.0900 µg/L (at a mean of 0.0490 µg/L), n.d.–0.0270 µg/L (at a mean of 0.0145 µg/L), and n.d.–0.2710 µg/L (at a mean of 0.1290 µg/L). In contrast, at the sampling sites of I-1–I-12 located near the numerous industrial complexes in the Gyenggi province area, the concentrations ranged from 0.0200–0.6820 µg/L, with a mean of 0.2432 µg/L (Figure 3).
Among the different areas, the highest mean concentrations (0.2432 µg/L) and detection frequencies (22.9%) were found in the Imjin-Hantan River area. Most of the sites were in close proximity to commercial areas (I-5–I-12) and downstream of MWTPs and IWTPs, except for I-3 and I-4. Thus, low VOC concentrations were detected at I-1 (0.0025 ± 0.0087 µg/L) and I-2 (0.0070 ± 0.0105 µg/L), downstream of the MWTPs (of capacities 2.1 × 10³ m3/d and 86 × 103 m3/d, respectively), and no pollutant was present in the upstream at I-3 (0.0053 ± 0.0126 µg/L) and I-4 (0.0023 ± 0.0081 µg/L). The highest concentrations of VOCs were detected at I-12 (0.6820 µg/L), at a 25.0% detection frequency. I-12 t located downstream of IWTP-27 (185 × 103 m3/d in capacity), which is the main wastewater treatment facility in the Gyeonggi province. In addition, the Paju LCD general industrial complex, located upstream of the I-12, covers an area of 1,740,554.8 m2, and comprises industries including chemicals, electronic components, computers, video, audio and communication equipment. Thus, this site (I-12) directly receives the treated wastewater from these industrial facilities.
The VOC concentrations of I-5 influenced by IWTP-31 (18.8 × 10³ m3/d in capacity) were approximately seven times higher than that of I-6 located downstream of I-5. The IWTP-31 belongs to the Pocheon Jangja Industrial complex (area of 484,000 m2, 1.34 km from IWTP-31 to I-5), which includes leather, bag, shoe manufacturing, chemical and chemical product manufacturing industries, and has a treatment capacity of 18.8 × 10³ m3/d. The low concentration at I-6 could be attributed to the effects of natural attenuation, such as dilution [71,72], adsorption [73,74], volatilization [75,76], and microbial degradation [77,78].
The lowest concentration detected at I-7 showed that IWTP-30 located upstream had little effect on the VOC concentration. I-9 had 2.9 times higher VOC concentration than that of I-8, which may be because I-9 is adjacent to the industrial complexes (Yangju Geomjun and Yangju Hongjuk). The Yangju Doha Industrial Complex and Yangju Doha 2 Industrial Complex located upstream of I-8, do not discharge the generated wastewater to nearby rivers, but collect and treat them at other IWTPs. Hence, these industrial complexes can be considered to have no effect. I-11 and I-10 were in locations similar to I-9 and I-8, thus, I-11, adjacent to the industrial complex, showed significantly high VOC concentrations. According to the above results, the highest concentrations of VOCs were detected in the Imjin-Hantan River area, which could be because the various industrial complexes and their wastewater treatment facilities acted as the main sources of pollution. This result is consistent with the findings of other studies conducted outside Korea [5,6,18,79].
A-1–A-4, which is the second highest concentration area, had a range of n.d.–0.2710 µg/L, with the highest concentration of VOCs detected in the order A-1, A-2 and A-3, which are located in the order of closest distance from each industrial complex. However, no VOCs were detected in A-4, because it was not affected by the industrial complex.
The N-1–N-5 sites belong to rural areas, where the VOCs concentrations ranged n.d.–0.0900 µg/L, with the highest and next highest concentrations detected at N-4 and N-5, respectively. In addition, low concentrations were detected at N-2 and N-3, and no pollutant was present in the upstream. Notably, there is a park near N-1, where no VOCs were detected, and this may have rendered the pollution from the population insufficient to generate VOCs.
All the South Han River sites correspond to rural areas, similar to the North Han River sites. Three (S-4, S-5, and S-6) of these sites with detected VOCs are located downstream of the MWTP. Among the three sites, S-6 was only slightly affected, as the MWTP is 24 km above the upstream, and the effect may be attributed to the non-point source. Among the five investigated areas, the South Han River area was found to have the lowest pollution from VOCs. Therefore, it was determined to be the cleanest area.
Han River is an area in Seoul with a high population density and large MWTPs. However, the second lowest VOC concentrations among the five areas were detected in the Han River area, with a range of n.d.–0.0270 µg/L and not detected in H-3 and H-4. The detection frequencies at each of the other Han River sites (H-1, -2, -5, -6, -7, and -8) were equal to 8.3%, and the concentrations at these sites were also detected at similar levels. The reason for the low VOC concentrations in the Han River area must be identified through further investigation. This is because, in some studies, high concentrations of VOCs were observed in large cities with high population density and many commercial facilities [6,15,80]. However, the possible causes may be the high removal rate of pollutants of MWTPs, well-managed modern facilities, and no large industrial complexes.

4.5. Risk Assessment

The calculated RQ values obtained in the present study based on the highest MECs are depicted in Figure 4 and Table 2. Among the eight VOCs detected in our samples, only one compound, toluene, had an RQ value greater than one (RQ = 1.2), indicating its ecological risk in the Han River. The PNEC of toluene was determined as 0.0580 µg/L, based on the lethal concentration at 10% (LC10) of 0.0029 mg/L in embryo-larval stages of rainbow trout [39] and at AF of 50 [33]. Adverse effects of toluene on survival, growth, and reproduction in other aquatic species, including algae, daphnia, and fathead minnow, have also been reported previously [81,82,83]. In human beings, exposure to toluene could lead to long term health effects, such as neurotoxicity [84]. Styrene exhibited a considerably high RQ value of 0.54 in this study. Although the value was below one, this implied considerable potential ecological risk from this compound as well. For other VOCs, the potential risk in aquatic environments was significantly low (RQ < 0.2). However, the calculated risk in this study must be carefully interpreted, because the monitoring data must be verified through repeated sampling and the available ecotoxicological information is not adequate.

5. Conclusions

In this study, 11 VOCs were investigated at 36 sites in five areas of the HRW in October 2016. Tributaries susceptible to the effects of pollutants were focused on, and the general trends, distribution of HAHs and AHs, geographic distribution, potential sources, and risks of VOCs were observed. The considerably high concentrations and detection frequencies in these areas were investigated, and the results showed maximum concentrations of 0.5940, 0.9110, and 0.1960 µg/L and detection frequencies of 47.2%, 27.8%, and 19.4% for chloroform, TCE and toluene, respectively. However, three VOCs (1,1-DCE, 1,1,1-TCA, and vinyl chloride) were not detected at all.
VOCs belonging to HAHs were observed with a considerably high mean concentration (0.0234 µg/L) and detection frequency (37.0%) than those of AHs (0.0036 µg/L, 21%). Significant concentration differences were observed among the five areas (p < 0.001). In particular, the Imjin-Hantan River area recorded the highest mean concentration (0.2432 µg/L) and detection frequency (22.9%). This could be attributed to the presence of large industrial complexes and IWTPs around it. Thus, industrial facilities were found to have a high possibility of being a major source of VOC pollution. Nevertheless, the concentrations of VOCs detected in the HRW were lower than those of the drinking water quality standards by the EU, WHO, USA, and South Korea. Most VOCs showed negligible risks in this study, however, our risk assessment results implied that certain VOCs, particularly toluene, may pose a threat to the ambient ecosystem. Continuous monitoring and regulation of emissions are required to manage these risks. The calculated risk in this study must be carefully interpreted, because the monitoring data must be verified through repeated sampling experiments and the available ecotoxicological information is not adequate. Moreover, future studies should further investigate the reason for the low VOC concentrations detected in the Han River area in this study and should plan for new VOC investigations.

Supplementary Materials

The following are available online at https://www.mdpi.com/article/10.3390/agronomy11050956/s1, Figure S1: Published articles in various environmental media researched from Web of Science, Table S1: Physiochemical properties of target VOCs, Table S2: Information of sampling sites and its coordinates, Table S3: Information of municipal/industrial wastewater treatment plants, Table S4: Water quality at the sampling sites, Table S5: Water quality standards for VOCs at each country, Table S6: Concentration of VOCs detected at each site.

Author Contributions

Conceptualization, J.-K.I. and Y.-C.C.; methodology, H.-R.N.; software, Y.-C.C.; validation, J.-K.I. and H.-R.N.; formal analysis, H.-R.N.; investigation, H.-R.N.; resources, S.-J.Y.; data curation, H.-R.N.; writing—original draft preparation, J.-K.I.; writing—review and editing, J.-K.I., Y.-C.C., H.-R.N. and S.-J.Y.; visualization, J.-K.I.; supervision, S.-J.Y.; project administration, H.-R.N.; funding acquisition, H.-R.N. All authors have read and agreed to the published version of the manuscript.

Funding

This research was supported by the National Institute of Environmental Research (NIER) [grant number NIER-2019-01-01-065], funded by the Ministry of Environment (MOE) and Environmental Fundamental Data Examination Project of Han River Basin Management Committee of the Korea.

Institutional Review Board Statement

Not applicable.

Informed Consent Statement

Not applicable.

Data Availability Statement

Not applicable.

Conflicts of Interest

The authors declare no conflict of interest.

References

  1. Wang, J.-Z.; Guan, Y.-F.; Ni, H.-G.; Luo, X.-L.; Zeng, E.Y. Polycyclic aromatic hydrocarbons in riverine runoff of the Pearl River Delta (China): Concentrations, fluxes, and fate. Environ. Sci. Technol. 2007, 41, 5614–5619. [Google Scholar] [CrossRef] [PubMed]
  2. Li, R.; Liang, J.; Gong, Z.; Zhang, N.; Duan, H. Occurrence, spatial distribution, historical trend and ecological risk of phthalate esters in the Jiulong River, Southeast China. Sci. Total Environ. 2017, 580, 388–397. [Google Scholar] [CrossRef]
  3. Warner, W.; Licha, T.; Nödler, K. Qualitative and quantitative use of micropollutants as source and process indicators. A review. Sci. Total Environ. 2019, 686, 75–89. [Google Scholar] [CrossRef] [PubMed]
  4. Wu, Y.; Wang, X.; Ya, M.; Li, Y.; Hong, H. Seasonal variation and spatial transport of polycyclic aromatic hydrocarbons in water of the subtropical Jiulong River watershed and estuary, Southeast China. Chemosphere 2019, 234, 215–223. [Google Scholar] [CrossRef] [PubMed]
  5. Cho, E.; Khim, J.; Chung, S.; Seo, D.; Son, Y. Occurrence of micropollutants in four major rivers in Korea. Sci. Total Environ. 2014, 491, 138–147. [Google Scholar] [CrossRef]
  6. Huang, B.; Lei, C.; Wei, C.; Zeng, G. Chlorinated volatile organic compounds (Cl-VOCs) in environment—sources, potential human health impacts, and current remediation technologies. Environ. Int. 2014, 71, 118–138. [Google Scholar] [CrossRef]
  7. Jeffers, P.M.; Ward, L.M.; Woytowitch, L.M.; Wolfe, N.L. Homogeneous hydrolysis rate constants for selected chlorinated methanes, ethanes, ethenes, and propanes. Environ. Sci. Technol. 1989, 23, 965–969. [Google Scholar] [CrossRef]
  8. Dinicola, R.S.; Cox, S.E.; Bradley, P.N. Natural Attenuation of Chlorinated Volatile Organic Compounds in Ground Water at Area 6, Naval Air Station Whidbey Island, Washington; US Department of the Interior, US Geological Survey: Washington, DC, USA, 2000.
  9. Ma, H.; Zhang, H.; Wang, L.; Wang, J.; Chen, J. Comprehensive screening and priority ranking of volatile organic compounds in Daliao River, China. Environ. Monit. Assess. 2014, 186, 2813–2821. [Google Scholar] [CrossRef]
  10. Xie, Y. Disinfection Byproducts in Drinking Water: Formation, Analysis, and Control; CRC Press: Boca Raton, FL, USA, 2003. [Google Scholar]
  11. Barceló, D. Emerging Organic Pollutants in Waste Waters and Sludge; Springer: Berlin/Heidelberg, Germany, 2005; Volume 5. [Google Scholar]
  12. Li, A.J.; Pal, V.K.; Kannan, K. A review of environmental occurrence, toxicity, biotransformation and biomonitoring of volatile organic compounds. Environ. Chem. Ecotoxicol. 2021, 3, 91–116. [Google Scholar] [CrossRef]
  13. Qin, P.; Cao, F.; Lu, S.; Li, L.; Guo, X.; Zhao, B.; Wan, Z.; Bi, B. Occurrence and health risk assessment of volatile organic compounds in the surface water of Poyang Lake in March 2017. RSC Adv. 2019, 9, 22609–22617. [Google Scholar] [CrossRef] [Green Version]
  14. Chen, X.; Luo, Q.; Wang, D.; Gao, J.; Wei, Z.; Wang, Z.; Zhou, H.; Mazumder, A. Simultaneous assessments of occurrence, ecological, human health, and organoleptic hazards for 77 VOCs in typical drinking water sources from 5 major river basins, China. Environ. Pollut. 2015, 206, 64–72. [Google Scholar] [CrossRef]
  15. Kong, L.; Kadokami, K.; Wang, S.; Duong, H.T.; Chau, H.T.C. Monitoring of 1300 organic micro-pollutants in surface waters from Tianjin, North China. Chemosphere 2015, 122, 125–130. [Google Scholar] [CrossRef]
  16. Dsikowitzky, L.; Sträter, M.; Ariyani, F.; Irianto, H.; Schwarzbauer, J. First comprehensive screening of lipophilic organic contaminants in surface waters of the megacity Jakarta, Indonesia. Mar. Pollut. Bull. 2016, 110, 654–664. [Google Scholar] [CrossRef]
  17. Cao, F.; Qin, P.; Lu, S.; He, Q.; Wu, F.; Sun, H.; Wang, L.; Li, L. Measurement of volatile organic compounds and associated risk assessments through ingestion and dermal routes in Dongjiang Lake, China. Ecotoxicol. Environ. Saf. 2018, 165, 645–653. [Google Scholar] [CrossRef]
  18. Asejeje, G.I.; Ipeaiyeda, A.R.; Onianwa, P.C. Occurrence of BTEX from petroleum hydrocarbons in surface water, sediment, and biota from Ubeji Creek of Delta State, Nigeria. Environ. Sci. Pollut. Res. 2021, 28, 15361–15379. [Google Scholar] [CrossRef] [PubMed]
  19. Liu, Y.; Hao, S.; Zhao, X.; Li, X.; Qiao, X.; Dionysiou, D.D.; Zheng, B. Distribution characteristics and health risk assessment of volatile organic compounds in the groundwater of Lanzhou City, China. Environ. Geochem. Health 2020, 42, 3609–3622. [Google Scholar] [CrossRef] [PubMed]
  20. Selden, T.M.; Forrest, A.S.; Lockhart, J.E. Analyzing the reductions in US air pollution emissions: 1970 to 1990. Land Econ. 1999, 75, 1–21. [Google Scholar] [CrossRef]
  21. Moran, M.J.; Hamilton, P.A.; Zogorski, J.S. Volatile Organic Compounds in the Nation’s Ground Water and Drinking-Water Supply Wells: A Summary; US Department of the Interior, US Geological Survey: Washington, DC, USA, 2006.
  22. Miermans, C.; Van der Velde, L.; Frintrop, P.C. Analysis of volatile organic compounds, using the purge and trap injector coupled to a gas chromatograph/ion-trap mass spectrometer: Review of the results in Dutch surface water of the Rhine, Meuse, Northern Delta Area and Westerscheldt, over the period 1992–1997. Chemosphere 2000, 40, 39–48. [Google Scholar]
  23. Lekkas, T.; Kolokythas, G.; Nikolaou, A.; Kostopoulou, M.; Kotrikla, A.; Gatidou, G.; Thomaidis, N.S.; Golfinopoulos, S.; Makri, C.; Babos, D. Evaluation of the pollution of the surface waters of Greece from the priority compounds of List II, 76/464/EEC Directive, and other toxic compounds. Environ. Int. 2004, 30, 995–1007. [Google Scholar] [CrossRef] [PubMed]
  24. Martínez, E.; Lacorte, S.; Llobet, I.; Viana, P.; Barceló, D. Multicomponent analysis of volatile organic compounds in water by automated purge and trap coupled to gas chromatography–mass spectrometry. J. Chromatogr. A 2002, 959, 181–190. [Google Scholar] [CrossRef]
  25. Huybrechts, T.; Dewulf, J.; Van Langenhove, H. Spatial and temporal variability of priority volatile organic compounds in the Scheldt estuary. Water Res. 2004, 38, 3241–3250. [Google Scholar] [CrossRef]
  26. Sato, E. Determination of volatile organic compounds in rainwater and dew water by head space solid-phase microextraction and gas chromatography/mass spectrometry. Bunseki Kagaku 2010, 59, 551–557. [Google Scholar] [CrossRef] [Green Version]
  27. Okochi, H.; Sugimoto, D.; Igawa, M. The enhanced dissolution of some chlorinated hydrocarbons and monocyclic aromatic hydrocarbons in rainwater collected in Yokohama, Japan. Atmos. Environ. 2004, 38, 4403–4414. [Google Scholar] [CrossRef]
  28. Mullaugh, K.M.; Byrd, J.N.; Avery, G.B., Jr.; Mead, R.N.; Willey, J.D.; Kieber, R.J. Characterization of carbohydrates in rainwater from the Southeastern North Carolina. Chemosphere 2014, 107, 51–57. [Google Scholar] [CrossRef]
  29. Mahbub, P.; Goonetilleke, A.; Ayoko, G.A. Prediction of the wash-off of traffic related semi-and non-volatile organic compounds from urban roads under climate change influenced rainfall characteristics. J. Hazard. Mater. 2012, 213, 83–92. [Google Scholar] [CrossRef] [PubMed] [Green Version]
  30. Šoštarić, A.; Stojić, A.; Stojić, S.S.; Gržetić, I. Quantification and mechanisms of BTEX distribution between aqueous and gaseous phase in a dynamic system. Chemosphere 2016, 144, 721–727. [Google Scholar] [CrossRef]
  31. Wu, B.-Z.; Feng, T.-Z.; Sree, U.; Chiu, K.-H.; Lo, J.-G. Sampling and analysis of volatile organics emitted from wastewater treatment plant and drain system of an industrial science park. Anal. Chim. Acta 2006, 576, 100–111. [Google Scholar] [CrossRef]
  32. Lin, C.; Mao, W.-M.; Nadim, F. Forensic investigation of BTEX contamination in the Houjing River in Southern Taiwan. J. Environ. Eng. Manag. 2007, 17, 395–402. [Google Scholar]
  33. European Commission. Technical Guidance Document on Risk Assessment in Support of Commission Directive 93/67/EEC on Risk Assessment for New Notified Substances, Commission Regulation (EC) No 1488/94 on Risk Assessment for Existing Substances, and Directive 98/8/EC of the European Parliament and of the Council Concerning the Placing of Biocidal Products on the Market; European Commission Joint Research Centre: Ispra, Italy, 2003; p. 20418. [Google Scholar]
  34. Mattice, J.; Tsai, S.; Burch, M.; Beauchamp, J. Toxicity of trihalomethanes to common carp embryos. Trans. Am. Fish. Soc. 1981, 110, 261–269. [Google Scholar] [CrossRef]
  35. LeBlanc, G.A. Acute toxicity of priority pollutants to water flea (Daphnia magna). Bull. Environ. Contam. Toxicol. 1980, 24, 684–691. [Google Scholar] [CrossRef]
  36. Black, J.A.; Birge, W.J.; Westerman, A.G.; Francis, P.C. Comparative aquatic toxicology of aromatic hydrocarbons. Fundam. Appl. Toxicol. 1983, 3, 353–358. [Google Scholar] [CrossRef]
  37. Cushman, J.; Rausina, G.; Cruzan, G.; Gilbert, J.; Williams, E.; Harrass, M.; Sousa, J.; Putt, A.; Garvey, N.; Laurent, J.S. Ecotoxicity hazard assessment of styrene. Ecotoxicol. Environ. Saf. 1997, 37, 173–180. [Google Scholar] [CrossRef] [PubMed]
  38. Ahmad, N.; Benoit, D.; Brooke, L.; Call, D.; Carlson, A. Aquatic Toxicity Tests to Characterize the Hazard of Volatile Organic Chemicals in Water: A Toxicity Data Summary. Parts 1 and 2; NTIS: Springfield, VA, USA, 1984.
  39. Black, J.A.; Birge, W.J.; McDonnell, W.E.; Westerman, A.G.; Ramey, B.A.; Bruser, D.M. The Aquatic Toxicity of Organic Compounds to Embryo-Larval Stages of Fish and Amphibians; University of Kentucky, Kentucky Water Resources Research Institute: Lexington, KY, USA, 1982. [Google Scholar]
  40. Niederlehner, B.; Cairns, J., Jr.; Smith, E.P. Modeling Acute and Chronic Toxicity of Nonpolar Narcotic Chemicals and Mixtures toCeriodaphnia dubia. Ecotoxicol. Environ. Saf. 1998, 39, 136–146. [Google Scholar] [CrossRef] [PubMed]
  41. Bailey, H.C.; Liu, D.H.; Javitz, H.A. Time/toxicity relationships in short-term static, dynamic, and plug-flow bioassays. In Aquatic Toxicology and Hazard Assessment: Eighth Symposium; ASTM International: West Conshohocken, PA, USA, 1985. [Google Scholar]
  42. McCulloch, A. Chloroform in the environment: Occurrence, sources, sinks and effects. Chemosphere 2003, 50, 1291–1308. [Google Scholar] [CrossRef]
  43. Kranzioch, I.; Stoll, C.; Holbach, A.; Chen, H.; Wang, L.; Zheng, B.; Norra, S.; Bi, Y.; Schramm, K.-W.; Tiehm, A. Dechlorination and organohalide-respiring bacteria dynamics in sediment samples of the Yangtze Three Gorges Reservoir. Environ. Sci. Pollut. Res. 2013, 20, 7046–7056. [Google Scholar] [CrossRef] [PubMed]
  44. Zhang, G.; Mu, Y.; Liu, J.; Zhang, C.; Zhang, Y.; Zhang, Y.; Zhang, H. Seasonal and diurnal variations of atmospheric peroxyacetyl nitrate, peroxypropionyl nitrate, and carbon tetrachloride in Beijing. J. Environ. Sci. 2014, 26, 65–74. [Google Scholar] [CrossRef]
  45. Miri, M.; Shendi, M.R.A.; Ghaffari, H.R.; Aval, H.E.; Ahmadi, E.; Taban, E.; Gholizadeh, A.; Aval, M.Y.; Mohammadi, A.; Azari, A. Investigation of outdoor BTEX: Concentration, variations, sources, spatial distribution, and risk assessment. Chemosphere 2016, 163, 601–609. [Google Scholar] [CrossRef]
  46. Schwarzenbach, R.P.; Gschwend, P.M.; Imboden, D.M. Environmental Organic Chemistry; John Wiley & Sons: Hoboken, NJ, USA, 2016. [Google Scholar]
  47. Buchmann, B.; Stemmler, K.; Reimann, S. Regional emissions of anthropogenic halocarbons derived from continuous measurements of ambient air in Switzerland. CHIMIA 2003, 57, 522–528. [Google Scholar] [CrossRef] [Green Version]
  48. Richards, P.M.; Liang, Y.; Johnson, R.L.; Mattes, T.E. Cryogenic soil coring reveals coexistence of aerobic and anaerobic vinyl chloride degrading bacteria in a chlorinated ethene contaminated aquifer. Water Res. 2019, 157, 281–291. [Google Scholar] [CrossRef] [Green Version]
  49. Lohner, S.T.; Becker, D.; Mangold, K.-M.; Tiehm, A. Sequential reductive and oxidative biodegradation of chloroethenes stimulated in a coupled bioelectro-process. Environ. Sci. Technol. 2011, 45, 6491–6497. [Google Scholar] [CrossRef]
  50. Cappelletti, M.; Frascari, D.; Zannoni, D.; Fedi, S. Microbial degradation of chloroform. Appl. Microbiol. Biotechnol. 2012, 96, 1395–1409. [Google Scholar] [CrossRef] [PubMed]
  51. Ballschmiter, K. Transport and fate of organic compounds in the global environment. Angew. Chem. Int. Ed. 1992, 31, 487–515. [Google Scholar] [CrossRef]
  52. Shao, M.; Huang, D.; Gu, D.; Lu, S.; Chang, C.; Wang, J. Estimate of anthropogenic halocarbon emission based on measured ratio relative to CO in the Pearl River Delta region, China. Atmos. Chem. Phys. 2011, 11, 5011–5025. [Google Scholar] [CrossRef] [Green Version]
  53. Dai, H.; Jing, S.; Wang, H.; Ma, Y.; Li, L.; Song, W.; Kan, H. VOC characteristics and inhalation health risks in newly renovated residences in Shanghai, China. Sci. Total Environ. 2017, 577, 73–83. [Google Scholar] [CrossRef] [PubMed]
  54. Grady, S.J. A National Survey of Methyl Tert-Butyl Ether and Other Volatile Organic Compounds in Drinking-Water Sources: Results of the Randon [ie Random] Survey; US Department of the Interior, US Geological Survey: Washington, DC, USA, 2003.
  55. Chan, C.C.; Mundle, S.O.; Eckert, T.; Liang, X.; Tang, S.; Lacrampe-Couloume, G.; Edwards, E.A.; Sherwood Lollar, B. Large carbon isotope fractionation during biodegradation of chloroform by Dehalobacter cultures. Environ. Sci. Technol. 2012, 46, 10154–10160. [Google Scholar]
  56. Yan, J.; Wang, L.; Fu, P.P.; Yu, H. Photomutagenicity of 16 polycyclic aromatic hydrocarbons from the US EPA priority pollutant list. Mutat. Res./Genet. Toxicol. Environ. 2004, 557, 99–108. [Google Scholar] [CrossRef] [Green Version]
  57. Khalil, M.; Moore, R.; Harper, D.; Lobert, J.; Erickson, D.; Koropalov, V.; Sturges, W.; Keene, W. Natural emissions of chlorine-containing gases: Reactive Chlorine Emissions Inventory. J. Geophys. Res. Atmos. 1999, 104, 8333–8346. [Google Scholar] [CrossRef]
  58. Khalil, M.; Rasmussen, R. Atmospheric chloroform. Atmos. Environ. 1999, 33, 1151–1158. [Google Scholar] [CrossRef]
  59. Frank, W.; Frank, H. Concentrations of airborne C1-and C2-halocarbons in forest areas in West Germany: Results of three campaigns in 1986, 1987 and 1988. Atmos. Environ. A Gen. Top. 1990, 24, 1735–1739. [Google Scholar] [CrossRef]
  60. Isidorov, V.; Prilepsky, E.; Povarov, V. Photochemically and optically active components of minerals and gas emissions of mining plants. J. Ecol. Chem. 1993, 1, 201–207. [Google Scholar]
  61. Zhang, K.; Liang, B.; Wang, J.-Z.; Guan, Y.-F.; Zeng, E.Y. Polycyclic aromatic hydrocarbons in upstream riverine runoff of the Pearl River Delta, China: An assessment of regional input sources. Environ. Pollut. 2012, 167, 78–84. [Google Scholar] [CrossRef] [PubMed]
  62. Liu, M.; Feng, J.; Hu, P.; Tan, L.; Zhang, X.; Sun, J. Spatial-temporal distributions, sources of polycyclic aromatic hydrocarbons (PAHs) in surface water and suspended particular matter from the upper reach of Huaihe River, China. Ecol. Eng. 2016, 95, 143–151. [Google Scholar] [CrossRef]
  63. González-Gaya, B.; Martínez-Varela, A.; Vila-Costa, M.; Casal, P.; Cerro-Gálvez, E.; Berrojalbiz, N.; Lundin, D.; Vidal, M.; Mompeán, C.; Bode, A. Biodegradation as an important sink of aromatic hydrocarbons in the oceans. Nat. Geosci. 2019, 12, 119–125. [Google Scholar] [CrossRef]
  64. Belpaire, C.; Goemans, G. Eels: Contaminant cocktails pinpointing environmental contamination. Mar. Sci. 2007, 64, 1423–1436. [Google Scholar] [CrossRef] [Green Version]
  65. Salahova, S.; Topchiyeva, S.A.; Alakbarov, I.K.; Ramazanov, M. Influences of chemical pollutants to the biota of the Caspian Sea. Chem. Eng. Trans. 2017, 60, 325–330. [Google Scholar]
  66. Lin, C.-W.; Chen, L.-H.; Yet-Pole, I.; Lai, C.-Y. Microbial communities and biodegradation in lab-scale BTEX-contaminated groundwater remediation using an oxygen-releasing reactive barrier. Bioprocess Biosyst. Eng. 2010, 33, 383–391. [Google Scholar] [CrossRef] [PubMed]
  67. Varjani, S.J. Microbial degradation of petroleum hydrocarbons. Bioresour. Technol. 2017, 223, 277–286. [Google Scholar] [CrossRef] [PubMed]
  68. Mohan, H.; Lim, J.M.; Lee, S.W.; Jang, J.S.; Park, Y.J.; Seralathan, K.K.; Oh, B.T. Enhanced visible light photocatalysis with E-waste-based V2O5/zinc–ferrite: BTEX degradation and mechanism. J. Chem. Technol. Biotechnol. 2020, 95, 2842–2852. [Google Scholar] [CrossRef]
  69. Chen, J.; Eberlein, L.; Langford, C.H. Pathways of phenol and benzene photooxidation using TiO2 supported on a zeolite. J. Photochem. Photobiol. A 2002, 148, 183–189. [Google Scholar] [CrossRef]
  70. Iordache, A.; Iordache, M.; Sandru, C.; Voica, C.; Stegarus, D.; Zgavarogea, R.; Ionete, R.E.; Cotorcea, S.; Miriciorp, M.G. A Fugacity Based Model for the Assessment of Pollutant Dynamic Evolution of VOCS and BTEX in the Olt River Basin (Romania). Rev. Chim. 2019, 70, 3456–3463. [Google Scholar] [CrossRef]
  71. Conant, B., Jr. Delineating and quantifying ground water discharge zones using streambed temperatures. Groundwater 2004, 42, 243–257. [Google Scholar] [CrossRef]
  72. Ellis, P.A.; Mackay, R.; Rivett, M.O. Quantifying urban river–aquifer fluid exchange processes: A multi-scale problem. J. Contam. Hydrol. 2007, 91, 58–80. [Google Scholar] [CrossRef]
  73. Ellis, P.A.; Rivett, M.O. Assessing the impact of VOC-contaminated groundwater on surface water at the city scale. J. Contam. Hydrol. 2007, 91, 107–127. [Google Scholar] [CrossRef] [PubMed]
  74. LaSage, D.M.; Fryar, A.E.; Mukherjee, A.; Sturchio, N.C.; Heraty, L.J. Groundwater-derived contaminant fluxes along a channelized Coastal Plain stream. J. Hydrol. 2008, 360, 265–280. [Google Scholar] [CrossRef]
  75. Rathbun, R. Transport, behavior, and fate of volatile organic compounds in streams. Crit. Rev. Environ. Sci. Technol. 2000, 30, 129–295. [Google Scholar] [CrossRef]
  76. Mukherjee, A.; Fryar, A.E.; LaSage, D.M. Using tracer tests to assess natural attenuation of contaminants along a channelized Coastal Plain stream. Environ. Eng. Geosci. 2005, 11, 371–382. [Google Scholar] [CrossRef]
  77. Hamonts, K. Structure and Pollutant-Degrading Activity of the Microbial Community in Eutrophic River Sediments Impacted by Discharging Chlorinated Aliphatic Hydrocarbonpolluted Groundwater. Ph.D. Thesis, Faculty of Bioscience Engineering, Catholic University of Leuven, Leuven, Belgium, 2009. [Google Scholar]
  78. Kuhn, T.K.; Hamonts, K.; Dijk, J.A.; Kalka, H.; Stichler, W.; Springael, D.; Dejonghe, W.; Meckenstock, R.U. Assessment of the intrinsic bioremediation capacity of an eutrophic river sediment polluted by discharging chlorinated aliphatic hydrocarbons: A compound-specific isotope approach. Environ. Sci. Technol. 2009, 43, 5263–5269. [Google Scholar] [CrossRef] [PubMed]
  79. Ramírez, N.; Cuadras, A.; Rovira, E.; Borrull, F.; Marcé, R.M. Chronic risk assessment of exposure to volatile organic compounds in the atmosphere near the largest Mediterranean industrial site. Environ. Int. 2012, 39, 200–209. [Google Scholar] [CrossRef]
  80. Huang, Y.; Sui, Q.; Lyu, S.; Wang, J.; Huang, S.; Zhao, W.; Wang, B.; Xu, D.; Kong, M.; Zhang, Y. Tracking emission sources of PAHs in a region with pollution-intensive industries, Taihu Basin: From potential pollution sources to surface water. Environ. Pollut. 2020, 264, 114674. [Google Scholar] [CrossRef]
  81. Galassi, S.; Mingazzini, M.; Vigano, L.; Cesareo, D.; Tosato, M. Approaches to modeling toxic responses of aquatic organisms to aromatic hydrocarbons. Ecotoxicol. Environ. Saf. 1988, 16, 158–169. [Google Scholar] [CrossRef]
  82. Kühn, R.; Pattard, M.; Pernak, K.-D.; Winter, A. Results of the harmful effects of water pollutants to Daphnia magna in the 21 day reproduction test. Water Res. 1989, 23, 501–510. [Google Scholar] [CrossRef]
  83. Marchini, S.; Tosato, M.L.; Norberg-King, T.J.; Hammermeister, D.E.; Hoglund, M.D. Lethal and sublethal toxicity of benzene derivatives to the fathead minnow, using a short-term test. Environ. Toxicol. Chem. 1992, 11, 187–195. [Google Scholar] [CrossRef]
  84. Yücel, M.; Takagi, M.; Walterfang, M.; Lubman, D.I. Toluene misuse and long-term harms: A systematic review of the neuropsychological and neuroimaging literature. Neurosci. Biobehav. Rev. 2008, 32, 910–926. [Google Scholar] [CrossRef] [PubMed]
Figure 1. Distribution of sampling sites in the Han River watershed, South Korea.
Agronomy 11 00956 g001
Figure 2. Cumulative concentration of VOCs at 36 sites in the Han River watershed.
Agronomy 11 00956 g002
Figure 3. Average concentration of volatile organic compounds in each area in the Han River watershed.
Agronomy 11 00956 g003
Figure 4. Risk quotients for eight VOCs in the Han River watershed.
Agronomy 11 00956 g004
Table 1. Quantification ion, method detection limit (MDL), limit of quantitation (LOQ), recovery, and precision of the target VOCs.
ClassificationRetention Time
(min)
Quantification
Ion (m/z)
MDL
(µg/L)
LOQ
(µg/L)
Recovery
(%)
Precision
(%)
1,1-Dichloroethylene (1,1-DCE)8.2760.70.0060.02094 1, 105 24.2 1, 2.8 2
1,1,1-Trichloroethane (1,1,1-TCA)13.0196.80.0110.036108, 896.7, 2.9
Bromoform22.93172.60.0100.031105, 925.9, 1.1
Chloroform12.6882.70.0120.038118, 966.4, 1.3
Naphthalene30.93127.80.0070.024106, 1044.5, 1.9
Styrene22.36103.90.0050.016100, 993.1, 1.4
Tetrachloroethylene (PCE)18.90165.70.0100.03097, 946.3, 2.3
Toluene17.7590.90.0090.030105, 985.7, 1.4
Trichloroethylene (TCE)15.0594.80.0050.016101, 1013.2, 1.9
Vinyl chloride5.2162.00.0090.029100, 905.8, 2.4
m,p-Xylene21.3690.90.0070.021103, 984.0, 0.9
o-Xylene22.3290.90.0050.016102, 973.1, 1.4
1 0.05 µg/L (n = 7) and 2 0.5 µg/L (n = 7) concentration of spike test samples.
Table 2. Aquatic toxicity data and PNEC values for VOCs on aquatic organisms.
ClassificationSpeciesEffectParameterConc.
(mg/L)
Test
Duration
(Days)
Ref.AFPNEC *
(μg/L)
BromoformCyprinus carpioMortalityLC5052NR 1[34]100520
ChloroformDaphnia magnaMortalityNOEC1.821[35]5036
NaphthaleneOncorhynchus mykissMortalityLC500.1127[36]10000.110
StyrenePseudokirchneriella subcapitataPopulationNOEC0.0634[37]10000.063
PCEPimephales promelasGrowthNOEC0.532[38]5010
TolueneOncorhynchus mykissMortalityLC100.002927[39]500.058
TCECeriodaphnia dubiaReproductionNOEL7.267[40]50145
XylenesLepomis macrochirusMortalityLC5010.41[41]100010.4
1 NR: not recorded. * PNEC values were only available in detected VOCs, except 1,1-DCE, 1,1,1-TCA and vinyl chloride.
Table 3. Quantification ion, method detection limit (MDL), limit of quantitation (LOQ), recovery, and precision of the target VOCs.
ClassificationMean
Conc. ± Std
(µg L−1)
Min
Conc.
(µg L−1)
Max
Conc.
(µg L−1)
Total
Conc.
(µg L−1)
Frequency
Detected
(%)
1,1-DCENANANANA 1NA
1,1,1-TCANANANANANA
Bromoform0.0036 ± 0.00760.00000.02100.131019.4
Chloroform0.0596 ± 0.13120.00000.59402.145047.2
Naphthalene0.0004 ± 0.00250.00000.01500.01502.8
Styrene0.0033 ± 0.00950.00000.03400.118011.1
PCE0.0049 ± 0.02030.00000.1150.17808.3
Toluene0.0054 ± 0.01390.00000.06700.196019.4
TCE0.0253 ± 0.07810.00000.41500.911027.8
Vinyl chlorideNANANANANA
Xylenes0.0027 ± 0.00720.00000.03000.194015.3
1 NA: Not applicable.
Publisher’s Note: MDPI stays neutral with regard to jurisdictional claims in published maps and institutional affiliations.

