1. Introduction
Drought is a phenomenon of water imbalance due to lack of rainfall and is a characteristic of a climate that recurs normally and regularly [
1]. In Korea, more than 60% of annual rainfall is concentrated during the three-month rainy season, so Korea has a meteorological environment that is very vulnerable to drought. The incidence and intensity of droughts have recently increased due to rapid climate change. The frequency of droughts has increased by 86% from 0.36 times/year (1904–2000) to 0.67 times/year (2000–2015) [
2].
The damage from drought is concentrated in the agricultural field. The lack of water reserve rates in most regions of the country due to the lack of precipitation has greatly increased social interest in drought as paddy and field crops suffer from drying out, and accordingly, countermeasures are urgent [
3]. In the spring of 2015, the drought occurred at 7358 ha (2822 ha of rice paddies and 4536 ha of field per nationwide cultivation area) [
3,
4]. However, the current drought countermeasures tend to focus on post-treatment measures and support after a drought rather than drought prevention.
Recent changes in the agricultural consumption structure due to economic growth and income growth have highlighted the importance of field farming, and increased demand for high-quality agricultural products [
1], increasing demand for field irrigation water. Therefore, research on the vulnerability assessment of facilities that can identify and predict the condition of field irrigation facilities is needed for a stable water supply.
The amount of field water required is over 4,000,000,000 m
3/year, of which about 60% are not supported by related facilities. About 40% of field-related water is used as groundwater, which is analyzed to be highly utilized [
5]. Most (80%) of the wells that are installed and utilized are private, and the collection point is higher than the aquifer, which has very low practical use in the event of drought. Therefore, it is difficult to secure enough water to cope with the drought. The total beneficiary area of public groundwater wells is over 70,000 ha, of which the collection volume of the Rural Community Corporation is 413,668 m
3/day, and the collection volume of local governments is 6,629,168 m
3/day. In the case of public groundwater wells, even water resources in aquifers can be utilized, and unlike private groundwater wells, they can cope with drought in case of drought. Therefore, it is necessary to review the utilization of public groundwater wells as a way to actively manage them in response to the drought in the fields. However, in the case of public groundwater wells, it is necessary to properly manage the necessary areas and required amounts because installation and maintenance costs are high.
This study aims to present an approach to assess the vulnerability of groundwater wells and select areas where public groundwater wells should be preferentially installed and managed. Vulnerability assessment techniques have been widely applied to urban disasters [
6], floods [
7,
8], earthquakes [
9], landslides [
10], droughts [
11,
12], and various social infrastructures [
13]. In the agricultural sector, there is a study on vulnerability assessment for agricultural production-based disasters [
14], and in the case of vulnerability assessment for groundwater management [
15], groundwater management vulnerability assessment [
11].
These studies applied a multi-criteria decision-making technique to assess the risk and vulnerability of disasters to prepare for natural disasters. However, agricultural infrastructure, such as field irrigation facilities, have attracted little attention. Recently, the Ministry of Agriculture, Food and Rural Affairs, the Rural Development Administration, and the Korea Forest Service began to research the vulnerability of Korea to climate change. To this end, Article 47-2 of the “Framework Act on Agriculture, Rural and Food Industry (Impact Assessment on and Vulnerability of Rural Communities to Climate Change)” was passed in 2014. “Notification No. 2016-16; Fact-finding, Impact, and Vulnerability Assessment for Climate Change in Agriculture” of the Rural Development Administration presented the results of research on climate change and vulnerability. Moreover, the Korea Rural Community Corporation conducted a study entitled “Development of Stability Evaluation and Management Technique for Agricultural Production Infrastructure Due to Climate Change Impacts” In 2018. However, the vulnerability of field irrigation facilities, such as groundwater wells, to drought remains poorly studied, even though many field crops are watered from groundwater wells. Therefore, the study performed a groundwater vulnerability assessment focused on groundwater well management.
Babaei et al. [
16] evaluated drought vulnerability using a multi-criterion decision-making algorithm. An analytical hierarchy process (AHP) was used to determine weights, and then, the Technique for Order of Preference by Similarity to Ideal Solution (TOPSIS) was applied; the method is a recently widely used technique in research [
17] where the factors reflected in the evaluation address a variety of problems. This study intended to be utilized a multi-criteria evaluation technique and apply the TOPSIS method for the assessment of the drought vulnerability focused on groundwater well management, and the evaluation results may be provided as information for the management of groundwater wells.
2. Research Procedures and Methodology
As shown in
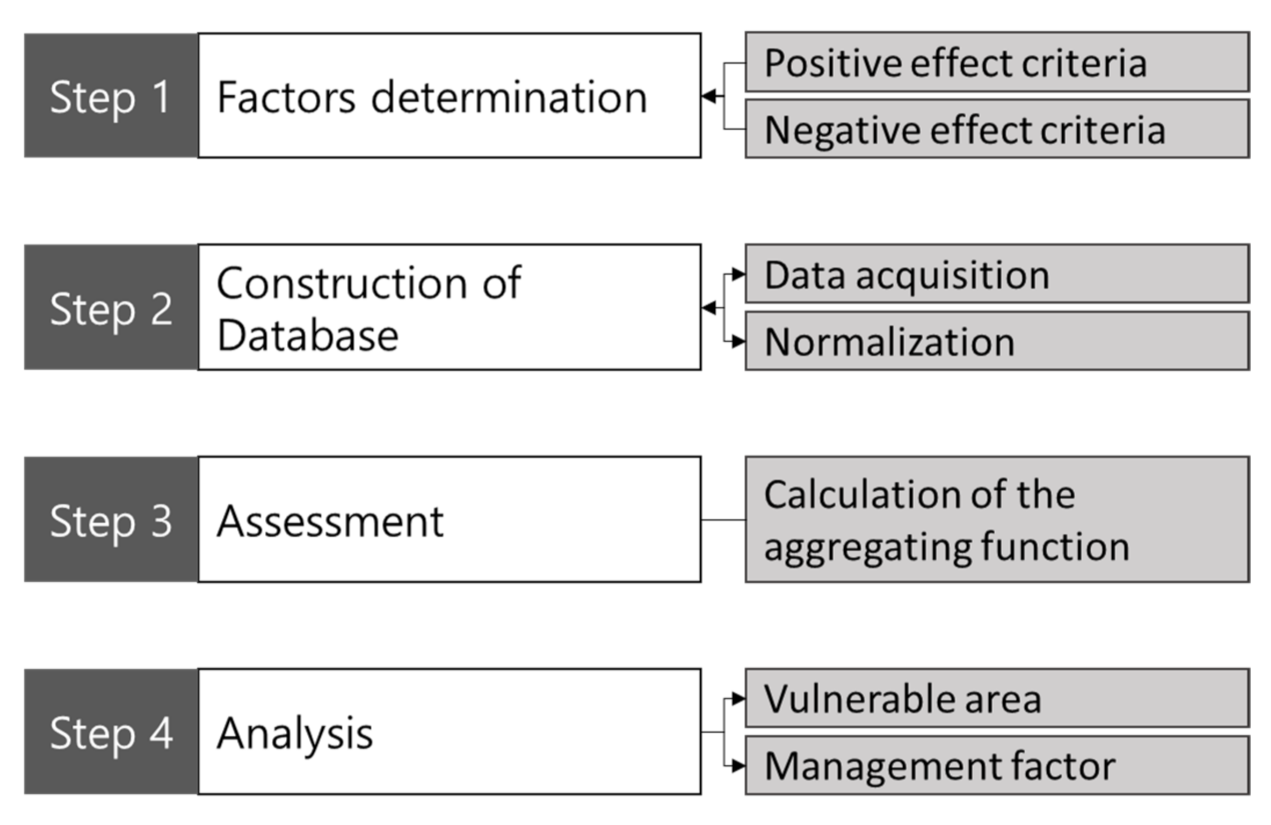
Figure 1, the study identified evaluation factors and provided a priority management area. The assessment factors are determined in step 1. Factors were distinguished by positive and negative factors, depending on their effect on the vulnerability. Step 2 is construction of the database. This includes the standardization of data. Evaluation is carried out in step 3, while vulnerable areas are selected in step 4, and key management elements are derived.
2.1. Current Status of Agricultural Groundwater Use
As a characteristic of groundwater in Korea, the groundwater yield characteristics by aquifer can be divided into an alluvial aquifer and a bedrock aquifer. Alluvial aquifers are widely distributed along the coast of large rivers, with 27,390 square kilometers, about 27% of the total land area, an aquifer thickness of 2 to 30 m, and a yield of 30–800 cubic meters/day. A ‘bedrock aquifer’ is determined by the degree of development of the primary pores produced at a rock formation and the secondary pores formed by the subsequent tectonic variations, such as the joint, fault, and fracture zone. In the eastern highlands, groundwater recharge prevails, and in the western lowlands, emissions prevail. The average annual groundwater depth in the National Groundwater Observation Network is distributed from the indicators at 1.48 to 13.51 m, and the bedrock groundwater well is distributed from the indicators at 0.88 to 46.73 m. Alluvial groundwater wells have developed in the stratigraphic structure from indicators to clay, sand, gravel, and pumpkin stones; most of the alluvial groundwater wells are small in diameter (less than 3 inches in diameter) and developed to supply groundwater to small-area farmland. According to the Annual Report of Groundwater Survey [
18], if most groundwater wells are under 20 m, they are considered alluvial groundwater wells, and the discharge per groundwater well facility is about 1000 tons/year. Bedrock groundwater wells were developed to use core underground water that moves through cracks in rocks such as soft rock, ordinary rock, and light rock below pumpkin stone. Among the agricultural groundwater in 2019, the number of groundwater wells supplied with field water was 250,084, and the utilization was 581,963,192 (m
3/year) [
19].
In public groundwater wells, a large pumping capacity is required, so the proportion of bedrock groundwater wells is high for continuous water supply, and private groundwater wells pump groundwater by installing individual small groundwater wells in farm units [
20]. Small groundwater wells often use alluvial aquifer underground water. Therefore, the water supply may be difficult if drought has occurred and the ground level has been lowered due to shallow depth and sensitivity to fluctuations in the underground water level [
21]. One of the solutions to these problems is the development of bedrock groundwater wells that take in bedrock underground water. Bedrock groundwater wells that are mostly grouped into large groundwater wells can be used to supply irrigation water for fields, and the depth of bedrock groundwater wells is deeper than small groundwater wells, allowing for stable quantities, while the initial installation cost is high [
21].
As of 2019, the installation cost of 20 m-deep groundwater wells that yield 30 t/day is 2,500,000 won, while the installation cost of 60 m-deep bedrock groundwater wells that yield 150 t/day is 50,000,000 won, which is a 20-fold difference [
22].
2.2. Evaluation Factors
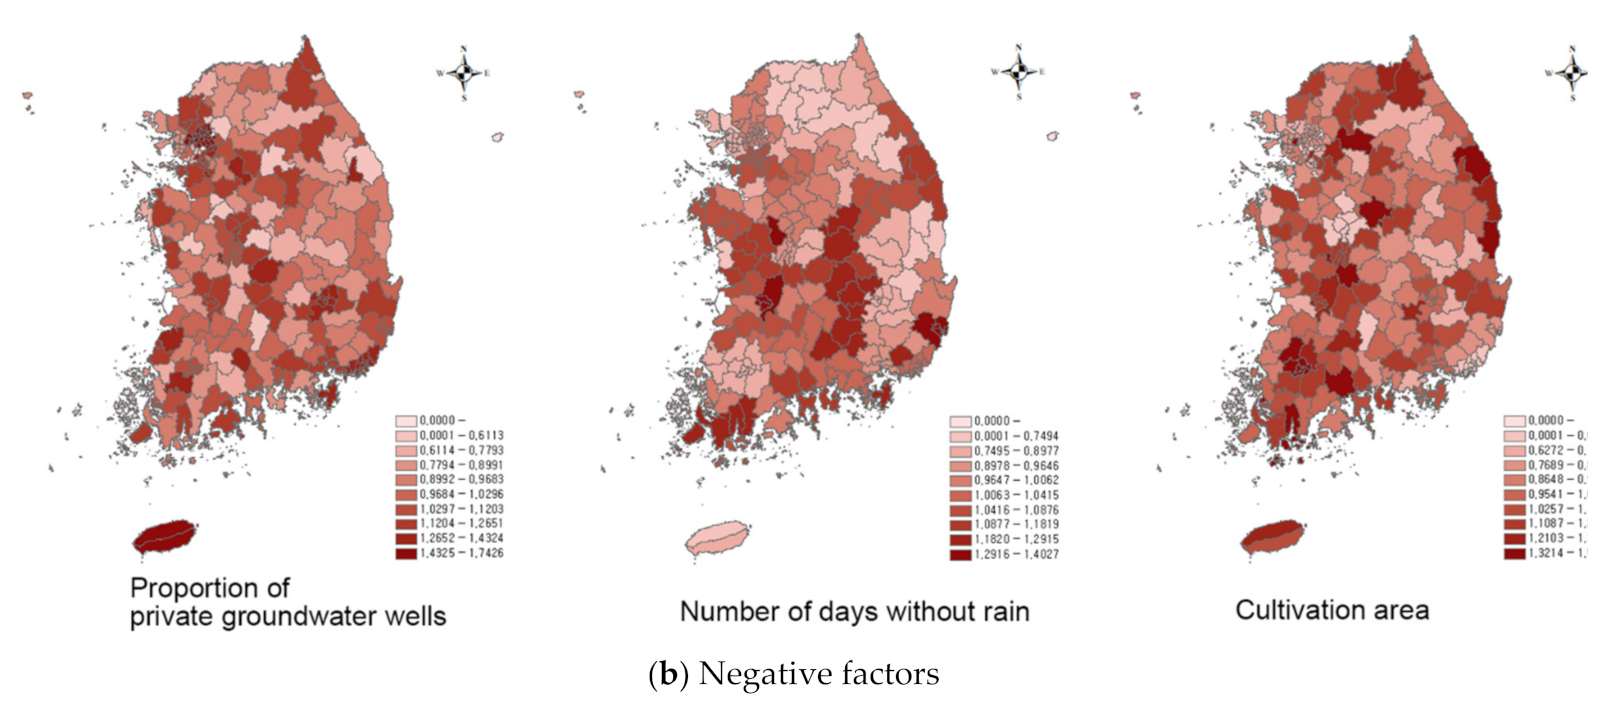
This study chose the assessment factors by focusing on drought and classifying the positive and negative elements of the wells. Precipitation, groundwater level, and pumping capacity were considered to have positive effects on groundwater well capacity and efficiency, while cultivated area, the number of consecutive days without rain, and the proportion of private groundwater wells were considered as negative factors.
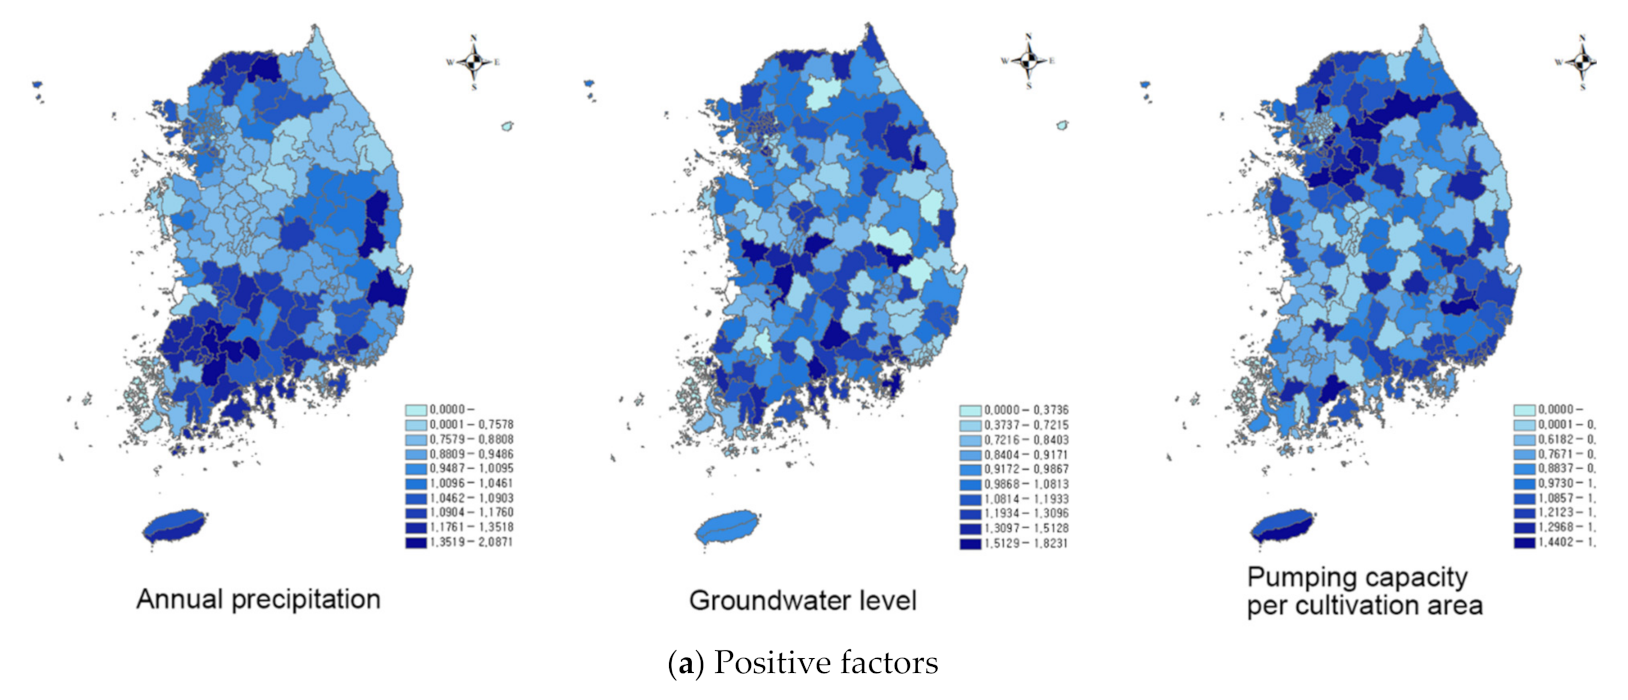
Regarding the factors for evaluating the positive impact, (1) precipitation was selected because we judged that as the annual average precipitation increased, the amount of groundwater increased, so that the irrigation capacity of the wells could be exerted. (2) The groundwater level is a metric that can measure the abundance of groundwater resources, and it means that the higher the groundwater level, the greater the amount of groundwater. Thus, it would be possible to demonstrate the irrigation capability of the wells. (3) Pumping capacity per cultivation area was selected because the greater the amount of water pumped per well, the better the irrigation ability was considered.
Concerning the negative impact evaluation factor, (1) cultivated area was selected because the capacity and efficiency of the wells would decrease if the cultivated land area increased. (2) The number of consecutive days without rain was chosen because the water level of the ground and the irrigation capacity of the wells would be lowered if the number of consecutive days without rain increases. (3) The proportion of private groundwater wells was selected because the higher the private well ratio, the weaker it would be in terms of maintenance compared to the public wells. The evaluation factors are shown in
Table 1.
2.3. Evaluation Data
In the second step, a database of the evaluation factors was constructed. The data varied in quantitative and qualitative terms. As shown in
Table 1, the study obtained precipitation data from the open portal of the Korea Meteorological Administration (
https://data.kma.go.kr, accessed on 2 December 2018) and ADMS (
http://adms.ekr.or.kr, accessed on 2 December 2018) [
23,
24] and the groundwater annual reports of the Korea Water Resources Corporation (which also provide data on groundwater well pumping capacity) [
25,
26]. The study obtained data on cultivated acreage and the number of consecutive days without rain from the KOSIS National Statistical Portal site (
http://kosis.kr, accessed on 2 December 2018) [
27] and the Agricultural Drought Management System (ADMS;
http://adms.ekr.or.kr, accessed on 2 December 2018) [
28], respectively. Private groundwater wells are listed in the groundwater annual reports and Statistical Yearbook of Land and Water Development for Agriculture [
29,
30]. The survey period was 2007 to 2016.
Several methods can be used to standardize data (
Table 2). While ranking has the disadvantage that it does not provide much information, categorical scaling assigns all data to categories. The Z-Score method is also the most commonly used method to make the mean zero and the standard deviation one. Above or below the mean method considers the upper and lower
p-values by reference to an arbitrary threshold
p-value similar to the average. As the threshold is somewhat random, information on absolute values may be lacking. Rescaling is based on the range data, rather than standard deviations, of indicator variables; all indicator variables are standardized so that they fall within the same range. Cyclical indicators are used principally to identify trends in the domain of business. The distance to the reference country method uses the ratio of a measured indicator to a proxy indicator as the reference. Natural breaks are how data values are grouped in a visually intuitive way. When you determine the number of groups you want to distinguish, the algorithms that group data with similar values minimize the variance within each group and maximize the variance between groups [
13].
In this study, we used the rescaling method to convert different units and distributions into identical, unitless numbers; this simplified the calculation of vulnerability scores. This study is part of a larger vulnerability assessment of agricultural production infrastructure entitled Analysis of the Impact of Climate Change on the Survey of Rural Water District and Agricultural Production Infrastructure—Survey for Vulnerability Assessment and Establishment of a Management Plan [
31].
2.4. TOPSIS
Scores were derived using TOPSIS, which is a multi-criterion decision-making approach [
17,
32]. TOPSIS determines the alternative with the shortest geometric distance from the positive ideal solution (PIS) and the longest geometric distance from the negative ideal solution (NIS) [
8,
33,
34,
35]. Euclidean distances are utilized to find the best alternative. The results of all alternatives are easily calculated and can be viewed from a multi-attribute perspective [
36,
37,
38,
39]. In this study, PIS and NIS reflect the areas most and least vulnerable to drought, respectively. The TOPSIS procedure is as follows:
Construct a weighted decisions matrix (
:
where
is the weight of the ith criterion. The
are derived from the alternatives
evaluated against the criteria
, which are the standardized data of the assessment units.
Determine the PIS (
) and NIS (
) values of all unit areas:
Here, ,
Calculate the distance from PIS (
) and NIS (
) for each alternative:
Calculate the optimum membership degree (
):
The priority of area, in terms of agricultural drought, is ranked using groundwater well vulnerability and mapped using a geographic information system (GIS).
3. Results and Discussion
Data collection was performed by the administrative units of cities and counties, but some local governments were excluded from the evaluation, since their data were not readily available. The data were organized in this study as shown in
Figure 2, by standardizing the data from 158 cities and counties. The closer the standardized score of a positive impact survey item is to 1, the greater the positive impact (groundwater well capability or efficiency). Similarly, the closer the standardized score of the negative impact survey item is to 1, the greater the negative impact.
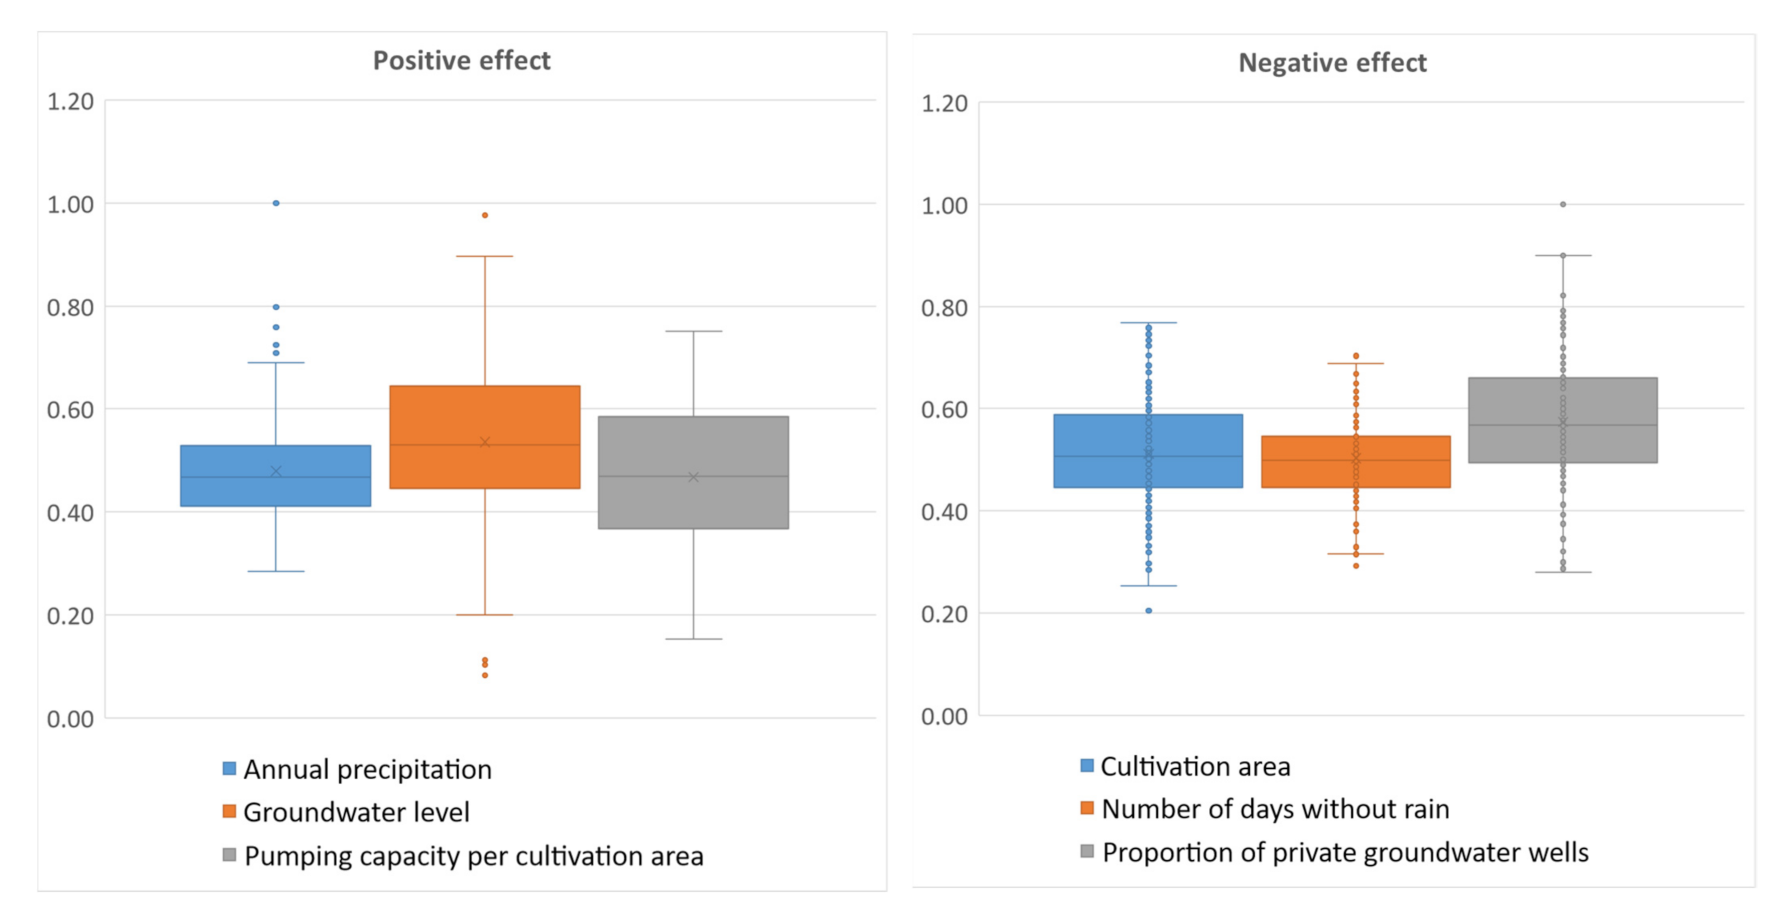
As shown in
Figure 3, for the positive evaluation factors, the difference between the average and maximum and minimum values was the greatest for the groundwater level. The average annual precipitation was relatively low compared to the maximum. The pumping capacity per cultivation area varied more than the other factors. For the negative factors, the number of days without rain had one of the lowest dispersions, while the proportion of private groundwater wells had the highest maximum and average values.
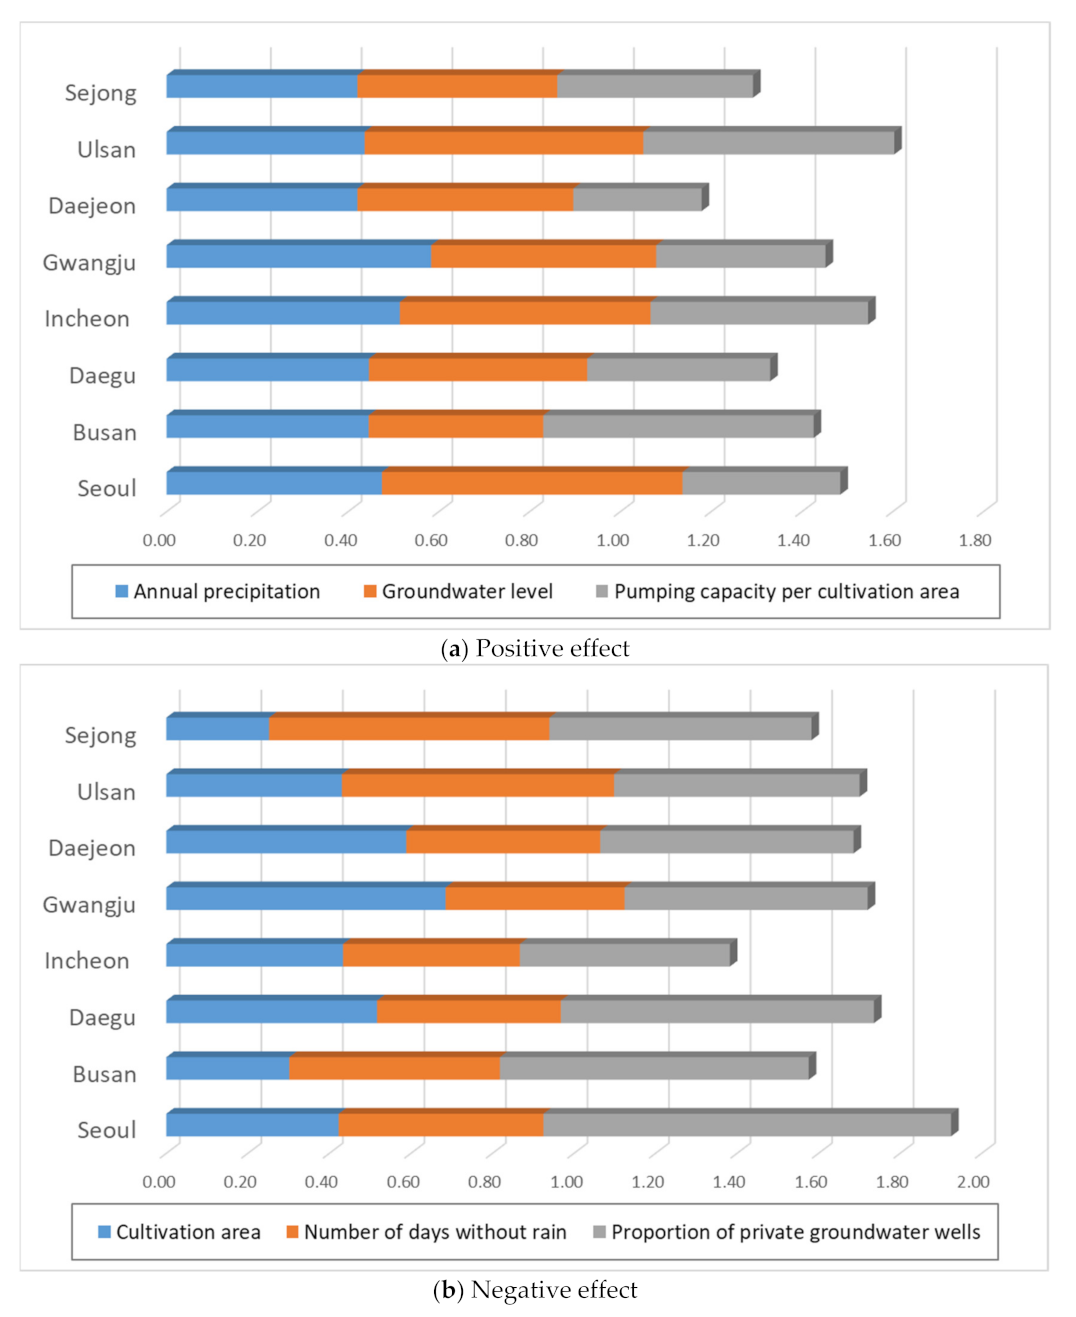
The data for large-scale cities, metropolitan cities with populations of more than 1 million, including Seoul (the largest city in Korea) and Sejong City (the administrative capital), are summarized in
Figure 4. The city with the most positive evaluation factors was Ulsan, and that with the most negative factors was Seoul. In Seoul, water demand is high, which reduces groundwater well efficiency.
Table 3 shows the TOPSIS evaluations performed as described in
Section 2.
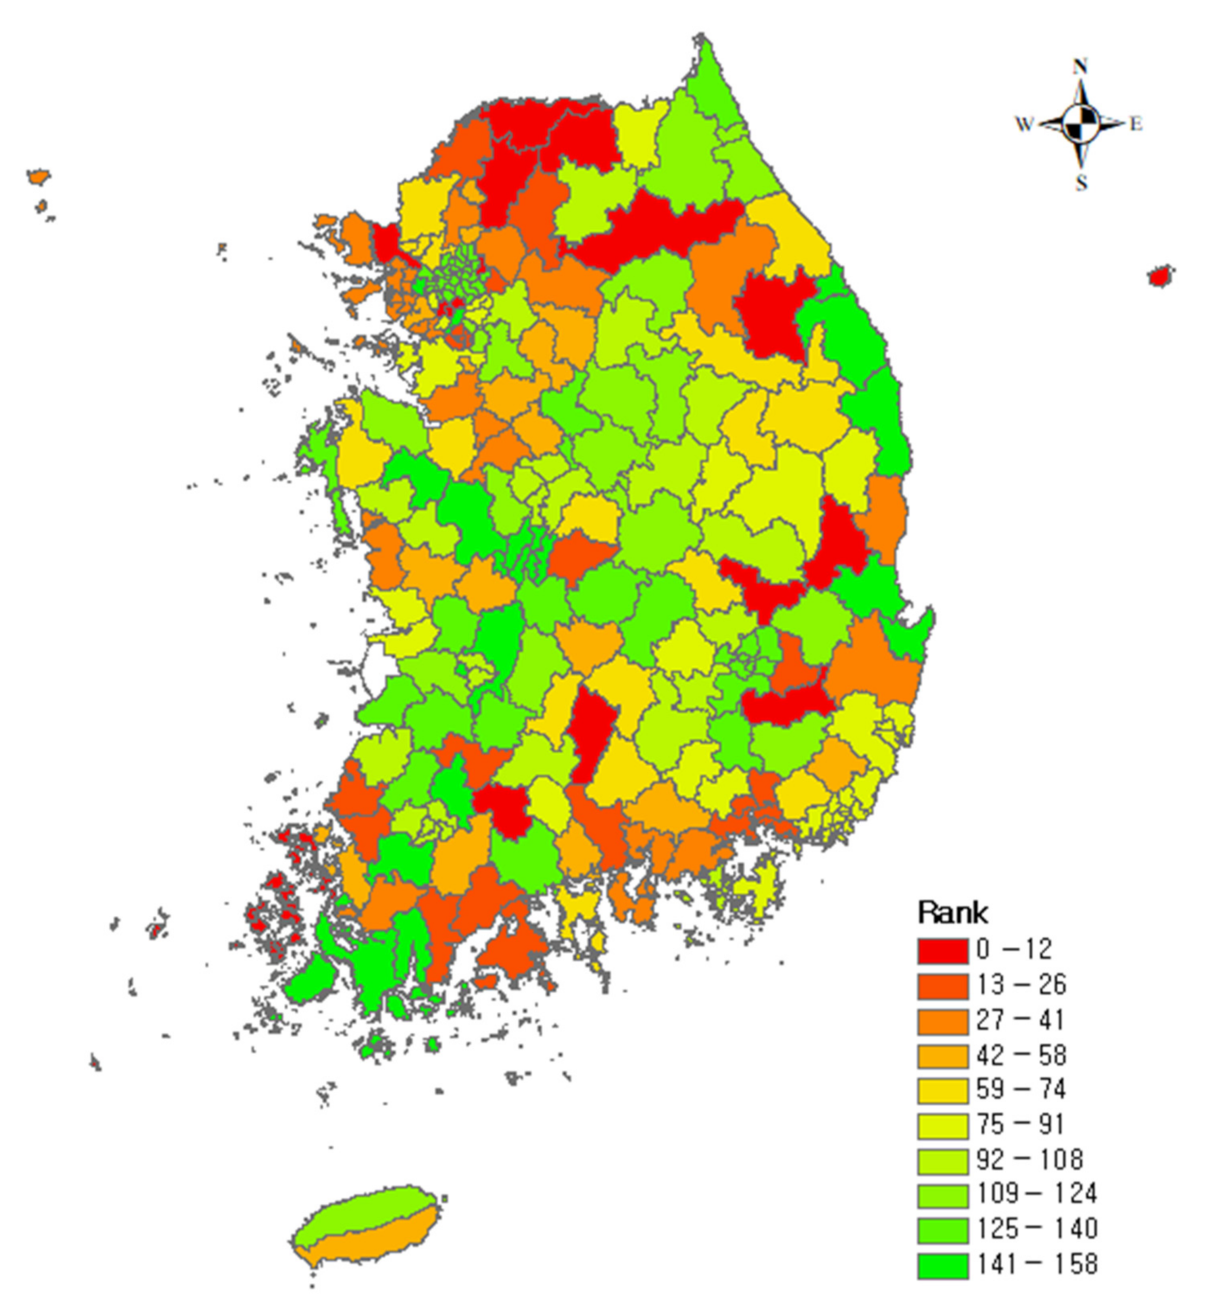
Figure 5 shows the spatial distribution of TOPSIS evaluation throughout the country.
In the results of the well vulnerability assessment in the target area, the top 20 (high vulnerability;
Table 4) and the bottom 20 (low vulnerability;
Table 5) with vulnerability were analyzed, indicating areas requiring efficient agricultural well management in the event of drought and areas that do not require the further operation of the wells. Cheongsong, Gunwi, and Cheorwon, highly vulnerable areas, are highly dependent on pumping capacity per cultivation area and have relatively low cultivated areas. The low-vulnerability areas are Gyeryong, Uiwang, and Uljin, where pumping capacity per cultivation area is very low and the cultivated area is high. Analysis of the factors in the top areas with high well efficiency vulnerabilities showed that the positive impact factor, pumping capacity per cultivation area, was high, and the negative impact factor, private groundwater well ratio, was low. Looking at the status of the bottom 20 areas with low well efficiency vulnerabilities, the negative impact factor, the proportion of private groundwater wells, was very high, and the positive impact factor, pumping capacity per cultivation area, was low.
Thus, high-vulnerability area have high pumping capacity per cultivation area, while low-vulnerability areas have very high cultivated area and low pumping capacity per cultivation area. It was difficult to confirm a direct connection between annual precipitation, the number of days without rain, and the evaluation results. In terms of drought management, vulnerability eventually relies heavily on the capacity of water resources supplied through the stable operation of the wells.
As a result of the analysis, pumping capacity per cultivation area and cultivated area are major factors in the screening of vulnerable areas; thus, these can be selected as key elements of administrative management for drought. The scale of the cultivated area is a private factor, so it is difficult to manage through policy. Therefore, in order to provide adequate water to drought-prone fields, management policies need to be established to consider pumping capacity per cultivation area. In particular, the water supply should be stable during drought.
Typical private groundwater wells can have difficulties in providing stable water during a drought. Public groundwater wells that can utilize aquifer groundwater can be proposed as a more stable water supply method. Therefore, public groundwater wells can be established in the vulnerable areas derived from this study to increase responsiveness to drought.
4. Conclusions
This study presented a method to identify areas among 158 cities and counties in Korea that must prioritize efficient well management during droughts. Precipitation, the groundwater level, and pumping capacity per cultivation area were considered to positively affect well efficiency, while the cultivated area, number of consecutive days without rain, and proportion of private wells negatively affected efficiency.
This study used the TOPSIS multi-criterion decision-making algorithm, which has been employed in several recent studies. TOPSIS was used to measure the Euclidean distance between positive and negative evaluation factors to identify priority areas with respect to efficient well management; the areas thus identified were Cheongsong, Gunwi, Cheorwon, Hongcheon, and Hwacheon. Wells were used relatively efficiently in Gyeryong, Uiwan, Uljin, Gangjin, and Pohang. The pumping capacity per cultivation area had marked effects on management priorities and well vulnerability. According to the analysis, pumping capacity per cultivation area and cultivated area are the main factors for selecting vulnerable areas and can be judged as critical factors for managing field droughts. Therefore, management policies using public groundwater wells are needed for a stable water supply to drought-prone fields.
The drought vulnerability assessment approach based on groundwater wells established in this study is applicable to field drought management as a way to select areas to manage groundwater well. In particular, through a methodology that can reflect both positive and negative effects of groundwater wells, the results of high utilization in the efficient management of groundwater wells in field drought can be presented. However, in the case of fields, water supply sources exist in addition to wells, so the approach of this study, which reflects only groundwater wells, makes it difficult to evaluate the drought of field crops in an integrated manner. Therefore, the management of field crops drought requires the application of an extended evaluation technique that reflects various factors related to drought. In addition, it is necessary to reflect the efficiency of installed and operated groundwater wells and the loss of supplied quantities for actual quantity management during drought and to integrate water quality information regarding groundwater sources into the evaluation factors.
The National Agricultural Research Institute of the Rural Development Administration is utilizing the effective water rate for the evaluation of field crops drought, and the target crop is soybeans. However, the damage caused by drought can vary greatly depending on the target crop, suggesting the need to construct evaluation factors that reflect it. The adoption of assessment factors for field crops drought management areas considering the diversity of crop characteristics and management methods is difficult, requiring complex and detailed information and requiring continuous management. However, in order to efficiently manage agricultural water while responding to drought in the long run, such information-based assessment methods are needed. The assessment approach in this study is easy to expand into assessment methods using various pieces of information. In other words, assessment factors can be selected and evaluated according to the assessment target. Therefore, the following study aims to examine assessment factors that can reflect crop-specific characteristics to perform assessments that reflect various drought characteristics and to devise MCDM-based assessment methods for managing fields toward drought, including non-groundwater well water sources. In addition, this work failed to address the weights that could measure the effect of the evaluation elements, and we would like to introduce a technique that can reflect them.
Author Contributions
Conceptualization, C.P. and H.S.; methodology, H.S. and G.L.; software, G.L.; validation, C.P., M.P. and H.S.; formal analysis, G.L. and J.L. (Jaeyoung Lee); investigation, J.L. (Jaeyoung Lee); data curation, J.L. (Jaenam Lee); writing—original draft preparation, G.L., H.S. and J.L. (Jaenam Lee). All authors have read and agreed to the published version of the manuscript.
Funding
This work was carried out with the support of the “Cooperative Research Program for Agriculture Science & Technology Development (Project No.PJ014813032021)” Rural Development Administration, Republic of Korea and Korea Institute of Planning and Evaluation for Technology in Food, Agriculture, Forestry (IPET) through Agricultural Foundation and Disaster Response Technology Development Program, funded by Ministry of Agriculture, Food and Rural Affairs (MAFRA)(320047-05-2-HD020).
Institutional Review Board Statement
Not applicable.
Informed Consent Statement
Not applicable.
Data Availability Statement
Not applicable.
Conflicts of Interest
The authors declare no conflict of interest.
References
- Kim, H.S. We Must Build a Field Irrigation Facility Management System. Available online: http://www.agrinet.co.kr/news/articleView.html?idxno=133106 (accessed on 21 November 2014).
- Jeon, J.C.; Kim, H.D.; Jeon, S.M.; Cho, S.M.; Kim, M.S.; Choo, Y.J.; Lee, J.H.; Park, G.C. Analysis of upland irrigation facilities for upland drought impact assessment. In Proceedings of the 2017 Korean Society of Agricultural Engineers Annual Conference, Jeju, Korea, 16 October 2017; p. 155. (In Korean). [Google Scholar]
- Lee, J.Y.; Hwang, H.H.; Shin, H.J.; Kim, H.D.; Kwon, H.J.; Jeon, J.C.; Cha, S.S.; Park, C.G. Evaluation of drought impact and function improvement effect of agricultural hydraulic structures. J. Korean Soc. Agric. Eng. 2018, 60, 1–13. [Google Scholar] [CrossRef]
- Lee, G.Y.; Lee, S.I.; Do, W.J.; Ha, T.H. Meteorological drought information production and utilization technologies. J. Disaster Prev. 2016, 18, 47–60. (In Korea) [Google Scholar]
- RDA. Assessment of Upland Drought and Establishment System for Anticipatory Response to Drought; RDA (Rural Development Administration): Jeonju, Korea, 2019; pp. 127–128. [Google Scholar]
- Hwang, H.Y.; Baek, K.Y.; Park, B.H.; Lee, M.H.; Hwang, J.H.; Ryu, E.L.; Kim, T. Empirical application for the urban disaster risk assessment: Fire, facility and escape cases in Cheongju city. J. Korean Soc. Hazard Mitig. 2001, 1, 123–137. [Google Scholar]
- Lee, G.; Jun, K.S.; Chung, E.S. Integrated multi-criteria flood vulnerability approach using fuzzy TOPSIS and Delphi technique. Nat. Hazard Earth Syst. Sci. 2013, 13, 1293–1312. [Google Scholar] [CrossRef] [Green Version]
- Lee, M.S.; Jang, D.H.; Lee, S.H. An analysis of flooded areas by flood frequency for drawing a flood risk map: Focusing on Nonsancheon and Noseongcheon basin. J. Clim. Res. 2014, 9, 153–166. [Google Scholar] [CrossRef]
- Jeong, E.D.; Shin, C.H.; Hwang, H.Y. A study on the evaluation model of disaster risk for earthquake: Centering on the cases of Cheongju city. J. Korean Soc. Hazard Mitig. 2010, 10, 67–73. [Google Scholar]
- Yun, H.S.; Lee, D.H.; Suh, Y.C. Preparation of landslide hazard map using the analysis of historical data and GIS method. J. Korean Assoc. Geogr. Inf. Stud. 2009, 12, 59–73. [Google Scholar]
- Yang, J.S.; Lee, J.B.; Kim, I.H. Assessment of the vulnerability of groundwater level management in Nakdong river basin. J. Korea Water Resour. Assoc. 2017, 50, 815–825. (In Korean) [Google Scholar]
- Fan, G.; Zhang, Y.; He, Y.; Wang, K. Risk assessment of drought in the Yangtze River delta based on natural disaster risk theory. Discret. Dyn. Nat. Soc. 2017, 2017, 5682180. [Google Scholar] [CrossRef]
- Myong, S.J. Assessing Vulnerability to Climate Change of the Pysical Infrastructure and Developing Adaption Measures in Korea II; Korea Environment Institute: Sejongsi, Korea, 2010. [Google Scholar]
- Kim, S.J.; Kim, S.M.; Kim, S.M. A study on the vulnerability assessment for agricultural infrastructure using principal component analysis. J. Korean Soc. Agric. Eng. 2013, 55, 31–38. [Google Scholar] [CrossRef]
- Farjad, B.; Zulhaidi, H.; Mohammed, T.A.; Pirasteh, S.; Wijesekara, N. Groundwater intrinsic vulnerability and risk mapping. Water Manag. 2012, 165, 441–450. [Google Scholar] [CrossRef]
- Babaei, H.; Araghinejad, S.; Hoorfar, A. Developing a new method for spatial assessment of drought vulnerability (case study: Zayandeh-Rood River basin in Iran). Water Environ. J. 2013, 27, 5–57. [Google Scholar] [CrossRef]
- Hwang, C.L.; Yoon, K. Multiple Attribute Decision Making: Methods and Applications; Springer: New York, NY, USA, 1981. [Google Scholar]
- Ministry of Environment. Annual Report of Groundwater Survey; Ministry of Environment: Sejong, Korea, 2020. (In Korean)
- National Groundwater Information Center. 2019. Available online: www.gims.go.kr (accessed on 2 December 2018). (In Korean)
- Jung, J.H.; Hwang, M.S.; Park, S.K.; Lee, S.K. Characteristics of pumping in small tube wells for agricultural. In Proceedings of the Korean Society of Agricultural Engineers Conference, Jeonju, Korea, 12 October 2001; pp. 106–109. (In Korean). [Google Scholar]
- Ministry of Environment. Preparation Guideline for Groundwater Development and Management Utility Facilities; Ministry of Environment: Sejong, Korea, 2008; p. 192. (In Korean)
- Jang, S.; Park, J.; Shin, H.J.; Kim, H.; Hong, R.; Song, I. Economic Analysis of Upland Crop Irrigation Between Individual and Collective Well Water Supply. J. Korean Assoc. Geogr. Inf. Stud. 2020, 23, 192–207. (In Korean) [Google Scholar] [CrossRef]
- Annual Statistics, Amount of Precipitation. Available online: http://sts.kma.go.kr/jsp/home/contents/statistics/newStatisticsSearch.do?menu=SFC&MNU=MNU (accessed on 2 December 2018).
- Annual Statistics, Rainless Days. Available online: http://adms.ekr.or.kr/droughtInfo/rainCalendarMain.do MNU (accessed on 2 December 2018).
- Ground Water Monitoring Network in Korea Annual Report, Groundwater Level. Available online: https://www.gims.go.kr/waterAnnals.do?tgu=A (accessed on 2 December 2018).
- National Groundwater Information Center, Statistics of Annual Report, Groundwater well pumping capacity. Available online: https://www.gims.go.kr/statixtics.do?s_value=statistics_011 (accessed on 2 December 2018).
- Annual Statistics, Agricultural Area Statistics. Available online: http://kosis.kr/statisticsList/statisticsListIndex.do?menuId=M_01_01&vwcd=MT_ZTITLE&parmTabId=M_01_01 (accessed on 2 December 2018).
- The Agricultural Drought Management System (ADMS). Available online: http://adms.ekr.or.kr (accessed on 2 December 2018).
- Ministry of Land, Transport and Maritime Affairs; Ministry of Land, Infrastructure and Transport. Groundwater Annual Reports; Ministry of Land, Transport and Maritime Affairs: Sejong, Korea; Ministry of Land, Infrastructure and Transport: Daejeon, Korea, 2016. (In Korean)
- Korea Rural Community Corporation. Statistical Yearbook of Land and Water Development for Agriculture. Ministry of Agriculture, Food and Rural Affairs 2008–2012; Korea Rural Community Corporation: Ansan, Korea, 2020. (In Korean) [Google Scholar]
- Korea Rural Community Corporation. Analysis of the Impact of Climate Change on the Survey of Rural Water District and Agricultural Production Infrastructure-Survey for Vulnerability Assessment and Establishment of a Management Plan; Korea Rural Community Corporation: Ansan, Korea, 2017. (In Korean) [Google Scholar]
- Fishburn, P.C. Additive Utilities with Incomplete Product Set: Applications to Priorities and Assignments; Operations Research Society of America (ORSA) Publication: Baltimore, MD, USA, 1967. [Google Scholar]
- Lai, Y.J.; Liu, T.Y.; Hwang, C.L. TOPSIS for MODM. Eur. J. Oper. Res. 1994, 76, 486–500. [Google Scholar] [CrossRef]
- Chu, T.C. Selecting plant location via a Fuzzy TOPSIS approach. Int. J. Adv. Manuf. Technol. 2002, 20, 859–864. [Google Scholar] [CrossRef]
- Jun, K.S.; Chung, E.S.; Kim, J.Y.; Lee, K.S. Development of spatial water resources vulnerability index considering climate change impacts. Sci. Total Environ. 2011, 409, 5228–5242. [Google Scholar] [CrossRef] [PubMed]
- Kim, G.; Park, C.S.; Yoon, K.P. Identifying investment opportunities for advanced manufacturing systems with comparative-integrated performance measurement. Int. J. Prod. Econ. 1997, 50, 23–33. [Google Scholar] [CrossRef]
- Lee, K.S.; Chung, E.S. Development of integrated watershed management schemes for an intensively urbanized region in Korea. J. Hydro-Environ. Res. 2007, 1, 95–109. [Google Scholar] [CrossRef]
- Chung, E.S.; Lee, K.S. Prioritization of water management for sustainability using hydrologic simulation model and multicriteria decision making techniques. J. Environ. Manag. 2009, 90, 1502–1511. [Google Scholar] [CrossRef] [PubMed]
- Shih, H.S.; Shyur, H.J.; Lee, E.S. An extension of TOPSIS for group decision making. Math. Comp. Model. 2007, 45, 801–881. [Google Scholar] [CrossRef]
| Publisher’s Note: MDPI stays neutral with regard to jurisdictional claims in published maps and institutional affiliations. |
© 2021 by the authors. Licensee MDPI, Basel, Switzerland. This article is an open access article distributed under the terms and conditions of the Creative Commons Attribution (CC BY) license (https://creativecommons.org/licenses/by/4.0/).


