Article

Genetic Diversity of Soybeans (Glycine max (L.) Merr.) with Black Seed Coats and Green Cotyledons in Korean Germplasm

1
Department of Applied Biosciences, Kyungpook National University, Daegu 41566, Korea
2
Gyeongsangbuk-do Provincial Agricultural Research & Extension Service, Daegu 41404, Korea
3
USDA-ARS, Plant Genetics Research Unit, 110 Waters Hall, University of Missouri-Columbia, Columbia, MO 65211, USA
*
Author to whom correspondence should be addressed.
H. Jo and J.Y. Lee contributed equally for this work.
Agronomy 2021, 11(3), 581; https://doi.org/10.3390/agronomy11030581
Submission received: 23 February 2021 / Revised: 16 March 2021 / Accepted: 17 March 2021 / Published: 19 March 2021
(This article belongs to the Special Issue Old Germplasm for New Needs: Managing Crop Genetic Resources)

Abstract

:
Soybeans (Glycine max (L.) Merr.) with black seed coats and green cotyledons are rich in anthocyanins and chlorophylls known as functional nutrients, antioxidants and compounds with anticarcinogenic properties. Understanding the genetic diversity of germplasm is important to determine effective strategies for improving the economic traits of these soybeans. We aimed to analyze the genetic diversity of 470 soybean accessions by 6K single nucleotide polymorphic loci to determine genetic architecture of the soybeans with black seed coats and green cotyledons. We found soybeans with black seed coats and green cotyledons showed narrow genetic variability in South Korea. The genotypic frequency of the d1d2 and psbM variants for green cotyledon indicated that soybean collections from Korea were intermingled with soybean accessions from Japan and China. Regarding the chlorophyll content, the nuclear gene variant pair d1d2 produced significantly higher chlorophyll a content than that of chloroplast genome psbM variants. Among the soybean accessions in this study, flower color plays an important role in the anthocyanin composition of seed coats. We provide 36 accessions as a core collection representing 99.5% of the genetic diversity from the total accessions used in this study to show potential as useful breeding materials for cultivars with black seed coats and green cotyledons.

Graphical Abstract

1. Introduction

The composition of soybean (Glycine max [L.] Merr.) seeds is 40% protein, 20% oil, and 15% soluble carbohydrates, making it one of the most economically important crops in the world. Soybean production in western countries primarily focuses on producing high-protein meals for livestock and vegetable oils, whereas in Asian countries soybeans have traditionally been used as a staple food and consumed as soymilk, tofu, soy sprouts, fermented soy foods, and soy sauce [1,2]. Soybeans with black seed coats have been attracting interest as a soybean food [3]. Soybeans with black seed coats can be classified into two groups based on their cotyledon colors, which are either green or yellow. Soybean with black seed coats and green cotyledons (BLG) have been used as traditional ingredients in medicinal treatments in China, Japan, and Korea, unlike yellow commodity soybeans [4]. Several studies have reported that daily consumption of black soybeans is associated with a reduced risk of breast cancer and cardiovascular diseases due to their content of potentially active phytochemicals, such as isoflavones, sterols, phytic acid, saponins, and anthocyanins [5,6,7,8]. In addition, BLG soybeans are preferred by consumers for health benefits, and are often cooked with rice and other side dishes in Korea.
Soybeans with black seed coats do not differ from the yellow commodity soybeans in seed composition and plant morphology, and the black seed coat is caused by the accumulation of flavonoids and anthocyanins in the epidermal layer of the soybean seed coat [9,10,11]. Anthocyanins are important functional nutrients and antioxidants that benefit human health by having a positive effect on obesity, diabetes, and cardiovascular diseases [12,13]. Black seed coats are controlled by multiple classic genetic loci, such as I, T, W1, R, and O. The epistatic interaction of those loci contributes to soybean seed coloration. The black seed coat is controlled by the expression level of the chalcone synthase gene, which plays an important role in the anthocyanin biosynthesis pathway [14,15]. In the seed coat of black soybeans, there are eight anthocyanins: delphinidin 3-galactoside, delphinidin 3-O-glucoside, cyanidin 3-O-galactoside, cyanidin 3-O-glucoside, petunidin 3-O-glucoside, pelargonidin 3-O-glucoside, peonidin 3-O-glucoside, and cyanidin chloride [16]. Among them, three anthocyanins, cyanidin 3-O-glucoside, delphinidin 3-O-glucoside, and petunidin 3-O-glucoside are the primary anthocyanins in black seed coat [17].
In pea genetics, green cotyledon was one of earliest traits studied by Gregor Mendel [18]. The dominant allele at the I locus determined the yellow cotyledon color in the pea, whereas the i mutant controlled the green cotyledon color during seed maturation and maintained the green color of leaves during senescence compared with a wild type [19,20]. Delayed leaf senescence in the pea i mutant is known as the “stay-green” phenomenon, and it is caused by the impairment of chlorophyll degradation. Studies confirmed that Mendel’s I locus encoded SGR in pea, which encodes a Mg-dechelatase for catalyzing the first step of the chlorophyll a (Chl a) degradation pathway [21,22]. Chlorophyll plays the primary role in harvesting the light energy during photosynthesis [23]. There are two kind of chlorophylls, Chl a and chlorophyll b (Chl b). Chl a and Chl b are present in light-harvesting complexes I (LHCI) and II (LHCII), including photosystem I and photosystem II. The senescence process in the plant is caused by chlorophyll degradation and a breakdown of LHCI and LHCII, which results in delayed leaf yellowing and is known as the stay-green phenotype [24,25,26]. Degradation of chlorophyll is associated with delayed green leaves during senescence, as well as the green cotyledon in plants.
Due to its advantage regarding the ease and simplicity of observation, inheritance studies on the morphological colors of soybean seed have been conducted since the early 1900s to evaluate seed coat and cotyledon colors [27,28]. Terao [28] reported that in soybeans there are two kinds of inheritance for the green cotyledon phenotype, such as the nuclear inheritance and cytoplasmic inheritance. Genes for the green cotyledon strain were recently cloned for both inheritances. First, D1 (Glyma.01g214600 in W82.a2.v1 assembly) and D2 (Glyma.11g027400) are two paralogous nuclear genes in soybeans and are homologs of SGR genes from other plant species [29]. Double variants of the D1 and D2 gene result in the stay-green phenotype, including delayed yellowing of leaves during senescence, with green seed cotyledons [29,30]. Second, Terao [28] reported the maternal inheritance for the green cotyledon phenotype in soybeans, which are present in the chloroplast genome [30]. The 5-bp insertion in the soybean chloroplast genome results in a frameshift in PsbM, which encodes one of the small subunits of photosystem II [31]. The genotyping of D1, D2, and PsbM from 212 soybeans with green cotyledons revealed that all lines carry either d1d2 or psbM with the known mutations, which suggests that naturally occurring d1, d2, and psbM mutations are rare [31].
Diverse germplasm accessions increase genetic diversity in soybean breeding programs and preserve the rare alleles that contribute to unique germplasm collections. Understanding the genetic diversity of germplasm sets is important for determining effective strategies that improve economic traits for crop development. In soybeans, studies to assess genetic diversity have been conducted on accessions from three major gene pools in China, Korea, and Japan by utilizing molecular markers [32,33,34,35,36,37].
Frankel et al. [38] first proposed the construction of a germplasm core subset, which is representative of the entire population, by maximizing the genetic variation and minimizing repetitiveness. Utilization of the core subset increased the efficiency to overcome the size, cost, and labor issues during evaluating an entire population by focusing on a limited but representative subset instead. Therefore, core subsets have been constructed for various crop species based on morphological and phenotypic observations [39,40,41,42,43,44,45,46,47]. Because quantitative phenotypic traits are often affected by environmental factors, a core subset that covers the genetic diversity of the entire population cannot be perfectly constructed by phenotype [48]. Molecular markers directly reflect genetic diversity rather than phenotypic assessments [49].
Due to increasing consumer awareness regarding the BLG soybean, it has become a preferred food ingredient soybean in South Korea. However, little information on the genetic diversity of BLG accessions has been obtained thus far. Korea is one of the centers of origin for domesticated soybeans, with a long history of cultivation [50]. There are ~17,000 improved and landrace cultivars (Glycine max) in the National Agrobiodiversity Center of Rural Development Administration in Korea [51]. Among them, we used 405 randomly selected collections in this study. The objective of this study was to analyze the genetic diversity of BLG accessions by 6K single nucleotide polymorphism (SNP) loci to understand their genetic architecture. In addition, a core subset of accessions was selected to represent the BLG accessions.

2. Materials and Methods

2.1. Growth Conditions of BLG Germplasms

To understand the genetic diversity, a collection of 405 BLG accessions was distributed from the National Agrobiodiversity Center in Jeonju, Republic of Korea. The collection comprised 385 landraces, eight breeding lines, five unknown, and seven plant inductions from the U.S. National Genetic Resources Program (Table S1). Among the 405 BLG accessions, 397 were collected from Korea, two from Japan, one from China, one from the U.S., and four were unknown. However, 47 accessions from the National Agrobiodiversity Center showed different seed characteristics, plant appearance, flowering and maturity. Therefore, we conducted a pure line selection and added 47 accessions as independent individuals (Table S2). Fifteen additional BLG accessions were locally collected from Gyeongsanbuk-do, Republic of Korea. Two BLG cultivars with green cotyledons, Cheongja [52], Cheongja 3 [53], and soybean cultivar with the yellow seed coat and yellow cotyledon, Uram [53], were used as check cultivars for this study. The 470 accessions including three check cultivars formed the total population and were used for further analyses. The entire set of 470 accessions was grown at Gyeongsanbuk-do Agricultural Research and Extension, Daegu, Republic of Korea over three years and planting dates (14 June 2013, 29 May 2014, and 15 June 2015). Each soybean accession was planted in single rows that were 1.5 m long and spaced 80 cm apart, with two replications. Seeds were planted by hand on hills in rows spaced 15 cm apart and thinned to a final stand of two seedlings per hill. Each plot grown from each year was harvested in bulk at the plant’s full maturity (R8 stage) [54] for further seed analysis.

2.2. DNA Extraction and Determination of Genotyping for Soybean Accessions

Young trifoliate leaves were collected from soybean accessions with three check cultivars in the summer of 2015. Before DNA extraction, the leaves of each line were frozen in liquid nitrogen and ground into a fine powder. Next, 20 mg of leaf tissue from each sample was placed into tubes, and each DNA sample was isolated using the cetyltrimethylammonium bromide method with a minor modification [55]. Quantification and qualification of the genomic DNA of each accession was determined by electrophoresis running on 1.5% agarose gel. Next, 30 µL of genomic DNA at 100 ng/µL from 470 accessions, including three check cultivars, Cheongja, Cheongja 3, and Uram, were sent to the National Instrumentation Center for Environmental Management (NICEM; Seoul, Korea) at Seoul National University to genotype the soybean accessions using BARCsoySNP6K BeadChip [56]. The NICEM staff performed the assay procedures encompassing a series of approaches, such as incubation, DNA amplification, preparation of the bead assay, hybridization of samples of the bead assay, extension, staining of the samples, and imaging of the bead assay [57]. The SNP alleles were called using the Genome Studio Genotyping Module (Illumina, Inc. San Diego, CA, USA) [57]. Total 4459 SNPs were used for further analyses after filtering through the TASSEL software to exclude those with >20% missing data and rare SNPs.

2.3. Basic Population Genetic Parameters, Population Structure, and Construction of a Core Subset Accession

Minor allele frequency, genetic diversity index, polymorphism information content (PIC), and heterozygosity were evaluated using 469 BLG accessions with Uram and 4459 SNP markers using PowerMarker 3.25 software [58]. Principal component analysis (PCA) was conducted with 470 soybean accessions using the R package SNPRelate tool. This plot showed the first principal component (PC1) against the second principal component (PC2). For the phylogenetic tree in the present study, an unweighted pair group method with arithmetic mean (UPGMA) tree was constructed with entire accessions using the calculation of the distance based on a modified Euclidean distance between each pair of accessions by TASSEL [59]. The admixture model was used to analyze the genotypic data using STRUCTURE software [60], which is one of the most widely used genotypic clustering software. Three runs of STRUCTURE were executed for each number of the population (K) from 1 to 10. The burn-in time and replication number were set to 100,000 in each run. For the construction of a core collection, the 4,459 SNP genotypic data of the total BLG accessions was analyzed using GenoCore [61]. In this study, 99.5% of the coverage and 0.001% of the delta value were applied to select accessions for a core subset representing the entire collection.

2.4. Genotyping Assays for D1, D2, and PsbM

To genotype D1 for the presence of the 1-bp deletion [29], a polymerase chain reaction (PCR) was conducted using a forward primer 5′-CGTTGTTGGGTTTGTCTGATGG-3′, and two reverse primers, 5′-GCGGGCTCGTCCACTCCTAAGAATAAAACC-3′ and 5′-GCGGGCAGGGCGGCTCGTCCACTCCTAAGAATAAACC-3′. The total volume of the PCR reaction was 20 µL, containing 1× real-time PCR smart mixtures (2.5 U/μL h-Taq DNA polymerase, 1× h-Taq reaction buffer, and 200 µM dNTP) with EvaGreen (SolGent Co. Ltd. Daejeon, Korea), 0.5 µM primers, and 5–50 ng of genomic DNA template. The PCR conditions for the D1 assay were used for the Gene Touch PCR thermal cycler (Hangzhou Bioer Technology Co. Ltd., Hangzou, China) as follows: 95 °C for 15 min, followed by 35 cycles of 95 °C for 20 s, 60 °C for 20 s, and 72 °C for 20 s. Melting curve analysis was conducted using a Roche LightCycler 480 II (Roche Applied Sciences, Indianapolis, IN, USA) by increasing the temperature from 65 °C to 90 °C and reading every 0.1 °C. The homozygous wild type allele of the D1 gene was detected with a peak at 86 °C, and the homozygous mutant allele containing the D1 gene showed a peak at 87 °C.
The D2 and PsbM genotype assays were conducted as previously described [29,31]. In the D2 assay, DNA was amplified with two forward primers, 5′-TGATACGAAACACCCA CTACGA-3′ and 5′-GACTATCTCATCTCATCTCTGAATGC-3′, and a reverse primer, 5′-TTGCTACTGCTATTTCGTTATTTAA-3′. In the PsbM assay, DNA was amplified with the dCAPS forward primer 5′-GCACTGTTTATTCTAGTTCCTACTGCT TTTTTAGATAT-3′ and the dCAPS reverse primer 5′-TATCTGGATTACGGTGATTGTAGTCCG-3′, and then digested with EcoR V (Enzynomics, Daejeon, Korea). The PCR and digested products were detected using agarose gel electrophoresis at 120 V.

2.5. Phenotype Determination by High Performance Liquid Chromatography (HPLC)

The anthocyanin and chlorophyll contents in the BLG accessions were determined using Thermo Scientific Dionex UltiMate 3000 HPLC (Thermo Scientific Dionex, Waltham, MA, USA). To estimate the genetic and environmental variations, the anthocyanin and chlorophyll contents were measured for seeds from each replicated plot during the three years.
For anthocyanin, a hand-peeled seed coat (0.1 g) from each accession, including three check cultivars, were ground into a powder. Next, 100 mg of powder was extracted with 10 mL of 1% HCl and 20% MeOH for 24 h at 4 °C in a shaking incubator at 110 rpm/min in darkness. The extracted solutions were filtered through Whatman No. 2 filter paper and a syringe filter (0.2 μm). Six extracted anthocyanins (delphinidin 3-O-glucoside, cyanidin 3-O-glucoside, petunidin 3-O-glucoside, pelargonidin 3-O-glucoside, peonidin 3-O-glucoside, and malvidin 3-O-glucosie) were separated in a YMC-pack Pro C18 RS analytical column (250 mm × 4.6 mm, 5 μm). Next, 10 μL of extracted anthocyanins was injected into the column at 1.0 mL/min rates at a temperature of 30 °C. The mobile phases were composed of H2O/HCOOH (90/10, v/v) (mobile phase A) and CH3CN/CH3OH/H2O/HCOOH (22.5/22.5/40/10, v/v) (mobile phase B). The gradient conditions were as follows: 0 min 7% B, 35 min 35% B, 45 min 65% B, 46 min 100% B. Each anthocyanin was detected using a VIS detector at 520 nm and was quantified based on the standard curves generated for each anthocyanin. The anthocyanin content was converted to milligram per gram (mg/g).
For the chlorophyll content, green cotyledons without a seed coat from each accession, including three check cultivars, were ground into powder. One gram of powder was extracted with 10 mL of 85% (CH3)2CO for three hours at 40 °C in a shaking incubator at 110 rpm/min in darkness. The extracted solutions were filtered through Whatman No. 2 filter paper and a syringe filter (0.2 μm). Two extracted chlorophylls (Chl a, and Chl b) were separated in a YMC-pack ODS-A analytical column (150 mm × 6.0 mm, 5 μm). Next, 20 μL of extracted chlorophylls was injected into the column with 1.0 mL/min rates at a temperature of 30 °C. The mobile phases were composed of 75% MeOH in water (mobile phase C) and 100% EtOAc (mobile phase D). The gradient conditions were as follows: 0 min, 30% D; 15 min, 90% D; 20 min, 30% D. Each chlorophyll was detected using a UV-vis detector at 430 nm and was quantified based on the standard curves generated for each chlorophyll content. Each chlorophyll content was converted to microgram per gram (μg/g).

2.6. Genome Wide Association Study (GWAS) for Anthocyanin

GWAS was conducted using TASSEL software and the GAPIT R package. PCA was constructed with 4459 SNPs [62]. The kinship coefficient matrix was used to provide an estimate of additive genetic variance [62,63]. In the present study, we used models wherein a mixed linear model produced p values to populate Manhattan plots [63,64]. The significance of associations between SNPs and traits was based on Bonferroni’s correction and false discovery rate analyses.

2.7. Statistical Data Analysis

All statistical analyses in this study were conducted in SAS v9.4 (SAS Institute, Cary, NC, USA, 2013). Analysis of variance (ANOVA) was conducted to evaluate differences over the three years using PROC GLM in SAS. A comparison of the measured chlorophyll and anthocyanin between the two groups was determined using genotyping, and a Student’s t-test analysis (p ≤ 0.05) was conducted using PROC TTEST in SAS.

3. Results

3.1. Genetic Diversity and Population Structure

To estimate the genetic diversity index of BLG accessions for Korean germplasm, 6K SNP markers were used. The genetic diversity index per SNP marker varied from 0.02 to 0.59, with an average of 0.26 (Figure 1A). The PIC value revealed allelic diversity and frequency of the SNP markers (Figure 1B). PIC values of 0.512 and 0.017 were revealed as the maximum and minimum, respectively, with an average of 0.220. The SNP (Gm11_7661182_T_C) at 7,661,182 on chromosome 11 was the marker that showed the most diversity in this study based on the genetic diversity index and the PIC value. Minor allele frequencies ranged from 0.01 to 0.50, with an average of 0.18 (Figure 1C). Heterozygotes were rare for most of the analyzed SNP markers, and 15 SNP markers showed >0.5 heterozygote frequency with the BLG accessions (Figure 1D).
Population clustering was performed using STRUCTURE software to identify a possible population structure without introducing any prior information. The number of subpopulations could not be identified from the plot of Ln (likelihood probability) for K. However, the ΔK value identified the choice of K = 2 as the highest structural level. Admixture plots of K from 2 to 5 are shown in Figure 2A. Both PCA and UPGMA phylogenetic tree were analyzed to validate the number of clusters from the STRUCTURE result and the genetic diversity of entire BLG accessions (Figure 2B,C). Most accessions in cluster 1 showed no genetic differences based on PCA (Figure 2B) and the phylogenetic tree (Figure 2C). The second highest value of ΔK was at K = 3 as the final number of subpopulations in the present study. Therefore, these soybean germplasms could be divided into three clusters, which were colored gray for cluster 1, orange for cluster 2, and blue for cluster 3 (Figure 2A–C). PCA and phylogenetic tree analyses showed good agreement with K = 3 from the STRUTURE result (Figure 2B,C). Cluster 1 comprised 231 accessions, whereas the other two clusters comprised 107 in cluster 2 and 132 accessions in cluster 3 (Table S1). Two BLG cultivars, Cheongja and Cheongja 3, and the yellow soybean cultivar, Uram, as a check, belonged to cluster 2 (Figure 2B,C).

3.2. Construction of Core Collection

To construct the core collection, 4459 SNPs from the 467 BLG accessions were used. The number of the core collection included thirty-six accessions accounting for 7.7% of the total population (Table S1). The core collection explained 99.5% of the genetic diversity of the total population. Among the core subset, 32 accessions belonged to cluster 2, accounting for 89.0% of the core collections (Figure 3A). PCA was performed to reveal the core collection representing the genetic diversity of the total population. The result showed that the selected accessions in the core collection by GenoCore evenly covered the total populations of PC1 and PC2 (Figure 3B).

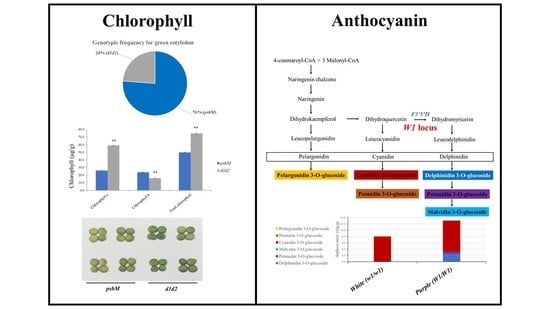
3.3. Frequency of the D1, D2, and PsbM Alleles and Their Relationship with the Chlorophyll Content in Cotyledon

Genotyping of D1, D2, and PsbM for the total accessions was conducted to determine the frequency of genes in the Korean soybean germplasm. The result revealed that the 467 BLG accessions and the two check BLG cultivars contained either the double recessive mutant alleles of the D1 and D2 nuclear genes or the 5-bp insertion in the chloroplast gene, PsbM. However, accession BLG397 (IT263333) and BLG467 (IT263849) had heterozygous D1 and D2, whereas BLG397 contained a variant of the PsbM gene (Table S1). Seventy-six percent of the analyzed total accessions carried psbM, whereas 24% contained double mutant alleles of D1 and D2 (Figure 4A). The genotype frequency of d1d2 (9 of 35, 25.7%) and psbM (26 of 35, 74.3%) in the core collection were similar to the total population (Figure 4B). The genotype frequencies of d1d2 and psbM were different based on the three clusters; all 231 accessions in cluster 1 and 83 of 104 accessions (80%) in the group 2 cluster carried psbM, whereas 90 of 132 accessions (68%) in group 3 cluster had the d1d2 genotype (Figure 4C–E).
To identify the relationship of the cloned genes for stay-green and seed phenotype, the seed chlorophyll content was measured for the total BLG accessions using HPLC. The Chl a, Chl b, and total chlorophyll content of the total collection ranged from 11.5 μg/g to 88.4 μg/g with the mean of 33.9 μg/g, from 7.7 μg/g to 40.8 μg/g with the mean of 21.9 μg/g, and from 22.6 μg/g to 120.0 μg/g with the mean of 55.8 μg, respectively (Figure S1). The chlorophyll a/b ratio ranged from 0.8 to 5.3, with the mean of 1.8. Mean values of the measured chlorophyll content of individual accessions in two stay-green genotypic groups, d1d2 and psbM, are shown in Figure 5. The Chl a and total chlorophyll contents in the d1d2 genotypic group were significantly higher than those of the psbM genotypic group, whereas Chl b in the d1d2 genotypic group was statistically lower than that of the psbM genotypes (Figure 5A). The chlorophyll a/b ratio in the d1d2 genotypes was ~4-fold higher than that of the psbM genotypic group in the total population (Figure 5C). Each measured chlorophyll content was significant for the genotype, environment, and genotype by environment interaction during the three years (Table S3).

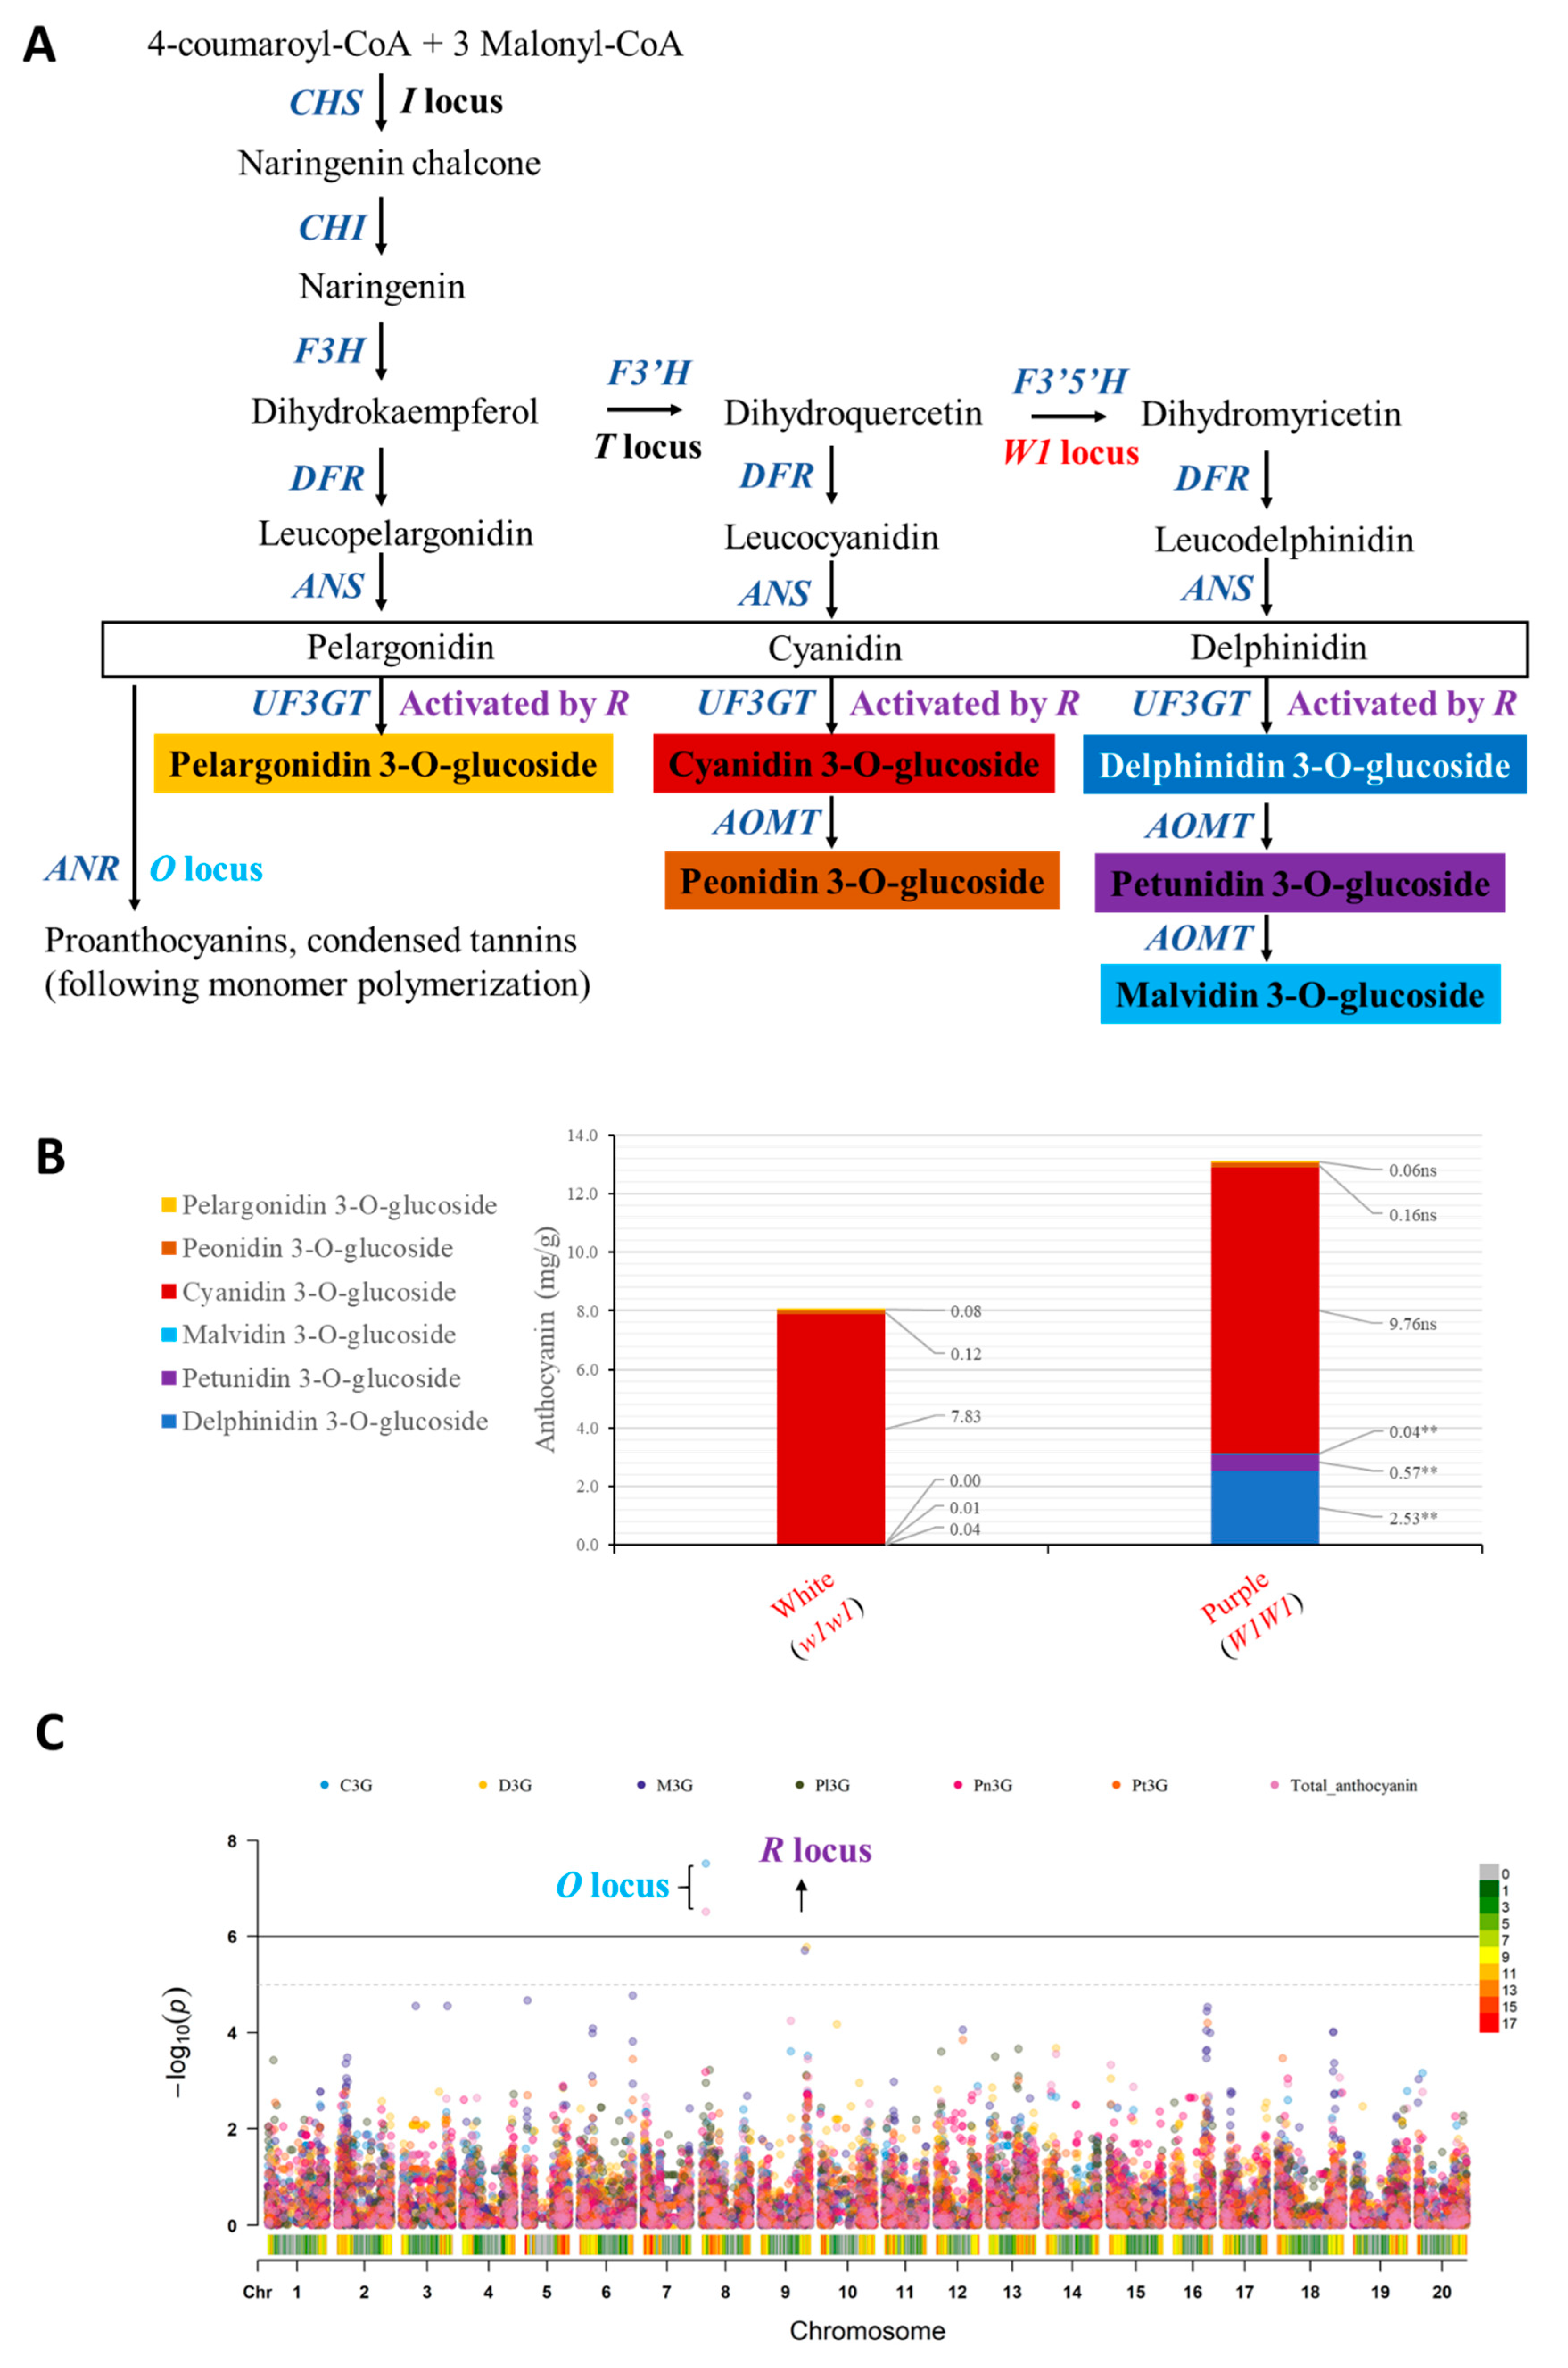
3.4. GWAS for Anthocyanin

To understand the association between phenotype and genes or loci involved in the anthocyanin pathway, a biochemical characterization was performed using HPLC to measure the content of each anthocyanin with 469 BLG accessions. The mean of delphinidin 3-O-glucoside, cyanidin 3-O-glucoside, petunidin 3-O-glucoside, pelargonidin 3-O-glucoside, peonidin 3-O-glucoside, and malvidin 3-O-glucosie over the three years was 2.53 ± 0.04 mg/g, 9.76 ± 0.19 mg/g, 0.57 ± 0.01 mg/g, 0.16 ± 0.01 mg/g, 0.06 ± 0.001 mg/g, and 0.04 ± 0.002 mg/g, respectively (Figure S2). The ranges of delphinidin 3-O-glucoside, cyanidin 3-O-glucoside, petunidin 3-O-glucoside, pelargonidin 3-O-glucoside, peonidin 3-O-glucoside, and malvidin 3-O-glucosie were 0.61–4.78 mg/g, 1.65–19.83 mg/g, 0.04–1.61 mg/g, 0.00–0.71 mg/g, 0.00–0.14 mg/g, and 0.00–0.25 mg/g, respectively. The total anthocyanin content ranged from 2.6 mg/g to 24.3 mg/g, with the mean of 13.11 mg/g (Figure S2). Each measured anthocyanin composition was significant for the genotype, environment, and genotype by environment interaction over the three years (Table S4).
The seed coat color (I locus), pubescence color (T locus), and flower color (W1 locus) were involved in the anthocyanin pathway (Figure 6A). All accessions in this study, except Uram, were black seed coat (ii) and tawny pubescence color (TT). Regarding the flower color, 2.6% of the total accessions (12/469 accessions) except the yellow soybean check showed a white flower (w1w1). For delphinidin 3-O-glucoside, petunidin 3-O-glucodsied, and malvidin 3-O-glucoside, ones with the w1w1 allele (white flower) were significantly lower than ones with the W1W1 allele (purple flower) (Figure 6B). There was no significant difference between the white and purple flower regarding cyanidin 3-O-glucoside, peonidin 3-O-glucoside, and pelargonidin 3-O-glucoside. The total measured anthocyanins content was 13.1 mg/g and 8.1 mg/g for the purple and white flower, respectively. To identify the genes controlling the anthocyanin content, GWAS was performed with 4459 SNPs (Figure 6C). For cyanidin 3-O-glucoside and the total anthocyanin content, the most significant SNPs were colocalized at 4,873,149 (Wm82.a2.v1 assembly) on chromosome 8. This SNP was near to the O locus, which corresponded with an anthocyanidin reductase gene. For delphinidin 3-O-glucoside and pelargonidin 3-O-glucoside, SNPs were located on chromosome 9, which were near the R locus.

4. Discussion

Molecular markers can directly reflect genetic diversity, in contrast to phenotypic assessments, because quantitative traits are often influenced by environmental factors [65]. The average genetic diversity index and PIC value of SNPs for the total BLG accessions were 0.26 and 0.22, respectively (Figure 1). However, Liu et al. [36] reported a genetic diversity study on soybean cultivars and advanced breeding lines from the U.S. and China, for which the genetic diversity index and PIC values were 0.3489 and 0.2769, respectively. Hao et al. [66] primarily used Chinese soybean landraces for a genetic diversity study, which resulted in 0.391 for the genetic diversity index and 0.313 for the PIC value, respectively. In addition, Lee et al. [34] and Yoon et al. [67] reported similar genetic diversity indexes for Korean soybean accessions, with an average of 0.70 and 0.71, respectively. The genetic diversity of a population is affected by the number of markers, diversity index of markers, number of accessions, and geographical distribution of accessions used in study. Compared with previously reported results for genetic diversity studies of soybean, the level of genetic diversity of the BLG collections was relatively low because we used only soybean accessions having the BLG phenotype, which were intensively collected from Korea [34,36,66,67,68,69]. The population structure analysis used in the present study revealed that there were three clusters in the 469 BLG accessions (Figure 2A). PCA and the UPGMA-phylogenetic tree showed that cluster 1 and cluster 3 had relatively lower genetic diversity than cluster 2 (Figure 2B,C). The result revealed that BLG collections in cluster 1 and cluster 3 may spread over a wide range of geographical areas by farmer’s distribution due to a better performance and yield for a long history of soybean cultivation in South Korea. Those accessions have been collected from different areas by the National Agrobiodiversity Center of Rural Development Administration in Korea [51]. Considered together, this may be one of the primary reasons that the BLG collections exhibited narrow genetic variability in this study.
Studies have shown that 5%–20% of the total population was generally constructed as a core collection, thereby representing 99.0% of the genetic diversity of the total population [65,70]. The size of the core collections could be determined by the genetic diversity of the total population [65]. In this study with 4,459 SNPs, 36 accessions were selected as the core collection to improve the utilization of useful breeding material for BLG phenotypes. Although the number of the core collection accounted for 7.7% of the total population, the core collection represented 99.5% of the genetic diversity of the entire population (Figure 3). The core collection was evenly distributed for the total population. Therefore, 36 accessions can be used as breeding materials for the BLG trait in the soybean breeding program in South Korea.
In this study, we found that all 469 BLG accessions contained the same mutation of the d1d2 or psbM allele (Figure 4). Kohzuma et al. [31] revealed that most of the green cotyledon soybean strains from Japan carried psbM (99.5%), whereas all Chinese green cotyledon soybeans consisted of d1d2 (100%). However, the Korean accessions showed both d1d2 (24.1%) and psbM (75.9%) (Figure 4A). In addition, we determined the frequencies of d1d2 and psbM in three clusters (Figure 4C–E), which were different by three clusters: 100.0% of cluster l, 80.0% of cluster 2, and 32.0% of cluster 3 had the psbM allele (Figure 4). Cluster 3 was divided into two subgroups based on the PCA analysis (Figure 2B). Note that all accessions in the light blue of cluster 3 contained the d1d2 genotype, whereas the ones in the dark blue of cluster 3 had green cotyledons due to the psbM allele (Figure 2B,C). Several studies mentioned that Korean soybeans were closely related to Japanese soybeans and were genetically distinct from the Chinese soybean population [34,35,71]. The genotypic frequency of the d1d2 and psbM alleles in this study supported that soybean accessions from Korea were a mixture of genetic contexts related to soybean from both Japan and China [72].
Because chlorophyll has anticarcinogenic properties [73,74], increasing the chlorophyll content is one of the targeted traits in breeding programs for soybean-based foods. The compositions of chlorophyll in green cotyledon were different based on the d1d2 or psbM genotypes. The amount of Chl a in d1d2 was ~2-fold higher than Chl a in the psbM genotype (Figure 5). The Chl a content was 4-fold higher than the Chl b content in the d1d2 genotypes, which resulted in a higher chlorophyll a/b ratio than that of the psbM genotype. Our result supported that d1d2 genotypes contain higher chlorophyll content [75]. In the soybean breeding program, d1d2 genotypes may be a good genetic resource for increasing the total chlorophyll contents in cotyledon seeds.
The soybean seed coat is controlled by multiple loci, such as I, T, W1, R, and O loci involved in the anthocyanin biosynthetic pathway [76,77,78]. The I locus encodes chalcone synthase, which is the key enzyme of the flavonoid pathway (Figure 6A) [79]. A black seed coat forms primarily due to the accumulation of anthocyanins and is controlled by the i allele. In most soybean with black seed coats, the three major anthocyanins are cyanidin 3-O-glucoside, delphinidin 3-O-glucoside, and petunidin 3-O-glucoside [17]. Lee et al. [16] reported six additional anthocyanin compounds from black seed coats, including a major amount of pelargonidin 3-O-glucosied and a minor amount of peonidin 3-O-glucoside. In the present study, we analyzed six anthocyanins and found that cyanidin 3-O-glucoside, delphinidin 3-O-glucoside, and petunidin 3-O-glucoside were major components of anthocyanin compositions in total BLG accessions (Figure 6B). The W1 locus, flavonoid 3′,5′-hydroxylase (F35H), plays an important role in the accumulation of delphinidin 3-O-glucoside, petunidin 3-O-glucoside, and malvidin 3-O-glucoside under the genetic background of the iiTT genotype [80]. Recently, Kim et al. [81] reported that the iiRRTTw1w1 genotype would prohibit the accumulation of delphinidin 3-O-glucoside and petunidin 3-O-glucoside compounds, whereas the T locus, flavonoid 3′-hydroxylase (F3H), can control the production of cyanidin-derived and delphinidin-derived anthocyanin compounds. The result of this study was that the purple flower (W1W1) produced ~5.0 mg/g more total anthocyanin (Figure 6B). Flower color can be used as a possible selection trait to increase the total anthocyanin composition in the black soybean breeding program.
Although 97.4% of the total BLG accessions showed a black seed coat (ii allele), tawny pubescence (TT allele), and purple flower (W1W1 allele) in the present study, each anthocyanin composition still showed phenotypic variations. The GWAS result showed that SNPs on chromosomes 8 and 9 were associated with the production of delphinidin 3-O-glucoside, pelargonidin 3-O-glucoside, cyanidin 3-O-glucoside, and total anthocyanins. These SNPs were near the R locus and O locus on chromosomes 8 and 9, respectively (Figure 6C). The R locus is the R2R3 MYB transcription factor for upregulating UDP-glycose: flavonoid 3-O-glycosyltranferase (UF3GT) in black soybeans [76]. For the O locus, the expression level of anthocyanidin reductase (ANR) in the soybean genome is associated with the red-brown and black color of the soybean seed coat [82]. The GWAS result concluded that the extent of the expression levels of UF3GT and ANR may be associated with the amount of anthocyanin in BLG soybean.

5. Conclusions

In conclusion, BLG soybeans exhibited narrow genetic variability due to artificial selection, and a core collection representing the genetic diversity of the total BLG soybeans was constructed based on the 6K SNP genotypes. This core collection can provide useful genetic resources for the development of new cultivars for BLG seeds with increased anthocyanin and chlorophyll contents as part of a breeding program for soybean food.

Supplementary Materials

The following are available online at https://www.mdpi.com/2073-4395/11/3/581/s1, Figure S1: Frequency distribution of an average of two chlorophyll content and sum of total chlorophyll contents in 469 accessions over three years, Figure S2: Frequency distribution of an average of two six anthocyanin content and sum of total anthocyanin contents in 469 accessions over three year, Table S1: List of 470 soybean accessions, subpopulation, core collection and genotype of D1, D2 and PsbM allele, Table S2: List of pure line selection from 47 accessions, Table S3: Mean squares from analysis of variances of each measured chlorophyll for soybean accessions over 3 years, Table S4: Mean squares from analysis of variances of each measured anthocyanin for soybean accessions over 3 years.

Author Contributions

H.J. and J.Y.L. contributed equally for this work. Conceptualization, J.-D.L.; Methodology, H.J., J.Y.L. and H.C.; Formal analysis, H.J. and J.Y.L.; Visualization, H.J.; Investigation, J.Y.L., H.J.C., C.K.S. and J.S.B.; Writing—Original Draft Preparation, H.J.; Writing—Review & Editing, J.Y.L., K.B., J.T.S. and J.-D.L. All authors have read and agreed to the published version of the manuscript.

Funding

This research was funded by a grant from the Republic of Korea Rural Development Administration New Breeding Technologies Development Program (Project No. PJ01488301).

Institutional Review Board Statement

Not applicable.

Informed Consent Statement

Not applicable.

Data Availability Statement

The datasets generated during this study are available from the corresponding author on reasonable request.

Acknowledgments

The authors would like to acknowledge the personnel from the Plant Genetics and Breeding lab at the Kyungpook National University and Gyeongsangbuk-do Provincial Agricultural Research & Extension Service for their time and work on the field experiments.

Conflicts of Interest

The authors declare no conflict of interest.

References

  1. Liu, K. Chemistry and nutritional value of soybean components. In Soybeans; Springer: Boston, MA, USA, 1997; pp. 25–113. [Google Scholar] [CrossRef]
  2. Watanabe, T. Science of Tofu, Chapter 2, Manufacture of Tofu; Food Journal Co. Ltd.: Kyoto, Japan, 1997. [Google Scholar]
  3. Willcox, J.K.; Ash, S.L.; Catignani, G.L. Antioxidants and prevention of chronic disease. Crit. Rev. Food Sci. Nutr. 2004, 44, 275–295. [Google Scholar] [CrossRef]
  4. Xu, B.; Chang, S.K. Antioxidant capacity of seed coat, dehulled bean, and whole black soybeans in relation to their distributions of total phenolics, phenolic acids, anthocyanins, and isoflavones. J. Agric. Food Chem. 2008, 56, 8365–8373. [Google Scholar] [CrossRef]
  5. Do, M.H.; Lee, S.S.; Jung, P.J.; Lee, M.H. Intake of fruits, vegetables, and soy foods in relation to breast cancer risk in Korean women: A case-control study. Nutr. Cancer 2007, 57, 20–27. [Google Scholar] [CrossRef]
  6. Takahashi, R.; Ohmori, R.; Kiyose, C.; Momiyama, Y.; Ohsuzu, F.; Kondo, K. Antioxidant activities of black and yellow soybeans against low density lipoprotein oxidation. J. Agric. Food Chem. 2005, 53, 4578–4582. [Google Scholar] [CrossRef] [PubMed]
  7. Ganesan, K.; Xu, B. A critical review on polyphenols and health benefits of black soybeans. Nutrients 2017, 9, 455. [Google Scholar] [CrossRef] [Green Version]
  8. Jhan, J.K.; Chung, Y.C.; Chen, G.H.; Chang, C.H.; Lu, Y.C.; Hsu, C.K. Anthocyanin contents in the seed coat of black soya bean and their anti-human tyrosinase activity and antioxidative activity. Int. J. Cosmet. Sci. 2016, 38, 319–324. [Google Scholar] [CrossRef]
  9. Hymowitz, T.; Newell, C. Taxonomy, speciation, domestication, dissemination, germplasm resources, and variation in the genus Glycine. In Advances in Legume Science; Summerfield, R.J.B.A., Ed.; Royal Botanical Gardens: Richmond, UK, 1980; pp. 251–264. [Google Scholar]
  10. Gonzali, S.; Perata, P. Anthocyanins from Purple Tomatoes as Novel Antioxidants to Promote Human Health. Antioxidants 2020, 9, 1017. [Google Scholar] [CrossRef]
  11. De Masi, L.; Bontempo, P.; Rigano, D.; Stiuso, P.; Carafa, V.; Nebbioso, A.; Piacente, S.; Montoro, P.; Aversano, R.; D’Amelia, V.; et al. Comparative phytochemical characterization, genetic profile, and antiproliferative activity of polyphenol-rich extracts from pigmented tubers of different Solanum tuberosum varieties. Molecules 2020, 25, 233. [Google Scholar] [CrossRef] [PubMed] [Green Version]
  12. Norberto, S.; Silva, S.; Meireles, M.; Faria, A.; Pintado, M.; Calhau, C. Blueberry anthocyanins in health promotion: A metabolic overview. J. Funct. Foods 2013, 5, 1518–1528. [Google Scholar] [CrossRef]
  13. Tsuda, T. Dietary anthocyanin-rich plants: Biochemical basis and recent progress in health benefits studies. Mol. Nutr. Food Res. 2012, 56, 159–170. [Google Scholar] [CrossRef]
  14. Clough, S.J.; Tuteja, J.H.; Li, M.; Marek, L.F.; Shoemaker, R.C.; Vodkin, L.O. Features of a 103-kb gene-rich region in soybean include an inverted perfect repeat cluster of CHS genes comprising the I locus. Genome 2004, 47, 819–831. [Google Scholar] [CrossRef] [Green Version]
  15. Todd, J.J.; Vodkin, L.O. Duplications that suppress and deletions that restore expression from a chalcone synthase multigene family. Plant Cell 1996, 8, 687–699. [Google Scholar] [CrossRef]
  16. Lee, J.H.; Kang, N.S.; Shin, S.O.; Shin, S.H.; Lim, S.G.; Suh, D.Y.; Baek, I.Y.; Park, K.Y.; Ha, T.J. Characterisation of anthocyanins in the black soybean (Glycine max L.) by HPLC-DAD-ESI/MS analysis. Food Chem. 2009, 112, 226–231. [Google Scholar] [CrossRef]
  17. Choung, M.G.; Baek, I.Y.; Kang, S.T.; Han, W.Y.; Shin, D.C.; Moon, H.P.; Kang, K.H. Isolation and determination of anthocyanins in seed coats of black soybean (Glycine max (L.) Merr.). J. Agric. Food Chem. 2001, 49, 5848–5851. [Google Scholar] [CrossRef]
  18. Mendel, G. Versuche uber pflanzen-hybriden. Verh. Nat. Verein Brunn 1866, 4, 3–47. [Google Scholar] [CrossRef]
  19. Thomas, H.; Schellenberg, M.; Vicentini, F.; Matile, P. Gregor Mendel’s green and yellow pea seeds. Bot. Acta 1996, 109, 3–4. [Google Scholar] [CrossRef]
  20. White, O.E. Studies of inheritance in Pisum. II. The present state of knowledge of heredity and variation in peas. Proc. Am. Philos. Soc. 1917, 56, 487–588. [Google Scholar]
  21. Armstead, I.; Donnison, I.; Aubry, S.; Harper, J.; Hörtensteiner, S.; James, C.; Mani, J.; Moffet, M.; Ougham, H.; Roberts, L.; et al. Cross-species identification of Mendel’s I locus. Science 2007, 315, 73. [Google Scholar] [CrossRef] [Green Version]
  22. Sato, Y.; Morita, R.; Nishimura, M.; Yamaguchi, H.; Kusaba, M. Mendel’s green cotyledon gene encodes a positive regulator of the chlorophyll degrading pathway. Proc. Natl. Acad. Sci. USA 2007, 104, 14169–14174. [Google Scholar] [CrossRef] [PubMed] [Green Version]
  23. Croce, R.; Van Amerongen, H. Natural strategies for photosynthetic light harvesting. Nat. Chem. Biol. 2014, 10, 492–501. [Google Scholar] [CrossRef]
  24. Eckhardt, U.; Grimm, B.; Hortensteiner, S. Recent advances in chlorophyll biosynthesis and breakdown in higher plants. Plant Mol. Biol. 2004, 56, 1–14. [Google Scholar] [CrossRef]
  25. Hortensteiner, S.; Krautler, B. Chlorophyll breakdown in higher plants. Biochim. Biophys. Acta 2011, 1807, 977–988. [Google Scholar] [CrossRef] [PubMed] [Green Version]
  26. Thomas, H.; Howarth, C.J. Five ways to stay green. J. Exp. Bot. 2000, 51, 329–337. [Google Scholar] [CrossRef] [PubMed] [Green Version]
  27. Owen, F.V. Inheritance studies in soybeans. II. Glabrousness, color of pubescence, time of maturity, and linkage relations. Genetics 1927, 12, 519. [Google Scholar] [CrossRef]
  28. Terao, H. Maternal inheritance in the soybean. Am. Nat. 1918, 52, 51–56. [Google Scholar] [CrossRef]
  29. Fang, C.; Li, C.; Li, W.; Wang, Z.; Zhou, Z.; Shen, Y.; Wu, M.; Wu, Y.; Li, G.; Kong, L.A.; et al. Concerted evolution of D1 and D2 to regulate chlorophyll degradation in soybean. Plant J. 2014, 77, 700–712. [Google Scholar] [CrossRef]
  30. Guiamet, J.J.; Schwartz, E.; Pichersky, E.; Nooden, L.D. Characterization of cytoplasmic and nuclear mutations affecting chlorophyll and chlorophyll-binding proteins during senescence in soybean. Plant Physiol. 1991, 96, 227–231. [Google Scholar] [CrossRef]
  31. Kohzuma, K.; Sato, Y.; Ito, H.; Okuzaki, A.; Watanabe, M.; Kobayashi, H.; Nakano, M.; Yamatani, H.; Masuda, Y.; Nagashima, Y.; et al. The non-Mendelian green cotyledon gene in soybean encodes a small subunit of photosystem II. Plant Physiol. 2017, 173, 2138–2147. [Google Scholar] [CrossRef] [Green Version]
  32. Hirata, T.; Abe, J.; Shimamoto, Y. Genetic structure of the Japanese soybean population. Genet. Resour. Crop Evol. 1999, 46, 441–453. [Google Scholar] [CrossRef]
  33. Lee, J.D.; Yu, J.K.; Hwang, Y.H.; Blake, S.; So, Y.S.; Lee, G.J.; Nguyen, H.T.; Shannon, J.G. Genetic diversity of wild soybean (Glycine soja Sieb. and Zucc.) accessions from South Korea and other countries. Crop Sci. 2008, 48, 606–616. [Google Scholar] [CrossRef]
  34. Lee, J.D.; Vuong, T.D.; Moon, H.; Yu, J.K.; Nelson, R.L.; Nguyen, H.T.; Shannon, J.G. Genetic diversity and population structure of Korean and Chinese soybean [Glycine max (L.) Merr.] accessions. Crop Sci. 2011, 51, 1080–1088. [Google Scholar] [CrossRef]
  35. Li, Z.; Nelson, R.L. Genetic diversity among soybean accessions from three countries measured by RAPDs. Crop Sci 2001, 41, 1337–1347. [Google Scholar] [CrossRef] [Green Version]
  36. Liu, Z.; Li, H.; Wen, Z.; Fan, X.; Li, Y.; Guan, R.; Guo, Y.; Wang, S.; Wang, D.; Qiu, L. Comparison of genetic diversity between Chinese and American soybean (Glycine max (L.)) accessions revealed by high-density SNPs. Front. Plant Sci. 2017, 8, 2014. [Google Scholar] [CrossRef] [Green Version]
  37. Xu, D.H.; Abe, J.; Gai, J.Y.; Shimamoto, Y. Diversity of chloroplast DNA SSRs in wild and cultivated soybeans: Evidence for multiple origins of cultivated soybean. Theor. Appl. Genet. 2002, 105, 645–653. [Google Scholar] [CrossRef]
  38. Frankel, O.H.; Brown, A.H. Plant genetic resources today: A critical appraisal. In Crop Genetic Resources; Holden, J.H.W., Williams, J.T., Eds.; Allen and Unwin: London, UK, 1984; pp. 249–257. [Google Scholar]
  39. Dong, Y.S.; Cao, Y.S.; Zhang, X.Y.; Liu, S.C.; Wang, L.F.; You, G.X.; Pang, B.S.; Li, L.H.; Jia, J.Z. Establishment of candidate core collections in Chinese common wheat germplasm. J. Plant Genet. Resour. 2003, 4, 1–8. [Google Scholar]
  40. Diwan, N.; McIntosh, M.S.; Bauchan, G.R. Methods of developing a core collection of annual Medicago species. Theor. Appl. Genet. 1995, 90, 755–761. [Google Scholar] [CrossRef]
  41. Holbrook, C.C.; Anderson, W.F. Evaluation of a core collection to identify resistance to late leafspot in peanut. Crop Sci. 1995, 35, 1700–1702. [Google Scholar] [CrossRef]
  42. Hu, J.; Wang, P.; Su, Y.; Wang, R.; Li, Q.; Sun, K. Microsatellite diversity, population structure, and core collection formation in melon germplasm. Plant Mol. Biol. Rep. 2015, 33, 439–447. [Google Scholar] [CrossRef]
  43. Lee, H.Y.; Ro, N.Y.; Jeong, H.J.; Kwon, J.K.; Jo, J.; Ha, Y.; Jung, A.; Han, J.W.; Venkatesh, J.; Kang, B.C. Genetic diversity and population structure analysis to construct a core collection from a large Capsicum germplasm. BMC Genet. 2016, 17, 142. [Google Scholar] [CrossRef] [Green Version]
  44. Li, Z.C.; Zhang, H.I.; Cao, Y.S.; Qiu, Z.E.; Wei, X.H.; Tang, S.X.; Yu, P.; Wang, X. Studies on the sampling strategy for primary core collection of Chinese ingenious rice. Acta Agron. Sin. 2003, 29, 20–24. [Google Scholar]
  45. Wang, L.; Guan, Y.; Guan, R.; Li, Y.; Ma, Y.; Dong, Z.; Liu, X.; Zhang, H.; Zhang, Y.; Liu, Z.; et al. Establishment of Chinese soybean Glycine max core collections with agronomic traits and SSR markers. Euphytica 2006, 151, 215–223. [Google Scholar] [CrossRef]
  46. Xu, C.; Gao, J.; Du, Z.; Li, D.; Wang, Z.; Li, Y.; Pang, X. Identifying the genetic diversity, genetic structure and a core collection of Ziziphus jujuba Mill. var. jujuba accessions using microsatellite markers. Sci. Rep. 2016, 6, 31503. [Google Scholar] [CrossRef]
  47. Xu, H.; Mei, Y.; Hu, J.; Zhu, J.; Gong, P. Sampling a core collection of island cotton (Gossypium barbadense L.) based on the genotypic values of fiber traits. Genet. Resour. Crop Evol. 2006, 53, 515–521. [Google Scholar] [CrossRef]
  48. Hu, J.; Zhu, J.; Xu, H.M. Methods of constructing core collections by stepwise clustering with three sampling strategies based on the genotypic values of crops. Theor. Appl. Genet. 2000, 101, 264–268. [Google Scholar] [CrossRef]
  49. Liu, X.B.; Li, J.; Yang, Z.L. Genetic diversity and structure of core collection of winter mushroom (Flammulina velutipes) developed by genomic SSR markers. Hereditas 2018, 155, 3. [Google Scholar] [CrossRef] [PubMed] [Green Version]
  50. Hymowitz, T. The history of the soybean. In Soybeans: Chemistry, Production, Processing, and Utilization; Johnson, L.A., White, P.J., Galloway, R., Eds.; AOCS Press: Urbana, IL, USA, 2008; pp. 1–31. [Google Scholar] [CrossRef]
  51. National Agrobiodiversity Center. Available online: http://genebank.rda.go.kr/ (accessed on 15 December 2020).
  52. Baek, I.Y.; Kang, S.T.; Shin, D.C.; Choung, M.G.; Han, W.Y.; Kwack, Y.H.; Moon, H.P. A new black soybean variety with green cotyledon, early maturity and large seed size “Cheongjakong”. Korean J. Breed Sci. 2001, 33, 240–241. [Google Scholar]
  53. Lee, C.; Choi, M.S.; Kim, H.T.; Yun, H.T.; Lee, B.; Chung, Y.S.; Kim, R.W.; Choi, H.K. Soybean [Glycine max (L.) Merrill]: Importance as a crop and pedigree reconstruction of Korean varieties. Plant Breed Biotech. 2015, 3, 179–196. [Google Scholar] [CrossRef] [Green Version]
  54. Fehr, W.R.; Caviness, C.E.; Burmood, D.T.; Pennington, J.S. Stage of development descriptions for soybeans, Glycine Max (L.) Merrill1. Crop Sci. 1971, 11, 929–931. [Google Scholar] [CrossRef]
  55. Doyle, J.; Doyle, J.L. Genomic plant DNA preparation from fresh tissue-CTAB method. Phytochem. Bull. 1987, 19, 11–15. [Google Scholar]
  56. Akond, M.; Liu, S.; Schoener, L.; Anderson, J.A.; Kantartzi, S.K.; Meksem, K.; Song, Q.; Wang, D.; Wen, Z.; Lightfoot, D.A.; et al. A SNP-based genetic linkage map of soybean using the SoySNP6K Illumina Infinium BeadChip genotyping array. J. Plant Genome Sci. 2013, 1, 80–89. [Google Scholar] [CrossRef]
  57. Song, Q.; Hyten, D.L.; Jia, G.; Quigley, C.V.; Fickus, E.W.; Nelson, R.L.; Cregan, P.B. Development and evaluation of SoySNP50K, a high-density genotyping array for soybean. PLoS ONE 2013, 8, e54985. [Google Scholar] [CrossRef] [Green Version]
  58. Liu, K.; Muse, S.V. PowerMarker: An integrated analysis environment for genetic marker analysis. Bioinform 2005, 21, 2128–2129. [Google Scholar] [CrossRef] [PubMed] [Green Version]
  59. Kumar, A.; Sharma, D.; Tiwari, A.; Jaiswal, J.P.; Singh, N.K.; Sood, S. Genotyping-by-sequencing analysis for determining population structure of finger millet germplasm of diverse origins. Plant Genome 2016, 9, 1–5. [Google Scholar] [CrossRef] [PubMed] [Green Version]
  60. Pritchard, J.K.; Wen, W.; Daniel, D. Documentation for Structure Software, version 2; University of Chicago: Chicago, IL, USA, 2010. [Google Scholar]
  61. Jeong, S.; Kim, J.Y.; Jeong, S.C.; Kang, S.T.; Moon, J.K.; Kim, N. GenoCore: A simple and fast algorithm for core subset selection from large genotype datasets. PLoS ONE 2018, 12, e0181420. [Google Scholar] [CrossRef] [PubMed] [Green Version]
  62. Bradbury, P.J.; Zhang, Z.; Kroon, D.E.; Casstevens, T.M.; Ramdoss, Y.; Buckler, E.S. TASSEL: Software for association mapping of complex traits in diverse samples. Bioinform 2007, 23, 2633–2635. [Google Scholar] [CrossRef]
  63. Zhang, Z.; Ersoz, E.; Lai, C.Q.; Todhunter, R.J.; Tiwari, H.K.; Gore, M.A.; Bradbury, P.J.; Yu, J.; Arnett, D.K.; Ordovas, J.M.; et al. Mixed linear model approach adapted for genome-wide association studies. Nat. Genet. 2010, 42, 355–360. [Google Scholar] [CrossRef] [Green Version]
  64. Yu, J.; Pressoir, G.; Briggs, W.H.; Bi, I.V.; Yamasaki, M.; Doebley, J.F.; McMullen, M.D.; Gaut, B.S.; Nielsen, D.M.; Holland, J.B.; et al. A unified mixed-model method for association mapping that accounts for multiple levels of relatedness. Nat. Genet. 2006, 38, 203–208. [Google Scholar] [CrossRef] [PubMed]
  65. Jeong, N.; Kim, K.S.; Jeong, S.; Kim, J.Y.; Park, S.K.; Lee, J.S.; Jeong, S.C.; Kang, S.T.; Ha, B.K.; Kim, D.Y.; et al. Korean soybean core collection: Genotypic and phenotypic diversity population structure and genome-wide association study. PLoS ONE 2019, 14, e0224074. [Google Scholar] [CrossRef]
  66. Hao, D.; Cheng, H.; Yin, Z.; Cui, S.; Zhang, D.; Wang, H.; Yu, D. Identification of single nucleotide polymorphisms and haplotypes associated with yield and yield components in soybean (Glycine max) landraces across multiple environments. Theor. Appl. Genet. 2012, 124, 447–458. [Google Scholar] [CrossRef] [PubMed]
  67. Yoon, M.S.; Lee, J.; Kim, C.Y.; Kang, J.H.; Cho, E.G.; Baek, H.J. DNA profiling and genetic diversity of Korean soybean (Glycine max (L.) Merrill) landraces by SSR markers. Euphytica 2009, 165, 69–77. [Google Scholar] [CrossRef]
  68. Li, Y.H.; Smulders, M.J.; Chang, R.Z.; Qiu, L.J. Genetic diversity and association mapping in a collection of selected Chinese soybean accessions based on SSR marker analysis. Conserv. Genet. 2011, 12, 1145–1157. [Google Scholar] [CrossRef]
  69. Zhou, Z.; Jiang, Y.; Wang, Z.; Gou, Z.; Lyu, J.; Li, W.; Yu, Y.; Shu, L.; Zhao, Y.; Ma, Y.; et al. Resequencing 302 wild and cultivated accessions identifies genes related to domestication and improvement in soybean. Nat. Biotechnol. 2015, 33, 408–414. [Google Scholar] [CrossRef] [PubMed] [Green Version]
  70. Van Hintum, T.J.; Brown, A.H.; Spillane, C. Core Collections of Plant Genetic Resources; IPGRI Technical Bulletin No. 3; International Plant Genetic Resources Institute: Rome, Italy, 2020. [Google Scholar]
  71. Griffin, J.D.; Palmer, R.G. Variability of thirteen isozyme loci in the USDA soybean germplasm collections. Crop Sci. 1995, 35, 897–904. [Google Scholar] [CrossRef]
  72. Abe, J.; Xu, D.; Suzuki, Y.; Kanazawa, A.; Shimamoto, Y. Soybean germplasm pools in Asia revealed by nuclear SSRs. Theor. Appl. Genet. 2003, 106, 445–453. [Google Scholar] [CrossRef] [PubMed]
  73. Donaldson, M.S. Nutrition and cancer: A review of the evidence for an anti-cancer diet. Nutr. J. 2004, 3, 19. [Google Scholar] [CrossRef] [PubMed] [Green Version]
  74. Li, W.T.; Tsao, H.W.; Chen, Y.Y.; Cheng, S.W.; Hsu, Y.C. A study on the photodynamic properties of chlorophyll derivatives using human hepatocellular carcinoma cells. Photochem. Photobiol. Sci. 2007, 6, 1341–1348. [Google Scholar] [CrossRef] [PubMed]
  75. Kang, S.; Seo, M.; Moon, J.; Yun, H.; Lee, Y.; Kim, S.; Hwang, Y.; Lee, S.; Choung, M. Introduction of stay green mutant for the development of black seed coat and green cotyledon soybean variety. Korean J. Crop Sci. 2010, 55, 187–194. [Google Scholar]
  76. Gillman, J.D.; Tetlow, A.; Lee, J.D.; Shannon, J.G.; Bilyeu, K. Loss-of-function mutations affecting a specific Glycine max R2R3 MYB transcription factor result in brown hilum and brown seed coats. BMC Plant Biol. 2011, 11, 1–12. [Google Scholar] [CrossRef] [Green Version]
  77. Song, J.; Liu, Z.; Hong, H.; Ma, Y.; Tian, L.; Li, X.; Li, Y.H.; Guan, R.; Guo, Y.; Qiu, L.J. Identification and validation of loci governing seed coat color by combining association mapping and bulk segregation analysis in soybean. PLoS ONE 2016, 11, e0159064. [Google Scholar] [CrossRef]
  78. Toda, K.; Yang, D.; Yamanaka, N.; Watanabe, S.; Harada, K.; Takahashi, R. A single-base deletion in soybean flavonoid 3′-hydroxylase gene is associated with gray pubescence color. Plant Mol. Biol. 2002, 50, 187–196. [Google Scholar] [CrossRef]
  79. Tuteja, J.H.; Clough, S.J.; Chan, W.C.; Vodkin, L.O. Tissue-specific gene silencing mediated by a naturally occurring chalcone synthase gene cluster in Glycine max. Plant Cell 2004, 16, 819–835. [Google Scholar] [CrossRef] [PubMed] [Green Version]
  80. Zabala, G.; Vodkin, L.O. A rearrangement resulting in small tandem repeats in the F3′5′ H gene of white flower genotypes is associated with the soybean W1 locus. Crop Sci. 2007, 47, S113–S124. [Google Scholar] [CrossRef]
  81. Kim, J.H.; Park, J.S.; Lee, C.Y.; Jeong, M.G.; Xu, J.L.; Choi, Y.; Jung, H.W.; Choi, H.K. Dissecting seed pigmentation-associated genomic loci and genes by employing dual approaches of reference-based and k-mer-based GWAS with 438 Glycine accessions. PLoS ONE 2020, 15, e0243085. [Google Scholar] [CrossRef]
  82. Kovinich, N.; Saleem, A.; Arnason, J.T.; Miki, B. Combined analysis of transcriptome and metabolite data reveals extensive differences between black and brown nearly-isogenic soybean (Glycine max) seed coats enabling the identification of pigment isogenes. BMC Genom. 2011, 12, 381. [Google Scholar] [CrossRef] [PubMed] [Green Version]
Figure 1. Distribution of the genetic diversity of black soybean accessions with green cotyledon. Genetic diversity index (A), polymorphic information center (B), minor allele frequency (C), and heterozygosity (D) of 4459 SNPs across 467 black soybean collections with green cotyledon with three check cultivars.
Agronomy 11 00581 g001
Figure 2. Cluster analyses and a phylogenetic tree of 469 black soybean accessions with green cotyledon and a yellow cultivar. (A) ADMIXUTRE plot. Clustering from 2 to 5 of K value for the entire set of black soybean accessions with green cotyledon with yellow soybean. Each accession is showed to a vertical bar representing the proportion of the accession’s genome from clusters. (B) Principal components of SNP variation. Each PC1 and PC2 explained 26.0% and 14.4% of variance in the data. Cluster 1, cluster 2 and cluster 3 are shown by grey, orange, and blue color, respectively. Yellow, green, and light blue dot represented as Cheongja 3 (black soybean cultivar with green cotyledon), Cheongja (black soybean cultivar with green cotyledon) and Uram (yellow soybean), respectively (C) UPGMA (unweighted pair group method with arithmetic mean) phylogenetic tree of entire set of 470 accessions. Circle with light blue is yellow soybean, Uram and red circle consists of Cheongja and Cheongja 3.
Agronomy 11 00581 g002
Figure 3. Principal component and a phylogenetic tree of core subset containing 36 black soybean accessions with green cotyledon. (A) Distribution of three clusters in core subset (B) Principal components of SNP variation. Entire population and core subset are shown by blue and orange dots, respectively.
Agronomy 11 00581 g003
Figure 4. Distribution of d1d2 and psbM among black soybean accessions with green cotyledon in South Korea. Percentage of d1d2 genotype and psbM genotype are provided in each graph. (A) Total population. (B) Core set. (C) Cluster 1. (D) Cluster 2. (E) Cluster 3.
Agronomy 11 00581 g004
Figure 5. Chlorophyll content of d1d2 and psbM genotype. (A) Chlorophyll a, b and total content of d1d2 and psbM genotype. (B) Green cotyledon color without black seed coat for psbM and d1d2 genotype (C) Chlorophyll a/b ratio of d1d2 and psbM genotype. Statistical analysis was conducted using the Student’s t test (** p < 0.01). Bars indicate standard error.
Agronomy 11 00581 g005
Figure 6. Schematic for genes in the anthocyanin biosynthetic pathway with comparison of measured anthocyanin compositions and GWAS anlaysis. (A) the biosynthetic pathway of anthocyanins. Genes or corresponding enzymes are denoted with the capital letters of abbreviated names, as follows: Chalcone synthase (CHS, I locus); Flavonoid 3′-hydroxylase (F3′H, T locus); Flavonoid 3′,5′-hydroxylase (F3′5′H, W1 locus); Chalcone isomerase (CHI); Dihydroflavonol-4-reductase (DFR); Anthocyanidin synthase (ANS); Anthocyanidin reductase (ANR, O locus); Flavonoid 3-O-glucosyltransferase (UF3GT); Anthocyanin O-methyltransferase (AOMT). (B) Comparison of measured anthocyanin content of W1W1 and w1w1 genotype. Statistical analysis was conducted using the Student’s t test (** p < 0.01, ns; no significant). (C) GWAS anlaysis on mean of each anthocyanin and total content over three years. Delphinidin 3-O-glucoside (D3G); Cyanidin 3-O-glucoside (C3G); Petunidin 3-O-glucoside (P3G); Pelargonidin 3-O-glucoside (Pl3G); Peonidin 3-O-glucoside (Pn3G); Malvidin 3-O-glucosie (M3G).
Agronomy 11 00581 g006
Publisher’s Note: MDPI stays neutral with regard to jurisdictional claims in published maps and institutional affiliations.

