Article

A Sustainable Approach for Improving Soil Properties and Reducing N2O Emissions Is Possible through Initial and Repeated Biochar Application

1
Department of Biometeorology and Hydrology, Faculty of Horticulture and Landscape Engineering, Slovak University of Agriculture, 949 76 Nitra, Slovakia
2
Department of Soil Science, Faculty of Agrobiology and Food Resources, Slovak University of Agriculture, 949 76 Nitra, Slovakia
*
Author to whom correspondence should be addressed.
Agronomy 2021, 11(3), 582; https://doi.org/10.3390/agronomy11030582
Submission received: 12 February 2021 / Revised: 15 March 2021 / Accepted: 16 March 2021 / Published: 19 March 2021

Abstract

:
Recent findings of changing climate, water scarcity, soil degradation, and greenhouse gas emissions have brought major challenges to sustainable agriculture worldwide. Biochar application to soil proves to be a suitable solution to these problems. Although the literature presents the pros and cons of biochar application, very little information is available on the impact of repeated application. In this study, we evaluate and discuss the effects of initial and reapplied biochar (both in rates of 0, 10, and 20 t ha−1) combined with N fertilization (at doses of 0, 40, and 80 kg ha−1) on soil properties and N2O emission from Haplic Luvisol in the temperate climate zone (Slovakia). Results showed that biochar generally improved the soil properties such as soil pH(KCl) (p ≤ 0.05; from acidic towards moderately acidic), soil organic carbon (p ≤ 0.05; an increase from 4% to over 100%), soil water availability (an increase from 1% to 15%), saturated hydraulic conductivity (an increase from 5% to 95%). The effects were more significant in the following cases: repeated rather than single biochar application, higher rather than lower biochar application rates, and higher rather than lower N fertilization levels. Initial and repeated biochar applications, leading to N2O emissions reduction, can be related to increased soil pH(KCl).

1. Introduction

Today, global agriculture is facing massive challenges, such as increasing demand for food production to provide for a growing population [1,2] while reducing the environmental footprint of agricultural intensification brought by the “green revolution” [3,4]. Soil is a critical life-support system of planet Earth, maintaining essential ecosystem services such as biodiversity, biogeochemical cycling, and water cycling. At the same time, soil is still a fundamental resource of production for agriculture. Unfortunately, more than 25% of the global soil resources are highly degraded, and 44% are moderately degraded due to the rapid industrialization, urbanization, and agricultural activities during the last few decades [5]. In general, soil quality depends on the quantity and quality of soil organic matter (SOM), which is one of the most important features of soil. Its characteristic depends on a variety of biotic and abiotic variables of the ecosystem, such as climate, soil texture, mineral composition, quantity of organic residues, and other factors., In an era of rapidly changing civilization, leading to changes in climate and soil conditions, SOM content becomes increasingly important, not only for the proper functioning of ecosystems but also for the socioeconomic development of many regions of the world [6]. During the last few decades, the progressive degradation of SOM has been observed in EU countries. This problem was pointed out in the EU New Soil Strategy [7] where the actual reduction of SOM content was listed as one of the most important issues, together with associated efforts to increase SOM and restore carbon-rich ecosystems.
Crop rotation, tillage, and fertilization change the inputs and outputs and, consequently, the entire dynamics of SOM in agricultural soils [8,9,10]. These changes release considerable amounts of carbon dioxide (CO2), nitrous oxide (N2O), and methane (CH4) into the atmosphere, contributing to a global mean production intensity of 0.16 Mg CO2e M kcal−1 [11], with a negative impact on global climate. Emissions of greenhouse gases (GHGs) CH4 and N2O have a global warming potential of 28 and 265 times more than CO2, respectively, [12] indicating that addressing the N2O reduction from soil to the atmosphere is a highly topical issue. In addition, N2O emissions are projected to increase by 35–60% by 2030 due to the increased agricultural use of nitrogen (N) and increased animal manure production [13]. Although N fertilization is one of the important agronomic resources for obtaining acceptable crop yields, the long-term application of mineral N-fertilizers leads to higher GHG production [14]. N2O emissions are affected by factors such as temperature, water regime, microbial activity, and also soil N status due to carbon and nitrogen moving through ecosystems in coupled biogeochemical cycles [15].
Biochar usage represents an opportunity to manage nutrient demands and inefficiencies better in intensive agriculture. Biochar refers to the aromatic carbon materials produced by the pyrolysis of biomass (heating in an oxygen-limited environment at temperatures of 400–900 °C). Because of its high porosity and surface area, biochar alters the soil’s physical properties such as bulk density [16,17], soil porosity [18], water-holding capacity [19,20], hydraulic conductivity [21], surface area, and penetration resistance [22]. Buchkina et al. [23] and Castellini et al. [24] have shown that biochar has the potential to change the root zone water balance of ecosystems. However, changes of soil chemical properties such as soil pH are more visible in soils with less suitable pH. Biochar is a source of nutrients [25] that can be regulated in the soil through improved cation exchange capacity CEC [26,27]; additionally, as a soil ameliorant, it can contribute to the recovery of nutrients from waste and increase crop yields while abating climate change [28,29,30,31]. However, in some studies, no effects (or even negative effects) were found on soil properties and crop yields [32]. This highlights the need for further studies looking at the effects of biochar in diverse soil types and cropping systems. As a stable form of carbon, biochar can stay thousands of years in the soil [33]. Incorporating it into agricultural soils may represent an important strategy for GHG reduction by retaining the carbon within the soils in a biosequestration process [34,35]. Several studies showed that biochar addition to agricultural soils decreased N2O emissions [36,37,38,39] as a result of an increase in soil pH [40], adsorption of NO3, NH4+, N2O [41,42,43], and the toxic effect of biochar organic compounds (nitrifier and denitrifier communities) [44,45]. The reason for this reduction can also be an increase in soil aeration caused by the biochar amendment, which increases the oxidation of N2O and other greenhouse gasses [46,47,48,49]. Li et al. [15] observed an N2O emission reduction within a range of 1.7% to 25.4% after the application of wheat straw biochar produced at 400 °C. Suddick and Six [50] showed both the negative and neutral effects of biochar application on N2O emissions from the soil. In general, most studies have found biochar amendments to either decrease or not significantly affect soil daily N2O emissions.
Although there has been an increasing number of studies focusing on the short-term effects of biochar application to the soil, studies tracing its long-term effects (i.e., >4 years) are scarce. There are also only a few datasets on the reapplication of biochar (however, not describing N2O emissions) under field conditions to make recommendations for farmers regarding suitable biochar application rates, reapplication needs, and fertilizer management. Another aspect is that many studies have focused on problematic soils such as acidic, saline, and soils low in soil organic carbon (SOC), where the changes after biochar application can be expected to be robust. However, in theory, the potential of biochar application may be the greatest on the fertile agricultural soils (including Europe and Slovakia), where the greatest economic and practical perspectives are located.
Based on the abovementioned statements, the specific objective of this study is to evaluate and discuss the impact of biochar applied in a field experiment in 2014 and reapplied in 2018, in combination with industrial N-fertilizers, on (1) N2O emissions from the soil, (2) soil physical properties (bulk density, saturated hydraulic conductivity, porosity, plant available water capacity, and (3) soil chemical properties (pH, NO3, NH4+, SOC), measured four years after the first biochar application. We test the hypothesis whether (H1) a single biochar addition application may provide benefits to soil chemical and physical properties and reduce N2O emissions four years after biochar application, or whether (H2) repeated biochar applications are needed to provide the abovementioned benefits.

2. Materials and Methods

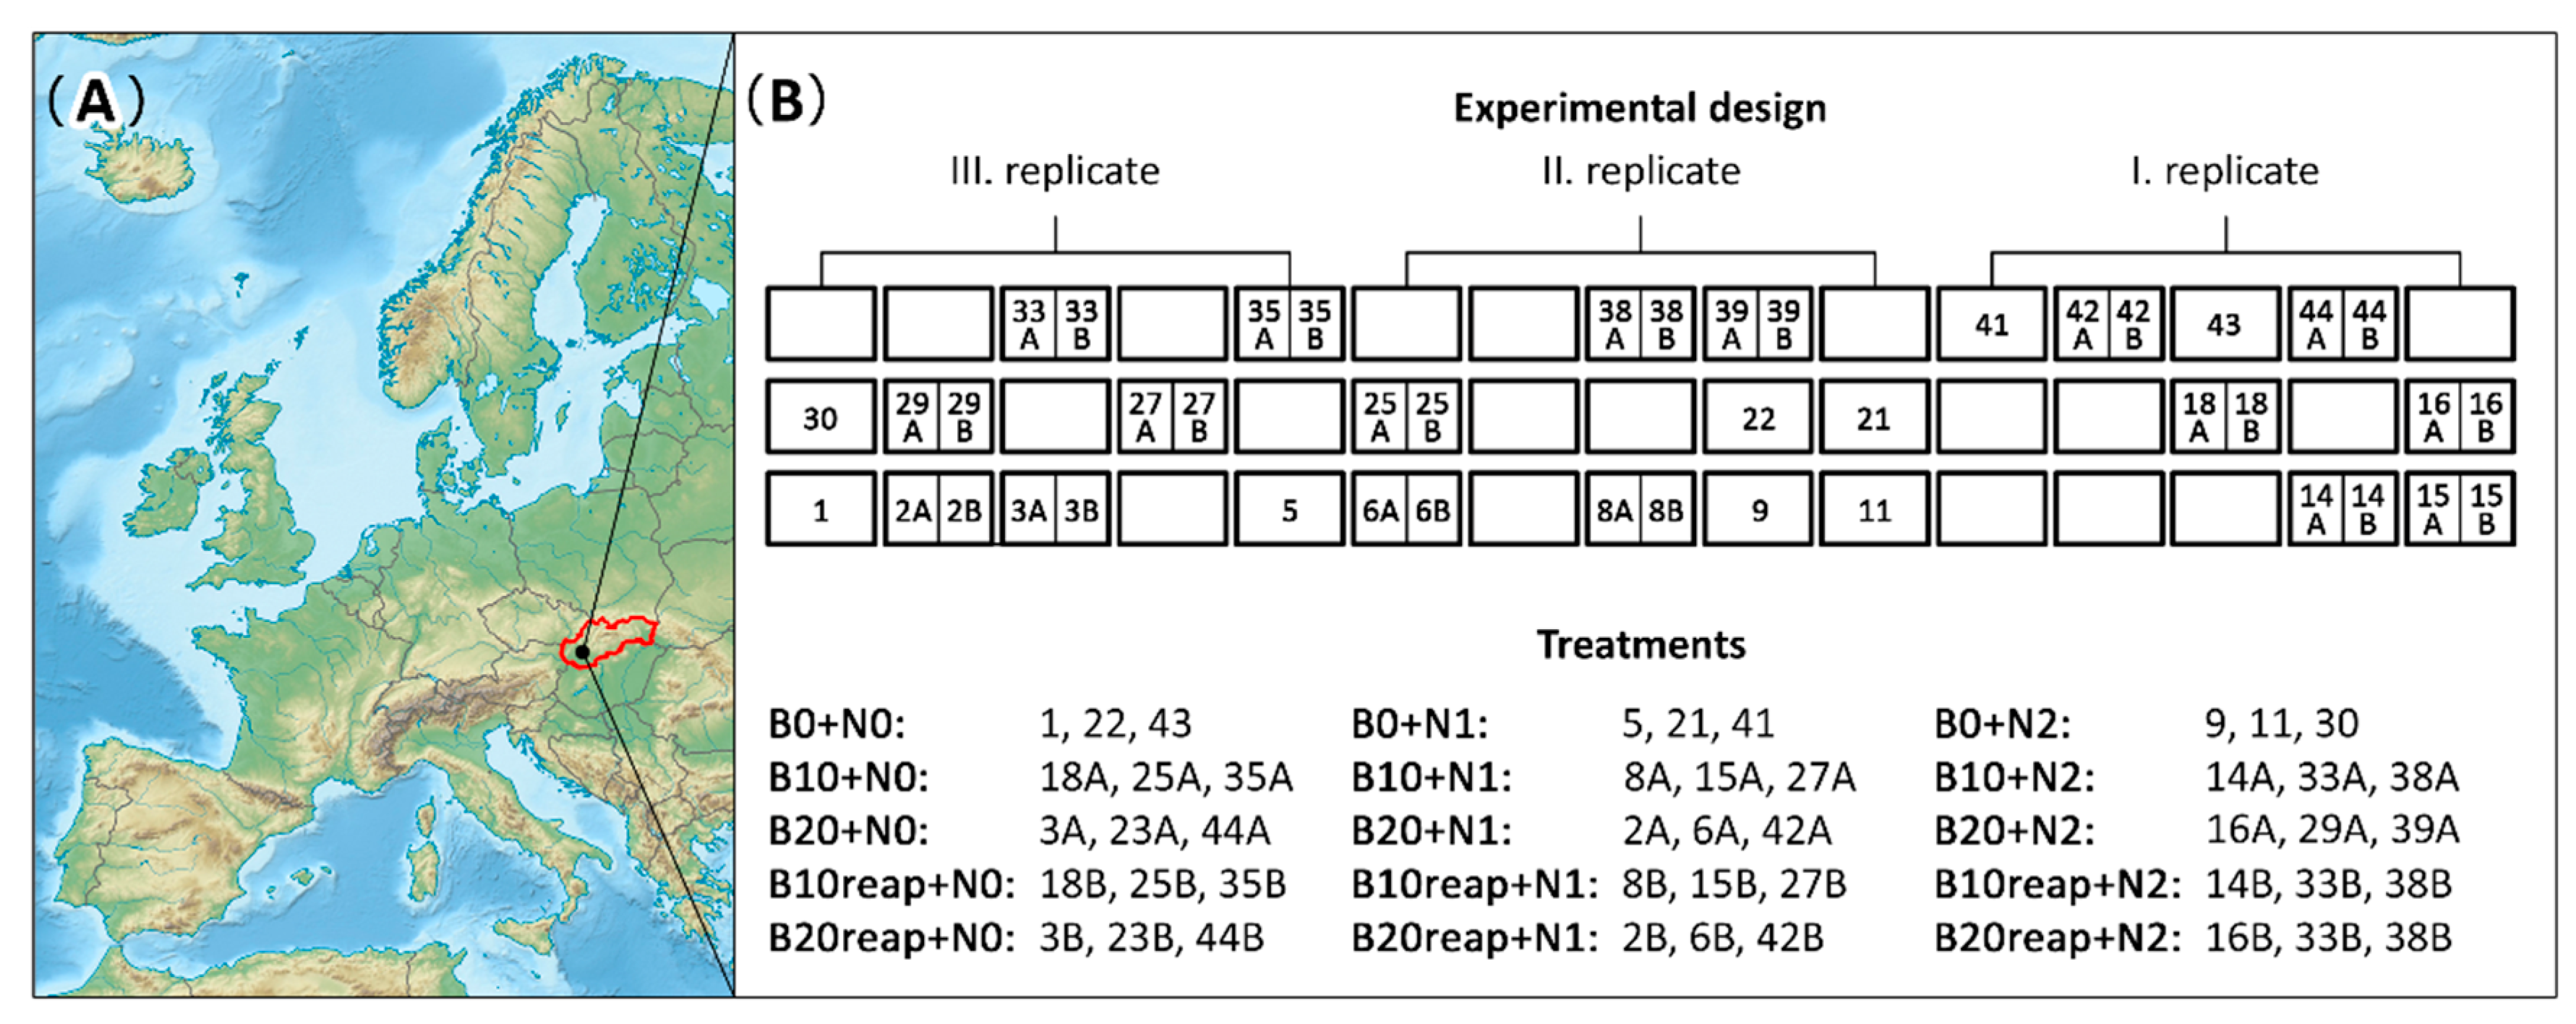
2.1. Experimental Site

The field experiment was established at the experimental site of the Slovak University of Agriculture (Malanta) in the Nitra region of Slovakia (48°19′ N; 18°09′ W). The site is in the temperate climate zone, with a mean annual air temperature of 9.8 °C and mean annual rainfall of 539 mm (30–year climatic normal, 1961–1990). Mean air temperature and rainfall in 2018 were 9.0 °C and 528 mm, respectively (Table 1). The soil was classified according to the World Reference Base for Soil Resources [51], based on whole-profile soil morphology, as a Haplic Luvisol with silty loam texture (containing sand 15.2%, silt 59.9%, and clay 24.9%). Before the experiment was set up in 2014, the soil contained 9.13 g kg1 of SOC on average, while average soil pH(KCl) was 5.71 (moderately acidic soil).

2.2. Experimental Design

The field had been under conventional crop management for several years prior to the beginning of the experiment. This study was carried out from April to November 2018 on the biochar field experiment, which was established in 2014. The crop rotation from the beginning of the experiment (2014) was as follows: spring barley (Hordeum vulgare L.) in 2014, maize (Zea mays L.) in 2015, spring wheat (Triticum aestivum L.) in 2016, maize in 2017, and spring barley in 2018 (year of study). In 2014, the biochar field experiment included 9 treatments (in 3 replicates), with biochar application at a rate of 0, 10, and 20 t ha1 (B0, B10, B20, respectively) combined with different N-fertilizer application rates depending on the grown crop’s requirements (N0, N1, N2 levels), applied from the beginning of the experiment as the main treatments (Table 2). A standard N-fertilizer (calcium ammonium nitrate with dolomite, LAD 27) was applied on 7 May 2018 after the beginning of the elongation of spring barley. The N0 fertilization level had no N-fertilizer application. The dosage at the N1 fertilization level was calculated according to spring barley requirements using the balance method, and the N2 fertilization level included 100% more fertilizer than the N1 level. The experimental field was not fertilized with any manure or organic fertilizer from 2014. The 27 plots (4 × 6 m) were arranged in a random design separated by 0.5-m-wide protective strips and, in the intermediate rows, by 1.2-m-wide access pathways (Figure 1). Then, in 2018, the original plots with former biochar application were divided into two parts (two subplots with dimensions 4 × 3 m), and the biochar was reapplied at the same rates as in 2014 (Table 2, treatments with “reap” in their acronym). Therefore, the studied period in 2018 included 15 treatments with 3 replicates (27 former plots + 18 reapplication subplots; in total, 45 plots). The entire experimental field was plowed to a depth of 0.15 m prior to the experiment in 2014 and also in 2018. A random treatment allocation followed; then, finally, biochar was applied to the soil surface and immediately incorporated into the 0–0.1 m soil layer using a combinator. Spring barley was planted on 9 April 2018 at a commercial seed density of 200 kg ha−1.
The biochar used in this study was produced from paper fiber sludge and grain husk (in a 1:1 w/w) and pyrolyzed at 550 °C for 30 min in a Pyreg reactor (Pyreg GmbH, Dörth, Germany). The physical and chemical properties of applied biochar are shown in Table 3.

2.3. Nitrous Oxide Measurements

A closed chamber method was used for measurements of N2O emissions, biweekly between 9 a.m. and 12 a.m., from the soil in all treatments to decrease the variability in N2O fluxes due to diurnal changes in temperature from April to November 2018. One metal collar frame per plot was incorporated in the soil surface to a depth of 0.1 m. The metal collar frames were removed only during tillage, fertilization, and harvesting operations and were reinserted immediately after these operations were finished. PVC chambers (0.3 m in diameter and 0.25 m in height) were fixed on a water-filled rim of the metal collar frame. The surface area of the covered soil was 615 cm2. Gas samples (20 mL) were collected from the PVC chambers through tube fittings (sealed with a rubber septum) at regular intervals of 0, 30, and 60 min using an airtight glass syringe (Hamilton) and transferred to pre-evacuated 12 mL glass vials (Labco Exetainer, Lampeter, UK). Gas samples for N2O were analyzed using a gas chromatograph (GC-2010 Plus Shimadzu, Kyoto, Japan) equipped with an electron capture detector (ECD). Average daily N2O emissions were reported in g ha−1 day−1. Cumulative N2O fluxes (April–November 2018) were calculated by interpolating the emissions between each sampling day and were reported in t ha−1.

2.4. Soil Sampling and Analysis

At each soil gas sampling session (biweekly between April and November 2018), sampling was conducted from the soil depth of 0–0.1 m to determine soil water content (SWC; determined gravimetrically). Soil temperature was measured by a thermometer (Volcraft DET3R) in the soil at 0.05 m depth. The disturbed soil samples, to determine soil pH, ammonium (NH4), and nitrate (NO3) nitrogen, were taken in monthly intervals (April–November 2018), and the sampling for soil organic content (SOC) was carried out in April and September. The soil was sampled from a depth of 0–0.1 m, and three randomly distributed soil subsamples per plot were collected and mixed into an average sample. Standard soil analyses were conducted to determine selected soil properties. The content of inorganic forms of N (NH4+ and NO3) was determined in a solution of 1% K2SO4, as described by Yuen and Pollard [52]. The content of NH4+ and NO3 in isolates was determined using the calorimetric method with a spectrometer (WTW SPECTROFLEX 6100, Weilheim, Germany). Soil organic carbon content (SOC) was estimated according to the Tyurin wet oxidation method [53] by oxidizing organic matter using a mixture of 0.07 mol dm−3 of H2SO4 and K2Cr2O7 with titration, using 0.01 mol dm−3 of Mohr’s salt. Soil pH was measured potentiometrically in 1 M KCl (1:2.5 soil:distilled water) using a pH meter (HI 2211, HANNA Instruments). The soil was not tested for microbial activity in our study.
To determine bulk density (BD), saturated hydraulic conductivity (K), and basic soil water constants, one sampling session was conducted in autumn 2018. Three undisturbed soil samples were taken from each plot (3 replicates of 15 experimental treatments = a total of 135 undisturbed soil samples) from a depth of 0.02–0.07 m using stainless steel cylinders with a volume of 100 cm3. Although nine representative undisturbed soil samples per treatment were collected, due to the high variability of the soil properties within the treatment, one soil sample with the most extreme values was excluded from further statistical analyses (n = 8). A pressure-plate apparatus was used for measurements of basic soil water constants—porosity (P) at 0 kPa, field capacity (FC) at −20 kPa (2.3 pF), and permanent wilting point (PWP) at −1500 kPa (4.18 pF) [54]. The available water content (AWC) corresponds to the moisture interval between FC and the PWP [55]. Saturated hydraulic conductivity was estimated using the laboratory falling head method while taking into account the flow rate per unit cross-sectional area and the unit hydraulic head gradient [56,57].

2.5. Statistical Analysis

The statistical analyses were performed using the Statgraphics Centurion XV.I program (Statpoint Technologies, Inc., Washington, DC, USA). One-way analysis of variance (ANOVA) and the least significant difference (LSD) method were used to compare treatment means for the two levels of biochar application and the three levels of nitrogen application at p ≤ 0.05. To study the relationships between average daily N2O emissions and NH4+, NO3 content, and soil pH, single linear regression analysis was applied.

3. Results and Discussion

3.1. Soil Chemical Properties

Soil pH(KCl) related to biochar and N-fertilizer amendments applied individually or in combination ranged from 4.75 to 6.14 (Table 4). Except for the B10+N0 treatment, pH(KCl) increased significantly (p ≤ 0.05) in treatments amended with biochar alone and in combination with N fertilization when compared to controls (B0+N0, B0+N1, and B0+N2). Higher initial and reapplied rates of biochar, together with a higher rate of N-fertilizer (except B20reap+N1), also significantly increased soil pH(KCl) (p ≤ 0.05) when compared to individual controls. These observations of biochar-induced changes in soil pH due to the addition of amendments are in line with expectations [58]. In our study, the unamended soil pH(KCl) was 5.7, and the biochar-amended soil pH(KCl) was 8.8. This increase could provide a more optimal soil environment for barley plants [59], with similar agronomic benefits arising from lime amendment of acid soils [30,60,61,62]. Considering this, biochar may be a valuable tool in the management of agroecosystems and a plausible way to ameliorate acidic soils in particular, as suggested in a previous study by Horák [63].
There was a general trend of decreasing concentration of NH4+ in the soil with increasing biochar application combined with N-fertilizer at both fertilized levels N1 and N2 (Table 4). However, a significant decrease (p ≤ 0.05) was found only in biochar treatments B10+N1, B10reap+N1, B20+N2, and B20reap+N2 when compared to their controls (B0+N1 and B0+N2). While a dose of 10 t ha−1 of biochar was more efficient at the first level of N-fertilization, the opposite trend was observed at the second level of N-fertilization. Biochar application without N-fertilizer increased the concentration of NH4+ compared to control B0+N0. These results are consistent with the studies by Le Leuch and Bandosz [64] and Taghizadeh-Toosi et al. [65], where a reduction in NH4+ concentrations was observed. The study of Jones et al. [61] reported that the sorption capacity of biochar leads to NH4+ absorption and, thus, a reduction of the accessibility of NH4+ for autotrophic conversion to NO3. Lehmann et al. [66] also reported that biochar reduced the leaching of NH4+ by keeping it trapped in the surface soil layer where it is available for plant uptake.
In general, mean NO3 concentrations increased proportionally with levels of N–fertilization (Table 4); however, these results were not significant (p ≤ 0.05). Our observation agrees with the study of Jones et al. [61], who found insignificant sorption of NO3 by biochar produced from wood biomass. The biochar treatments (the initial set-up from 2014 and also the newly established set-up in 2018), combined with or without N-fertilizer, showed that the content of NO3 in the soil decreased in most biochar treatments, compared to their controls (B0+N0, B0+N1, and B0+N2). Our results are in line with several studies that showed lower NO3 concentrations after biochar application [67,68]. Lower NO3 availability can be attributed to microbial immobilization after biochar addition, as reported in the works by Ippolito et al. [67] and Singh et al. [69]. Therefore, the application of N-fertilizer is very important to offset the effect of biochar in reducing the bioavailability of NO3 to both microbes and plants.
Initial and repeated applications of biochar, alone and in combination with N-fertilization, had positive effects on soil organic carbon (SOC) compared to the control treatments (Table 4). The treatments that included reapplied biochar in combination with both N-fertilization levels (N1 and N2) doubled (p ≤ 0.05) the SOC compared to their controls (B0+N1 and B0+N2). The treatments with initial biochar (applied in 2014), alone or combined with N-fertilizer (B10+N0, B20+N0, B10+N1, B20+N1, B10+N2, and B20+N2), increased the SOC by 22%, 40%, 4%, 10%, 50%, and 31%, respectively, in comparison to their relevant controls (B0+N0, B0+N1, and B0+N2). This increase can be explained by two factors: firstly, the difference between applied and reapplied biochar, and, secondly, due to the added nitrogen to the soil. Biochar is a stable form of carbon with resistance to microbial degradation [70], resulting in a SOC increase. On the other hand, we assumed that the added nitrogen could activate microbial activity and the production of labile carbon. Labile carbon can be inhibited by sorption on the biochar surface and, subsequently, will induce the formation of relatively stable organic matter [61], which can increase SOC.

3.2. Physical Properties of Soil

Table 5 shows the effect of the initial application and the reapplication of biochar on bulk density (BD), soil water content (SWC), saturated hydraulic conductivity (K), available water content (AWC), and the basic soil water limits of field capacity (FC) and permanent wilting point (PWP). We did not find a significant decrease in BD after biochar application, which is contrary to other published studies [16,17,29,30,71]. For example, Mukherjee and Lal [22] reported that the addition of 2% of biochar was enough to show a significant decrease in BD in the amended soils. In our study, second level N-fertilization (B0+N2), with a higher rate of biochar application (20 t ha−1), and both rates of its reapplication (B10reap+N2 and B20reap+N2) had a significant effect on the reduction of BD. Values of BD decreased in B20N2, B10reap+N2, and B20reap+N2 by 9%, 11%, and 12%, respectively, compared to B0N2. The explanation may be as follows: N-fertilization can act as an accelerator of SOM mineralization while improving soil aggregability and the formation of favorable structures [72]. The biochar particles applied to the soil can mix with soil particles in the digestive tract of earthworms, creating coprolites. These products contribute to making soil aggregates agronomically more valuable [73], with consequently lower BD. BD can be reduced by improving soil structure. An improvement of the structural condition of the soil on this experimental site has been proven just recently [74].
Biochar application and reapplication, alone or in combination with N-fertilizer, overall increased the average soil water content (SWC) in the range of 2–27% compared to their controls (B0+N0, B0+N1, and B0+N2). In treatments B10+N0, B10reap+N0, and B10+N2, SWC decreased; however, it was not significant (p ≤ 0.05). A significant increase (p ≤ 0.05) of SWC was found only in the case of biochar reapplication at the higher rate of 20 t ha−1 (B20reap+N1 by 27% and B20reap+N2 by 16%) when compared to their control treatments (B0+N1 and B0+N2). It was also found that generally, SWC increased with the increasing application rates of biochar (including reapplied treatments) at both fertilization levels (N1 and N2). Our findings on SWC are in line with recent studies by Barrrow [75], Agegnehu et al. [76], Leelamanie [77], Liyanage and Leelamanie [78], and Šrank and Šimanský [79]. The positive effect of added biochar can partially be because of biochar’s high sorption capacity and swelling ability, which result in an increase in the total porosity of the soils. SOM can retain large amounts of water, in some cases, up to 20 times their own weight, and, in the case of biochar, 11 times its own weight [80]. This is primarily due to the solid structure of biochar, which means that its swelling capacity is much lower than SOM. An improvement of soil moisture after biochar application is partly and indirectly due to, e.g., an improvement of soil structure, as reported by Toková et al. [81], but also direct effects such as biochar’s capacity to retain water. Biochar, with its large surface area and a large number of micropores, alters the average surface area of the soil, pore size distribution, and, thus, the water retention capacity of the soil [82]. The incorporation of biochar may enhance the specific surface area up to 4.8 times compared to unamended soils [83] and may also increase the presence of capillary pores [79].
According to the results observed in our study on silty loam soil, K values, in general, increased (Table 5). However, significant effects (p ≤ 0.05) were found only in B20reap+N0 and B10+N2 treatments. An increase in K values can be explained by the fact that the particle size of the applied biochar was larger than the particle size of the soil at our experimental site. Are [84] reported that the resulting effects of biochar application on hydraulic conductivity (K) are dependent on soil texture. In a study by Barnes et al. [85], K significantly increased in clay soil, decreased in sandy soil, and had no significant effect for sandy loam rich in organic matter following the incorporation of biochar. The hydraulic conductivity of the soils can be influenced by the size of biochar and soil particles [86], which may increase after the application of biochar with larger particles than the soil particles [87]. In this study, significant changes (p ≤ 0.05) in K values were not linked to porosity (Table 5). Our results showed that porosity significantly (p ≤ 0.05) increased only in the treatment with biochar reapplication at a dose of 20 t ha−1 at the second level of N-fertilization (B20reap+N2) when compared to the control treatment without biochar application (B0+N2) and to the unamended control B0+N0. The high porosity of biochar [88,89] can be responsible for an increase in soil porosity. However, overall, porosity values were not influenced by initial or repeated biochar applications. One of the reasons may also be swelling and grain separation, leading to the clogging of pores, a decrease in pore radii, and, possibly, a variation in the BD [85].
The quantification of the amount of water held at field capacity (FC) and at permanent wilting point (PWP) while measuring the amount of available water capacity (AWC) in the soil with biochar amendment is an efficient way to evaluate the effect of biochar on soil water conditions and plant growth. The observed values of FC, PWP, and AWC are also shown in Table 5. Our findings showed a significant increase (p ≤ 0.05) in FC values in several treatments at the first fertilization level N1 (B10+N1, B10reap+N1), at the second fertilization level N2 (B20+N2 and B20reap+N2), and without N–fertilization (B20reap+N0). Additionally, a slight increase in PWP values was observed; however, a significant difference (p ≤ 0.05) was observed only for treatment B10reap+N1. Our findings showed that biochar application had a positive impact on the AWC values. An increase of AWC in the range from 1% to 15% (8.49–9.88% vol.) was observed in most of the treatments with biochar reapplication, alone and in combination with both levels of N-fertilization (B10reap+N0, B20reap+N0, B10+N1, B10reap+N1, B20reap+N2, B10reap+N2, and B20reap+N2). However, a significant increase (p ≤ 0.05) was only observed in nonfertilized treatment with reapplied biochar at a dose of 20 t ha1 (B20reap+N0). An increase in AWC values, caused by the increase in FC values, suggests that the content of wider capillary pores in the soil has increased. This means that the soil can retain more water; however, it is by a force that does not limit the availability of water to plants and their root system. This phenomenon can also be attributed to the change in the quality of soil humus and soil structure, influenced by the application of biochar [90].

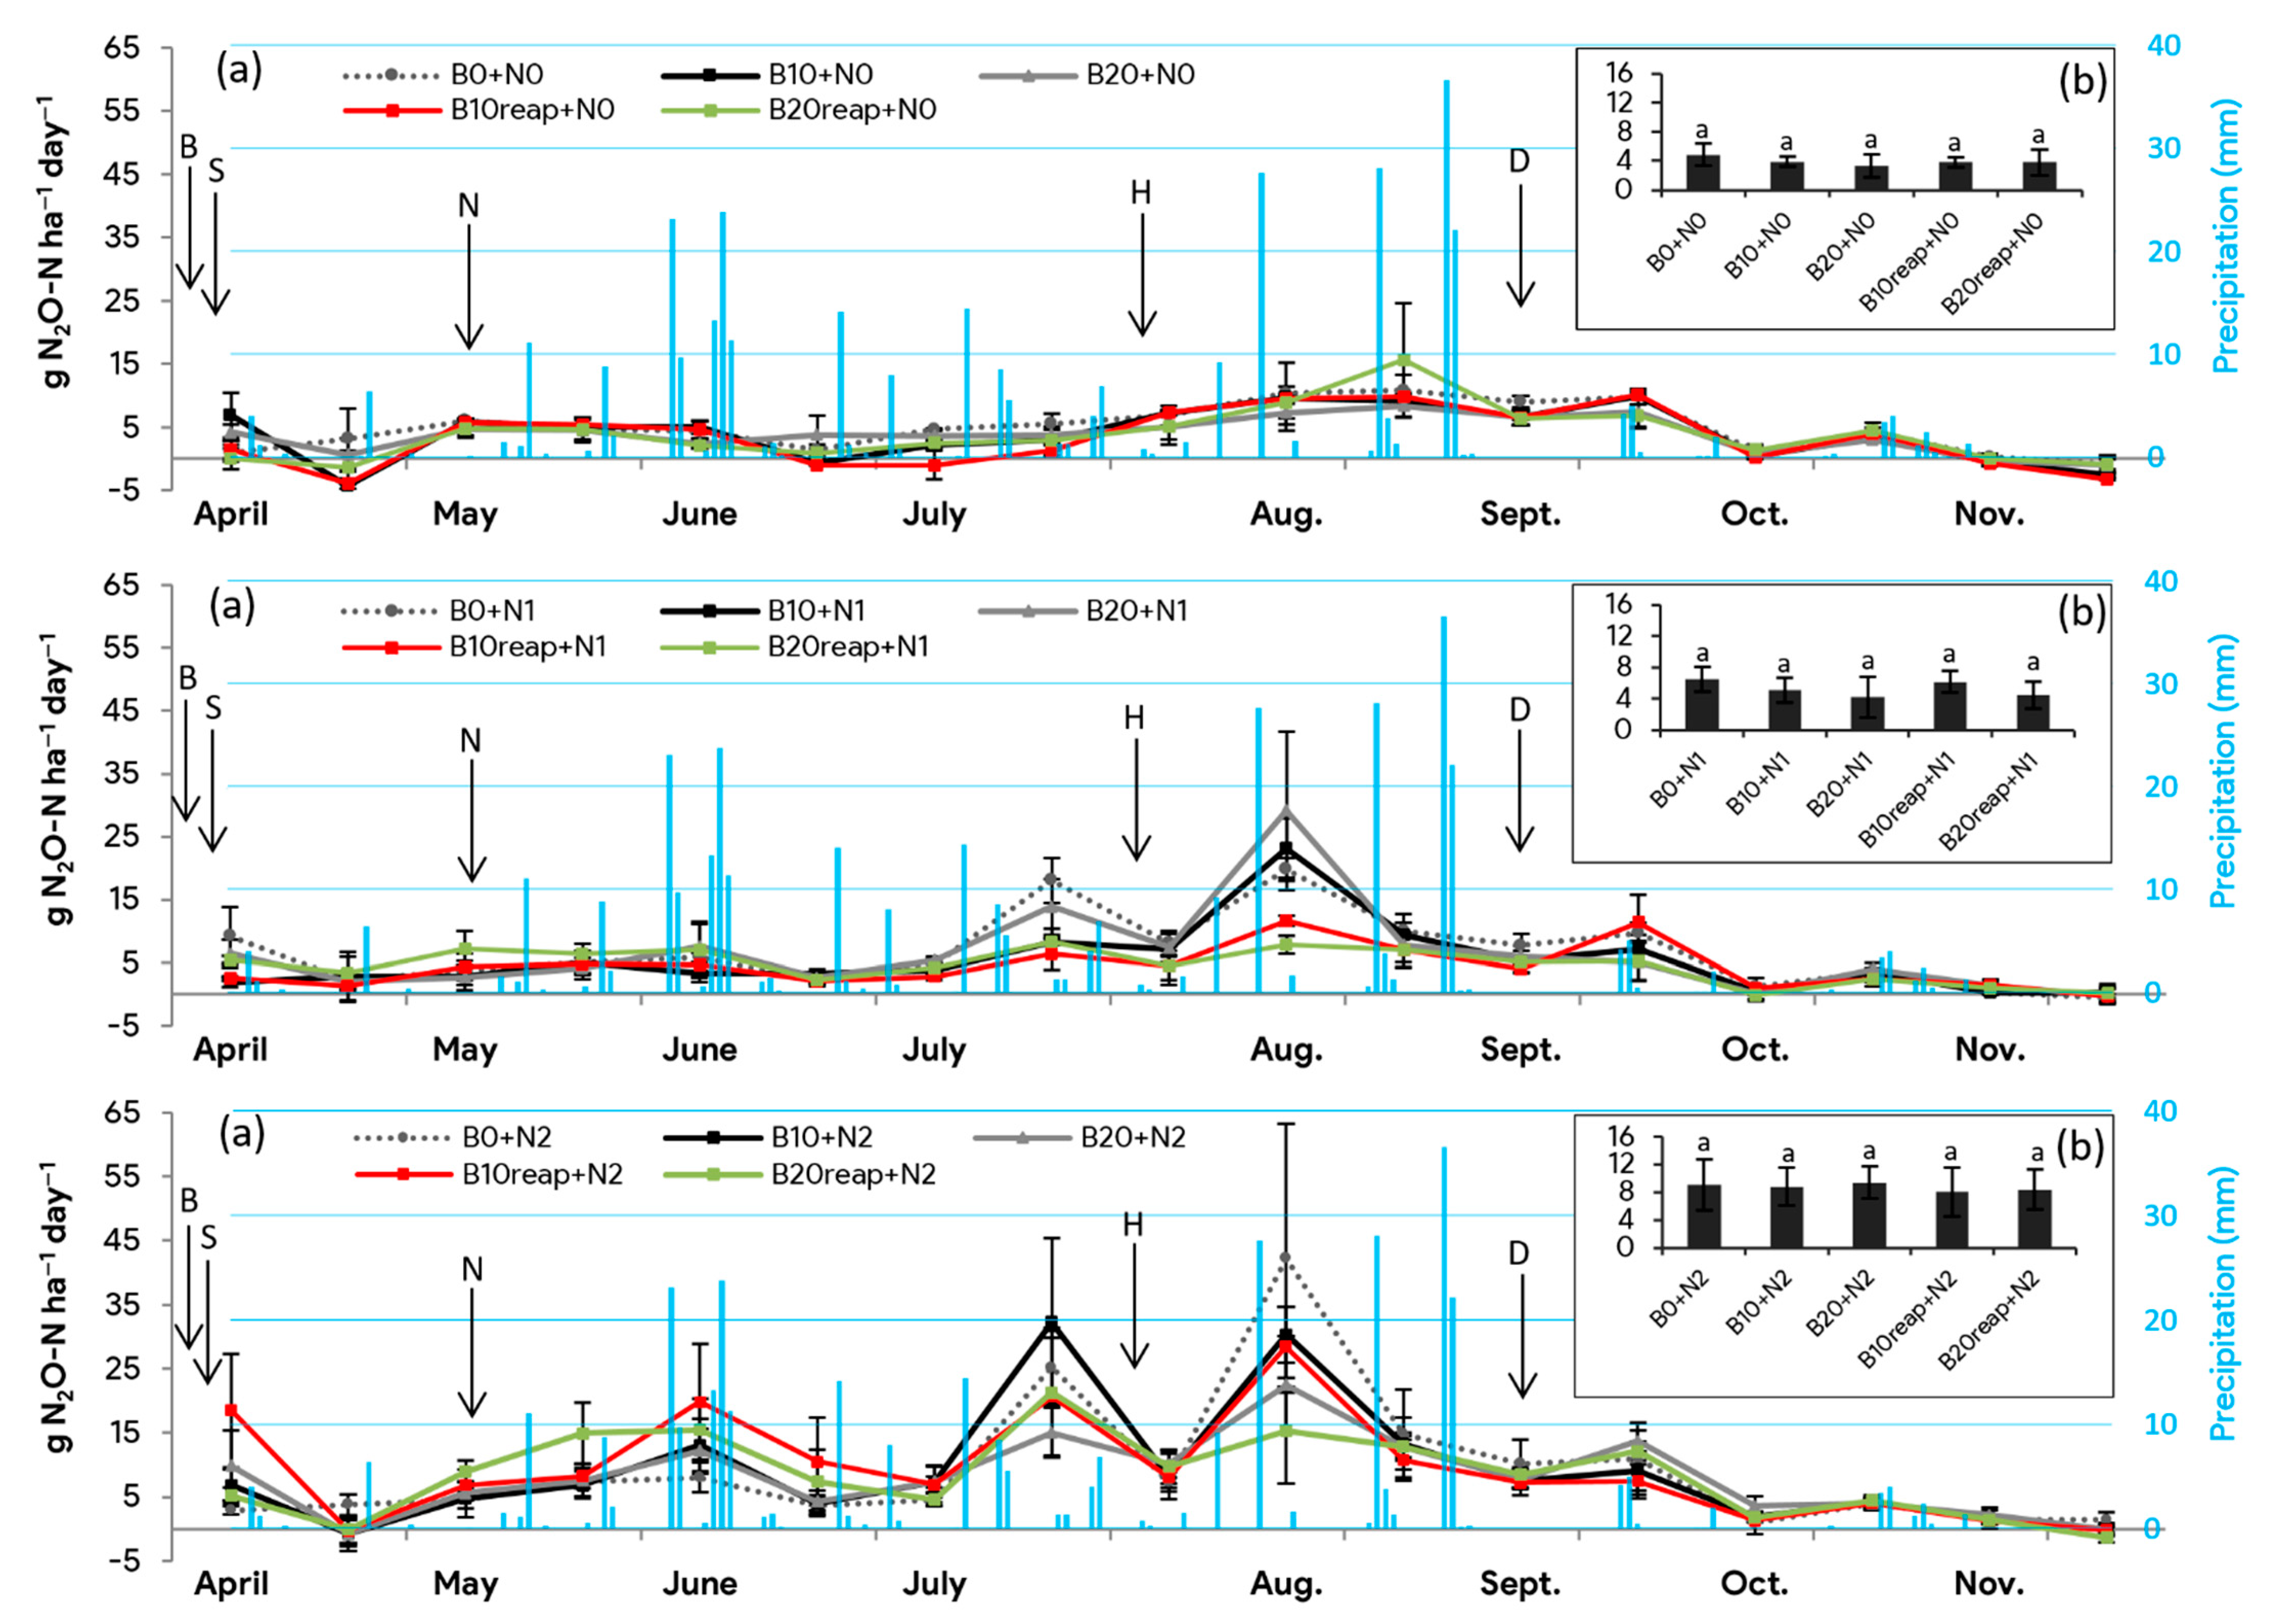
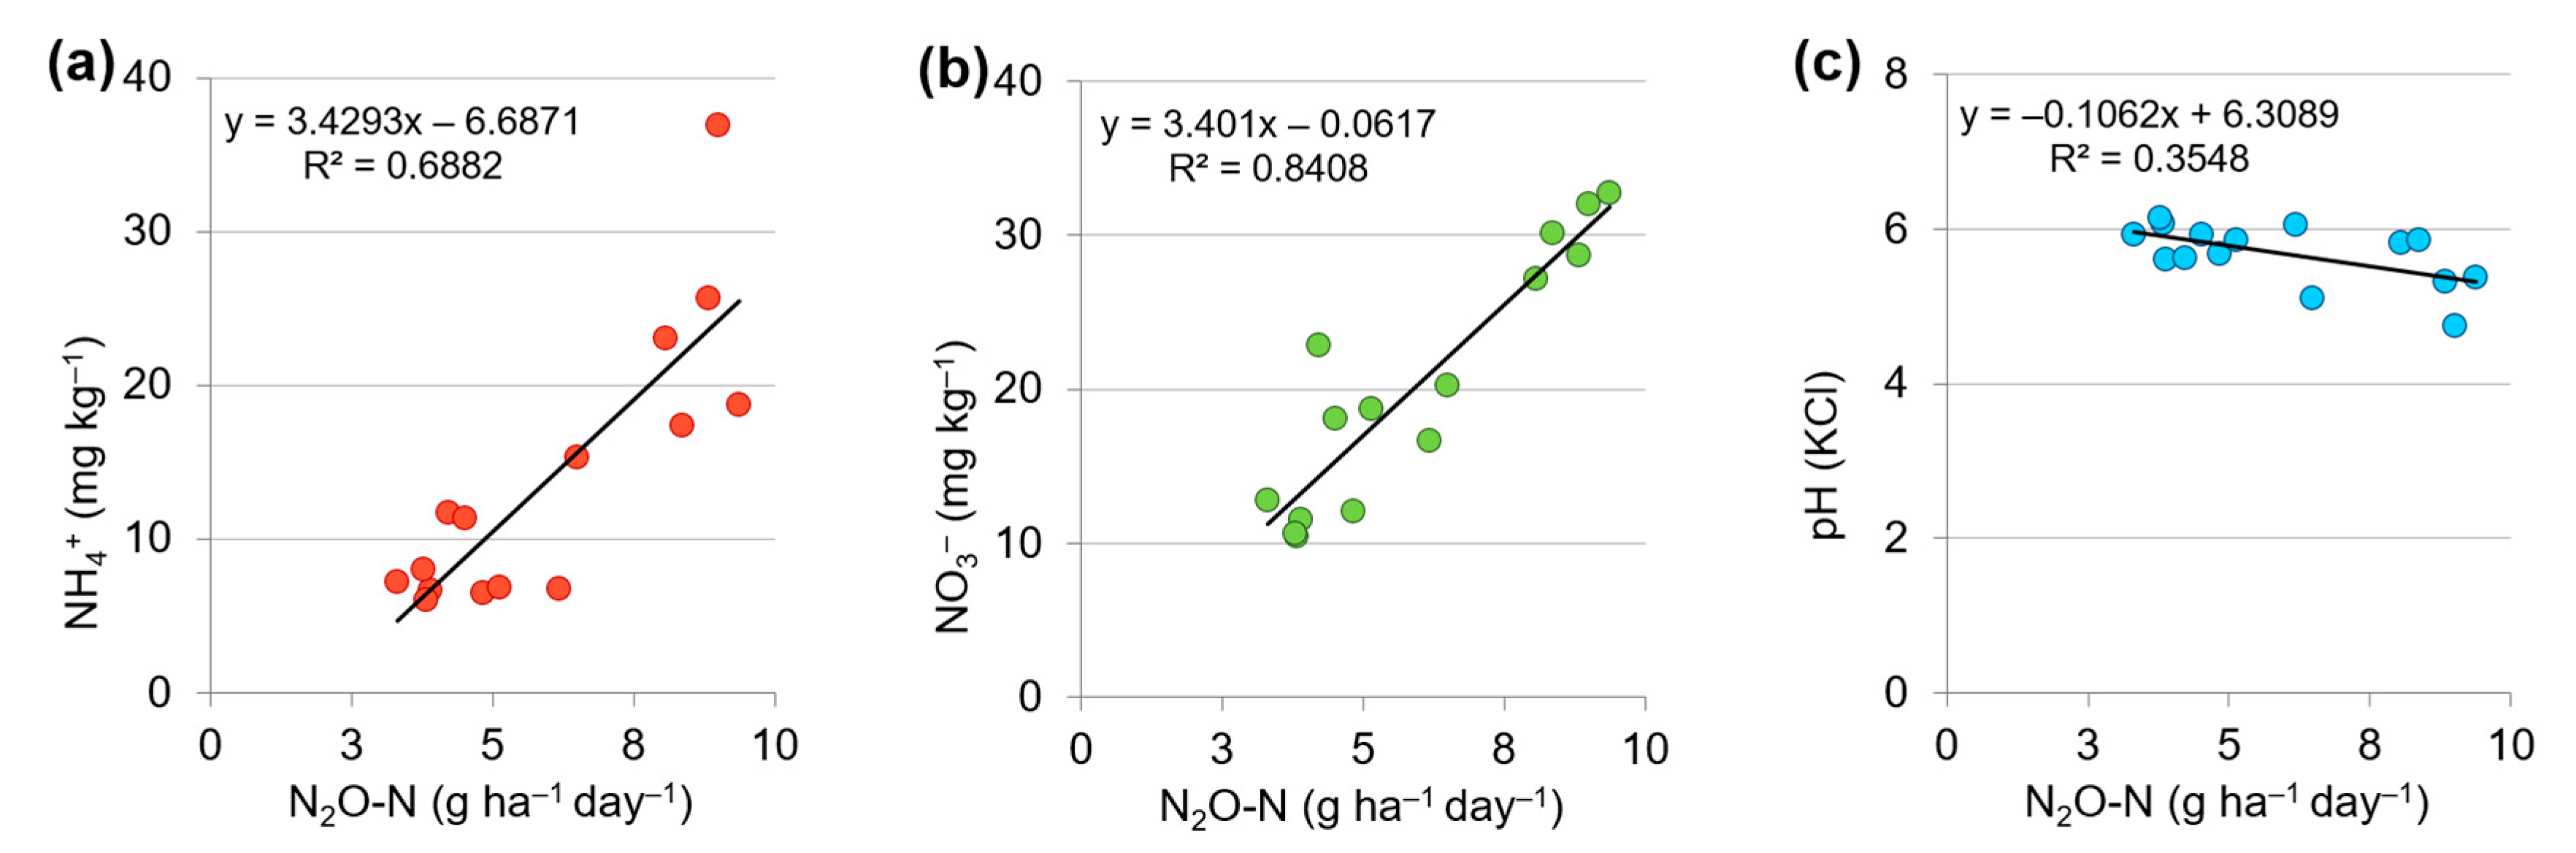
3.3. Nitrous Oxide Emissions

The results, shown in Figure 2, clearly show a local maximum in daily N2O emissions in early spring and the late summer–early autumn period and a minimum in daily N2O emissions in late autumn in treatments without N-fertilization. In treatments with biochar combined with N-fertilization, emission peaks of N2O were identified in early spring and summer, mainly due to precipitation.
There was a clear increase of daily N2O emissions after N-fertilizer application on 7 May 2018, and they rose steadily up to mid-June and then started to decrease with a decrease of soil water content until the beginning of July (data not shown). A rain event of 14 mm, recorded on 10 and 11 July 2018, caused an increase in SWC measured on 12 July to the range of 17.4–28.6% vol. when compared to SWC measured a week before on 4 July (7.9–14.4% vol.). The mentioned precipitation event subsequently led to an increase in daily N2O emissions on 12 July 2018. The same trend was observed in August when the SWC measured on 31 July, ranging from 6.4–9.7% vol., increased up to 17.2–21.5% vol. when measured on 13 August after a rain event of 28 mm on 10 August 2018. Although all treatments showed a similar temporal N2O pattern, the heights of the peaks differed for different treatments. Almost all emission peaks observed in the biochar treatments (initial application and reapplication) were lower than in treatments without biochar application. These findings are also confirmed by the average daily N2O emissions over the whole studied period as the treatments with biochar at all N-fertilization levels (N0, N1, N2) were lower in comparison to treatments without biochar application (Figure 2b). However, differences among treatments were insignificant. Spatial variability within and among the plots could be a factor contributing to the inconclusive results, as reported in the study of Fangueiro et al. [91].
The lower emissions peaks from the plots with biochar amendment resulted in an increasing difference in cumulative fluxes between biochar-amended plots and control plots over the duration of the study (Figure 3). The results for the unfertilized treatments showed that all biochar treatments (B10+N0, B20+N0, B10reap+N0, and B20reap+N0) decreased (p ≤ 0.05) the cumulative N2O emissions by 21%, 23%, 28%, and 20%, respectively, compared to control (B0+N0). The cumulative fluxes from treatments at the N1 fertilization level were lower by 18% (p ≤ 0.05), 3%, 34% (p ≤ 0.05), and 31% (p ≤ 0.05) from treatments B10+N1, B20+N1, B10reap+N1, and B20reap+N1, respectively, compared to the control treatment (B0+N1). The same trend was found for treatments fertilized at the N2 fertilization level, where, again, all biochar-amended treatments (B10+N2, B20+N2, B10reap+N2, and B20reap+N2) decreased cumulative N2O emissions by 4%, 13% (p ≤ 0.05), 1%, and 8% compared to control (B0+N2). These results are in line with other field and laboratory studies that show that biochar can reduce soil-cumulative N2O [92,93,94].
The mechanisms explaining the observed reduction of N2O emissions following biochar application are still uncertain. Biochar-induced changes in N availability and enhanced plant uptake may reduce N2O emission for soils [95]. The results of our study showed both a decreasing trend in NH4+ content and a neutral effect on NO3 after biochar addition to the soil (Table 4). No significant effect on average daily N2O emissions (Figure 2) was observed, which, overall, does not completely suggest that NO3 and NH4+ availability reduction by biochar is one of the mechanisms responsible for decreasing N2O emissions. Moreover, this confirms the significant and positive linear relationship between NH4+ and N2O (Figure 4a) and between NO3 and N2O (Figure 4b). We observed higher average soil pH(KCl) in the biochar-amended treatments. These results are in agreement with the findings of other studies by Atkinson et al. [60] and Singh et al. [69]. Since soil pH exerts control over the N2O:N2 ratio during denitrification [96], higher pH, seen in biochar treatments, might also contribute to a reduction of N2O emissions, which was confirmed by the negative significant linear relationship between N2O and soil pH(KCl) (Figure 4c). This suggests that an increase in soil pH(KCl) due to the application of biochar, as well as its reapplication, was the main reason for N2O emission reduction rather than the reduction of NH4+ and NO3. Our results show that, especially in the case of NH4+, biochar amendment has the potential to decrease the negative effect of mineral fertilizers on N2O emission production. This is an important finding for farmers in the context of regulating nitrogen conversion processes in the soil. Although a reduction of fertilizer application is the most effective method to decrease soil N2O emissions, it comes with the cost of lower crop yields [29]. Traditional fertilization could be combined with biochar without a decrease in crop yields, according to results observed in the same field experiment [97].

4. Conclusions

The results of our study showed that biochar, applied in 2014 and reapplied in 2018, alone or in combination with N–fertilizers, has an effect on soil chemical and physical properties and N2O emissions according to measurements in 2018 (four years after the first application of biochar). Our results confirm that the incorporation of biochar to moderately acidic soil is an effective way to increase soil pH(KCl). Observed results also indicate that even a single biochar application may provide benefits over at least 4 years of cropping seasons. However, long-term field studies are still lacking, and more studies are needed in order to determine when a steady state is reached or if and when a decline starts to occur. Biochar showed the potential to increase the SOC in treatments after the initial application (from 4% up to 50%) as well as after reapplication. In combination with N–fertilizer, SOC even doubled. To some extent, biochar was also able to decrease mineral nitrogen (NH4+, NO3); however, this was significant (p ≤ 0.05) only in the case of NH4+ content at some fertilized treatments. There were also positive responses detected in all biochar treatments on soil physical properties, such as soil water content increase, available water content increase (from 1 to 15%), and saturated hydraulic conductivity increase (from 5% up to 95%; 0.42–2.64 cm h−1). In terms of N2O emissions from the soil, biochar (initial application as well as reapplication) showed the ability to decrease N2O emission peaks during seasonal peak events, which resulted in lower cumulative N2O emissions over the whole studied period, from 1–34%, compared to treatments without biochar. An increase in pH due to biochar application, as well as its reapplication, was suggested to be an important factor in relation to N2O emission reduction rather than a reduction of NH4+ and NO3 for the same reason.
According to our results, a single biochar application, as well as reapplication, to these soils, with or without N–fertilizer, appears to be a promising practice to improve the sustainability of intensive agriculture. The recommended input amount of biochar under conventional nitrogen application in this study is 20 t ha−1, with a second reapplication after four years of the same amount. Biochar inputs for more intensive fertilization, according to our results, are again 20 t ha−1 but without the need for reapplication. In the future, biochar research should consider dose rate, type, and frequency of biochar applications and also that soil type and climate effects will have an overriding effect on efficacy.

Author Contributions

Conceptualization, J.H., T.K., L.T. and V.Š.; methodology, J.H., D.I. and V.Š.; investigation, T.K., L.T. and V.Š.; resources, E.A. and V.Š.; data curation, J.H., E.A. and V.Š.; formal analysis, J.H., T.K., L.T. and V.Š.; writing—original draft preparation, J.H., T.K. and L.T.; writing—review and editing, E.A., D.I. and V.Š.; validation, J.H., E.A., V.Š. and D.I.; visualization, T.K., L.T. and E.A.; project administration, J.H., D.I. and V.Š.; funding acquisition, J.H., D.I. and E.A. All authors have read and agreed to the published version of the manuscript.

Funding

This study was supported by the Slovak Research and Development Agency under contract No. APVV–15–0160, the Cultural and Educational Grant Agency, KEGA (No. 019SPU–4/2020), and the Operational Program Integrated Infrastructure within the project “Sustainable smart farming systems, taking into account the future challenges 313011W112”, cofinanced by the European Regional Development Fund. Furthermore, this publication is the result of the project implementation of “Scientific support of climate change adaptation in agriculture and mitigation of soil degradation” (ITMS2014+ 313011W580), supported by the Integrated Infrastructure Operational Programme, funded by the ERDF.

Institutional Review Board Statement

Not applicable.

Informed Consent Statement

Not applicable.

Data Availability Statement

The datasets generated during and/or analyzed during the current study are available from the corresponding author on reasonable request.

Conflicts of Interest

The authors declare no conflict of interest. The funders had no role in the design of the study; in the collection, analyses, or interpretation of data; in the writing of the manuscript, or in the decision to publish the results.

References

  1. Foley, J.A.; Ramankutty, N.; Brauman, K.A.; Cassidy, E.S.; Gerber, J.S.; Johnston, M.; Mueller, N.D.; OConnell, C.; Ray, D.K.; West, P.C.; et al. Solutions for a cultivated planet. Nature 2011, 478, 337–342. [Google Scholar] [CrossRef] [Green Version]
  2. Godfray, H.C.J.; Beddington, J.R.; Crute, I.R.; Haddad, L.; Lawrence, D.; Muir, J.F.; Pretty, J.; Robinson, S.; Thomas, S.M.; Toulmin, C. Food security: The challenge of feeding 9 billion people. Science 2010, 327, 812–818. [Google Scholar] [CrossRef] [Green Version]
  3. Campbell, B.M.; Beare, D.J.; Bennett, E.M.; Hall-Spencer, J.M.; Ingram, J.S.I.; Jaramillo, F.; Ortiz, R.; Ramankutty, N.; Sayer, J.A.; Shindell, D. Agriculture production as a major driver of the Earth system exceeding planetary boundaries. Ecol. Soc. 2017, 22, 1–11. [Google Scholar] [CrossRef]
  4. Steffen, W.; Richardson, K.; Rockström, J.; Cornell, S.E.; Fetzer, I.; Bennett, E.M.; Briggs, R.; Carpenter, S.R.; Vries, W.; De Wit, C.A.; et al. Planetary boundaries: Guiding human development on a changing planet. Science 2015, 347, 1259855. [Google Scholar] [CrossRef] [PubMed] [Green Version]
  5. Tripathi, V.; Edrisi, S.A.; Chen, B.; Gupta, V.K.; Vilu, R.; Gathergood, N.; Abhilash, P.C. Biotechnological advances for restoring degraded land for sustainable development. Trend Biotechnol. 2017, 35, 847–859. [Google Scholar] [CrossRef] [PubMed]
  6. Sollins, P.; Homann, P.; Caldwell, B.A. Stabilization and destabilization of soil organic matter—Mechanisms and controls. Geoderma 1996, 74, 65–105. [Google Scholar] [CrossRef]
  7. European Commission. Healthy Soils—New EU Soil Strategy. Available online: https://ec.europa.eu/info/law/better-regulation/have-your-say/initiatives/12634-New-EU-Soil-Strategy-healthy-soil-for-a-healthy-life (accessed on 9 January 2021).
  8. Tsui, C.C.; Guo, H.Y.; Chen, Z.S. Estimation of soil carbon stock in Taiwan arable soils by using legacy database and digital soil mapping. In Soil Processes and Current Trends in Quality Assessment; Soriano, M.C.H., Ed.; IntechOpen: Rijeka, Croatia, 2013; pp. 311–335. [Google Scholar]
  9. Šimanský, V.; Bajčan, D.; Ducsay, L. The effect of organic matter on aggregation under different soil management practices in a vineyard in an extremely humid year. Catena 2013, 101, 108–113. [Google Scholar] [CrossRef]
  10. Wijitkosum, S.; Sriburi, T. Increasing the amount of biomass in field crops for carbon sequestration and plant biomass enhancement using biochar. In An Imperatice Amendment for Soil and the Environment; Abrol, V., Sharma, P., Eds.; IntechOpen: Rijeka, Croatia, 2019; pp. 35–54. [Google Scholar]
  11. Carlson, K.M.; Gerber, J.S.; Mueller, N.D.; Herrero, M.; MacDonald, G.K.; Brauman, K.A.; Havlik, P.; O’Connel, C.S.; Johnson, J.A.; Saatchi, S.; et al. Greenhouse gas emissions intensity of global croplands. Nat. Clim. Chang. 2017, 7, 63–68. [Google Scholar] [CrossRef]
  12. Myhre, G.D.; Shindell, F.M.; Bréon, W.; Collins, J.; Fuglestvedt, J.; Huang, D.; Koch, J.F.; Lamarque, D.; Lee, B.; Mendoza, T. Anthropogenic and natural radioactive forcing. In Climate Change 2013—The Physical Science Basis Working Group I Contribution to the Fifth Assessment Report of the Intergovernmental Panel on Climate Change; Stocker, T.F., Quin, D., Plattner, G.K., Tignor, M., Allen, S.K., Boschung, J., Nauels, A., Xia, Y., Bex, V., Midgley, P.M., Eds.; Cambridge University Press: Cambirdge, UK, 2013; pp. 659–740. [Google Scholar] [CrossRef]
  13. Food and Agricultural Organization. WRB Map of World Soil Resources. 2002. Available online: http://www.fao.org/ag/agl/agll/wrb/soilres.stm (accessed on 4 November 2020).
  14. Behnke, G.D.; Zuber, S.M.; Pittelkow, C.M.; Natziger, E.D.; Villamil, M.B. Long–term crop rotation and tillage effects on soil greenhouse gas emissions and crop production in Illinois, USA. Agric. Ecosyst. Environ. 2018, 261, 62–70. [Google Scholar] [CrossRef]
  15. Li, B.; Fan., C.H.; Zhang, H.; Chen, Z.Z.; Sun, L.Y.; Xiong, Z.Q. Combinated effects of nitrogen fertilization and biochar on the net global warming potential, greenhouse gas intensity and net ecosystem economic budget in intensive vegetable agriculture in southeastern China. Atmos. Environ. 2015, 100, 10–19. [Google Scholar] [CrossRef]
  16. Are, K.S.; Adelana, A.O.; Fademi, I.O.; Aina, O.A. Improving physical properties of degraded soil: Potential of poulry manure and biochar. Agric. Nat. Resour. 2017, 51, 454–462. [Google Scholar] [CrossRef]
  17. Githinji, L. Effect of biochar application rate on physical and hydraulic properties of a sandy loam. Arch. Agron. Soil Sci. 2014, 60, 457–470. [Google Scholar] [CrossRef]
  18. Duarte, S.J.; Glaser, B.; Cerri, C.E.P. Effect of biochar particle size on physical, hydrological and chemicalproperties of loamy and sandy tropical soils. Agronomy 2019, 9, 165. [Google Scholar] [CrossRef] [Green Version]
  19. Karhu, K.; Mattila, T.; Bergström, I.; Regina, K. Biochar addition to agricultural soil increased CH4 uptake and water holding capacity—Results from a short-term pilot field study. Agric. Ecosyst. Environ. 2011, 140, 309–313. [Google Scholar] [CrossRef]
  20. Dugan, E.; Verhoef, A.; Robinson, S.; Sohi, S.; Gilkes, R.; Prakpongkep, N. Bio-char from sawdust, maizestover and charcoal: Impact on water holding capacities (WHC) of three soils from Ghana. In Proceedings of the 19th World Congress of Soil Science, Brisbane, Australia, 1–6 August 2010; IUSS: Wien, Austria, 2010. [Google Scholar]
  21. Tian, D.; Qu, Z.-Y.; Gou, M.-M.; Li, B.; Lv, Y.-J. Experimental study of influence of biochar on different texture soil hydraulic characteristic parameters and moisture holding properties. Environ. Stud. 2015, 24, 1435–1442. [Google Scholar]
  22. Mukherjee, A.; Lal, R. Biochar impacts on soil physical properties and greenhouse gas emissions. Agronomy 2013, 3, 313–339. [Google Scholar] [CrossRef] [Green Version]
  23. Buchkina, N.P.; Balashov, E.V.; Šimanský, V.; Igaz, D.; Horák, J. Changes in biological and physical parameters of soils with different texture after biochar application. Selskokhozyaistvennaya Biol. (Agric. Biol.) 2017, 52, 471–477. [Google Scholar] [CrossRef] [Green Version]
  24. Castellini, M.; Giglio, L.; Niedda, M.; Palumbo, A.D.; Ventrella, D. Imoact of biochar addition on physical and hydraulic properties of clay soil. Soil Tillage Res. 2015, 154, 1–13. [Google Scholar] [CrossRef]
  25. Šimanský, V.; Jonczak, J.; Parzych, A.; Horák, J. Contents and bioaccumulation of nutrients from soil to corn organs after application of different biochar doses. Carpathian J. Earth Environ. Sci. 2018, 13, 315–324. [Google Scholar] [CrossRef]
  26. Chan, K.Y.; Zwieten, L.V.; Meszaros, I.; Downie, A.; Joseph, S. Agronomic values of greenwaste biochar as a soil amendment. Aust. J. Soil Res. 2007, 45, 629–634. [Google Scholar] [CrossRef]
  27. Šimanský, V.; Horák, J.; Igaz, D.; Balashov, E.; Jonczak, J. Biochar and biochar with N fertilizer as a potential tool for improving soil sorption of nutrients. J. Soils Sediments 2018, 18, 1432–1440. [Google Scholar] [CrossRef]
  28. Woolf, D.; Lehmann, J.; Lee, D.R. Optimal bioenergy power generation for climate change mitigation with or without carbon sequestration. Nat. Commun. 2016, 7, 1–11. [Google Scholar] [CrossRef] [PubMed] [Green Version]
  29. Laird, D.A.; Fleming, P.; Davis, D.D.; Horton, R.; Wang, B.; Karlen, D.L. Impact of biochar amendments on the quality of typical Midwestern agricultural soil. Geoderma 2010, 158, 443–449. [Google Scholar] [CrossRef] [Green Version]
  30. Zhang, A.; Bian, R.; Pan, G.; Cui, L.; Hussain, Q.; Li, L.; Zheng, J.; Zheng, J.; Zhang, X.; Han, X.; et al. Effects of biochar amendments on soil quality, crop yield and greenhouse gas emission in a Chinese rice paddy: A field study of 2 consecutive rice growing cycles. Field Crop. Res. 2012, 127, 153–160. [Google Scholar] [CrossRef]
  31. Kondrlová, E.; Horák, J.; Igaz, D.; Dobiášová, D. The possibility of using digital images in assessment of plant canopy development and weed spread. Acta Hortic. Reg. 2017, 20, 35–39. [Google Scholar] [CrossRef] [Green Version]
  32. Jeffery, S.; Abalos, D.; Prodana, M.; Bastos, A.C.; van Groenigen, J.W.; Hungate, B.A.; Verheijen, F. Biochar boosts tropical but not temperate crop yields. Environ. Res. Lett. 2017, 12, 053001. [Google Scholar] [CrossRef]
  33. Shenbagavalli, S.; Mahimairaja, S. Production and characterization of biochar from different biological wastes. Int. J. Plant Anim. Environ. Sci. 2012, 2, 197–201. [Google Scholar]
  34. Freibauer, A.; Rounsevell, M.D.A.; Smith, P.; Verhagen, J. Carbon sequestration in agricultural soils of Europe. Geoderma 2004, 122, 1–23. [Google Scholar] [CrossRef]
  35. Fungo, B.; Lehmann, J.; Kalbitz, K.; Thionģo, M.; Tenywa, M.; Okeyo, I.; Neufeldt, H. Ammonia and nitrous oxide emissions from a field Ultisol amended with tithonia green manure, urea, and biochar. Biol. Fertil. Soils. 2019, 55, 135–148. [Google Scholar] [CrossRef]
  36. Cayuela, M.L.; Van Zwieten, L.; Singh, B.P.; Jeffery, S.; Roig, A.; Sanchez-Monedero, M.A. Biochar’s role in mitigating soil nitrous oxide emissions: A review and meta-analysis. Agric. Ecosyst. Environ. 2014, 191, 5–16. [Google Scholar] [CrossRef]
  37. Brassard, P.; Godbout, S.; Raghavan, V. Soil biochar amendment as a climate change mitigation tool: Key parameters and mechanisms involved. J. Environ. Manag. 2016, 181, 484–497. [Google Scholar] [CrossRef]
  38. He, Y.H.; Zhou, X.H.; Jiang, L.L.; Li, M.; Du, Z.G.; Zhou, G.Y.; Shao, J.J.; Wang, X.H.; Xu, Z.H.; Bai, S.H.; et al. Effects of biochar application on soil greenhouse gas fluxes: A meta-analysis. Gcb Bioenergy 2017, 9, 743–755. [Google Scholar] [CrossRef]
  39. Horák, J.; Kondrlová, E.; Igaz, D.; Šimanský, V.; Felber, R.; Lukac, M.; Balashov, E.V.; Buchkina, N.P.; Rizhiya, E.Y.; Jankowski, M. Biochar and biochar with N-fertilizer affect soil N2O emission in Haplic Luvisol. Biologia 2017, 72, 995–1001. [Google Scholar] [CrossRef]
  40. Van Zwieten, L.; Singh, B.P.; Kimber, S.W.L.; Murphy, D.V.; Macdonald, L.M.; Rust, J.; Morris, S. An incubation study investigating the mechanisms that impact N2O flux from soil following biochar application. Agric. Ecosyst. Environ. 2014, 191, 53–62. [Google Scholar] [CrossRef]
  41. Lehmann, J.; Gaunt, J.; Rondon, M. Bio–char sequestration in terrestrial ecosystems—A review. Mitig. Adapt. Strateg. Glob. Chang. 2006, 11, 403–427. [Google Scholar] [CrossRef]
  42. Clough, T.J.; Condron, L.M. Biochar and the nitrogen cycle: Introduction. J. Environ. Qual. 2010, 39, 1218–1223. [Google Scholar] [CrossRef] [PubMed]
  43. Cornelissen, G.; Rutherford, D.W.; Arp, H.P.H.; Dörsch, P.; Kelly, C.N.; Rostad, C.E. Sorption of pure N2O to biochars and other organic and inorganic materials under anhydrous conditions. Environ. Sci. Technol. 2013, 47, 7704–7712. [Google Scholar] [CrossRef]
  44. Spokas, K.A.; Baker, J.M.; Reicosky, D.C. Ethylene: Potential key for biochar amendment impacts. Plant Soil 2010, 333, 443–452. [Google Scholar] [CrossRef]
  45. Thomazini, A.; Spokas, K.; Hall, K.; Ippolito, J.; Lentz, R.; Novak, J. GHG impacts of biochar: Predictability for the same biochar. Agric. Ecosyst. Environ. 2015, 207, 183–191. [Google Scholar] [CrossRef]
  46. Yanai, Y.; Toyota, K.; Okazaki, M. Effects of charcoal addition on N2O emissions from soil resulting from rewetting air-dried soil in short-term laboratory experiments. Soil Sci. Plant Nutr. 2007, 53, 181–188. [Google Scholar] [CrossRef]
  47. Spokas, K.A.; Koskinen, W.C.; Baker, J.M.; Reicosky, D.C. Impacts of woodchip biochar additions on greenhouse gas production and sorption/degradation of two herbicides in a Minnesota soil. Chemosphere 2009, 77, 574–581. [Google Scholar] [CrossRef]
  48. Rogovska, N.; Laird, D.; Cruse, R.; Fleming, P.; Parkin, T.; Meek, D. Impact of biochar on manure carbon stabilization and greenhouse gas emissions. Soil Sci. Soc. Am. J. 2010, 75, 871–879. [Google Scholar] [CrossRef] [Green Version]
  49. Case, S.D.C.; McNamara, N.P.; Reay, D.S.; Whitaker, J. The effect of biochar addition on N2O and CO2 emissions from a sandy loam soil-the role of soil aeration. Soil Biol. Biochem. 2012, 51, 125–134. [Google Scholar] [CrossRef]
  50. Suddick, E.C.; Six, J. An estimation of annual nitrous oxide emissions and soil quality following the amendment of high temperature walnut shell biochar and compost to a small scale vegetable crop rotation. Sci. Total Environ. 2013, 65, 298–307. [Google Scholar] [CrossRef]
  51. IUSS. World Reference Base for Soil Resources 2014. International Soil Classification System for Naming Soils and Creating Legends for Soil Maps; FAO: Rome, Italy, 2015. [Google Scholar]
  52. Yuen, S.H.; Pollard, A.G. Determination of nitrogen in agricultural materials by the nessler reagent. II. Micro-determinations in plant tissue and in soil extracts. J. Sci. Food Agric. 1954, 5, 364–369. [Google Scholar] [CrossRef]
  53. Dziadowiec, H.; Gonet, S. Przewodnik Metodyczny do Badań Materii Organicznej Gleb [Methodological Guidebook For The Organic Matter Researches]; Prace Komisji Naukowych Polskiego Towarzystwa Naukowego 120; PTG: Warszawa, Poland, 1999; pp. 31–34. (In Polish) [Google Scholar]
  54. Soil Survey Division Staff. Laboratory Methods Manual; Soil Survey Investigations Report No. 42; USDA-NRCS: Washington, DC, USA, 1996; 716p.
  55. Igaz, D.; Šimanský, V.; Horák, J.; Kondrlová, E.; Domanová, J.; Rodný, M.; Buchkina, N.P. Can a single dose of biochar affect selected soil physical and chemical characteristics? J. Hydrol. Hydromech. 2018, 66, 421–428. [Google Scholar] [CrossRef] [Green Version]
  56. Mohsenipour, M.; Shahid, S. Estimation of Saturated Hydraulic Conductivity: A Review. Available online: https://www.academia.edu/32994134/ESTIMATION_OF_SATURATED_HYDRAULIC_CONDUCTIVITY_A_REVIEW (accessed on 1 November 2020).
  57. Igaz, D.; Kondrlová, E.; Horák, J.; Čimo, J.; Tárník, A.; Bárek, V. Stanovenie koeficientu hydraulickej vodivosti laboratórnymi metódami [Determination of hydraulic conductivity coefficient by laboratory methods]. In Základné Merania v Hydropedológii [Basic Measurements in Hydropedology]; Slovenská Pol’nohospodárska Univerzita: Nitra, Slovakia, 2017; pp. 46–56. (In Slovak) [Google Scholar]
  58. Iwai, C.B.; Oo, A.N.; Kruapukdee, A.; Chuasavatee, T. Vermicompost as soil amendment for sustainable land and environment in Thailand. In Soil Amendments for Sustainability; Rakshit, A., Sarkar, B., Abhilash, P.C., Eds.; CRC Press: New York, NY, USA, 2019; pp. 321–349. [Google Scholar]
  59. Kováčik, P.; Ryant, P. Agrochémia, Princípy a Prax [Agrochemistry, Principles and Practice]; SPU: Nitra, Slovakia, 2019. (In Slovak) [Google Scholar]
  60. Atkinson, C.J.; Fitzgerald, J.D.; Hipps, N.A. Potential mechanisms for achieving agricultural benefits from biochar application to temperate soils: A review. Plant Soil 2010, 337, 1–18. [Google Scholar] [CrossRef]
  61. Jones, D.L.; Rousk, J.; Edwards-Jones, G.; DeLuca, T.H.; Murphy, D.V. Biochar–mediated changes in soil quality and plant growth in a three years field trial. Soil Biol. Biochem. 2012, 45, 113–124. [Google Scholar] [CrossRef]
  62. Juriga, M.; Šimanský, V. Effects of biochar and its reapplication on Soil pH and sorption properties of Silt Loam Haplic Luvisol. Acta Hortic. Regiotect. 2019, 22, 65–70. [Google Scholar] [CrossRef] [Green Version]
  63. Horák, J. Testing biochar as a possible way to ameliorate slightly acidic soil at the research field located in the Danubian lowland. Acta Hortic. Reg. 2015, 18, 20–24. [Google Scholar] [CrossRef] [Green Version]
  64. Le Leuch, L.M.; Bandosz, T.J. The Role of Water and Surface Acidity on the Reactive Adsorption of Ammonia on Modified Activated Carbon. Carbon 2007, 45, 568–578. [Google Scholar] [CrossRef]
  65. Taghizadeh-Toosi, A.; Clough, T.J.; Condron, L.M.; Sherlock, R.R.; Anderson, C.R.; Craigie, R.A. Biochar incorporation into pasture soil suppresses in situ nitrous oxide emissions from ruminant urine patches. J. Environ. Qual. 2011, 40, 468–476. [Google Scholar] [CrossRef] [PubMed] [Green Version]
  66. Lehmann, J.; Silva, J.S.; Steiner, C.; Nehls, T.; Zech, W.; Glaser, B. Nutrient availability and leaching in an archaelogical anthrosol and ferralsol of the Central Amazon basin: Fertilizer, manure and charcoal amendments. Plant Soil 2003, 249, 343–357. [Google Scholar] [CrossRef]
  67. Ippolito, J.A.; Novak, J.M.; Busscher, W.J.; Ahmedna, M.; Rehrah, D.; Watts, D.W. Switchgrass biochar affects two Aridisols. J. Environ. Qual. 2012, 41, 1123–1130. [Google Scholar] [CrossRef] [PubMed]
  68. Van Zwieten, L.; Kimber, S.; Morris, S.; Chan, K.Y.; Downie, A.; Rust, J.; Joseph, S.; Cowie, A. Effect of biochar from slow pyrolysis of papermill waste on agronomic performance and soil fertility. Plant Soil 2010, 327, 235–246. [Google Scholar] [CrossRef]
  69. Singh, B.P.; Hatton, B.J.; Singh, B.; Cowie, A.L.; Kathuria, A. Influence of biochars on nitrous oxide emission and nitrogen leaching from two contrasting soils. J. Environ. Qual. 2010, 39, 1224–1235. [Google Scholar] [CrossRef]
  70. Fischer, D.; Glaser, B. Synergisms between compost and biochar for sustainable soil amelioration. In Management of Organic Waste; Kumar, S., Bharti, A., Eds.; IntechOpen: Rijeka, Croatia, 2012; pp. 167–198. [Google Scholar] [CrossRef] [Green Version]
  71. Ouyang, L.; Wang, F.; Tang, J.; Yu, L.; Zhang, R. Effects of biochar amendment on soil aggregates and hydraulic properties. J. Soil Sci. Plant Nutr. 2013, 13, 991–1002. [Google Scholar] [CrossRef] [Green Version]
  72. Bronick, C.J.; Lal, R. The soil structure and land management: A review. Geoderma 2005, 124, 3–22. [Google Scholar] [CrossRef]
  73. Šimanský, V.; Šrank, D.; Jonczak, J.; Juriga, M. Fertilization and application of different biochar types and their mutual interactions influencing changes of soil characteristics in soils of different textures. J. Ecol. Eng. 2019, 20, 149–164. [Google Scholar] [CrossRef]
  74. Šimanský, V. Effects of biochar and biochar with nitrogen on soil organic matter and soil structure in Haplic Luvisol. Acta Fytotech. Zootech. 2016, 19, 129–138. [Google Scholar] [CrossRef] [Green Version]
  75. Barrow, C.J. Biochar: Potential for countering land degradation and for improving agriculture. Appl. Geogr. 2012, 34, 21–28. [Google Scholar] [CrossRef]
  76. Agegnehu, G.; Bass, A.M.; Nelson, P.N.; Muirhead, B.; Wright, G.; Bird, M.I. Biochar and biochar-compost as soil amendments: Effects on peanut yield, soil properties and greenhouse gas emissions in tropical North Queensland, Australia. Agric. Ecosyst. Environ. 2015, 213, 72–85. [Google Scholar] [CrossRef]
  77. Leelamanie, D.A.L. 2014. Initial water repellency affected organic matter depletion rates of manure amended soils in Sri Lanka. J. Hydrol. Hydromech. 2014, 62, 309–315. [Google Scholar] [CrossRef] [Green Version]
  78. Liyanage, T.D.P.; Leelamanie, D.A.L. Influence of organic manure amendments on water repellency, water entry value, and water retention of soil samples from a tropical ultisol. J. Hydrol. Hydromech. 2016, 64, 160–166. [Google Scholar] [CrossRef] [Green Version]
  79. Šrank, D.; Šimanský, V. Physical properties of texturally different soils after application of biochar substrates. Agriculture [Poľnohospodárstvo] 2020, 66, 45–55. [Google Scholar] [CrossRef]
  80. Kinney, T.; Masiello, C.A.; Dugan, B.; Hockaday, W.C.; Dean, M.R.; Zygourakis, K.; Barnes, R.T. Hydrologic properties of biochars produced at different temperatures. Biomass Bioenergy 2012, 41, 34–43. [Google Scholar] [CrossRef]
  81. Toková, L.; Igaz, D.; Horák, J.; Aydin, E. Effect of biochar application and re-application on soil bulk density, porosity, saturated hydraulic conductivity, water content and soil water availability in a silty loam Haplic Luvisol. Agronomy 2020, 10, 1005. [Google Scholar] [CrossRef]
  82. Chintala, R.; Owen, R.K.; Kumar, S.; Schumacher, T.E.; Malo, D. Biochar impacts on denitrification under different soil water contents. World Cong. Soil Sci. 2014, 6, 157. [Google Scholar]
  83. Liang, B.; Lehmann, J.; Solomon, D.; Kinyangi, J.; Grossman, J.; O’Neill, B.; Skjemstad, J.O.; Thies, J.; Luiz˘ao, F.J.; Petersen, J.; et al. Black carbon increases cation exchange capacity in soils. Soil Sci. Soc. Am. J. 2006, 70, 1719–1730. [Google Scholar] [CrossRef] [Green Version]
  84. Are, K.S. Biochar and soils physical health. In An Imperative Amendment for Soil and the Environment; Abrol, V., Sharma, P., Eds.; IntechOpen: Rijeka, Croatia, 2019; pp. 21–33. [Google Scholar] [CrossRef] [Green Version]
  85. Barnes, R.T.; Gallagher, M.E.; Masiello, C.A.; Liu, Z.; Dugan, B. Biochar-induced changes in soil hydraulic conductivity and dissolved nutrient fluxes constrained by laboratory experiments. PLoS ONE 2014, 9, 108340. [Google Scholar] [CrossRef] [Green Version]
  86. Lim, T.J.; Spokas, K.A.; Feyereisen, G.; Novak, J.M. Predicting the impact of biochar additions on soil hydraulic properties. Chemosphere 2016, 142, 136–144. [Google Scholar] [CrossRef] [PubMed]
  87. Lehmann, J.; Stephen, J. Biochar effect on soil hydrology. In Biochar for Environmental Management: Science, Technology and Impementation; Routledge: London, UK; Taylor & Francis Group: Boca Raton, FL, USA, 2015; pp. 543–563. [Google Scholar]
  88. Jones, B.E.H.; Haynes, R.J.; Phillips, I.R. Effect of amendment of bauxite processing sand with organic materials on its chemical, physical and microbial properties. J. Environ. Manag. 2010, 91, 2281–2288. [Google Scholar] [CrossRef] [PubMed]
  89. Juriga, M.; Šimanský, V. Effect of biochar on soil structure—Review. Acta Fytotech. Zootech. 2018, 21, 11–19. [Google Scholar] [CrossRef]
  90. Juriga, M.; Šimanský, V.; Horák, J.; Kondrlová, E.; Igaz, D.; Polláková, N.; Buchkina, N.; Balashov, E. The effect of different rates of biochar and biochar in combination with N fertilizer on the parameters of soil organic matter and soil structure. J. Ecol. Eng. 2018, 19, 153–161. [Google Scholar] [CrossRef]
  91. Fangueiro, D.; Senbayran, M.; Trindade, H.; Chadwick, D. Cattle slurry treatment by screw press separation and chemically enhanced settling: Effect ongreenhouse gas emissions afterland spreading and grass yield. Bioresour. Technol. 2008, 99, 7132–7142. [Google Scholar] [CrossRef]
  92. Castaldi, S.; Riondino, M.; Baronti, S.; Esposito, F.R.; Marzaioli, R.; Rutigliano, F.A.; Vaccari, F.P.; Miglietta, F. Impact of biochar application to a Mediterranean wheat crop on soil microbial activity and greenhouse gas fluxes. Chemosphere 2011, 85, 1464–1471. [Google Scholar] [CrossRef] [PubMed]
  93. Tan, G.; Wang, H.; Xu, N.; Liu, H.; Zhai, L. Biochar amendment with fertilizers increases peanut N uptake, alleviates soil N2O emissions without affecting NH3 volatilization in field experiments. Environ. Sci. Pollut. Res. 2018, 25, 1–10. [Google Scholar] [CrossRef]
  94. Wang, Y.S.; Liu, Y.S.; Liu, R.L.; Zhang, A.P.; Yang, S.Q.; Liu, H.Y.; Zhou, Y.; Yang, Z. Biochar amendment reduces paddy soil nitrogen leaching but increases net global warming potential in Ningxia irrigation, China. Sci. Rep. 2017, 7, 1592. [Google Scholar] [CrossRef] [Green Version]
  95. Steiner, C.; Teixeira, W.G.; Lehmann, J.; Zech, W. Long term effects of manure, charcoaland mineral fertilization on crop production and fertility on a highly weathered central amazonian upland soil. Plant Soil 2007, 291, 275–290. [Google Scholar] [CrossRef] [Green Version]
  96. Simek, M.; Cooper, J.E. The influence of soil pH on denitrification: Progress towards the understatnding of this interaction over the last 50 years. Eur. J. Soil Sci. 2002, 53, 345–354. [Google Scholar] [CrossRef]
  97. Aydin, E.; Šimanský, V.; Horák, J.; Igaz, D. Potential of biochar to alternate soil properties and crop yield 3 and 4 years after the application. Agronomy 2020, 10, 889. [Google Scholar] [CrossRef]
Figure 1. Experimental site: (A) location; (B) schematic layout of the experimental treatments with reapplied biochar in 2018.
Agronomy 11 00582 g001
Figure 2. Nitrous oxide emissions: (a) dynamics of daily N2O emissions from control, biochar application (in 2014), and reapplication (in 2018) treatments during the field trial period. Error bars represent ± SE. B—biochar reapplication; N—nitrogen fertilizer application; S—sowing of spring barley; H—harvesting spring barley; D—disking. (b) Average N2O emissions at different treatments over the field trial period. Error bars represent the standard errors among the average data of the sampling dates.
Agronomy 11 00582 g002
Figure 3. Cumulative N2O emissions over the whole studied period from control, biochar application (in 2014), and reapplication (in 2018) treatments combined with (a) N0 fertilization level; (b) N1 fertilization level; (c) N2 fertilization level. Error bars represent ± standard errors.
Agronomy 11 00582 g003
Figure 4. Linear relationships according to regression analysis: (a) N2O and NH4+; (b) N2O and NO3; (c) N2O and soil pH(KCl).
Agronomy 11 00582 g004
Table 1. Evaluation of monthly precipitation and mean air temperature normality in 2018 compared to the climatic normal (CN) 1960–1991.
MonthPrecipitationAir Temperature
Total (mm)% of NormalDescriptionMean (°C)Deviation of Normal (°C)Description
January22.1071.29dry2.384.08very warm
February26.8083.75normal−0.66−1.36normal
March48.60162.00very wet3.39−1.61cold
April12.4031.79very dry15.384.98extremely warm
May26.0044.83very dry18.773.67extremely warm
June109.00165.15very wet20.682.68very warm
July43.1082.88normal21.741.94warm
August73.70120.82normal22.453.15extremely warm
September68.90172.25very wet16.430.83normal
October14.1039.17very dry12.261.86warm
November33.0060.00dry5.661.16normal
December59.70149.25wet−1.50−1.60cold
Table 2. Overview of the treatments and individual amounts of applied biochar and inorganic N-fertilizer in the field experiment.
TreatmentsBiochar Application in 2014 (t ha−1)Biochar Reapplication in 2018 (t ha−1)N-Fertilizer Application in 2018 (kg N ha−1)
N0 Level—unfertilized treatments
B0+N0000
B10+N01000
B20+N02000
B10reap+N010100
B20reap+N020200
N1 Level—fertilized treatments
B0+N10040
B10+N110040
B20+N120040
B10reap+N1101040
B20reap+N1202040
N2 Level—fertilized treatments
B0+N20080
B10+N210080
B20+N220080
B10reap+N2101080
B20reap+N2202080
Table 3. The physical and chemical properties of applied biochar (Sonnenerde Company, Riedlingsdorf, Austria).
pH(KCl)Organic C
(%)
Total N
(%)
C:NBulk Density
(g cm−3)
Specific Surface Area
(m2 g−1)
Ash
(%)
8.853.11.437.90.2121.738.3
Table 4. Effect of biochar treatments on soil chemical properties averaged over the studied period in 2018 (means ± standard errors). Different letters within columns indicate that treatment means over the sampling dates are significantly different at p ≤ 0.05 according to the least significant difference (LSD) multiple-range test.
TreatmentspH(KCl)NH4+NO3SOC
(mg kg1)(mg kg1)(g kg1)
N0 Level—unfertilized treatments (0 kg N ha−1)
B0+N05.67 ± 0.1 a6.44 ± 1.1 ab12.1 ± 1.7 a10.97 ± 1.7 a
B10+N05.61 ± 0.1 a6.70 ± 0.9 ab11.49 ± 2.1 a13.38 ± 1.6 a
B20+N05.93 ± 0.1 b7.24 ± 1.2 ab12.79 ± 1.8 a15.37 ± 3.1 a
B10reap+N06.07 ± 0.1 bc6.04 ± 1.0 a10.42 ± 3.0 a17.87 ± 4.4 b
B20reap+N06.14 ± 0.1 c7.99 ± 1.9 b10.58 ± 1.3 a20.48 ± 4.0 c
N1 Level—fertilized treatments (40 kg N ha−1)
B0+N15.10 ± 0.1 a15.26 ± 5.3 b20.28 ± 3.2 a8.51 ± 2.5 a
B10+N15.85 ± 0.4 bc6.84 ± 1.2 a18.74 ± 4.7 a8.86 ± 1.6 ab
B20+N15.62 ± 0.2 b11.66 ± 4.2 ab22.86 ± 4.2 a9.37 ± 2.6 b
B10reap+N16.05 ± 0.4 c6.73 ± 1.4 a16.64 ± 4.0 a16.37 ± 1.9 bc
B20reap+N15.93 ± 0.1 c11.30 ± 4.0 ab18.09 ± 4.1 a23.53 ± 2.4 c
N2 Level—fertilized treatments (80 kg N ha−1)
B0+N24.75 ± 0.1 a36.93 ± 11.9 b32.03 ± 4.9 a9.21 ± 1.0 a
B10+N25.32 ± 0.3 b25.70 ± 10.1 ab28.70 ± 4.6 a13.78 ± 1.1 bc
B20+N25.37 ± 0.2 b18.69 ± 3.9 a32.71 ± 5.0 a12.08 ± 1.1 ab
B10reap+N25.82 ± 0.2 c23.07 ± 9.5 ab27.16 ± 6.5 a17.07 ± 2.1 cd
B20reap+N25.86 ± 0.1 c17.33 ± 3.1 a30.17 ± 7.2 a19.80 ± 2.0 d
Table 5. The effect of biochar application and reapplication on bulk density, soil water content, saturated hydraulic conductivity, and basic soil water constants (means ± standard errors). Different letters within columns indicate that treatment means over the sampling dates are significantly different at p ≤ 0.05 according to the LSD multiple-range test.
TreatmentsBD
(g cm−3)
SWC
(% mass)
K
(cm h−1)
P (0 kPa)
(% vol.)
FC (−20 kPa)
(% vol.)
PWP (−1500 kPa)
(% vol.)
AWC
(% vol.)
n = 8n = 3n = 8n = 8n = 8n = 8n = 8
N0 Level—unfertilized treatments (0 kg N ha−1)
B0+N01.42 ± 0.09 a12.04 ± 1.0 a0.40 ± 0.24 a44.37 ± 2.85 a29.08 ± 0.80 a21.20 ± 1.02 a8.41 ± 0.67 ab
B10+N01.49 ± 0.07 a11.91 ± 1.1 a0.17 ± 0.14 a42.83 ± 2.00 a29.85 ± 0.58 a21.44 ± 0.67 a8.29 ± 0.53 a
B20+N01.37 ± 0.11 a12.43 ± 1.2 a0.42 ± 0.43 a45.19 ± 3.59 a30.02 ± 0.99 a21.61 ± 0.69 a8.40 ± 0.65 ab
B10reap+N01.43 ± 0.09 a12.00 ± 0.9 a0.77 ± 0.44 a44.73 ± 2.55 a30.44 ± 0.89 ab20.74 ± 1.37 a9.70 ± 0.81 bc
B20reap+N01.36 ± 0.09 a13.32 ± 1.0 a2.64 ± 1.30 b44.56 ± 2.86 a31.56 ± 0.56 b22.10 ± 1.42 a9.77 ± 1.06 c
N1 Level—fertilized treatments (40 kg N ha−1)
B0+N01.41 ± 0.09 a0.40 ± 0.24 a44.37 ± 2.85 a29.08 ± 0.80 a21.20 ± 1.02 ab8.41 ± 0.67 a
B0+N11.42 ± 0.09 a10.80 ± 0.8 a0.90 ± 0.79 a45.93 ± 2.19 a29.53 ± 1.11 ab
B10+N11.46 ± 0.04 a11.73 ± 0.9 a0.96 ± 0.56 a45.13 ± 1.29 a31.30 ± 0.62 c21.95 ± 0.86 ab9.02 ± 1.06 a
B20+N11.45 ± 0.08 a11.22 ± 1.0 a 0.62 ± 0.42 a44.46 ± 2.56 a30.04 ± 0.97 abc20.57 ± 0.71 a8.36 ± 0.69 a
B10reap+N11.41 ± 0.09 a12.09 ± 0.9 ab0.98 ± 0.75 a45.13 ± 2.74 a30.83 ± 0.71 bc22.61 ± 0.71 b8.49 ± 0.64 a
B20reap+N11.41 ± 0.04 a13.75 ± 1.1 b0.76 ± 0.55 a44.81 ± 1.63 a30.36 ± 0.48 abc21.47 ± 1.14 ab9.22 ± 0.75 a
N2 Level—fertilized treatments (80 kg N ha−1)
B0+N01.41 ± 0.09 ab0.40 ± 0.24 a44.37 ± 2.85 a29.08 ± 0.80 a21.20 ± 1.02 a8.41 ± 0.67 ab
B0+N21.47 ± 0.05 b11.72 ± 0.8 a0.35 ± 0.33 a44.81 ± 2.65 a29.95 ± 0.75 abc
B10+N21.46 ± 0.07 b11.25 ± 0.9 a1.73 ± 0.71 b44.50 ± 1.17 a29.71 ± 0.96 ab22.01 ± 0.69 a8.86 ± 1.00 ab
B20+N21.34 ± 0.07 a11.92 ± 0.9 ab0.64 ± 0.34 a47.58 ± 2.62 ab30.46 ± 0.69 bc21.86 ± 1.01 a8.15 ± 0.79 a
B10reap+N21.32 ± 0.06 a12.49 ± 1.1 ab0.77 ± 0.47 a48.22 ± 1.68 ab29.96 ± 0.49 abc21.78 ± 0.93 a9.31 ± 0.76 ab
B20reap+N21.31 ± 0.06 a13.62 ± 1.5 b0.49 ± 0.41 a48.93 ± 2.34 b31.19 ± 0.78 c20.92 ± 0.70 a9.88 ± 0.98 b
BD—bulk density, SWC—soil water content, K—saturated hydraulic conductivity, P—porosity, FC—field capacity, PWP—permanent wilting point, and AWC—available water content.
Publisher’s Note: MDPI stays neutral with regard to jurisdictional claims in published maps and institutional affiliations.

