Abstract
Glyphosate is the most widely used herbicide in crop production due to the widespread adoption of glyphosate-resistant (GR) crops. However, the spray of glyphosate onto non-target crops from ground or aerial applications can cause severe injury to non-GR corn plants. To evaluate the crop damage of the non-GR corn plants from glyphosate and the recoverability of the damaged plants, we used the hyperspectral imaging (HSI) technique in field experiments with different glyphosate application rates. This study investigated the spectral characteristic of corn plants and assessed the corn plant damage from glyphosate. Based on HSI image analysis, a spectral variation pattern was observed at 1 week after treatment (WAT), 2 WAT, and 3 WAT from the glyphosate-treated non-GR corn plants. It was further found that the corn plants treated with glyphosate rates equal to or higher than 0.5X (X = 0.866 kilograms acid equivalents/hectare (kg ae/ha) represents the recommended spray rate for GR corn) would suffer unrecoverable damage. Using the Jeffries–Matusita distance as the spectral sensitivity criterion, three sensitive bands from the measured spectra were selected to create two spectral indices for crop recoverability differentiation in band ratio and normalization forms, respectively. With the two spectral indices, the corn plants recoverable and unrecoverable from damage were classified with an overall accuracy greater than 95%. Then, three machine learning algorithms (k-nearest neighbors, random forest, and support vector machine) were respectively combined with the successive projections algorithm to create models to relate selected feature spectral bands to glyphosate spray rates. The results indicated that the models achieved reasonable accuracy, especially in the group of recoverable plants. This study illustrated the potential of the hyperspectral imaging technique for evaluating crop damage from herbicides and recoverability of the injured plants using different data analysis and machine learning modeling approaches for practical weed management in crop fields.
1. Introduction
Herbicides have played an important role in weed control and crop production. Since the discovery of its herbicidal properties in 1971 and commercialization in 1974, glyphosate has been used extensively on both crop and non-crop lands. Glyphosate is the most commonly applied herbicide either alone or with other herbicides to manage a broad spectrum of weeds [1]. Glyphosate is applied multiple times in a year using either ground or aerial equipment for different purposes. In recent years, glyphosate has been more frequently used in agriculture, forestry, and orchards because of its effectiveness in controlling weeds and improving agricultural economic benefits. The frequent use of glyphosate in agriculture is also due to the widespread adoption of glyphosate-resistant (GR) crops. So, glyphosate spray onto non-GR crops from ground or aerial applications is a major concern for farmers. The use of glyphosate, however, is particularly important because it is a non-selective herbicide and highly active on sensitive, non-GR plant species even at low doses [2]. The damage may cause plant death in some serious cases [3]. Therefore, evaluation of off-target crop damage by glyphosate is critical for effective weed management.
Conventionally, the evaluation of crop damage by off-target herbicides is mainly through visual evaluation or measurement of some biological response parameters of the crop, such as plant height, plant shoot dry weight, and leaf chlorophyll content. [4]. However, the conventional method is laborious and time consuming and particularly not applicable for large fields. Therefore, a fast, low-cost method is needed in weed management. Given that the changes in a plant’s biological status can be reflected optically by spectral changes, the use of a spectral method for plant analysis may provide a chance to create a much-needed method to effectively detect and differentiate herbicide-injured crops. As an advanced remote sensing technique, hyperspectral imaging (HSI) has undergone rapid development. Especially in recent years, it has become possible to obtain hyperspectral spectral signal data by scanning plants for every pixel within the images. HSI has the ability to provide both spectral and spatial information from the images, which allows the evaluation of spatially varied subtle spectral changes to infer the biophysical and biochemical status of the plants [5,6,7,8,9,10]. Research of plant classification and status monitoring based on the spectral library technique is of great significance for plant monitoring using hyperspectral remote sensing [11,12,13]. The spectral characteristics of different crop plants or plants under different statuses were studied to support monitoring tasks.
HSI has been successfully used in detecting different plant stresses, such as toxic metals [14], salts [15], and diseases [16,17,18]. In terms of the application of HSI in detecting herbicide damage, Yao et al., (2012) found that the modified spectral derivatives at wavelengths 519, 670, 685, and 697 nm have potential in the early detection of glyphosate damage in non-glyphosate-resistant (non-GR) soybean plants [19]. Kong et al., (2016) evaluated the feasibility of hyperspectral imaging in detecting herbicide damage in oilseed rape [20]. Based on 23 wavelengths that were selected by competitive adaptive reweighted sampling and the extreme learning machine model, the content of malondialdehyde in oilseed rape leaves under herbicide stress can be determined, which thus permits the non-destructive evaluation of the herbicide damage. Scholten et al., (2019) found that the vegetation indices extracted from HSI have strong correlations with several photosynthetic parameters and can be used for monitoring herbicide damage in wilding conifers [21]. Bloem et al., (2020) examined the potential of HSI in identifying glyphosate application in agricultural fields [22]. Based on the data collected from a hyperspectral imaging camera, it was found that selected vegetation indices, such as the normalized difference lignin index, the carotenoid reflectance index, and the photochemical reflectance index, can serve as a proxy to non-destructively monitor glyphosate application in the fields.
Apart from the differentiation between herbicide damage and non-herbicide damage and determination of the damage severity in plants, whether the plants are able to recover from the herbicide damage is also a particularly important issue in practice. In this aspect, we assessed the damage in soybean from sprayed dicamba, another widely used herbicide, using in situ handheld hyperspectral plant sensing [23] and HSI with machine learning models [24], which showed that hyperspectral techniques have great potential in determining the recoverability of and the damage severity in the plants. With the success of the previous HSI assessment of soybean damage from dicamba, we proposed to conduct this study to assess corn damage from glyphosate by using HSI and machine learning models. The objectives of the present study were (1) to analyze spectral characteristics from HSI data and biological responses of corn plants for assessing the damage from glyphosate, (2) to evaluate spectral characteristics from HSI data to determine the recoverability of corn plants that were injured by glyphosate, and (3) to evaluate machine learning models in determining the damage severity to relate selected feature spectral bands to glyphosate spray rates.
2. Materials and Methods
The field experiment was conducted in a 4.5-hectare experimental field in Stoneville, MS, USA (latitude: 33.445062°, longitude: 90.869967°) at the research farm of the U.S. Department of Agriculture (USDA), Agricultural Research Service (ARS), by two USDA-ARS scientists and other technical support staff. Based on the information provided by the Web Soil Survey, USDA Natural Resources Conservation Service at http://websoilsurvey.sc.egov.usda.gov/ (accessed on 30 December 2020), the predominant soils in the field were a clay soil of the Sharkey series (very fine, smectitic, thermic Chromic Epiaquerts) and a sandy loam soil of the Commerce series (fine silty, mixed, superactive, non-acid, thermic Fluvaquentic Endoaquepts). Commerce silty clay loam and Tunica clay series were also present in this field, but their relative areas represented only 4.6% and 6.4% of the total field area.
In the experimental field, 32 corn field plots were divided into 4 blocks. Each block consisted of 8 plots, and each plot included 8 rows. Seven glyphosate spray rates (0.0X, 0.01X, 0.05X, 0.1X, 0.2X, 0.5X, and 1.0X, where X = 0.866 kg ae/ha is the recommended application amount per hectare and 0.0X is the control group without glyphosate treatment) were set up in the experiment. A complete randomized block design was adopted in the experiment design of glyphosate treatments for the blocks and plots in the field (Figure 1).
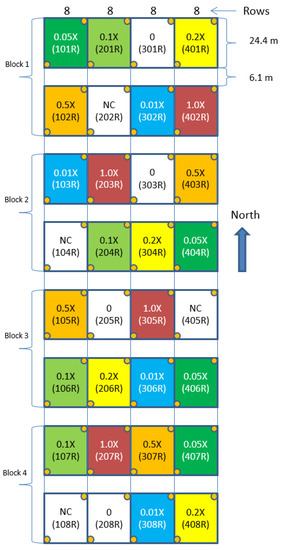
Figure 1.
Field experiment layout for assessing corn damage from glyphosate.
2.1. Field Preparation and Treatments
The field was prepared with disking and bedding in the fall of the previous year and treated with glufosinate at 0.45 kg active ingredient (AI) ha−1 plus pendimethalin at 1.12 kg AI ha−1 prior to planting to kill existing vegetation and to provide residual weed control a week prior to crop planting. A non-GR corn hybrid (Pioneer 31P41) was planted at the rate of 75,000 seeds ha−1. At the four-leaf stage of the corn plants, a single application of glyphosate at six rates, 0.01X, 0.05X, 0.1X, 0.2X, 0.5X, and 1.0X, was made to the field based on the experimental design. The plant heights reached 15–20 cm at this stage. The non-treated plots were included as control (represented as 0.0X). Roundup WeatherMax® (Monsanto Co., St Louis, MO, USA), a commercial formulation of the potassium salt of glyphosate, was used with no additional adjuvant. Glyphosate was applied using a four-row hooded spray boom mounted on a tractor equipped with 876 cm-spaced Tee Jet 8003 120 standard flat-spray nozzles delivering 140 L ha−1 water at 193 kPa at the speed of 2.15 m per second.
2.2. Measurements of Hyperspectral and Biological Response Data
The hyperspectral data and corresponding crop biological responses were measured at 1 week after treatment (WAT), 2 WAT, and 3 WAT, respectively, including plant height (Ht), plant shoot dry weight (dry Wt), and leaf chlorophyll content (Chl). From selected locations with representative growth conditions in each plot, 5 plants were randomly excised, stored in the cooler, and transported to the laboratory for immediate hyperspectral imaging. Simultaneously, 5 plants were randomly selected and measured for Ht. In the plot, the youngest fully expanded leaves from 3 plants were sampled for Chl determination. Chl was extracted with 10 mL of dimethyl sulfoxide and quantified using a spectrophotometer (UV160U; Shimadzu Corp., Kyoto, Japan) by a method described by Hiscox and Israelstam (1979) [25]. From each plot in the field, 10 plants were cut for lab measurements of plant shoot dry weight. Then, the sampled plants were dried at 60 °C for 72 h in the lab and the dry Wt was measured for each plant.
Hyperspectral imaging was conducted using a Resonon Pika II Visible+Near-Infrared (VNIR) hyperspectral imaging system (Resonon, Bozeman, MT, USA). The Pika II camera was mounted approximately 1 m above the sample table, which (when combined with lens magnification) resulted in sub-centimeter pixel sizes. The camera has a 2.1 nm spectral resolution and a 12-bit dynamic range. The spectral range of the camera was 400–900 nm, with 240 narrow wavelength bands evenly spaced in the range. The high spatial resolution of the imaging settings ensured that a very large number of pure plant pixels were present in the images. During imaging, the sample table was covered with a black felt cloth, which has little spectral reflection, to provide good contrast between the plants and the background in the acquired images. Figure 2 illustrates the imaging platform to show how the hyperspectral imaging measurement was conducted.
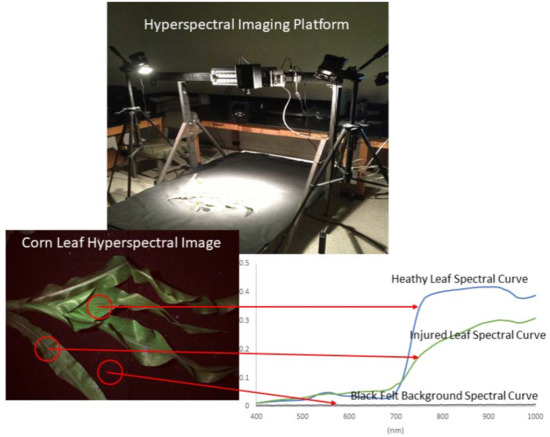
Figure 2.
Pika II Visible+Near-Infrared (VNIR) hyperspectral imaging platform for corn leaf imaging.
Before spectral measurement, the hyperspectral camera measured the dark current with the lens cap covered and the white reference with a 0.3 × 0.3 m Spectrolon® reference target with 99% nominal reflectance (Labsphere, North Sutton, NH, USA). The dark current and white reference data were used to radiometrically calibrate the plant hyperspectral digital counts into percent reflectance. The following equation was used for hyperspectral image calibration [5]:
where is the reflectance of the image pixel at the location of within the image, is the digital count of the image pixel at the location of within the image, is the measured white reference digital count of the image pixel at the location of within the image, and is the measured dark current digital count of the image pixel at the location of within the image.
The hyperspectral images with good contrast between the target plants and the background were further segmented into the pixels of plant and the pixels of non-plant. In the segmentation, a mask layer of the corn plants was generated from each hyperspectral image. The spectrum for the corn plant in the image is the average of the spectra of all segmented plant pixels based on the mask image. The averaged plant spectra from all hyperspectral images were then used for assessing corn damage from glyphosate.
The algorithm of hyperspectral image processing was programmed using Python (version 2.7, available at http://www.python.org (accessed on 10 September 2020)), a widely used high-level programming language, to extract the plant spectra of heathy and stressed corn plants from the acquired hyperspectral images.
2.3. Data Analysis Methods
2.3.1. Spectral Ratio Curves
For plots under different glyphosate treatments, the extracted spectra of the corn plants were used to reflect the spectral characteristics of herbicide damage. In each block, by dividing the spectrum of each glyphosate-treated plot by the spectrum of the corresponding untreated plot as the reference (0.0X), the spectral ratio curve was obtained and facilitated the analysis of spectral characteristics of crop damage due to glyphosate spray. All the spectral images that were collected at 1 WAT, 2 WAT, and 3 WAT were processed to extract plant spectra and convert them into hyperspectral ratio curves for further analysis. Figure 3 shows spectral ratio curves of the plots that were further averaged according to the glyphosate dosage levels at 1 WAT, 2 WAT, and 3 WAT.
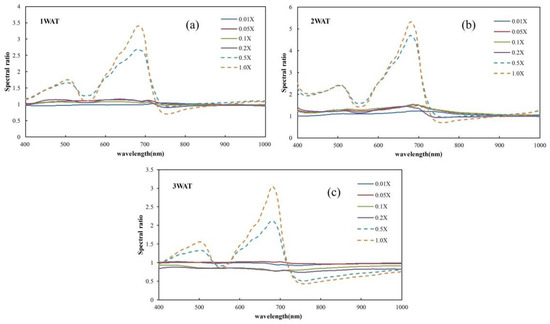
Figure 3.
Average spectral ratio curves of corn plants at 1 week after treatment (WAT) (a), 2 WAT (b), and 3 WAT (c) under different glyphosate rates, where X = 0.866 kilograms acid equivalents/hectare (kg ae/ha) is the recommended application amount per hectare.
To create effective spectral features to be able to distinguish recoverable and unrecoverable corn plants and quantify the damage severity from glyphosate spray, further spectral analyses were designed and conducted, which included (1) identification of spectral bands and development of plant recoverability spectral indices and (2) selection of spectral feature bands and creation of (machine learning) models for determining the damage severity. In the process of analysis and modeling, 2/3rd of the data were randomly selected at each glyphosate spray rate as training data (total 93 at each WAT), whereas the remaining data were used as testing data (total 47 at each WAT).
- 1.
- Recoverability spectral indices of plant damage from glyphosate
Based on the ratio spectral curves, firstly, the Jeffries–Matusita (JM) distance was applied to conduct a spectral sensitivity analysis to evaluate the capability of the spectral bands in differentiating the recoverable and unrecoverable plant samples. The JM distance represents the probability distribution distance of features and further represents the ability of features to distinguish categories. If the JM distance of a feature is larger, it means that the feature is more separable for the two categories. For example, the JM distance between category Ci and category Cj is defined as follows:
where is the JM distance between category and category , and are the conditional probability distributions of two categories of eigenvector , is the eigenvector whose dimension is the number of categories.
The JM distance can indicate the separability of a category variable on the basis of probability distributed distances between two groups [26]. By traversing all spectral bands, a JM distance curve can be generated that indicates the potential of each band in distinguishing the recoverability of all glyphosate-damaged corn plants. The spectral bands located at the peaks of the JM distance curve can be considered as the potential spectral bands with superior separability for constructing a recoverability spectral index. Then, based on the three best sensitive spectral bands identified from the spectral peaks of the JM distance curve, two recoverability indices can be constructed in the form of either the ratio or normalization, as follows:
where CIRRI and CIRNI are the crop damage recoverability ratio index and the crop damage recoverability normalization index, respectively; is the value of the ration spectral curve at the spectral band ; and and are the coefficients of CIRRI and and are the coefficients of CIRNI. These coefficients were determined through spectral data fitting by a Fisher linear discriminant analysis (FLDA) [27] using the training dataset. FLDA finds the coefficients of linear discriminant function by searching for the projecting direction with the largest inter-group variation but the smallest intra-group variation. In the process of the analysis, the two terms associated with the coefficients in each index were taken as two independent variables and each index was taken as the dependent variable in the equation. The recoverable and unrecoverable categories were marked in the calibration process as 0 and 1, respectively.
In addition, for the purpose of comparison with the proposed spectral indices, the plant physiological reflectance index (PRI) [28] was used in the analysis. PRI is a spectral index that is isolated from narrow waveband spectral measurements of plant canopies. It is formulated analogously to the broadband normalized difference vegetation index (NDVI) [29] and uses the spectral reflectance at 531 nm and at a reference wavelength to minimize complications associated with diurnal sun angle changes. In conjunction with other published vegetation indices, this index may lead to improved estimates of canopy photosynthetic function in characterizing plant stress. The formulation of PRI is as follows:
where is the reflectance at a reference wavelength and is the reflectance at 531 nm. Regularly, is set at 550 nm. This study set it at 570 nm for better correlation of PRI with photosynthetic indication in relation to the NDVI to characterize plant stress [28].
To determine the recoverability of the corn plants with the indices, a thresholding method was applied. Within the data range from minimum to maximum indices, the method was implemented over 100 uniform intervals using the training data. The threshold corresponding to the highest overall accuracy was used to determine the recoverability of corn damage from glyphosate.
- 2.
- Crop damage severity detection based on selected spectral bands
For crop damage characterization, considering the high collinearity between the hyperspectral bands, the usual band selection methods that treated each band as an individual variable tend to generate feature bands with relatively high information redundancy [5]. To deal with this issue, the successive projections algorithm (SPA) was used in this study for selecting feature bands. By conducting a variable projection and matrix analysis, the SPA is able to obtain a set of wavelengths with the least collinearity among them [30]. Using the training dataset, the hyperspectral bands that are sensitive to glyphosate spray rates were identified with minimal information redundancy for further analysis.
2.3.2. Determination of Crop Damage Severity
To determine corn damage due to different glyphosate spray rates, models were created using three commonly used machine learning algorithms, k-nearest neighbors (KNN) [31], random forest (RF) [32], and support vector machine (SVM) [33], respectively implemented with the SPA procedure. These machine learning algorithms are data classifiers based on different pattern recognition principles and are widely used in the detection of plant stress in crop production. Among the algorithms, KNN is a non-linear classifier based on the Euclidean or Hamming distance among samples in the feature space. RF is an integrated classifier, which is constructed based on multiple decision trees with a voting strategy. SVM is a classifier with good generalization ability. It generates the classification model mainly based on some samples at the edge of two classes that are recognized as support vectors. Combining the projected sample features from low dimensional space to high dimensional space with the aid of a variety of kernel functions, SVM is able to solve relatively complicated classification cases. To assess and compare the performances among the three machine learning algorithms in determining crop damage severity, the overall accuracy (OA) is used as the accuracy indicator in the analysis. Given that the recoverable corn samples and unrecoverable samples may exhibit different spectral variation patterns, the models were created with all recoverable and unrecoverable sample data and evaluated for accuracy for two cases, (1) only recoverable samples and (2) all recoverable and unrecoverable samples, respectively. The OA can be calculated according to the following equation:
where and are the numbers of correctly classified samples and incorrectly classified samples, respectively, based on the output of a classifier.
In summary, Figure 4 is the workflow of the process of data processing and analysis process for this study. The data statistical analysis and modeling were implemented through programs coded with the MATLAB software (MathWorks Inc., Natick, MA, USA).
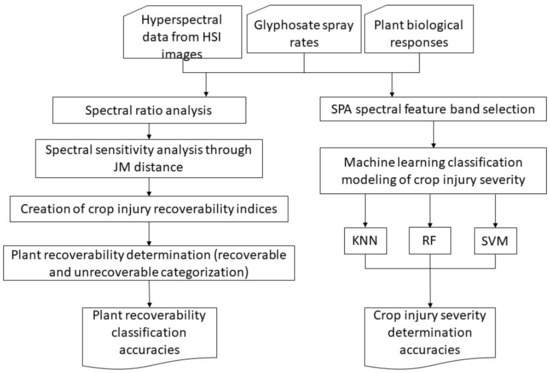
Figure 4.
Workflow of data processing and analysis in this study.
3. Results
3.1. Spectral Characteristics and Biological Response of Crop Damage
When harvesting, the yield of each plot was recorded by the yield monitor mounted on the combine harvester. Table 1 summarizes the means and standard deviations of the measured biological response parameters, Ht, dry Wt, and Chl, of corn plants at 1 WAT, 2 WAT, and 3 WAT.

Table 1.
Statistics of the biological responses of corn plants (X = 0.866 kilograms acid equivalents/hectare (kg ae/ha) is the recommended application amount per hectare).
Table 1 shows that the biological responses (Ht, dry Wt, and Chl) of the corn plants all had a clear decreasing trend with the increase in the glyphosate dosage and indicated unrecoverable crop damage within the glyphosate spray range of 0.5X–1.0X. It can be determined that the spray rate of 0.5X is the turning point that would determine the recoverability of corn plants. Corn plants sprayed at glyphosate rates lower than 0.5X are recoverable, whereas those sprayed at glyphosate rates higher than or equal to 0.5X are unrecoverable.
Figure 5 shows spectra of the plots that were further averaged according to the glyphosate dosage levels at 1 WAT, 2 WAT, and 3 WAT. Table 2 summarizes the means and standard deviations of the spectra. The sample size of the spectra processed from all HSI images at each WAT is 140 (=5 plants × 7 plots × 4 blocks) (Figure 1).
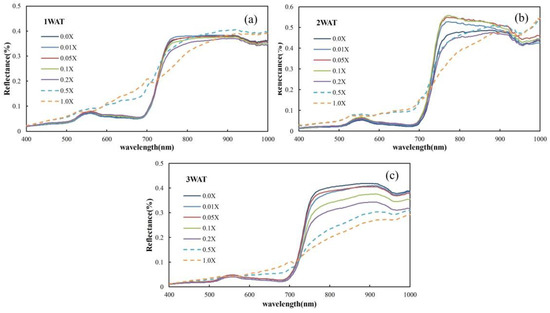
Figure 5.
Average reflectance spectral curves at 1 WAT (a), 2 WAT (b), and 3 WAT (c) under different glyphosate rates, where X = 0.866 kilograms acid equivalents/hectare (kg ae/ha) is the recommended application amount per hectare.
Table 2.
Statistics of the spectral reflectance with different spray rates at different WATs (X = 0.866 kg acid equivalents/hectare (kg ae/ha) is the recommended application amount per hectare).
By observing the spectral ratio curves corresponding to different glyphosate treatments (Figure 3), a unique spectral difference is found between two glyphosate concentration groups. The two groups are the plots treated with glyphosate less than 0.5X and the plots treated with glyphosate equal to or greater than 0.5X. An independent t-test was conducted to derive the statistical significance of the difference between the recoverable and unrecoverable groups. There are 78.47%, 79.43%, and 85.17% portions of bands that achieved a significant difference (p-value < 0.05) at 1 WAT, 2 WAT, and 3 WAT, respectively, which confirmed sound spectral variation between the two groups.
Given that the spectral difference between the recoverable and unrecoverable groups was already evident at 1 WAT (Figure 3), it is possible to predict the recoverability of the corn plants from herbicide damage at an early stage, which is of great significance to guide the practice.
3.2. Differentiating Recoverable and Unrecoverable Plants
As shown in Figure 6, the bands’ sensitivity can be illustrated according to the curves of the JM distance between 0.01X–0.2X samples and 0.5X–1.0X samples, indicating the recoverability of the glyphosate-treated corn plants. In the averaged JM distance curve from 1 WAT to 3 WAT, four peaks were identified, around 449 nm, 669 nm, 771 nm, and 980 nm. From Figure 3 and Figure 6, it is observed that the reflectance of glyphosate-treated samples increases significantly at 449 nm and 669 nm but decreases at 771 nm. Considering that a combination of bands associated with opposite change directions can enhance the sensitivity for assessing a plant’s recoverability, the above three bands were selected to construct the crop damage recoverability indices. As formulated in Equations (3) and (4), two indices, CIRRI and CIRNI, were created with the coefficients fitted through FLDA, resulting in the following indices for this study:
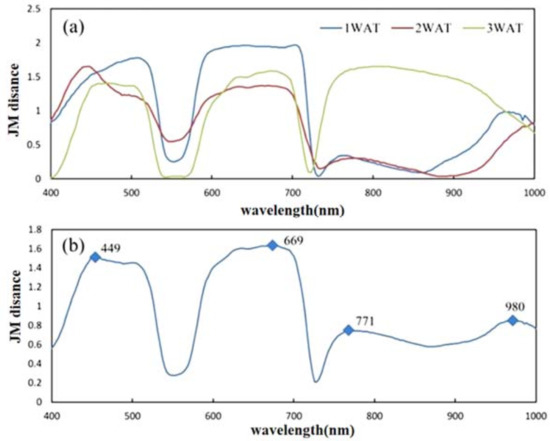
Figure 6.
Sensitivity of bands to the recoverability of the glyphosate-treated corn plants: (a) Jeffries–Matusita (JM) distance curves between the recoverable (0.01X–0.2X) and unrecoverable (0.5X–1.0X) samples at 1 WAT, 2 WAT, and 3 WAT; (b) bands marked at the curve peaks of the averaged JM distance curve.
Different from the regular spectral indices based on the original band reflectance, in CIRRI and CIRNI, the reflectance values of the bands were converted to spectral ratio values to illustrate the relative spectral difference between the glyphosate-treated sample and untreated samples, which is expected to improve the generalization and robustness of the indices.
Based on the newly developed spectral indices, CIRRI and CIRNI, and the conventional index PRI, the optimal threshold for distinguishing the recoverable and unrecoverable plants were determined according to the strategy for establishing effective spectral features as mentioned in Section 2.3.1. The thresholds of CIRRI were 1.52 (1 WAT), 0.98 (2 WAT), and 1.40 (3 WAT); the thresholds of CIRNI were 0.21 (1 WAT), 0.91 (2 WAT), and 0.65 (3 WAT); and the threshold of PRI was −0.11 for 1 WAT, 2 WAT, and 3 WAT (Table 1). With these thresholds, CIRRI and CIRNI were able to distinguish recoverable and unrecoverable corn plants with relatively high accuracy within 1 WAT to 3 WAT. The OA of the classification increased slightly from 96% (CIRRI) and 95% (CIRNI) at 1 WAT to 98% (CIRRI) and 96% (CIRNI) at 2 WAT and achieved 100% for both indices at 3 WAT (Figure 7). Compared with the two new indices, the accuracy of PRI was significantly lower, with the OA of 0.82 at 1 WAT, 0.72 at 2 WAT, and 0.82 at 3 WAT (Figure 8).
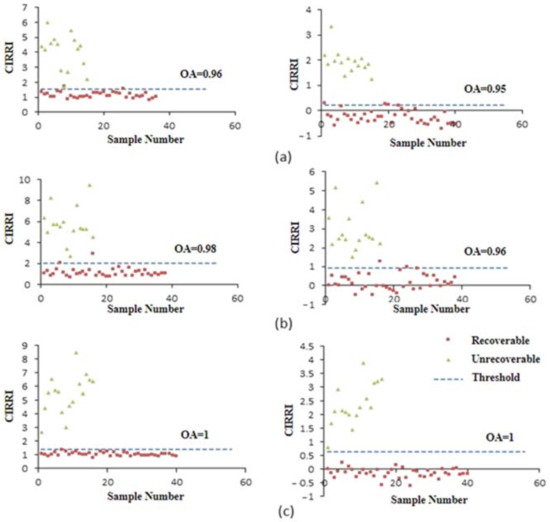
Figure 7.
Differentiation between recoverable and unrecoverable corn plants based on CIRRI and CIRNI at 1 WAT (a), 2 WAT, (b) and 3 WAT (c).
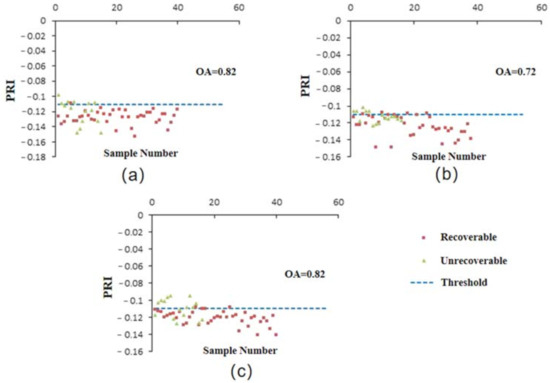
Figure 8.
Differentiation between recoverable and unrecoverable corn plants based on PRI at 1 WAT (a), 2 WAT, (b) and 3 WAT (c).
The significant spectral difference between recoverable and unrecoverable glyphosate treated corns relied on the success of hyperspectral data processing and analysis. The two newly developed crop recoverability indices enhanced the spectral response in representing the crop damage. The satisfactory classification accuracy of CIRRI and CIRNI over three WATs in differentiating recoverable and unrecoverable glyphosate-treated corns suggests the possibility of assessing the recoverability of corn plants from glyphosate injuries with a spectral measurement at an early stage.
3.3. Evaluation of Crop Damage Severity with SPA-Selected Feature Spectral Bands
For evaluating the severity of crop damage from glyphosate with hyperspectral data, the SPA was used for the selection of the most appropriate feature spectral bands. The SPA eliminated information redundancy during the band selection process and guaranteed a low level of correlation among the identified bands. Based on the selected feature bands, three machine learning algorithms, KNN, RF, and SVM, were used to create models, respectively, at 1 WAT, 2 WAT, and 3 WAT to relate the bands to the glyphosate spray rates.
Table 3 summarizes the accuracy of different machine learning algorithms to evaluate recoverable plants and all plants (recoverable and unrecoverable plants together) in relation to glyphosate spray rates. The accuracy varied significantly at different stages with 1 WAT, 2 WAT, and 3 WAT. The accuracy was generally high at 3 WAT and moderately low at 1 WAT and 2 WAT. The models yielded higher accuracy for recoverable plants than the models for all recoverable and unrecoverable plants at 2 WAT and 3 WAT. The highest accuracy of the models was 0.36 and 0.58 at 2 WAT and 3 WAT for all plants, compared with the highest accuracy of 0.43 and 0.75 for recoverable plants only. Figure 9 reflects the confusion matrix corresponding to the machine learning algorithm with the highest accuracy in the assessment of recoverable plants and the glyphosate spray rates at different stages at 1 WAT, 2 WAT, and 3 WAT. From an application perspective, determination of the crop damage severity for recoverable plants is practical for guidance on plant protection.
Table 3.
Accuracy in determining the severity of the herbicide damage based on spectral features and machine learning algorithms.
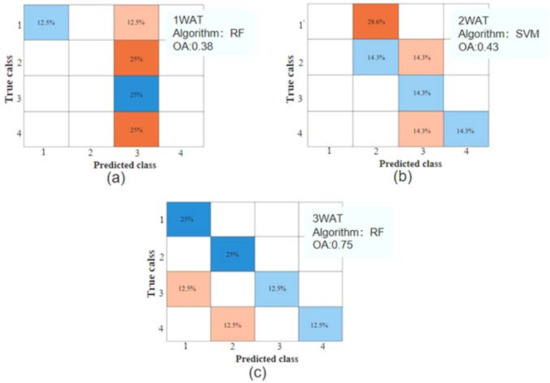
Figure 9.
The confusion matrix corresponding to the machine learning algorithm with the highest accuracy in the assessment of recoverable plants and the glyphosate spray rates at 1 WAT (a), 2 WAT (b), and 3 WAT (c).
Regarding the performance of different machine learning algorithms, Table 3 shows that RF and SVM outperformed KNN over three WATs. For the models of all plants, the classification accuracy of RF was close to that of SVM, especially with the same accuracy at 2 WAT (OA = 0.58) and 3 WAT (OA = 0.36). For the models of only recoverable plants, RF and SVM produced varied accuracy over the three WATs and RF yielded the highest accuracy at 1 WAT (OA = 0.38) and 3 WAT (OA = 0.75), whereas SVM yielded the highest accuracy at 2 WAT (OA = 0.43).
4. Discussion
Under glyphosate application, an obvious biophysical response of corn plants can be indicated via a variation pattern in the parameters Ht, dry Wt, and Chl (Table 1). In those non-GR plants, glyphosate application will block acetyl-CoA carboxylase (ACCase), acetolactate synthase (ALS), and microtubule assembly, which may cause the death of the growing point, stunting of plants, and root clubbing [4,34]. With an increase in the glyphosate spray rate, plants tend to suffer severe damage, which results in a decrease in Ht and dry Wt. The herbicide also inhibits the photosynthesis process, which may cause the destruction of the chlorophyll system and can be reflected by a decrease in Chl.
The biophysical response of corn plants to glyphosate is assumed to be strongly associated with the spectral change pattern. Compared with untreated plants, herbicide-treated corn plants tend to have higher reflectance in the visible range whereas lower reflectance in the NIR range (Figure 5). From the spectral ratio curves (herbicide treated/untreated), two peaks around the green and red bands can be observed, which are mainly governed by a variation in the pigment systems. This change is also consistent with a change in the pattern of Chl measurements. The withering and stunting of plants result in the weakening of the multi-scattering radiation (Figure 3), lowering the reflectance in the NIR range. The spectra at 1–3 WAT show a generally monotonous variation pattern, particularly over the NIR wavelength range. The plants’ morphological features (canopy leaf area, leaf angle distributions, contents of cellulose and lignin, etc.) determine the multi-scattering magnitude and thus induce significant spectral variation over the NIR spectral region. Moreover, it is noticeable that the plants under 0.5X–1.0X herbicide treatments exhibit a significant spectral difference from the plants under 0.0X–0.2X herbicide treatments. Such a difference indicates that the corn plants have undergone a gradual recovery or decline process (Figure 5). In our study, the glyphosate dosage rate at 0.2X was evaluated as the tipping point of its application. A higher rate of herbicide application would result in unrecoverable damage to the corn plants. With the aid of the band selection protocol, two vegetation indices, CIRRI and CIRNI, were developed. The two indices revealed a strong capability in differentiating the recoverable and unrecoverable situations at 1 WAT.
For determining the glyphosate spray rate, even with the SPA-based comprehensive band optimization protocol, the classification accuracy was not ideal (i.e., OA within 0.36–0.58 over 1–3 WAT). Different variation patterns of recoverable and unrecoverable samples may disturb the relationship between the spectral signal and the herbicide spray rate, which accounts for the low accuracy. Therefore, when considering the recoverable situation only, the classification accuracy at 2 WAT and 3 WAT were higher than the corresponding values for the pooled data (including all spray rate treatments).
Using machine learning algorithms with spectral observations, quantification of the severity of the corn plant injury from glyphosate using HSI data becomes possible. However, it still requires studies to further improve the accuracy and stability of the models for determining the crop injury severity, especially in the early stages. The results of this study, such as the three sensitive spectral bands, could be used for a new sensor to be designed and mounted on some active remote sensing platforms, such as a lab testing table, a ground on-the-go system in the field, and even a small drone, to conduct field-level monitoring of crop herbicide injury, which is needed for improving weed management in practical crop production. Then, with machine learning and other pattern recognition classification algorithms, the data and images acquired from the sensor can be modeled to assess the severity of crop herbicide injury.
5. Conclusions
This study evaluated the ability of HSI to assess the severity of GR corn plant damage from glyphosate and the recoverability of the damaged GR corn plant. The findings of this study are as follows: (1) The spectral response could be clearly observed in the corn plants in the plots treated with different rates of glyphosate, where those not treated (0.0X) were used as experiment control. The spectral differences between the recoverable and unrecoverable glyphosate-treated plots were evident at 1 WAT and became more obvious from 2 WAT up to 3 WAT; (2) with the aid of spectral sensitivity analysis, the spectral reflectance at 449 nm, 669 nm, and 771 nm was determined as sensitive bands for creating two spectral indices, CIRRI and CIRNI, for assessing the recoverability of the crop damaged by glyphosate. The testing results suggested satisfactory classification accuracy of the two indices in differentiating recoverable and unrecoverable plants, with OA of over 95% at 1 WAT; (3) implementing the SPA with three machine learning algorithms (KNN, RF, and SVM), respectively, models for determining crop damage severity were created. The testing results showed that these models could determine the glyphosate rates related to selected feature spectral bands for recoverable plants or all plants (recoverable and unrecoverable plants together).
In summary, this study can serve as a basis for determining the severity of crop damage from herbicides and the recoverability of the damaged crops with the data and images acquired from other remote sensing platforms, such as lab tables, fields on-the-go, small drones, and high-resolution satellites. The capability of the spectral features, such as selected sensitive bands, and machine learning models need to be further tested against remote sensing data in larger areas. Corresponding studies and tests are expected to provide more useful information to promote the effective management of crop damage from the off-target drift of sprayed herbicides.
Author Contributions
Conceptualization, T.Z., Y.H. and J.Z.; methodology, T.Z. and Y.H.; software, X.Z.; testing, P.Y. and X.Z.; investigation, Y.H., K.N.R. and T.Z.; writing—original draft preparation, T.Z., Y.H. and P.Y.; writing—review and editing, J.Z., Y.H. and K.N.R.; visualization, P.Y. and X.Z.; supervision, J.Z. and Y.H.; project administration, J.Z. and Y.H.; funding acquisition, J.Z. and Y.H. All authors have read and agreed to the published version of the manuscript.
Funding
This research received no external funding.
Institutional Review Board Statement
Not applicable.
Informed Consent Statement
Not applicable.
Acknowledgments
Thanks to Jason Weick for assistance with hyperspectral image acquisition; to Efren Ford, Earl Gordon, and Paige Goodlett for field measurement; and to Linwood Roberts, David Thornton, Earl Franklin, and Richard Horton for field production and maintenance.
Conflicts of Interest
The authors declare no conflict of interest.
References
- Duke, S.O.; Powles, S.B. Glyphosate: A once-in-a-century herbicide. Pest Manag. Sci. 2008, 64, 319–325. [Google Scholar] [CrossRef]
- Reddy, K.N.; Bellaloui, N.; Zablotowicz, R.M. Glyphosate effect on shikimate, nitrate reductase activity, yield, and seed composition in corn. J. Agric. Food Chem. 2010, 58, 3646–3650. [Google Scholar] [CrossRef]
- Payne, N.J.; Thompson, D.G. Off-target glyphosate deposits from aerial silvicultural applications under various meteorological conditions. Pest Manag. Sci. 2010, 34, 53–59. [Google Scholar] [CrossRef]
- Reddy, K.N.; Ding, W.; Zablotowicz, R.M.; Thomson, S.J.; Huang, Y.B.; Krutz, L.J. Biological responses to glyphosate drift from aerial application in non-glyphosate-resistant corn. Pest Manag. Sci. 2010, 66, 1148–1154. [Google Scholar] [CrossRef] [PubMed]
- Pu, R.L. Hyperspectral Remote Sensing: Fundamentals and Practices; CRC Press: Boca Raton, FL, USA, 2017. [Google Scholar]
- Xie, Q.; Liang, D.; Huang, W.; Chen, P.; Wu, C.; Yang, G.; Zhang, J.; Huang, L.; Zhang, D. Leaf Area Index Estimation Using Vegetation Indices Derived from Airborne Hyperspectral Images in Winter Wheat. IEEE J.-Stars. 2017, 7, 3586–3594. [Google Scholar] [CrossRef]
- Vigneau, N.; Ecarnot, M.; Rabatel, G.; Roumet, P. Potential of field hyperspectral imaging as a non destructive method to assess leaf nitrogen content in Wheat. Field Crop. Res. 2011, 122, 25–31. [Google Scholar] [CrossRef]
- Sun, Y.; Wang, Y.; Xiao, H.; Gu, X.; Pan, L.; Tu, K. Hyperspectral imaging detection of decayed honey peaches based on their chlorophyll content. Food Chem. 2017, 235, 194–202. [Google Scholar] [CrossRef]
- Piyush, P.; Yufeng, G.; Vincent, S.; James, C.S. High Throughput In vivo Analysis of Plant Leaf Chemical Properties Using Hyperspectral Imaging. Front Plant Sci. 2017, 8, 1348. [Google Scholar]
- Zhang, J.C.; Huang, Y.B.; Pu, R.L.; Gonzalez-Moreno, P.; Yuan, L.; Wu, K.H.; Huang, W.J. Monitoring plant diseases and pests through remote sensing technology: A review. Comput. Electron. Agric. 2019, 165, 104943. [Google Scholar] [CrossRef]
- Kokaly, F.; Clark, N.; Swayze, A.; Livo, E.; Hoefen, M.; Pearson, C.; Wise, A.; Benzel, M.; Lowers, A.; Driscoll, L.; et al. USGS Spectral Library Version 7. US Geol. Surv. 2017. [Google Scholar]
- Awad, M.M.; Alawar, B.; Jbeily, R. A New Crop Spectral Signatures Database Interactive Tool (CSSIT). Data 2019, 4, 77. [Google Scholar] [CrossRef]
- Baldridge, A.M.; Hook, S.J.; Grove, C.I.; Rivera, G. The ASTER spectral library version 2.0. Remote Sens. Environ. 2009, 113, 711–715. [Google Scholar] [CrossRef]
- Rathod, P.H.; Rossiter, D.G.; Noomen, M.F.; Meer, F.D.V.D. Proximal spectral sensing to monitor phytoremediation of metal-contaminated soils. Int. J. Phytoremediat. 2013, 15, 405–426. [Google Scholar] [CrossRef]
- Sytar, O.; Brestic, M.; Zivcak, M.; Olsovska, K.; Kovar, M.; Shao, H.; He, X. Applying hyperspectral imaging to explore natural plant diversity towards improving salt stress tolerance. Sci. Total Environ. 2017, 578, 90–99. [Google Scholar] [CrossRef]
- Jan, B.; Jörg, S.; Lutz, P. Detection of early plant stress responses in hyperspectral images. ISPRS J. Photogramm. 2014, 93, 98–111. [Google Scholar]
- Li, L.; Zhang, Q.; Huang, D. A review of imaging techniques for plant phenotyping. Sensors 2014, 14, 20078–20111. [Google Scholar] [CrossRef]
- Lowe, A.; Harrison, N.; French, A.P. Hyperspectral image analysis techniques for the detection and classification of the early onset of plant disease and stress. Plant Methods 2017, 13, 80. [Google Scholar] [CrossRef]
- Yao, H.; Huang, Y.; Hruska, Z.; Thomson, S.J.; Reddy, K.N. Using vegetation index and modified derivative for early detection of soybean plant damage from glyphosate. Comput. Electron. Agric. 2012, 89, 145–157. [Google Scholar] [CrossRef]
- Kong, W.; Liu, F.; Zhang, C.; Zhang, J.F.; Feng, H.L. Non-destructive determination of Malondialdehyde (MDA) distribution in oilseed rape leaves by laboratory scale NIR hyperspectral imaging. Sci. Rep. 2016, 6, 35393. [Google Scholar] [CrossRef]
- Scholten, R.C.; Hill, J.; Werner, W.; Buddenbaum, H.; Dash, J.P.; Gallego, M.G.; Rolando, C.A.; Pearse, G.D.; Hartley, R.; Estarija, H.J.; et al. Hyperspectral VNIR-spectroscopy and imagery as a tool for monitoring herbicide damage in wilding conifers. Biol. Invasions 2019, 21, 3395–3413. [Google Scholar] [CrossRef]
- Bloem, E.; Gerighausen, H.; Chen, X.J.; Schnug, E. The Potential of Spectral Measurements for Identifying Glyphosate Application to Agricultural Fields. Agronomy 2020, 10, 1409. [Google Scholar] [CrossRef]
- Huang, Y.; Lin, Y.; Reddy, K.N.; Zhang, J. In-situ plant hyperspectral sensing for early detection of soybean damage from dicamba. Biosyst. Eng. 2016, 149, 51–59. [Google Scholar] [CrossRef]
- Zhang, J.; Huang, Y.; Reddy, K.N.; Wang, B. Assessing crop damage from dicamba on non-dicamba-tolerant soybean by hyperspectral imaging through machine learning. Pest Manag. Sci. 2019, 75, 260–3272. [Google Scholar] [CrossRef] [PubMed]
- Hiscox, J.D.; Israelstam, G.F. A method for the extraction of chlorophyll from leaf tissues without maceration. Can. J. Bot. 1979, 57, 1332–1334. [Google Scholar] [CrossRef]
- Ullah, S.; Groen, T.A.; Schlerf, M.; Skidmore, A.K.; Nieuwenhuis, W.; Vaiphasa, C. Using a genetic algorithm as an optimal band selector in the mid and thermal infrared (2.5–14 μm) to discriminate vegetation species. Sensors 2012, 12, 8755–8769. [Google Scholar] [CrossRef]
- John, H.; Graham, H. Linear discriminant analysis in image restoration and the prediction of error rate. Lect. Notes-Monogr. Ser. 1991, 20, 112–129. [Google Scholar]
- Gamon, J.A.; Peñuelas, J.; Field, C.B. A narrow-waveband spectral index that tracks diurnal changes in photosynthetic efficiency. Remote Sens. Environ. 1992, 41, 35–44. [Google Scholar] [CrossRef]
- Rouse, J.W.; Haas, R.H.; Scheel, J.A.; Deering, D.W. Monitoring vegetation systems in the Great Plains with ERTS. NASA Spec. Publ. 1974, 1, 48–62. [Google Scholar]
- Araújo, M.C.U.; Saldanha, T.C.B.; Galvão, R.K.H.; Yoneyama, T.; Chame, H.C.; Visani, V. The successive projections algorithm for variable selection in spectroscopic multicomponent analysis. Chemom. Intell. Lab. Syst. 2001, 57, 65–73. [Google Scholar] [CrossRef]
- Alimjan, G.; Sun, T.; Liang, Y.; Jumahun, H.; Guan, Y. A new technique for remote sensing image classification based on combinatorial algorithm of SVM and KNN. Int. J. Pattern Recognit. Artif. Intell. 2018, 32, 1859012. [Google Scholar] [CrossRef]
- Belgiu, M.; Drăguţ, L. Random forest in remote sensing: A review of applications and future directions. ISPRS J. Photogramm. 2016, 114, 24–31. [Google Scholar] [CrossRef]
- Chi, M.; Rui, F.; Bruzzone, L. Classification of hyperspectral remote sensing data with primal SVM for small-sized training dataset problem. Adv. Space Res. 2008, 41, 1793–1799. [Google Scholar] [CrossRef]
- Herbicide Injury Symptoms on Corn and Soybeans. Available online: https://extension.sdstate.edu/sites/default/files/2019-09/S-0003-42-Corn.pdf (accessed on 10 October 2020).
Publisher’s Note: MDPI stays neutral with regard to jurisdictional claims in published maps and institutional affiliations. |
© 2021 by the authors. Licensee MDPI, Basel, Switzerland. This article is an open access article distributed under the terms and conditions of the Creative Commons Attribution (CC BY) license (http://creativecommons.org/licenses/by/4.0/).