
Agronomic Comparisons of Heirloom and Modern Processing Tomato Genotypes Cultivated in Organic and Conventional Farming Systems


Abstract
1. Introduction
2. Materials and Methods
2.1. Field Experiments
2.2. Growth Condition
2.3. Recorded Parameters
2.4. Data Analysis
3. Results
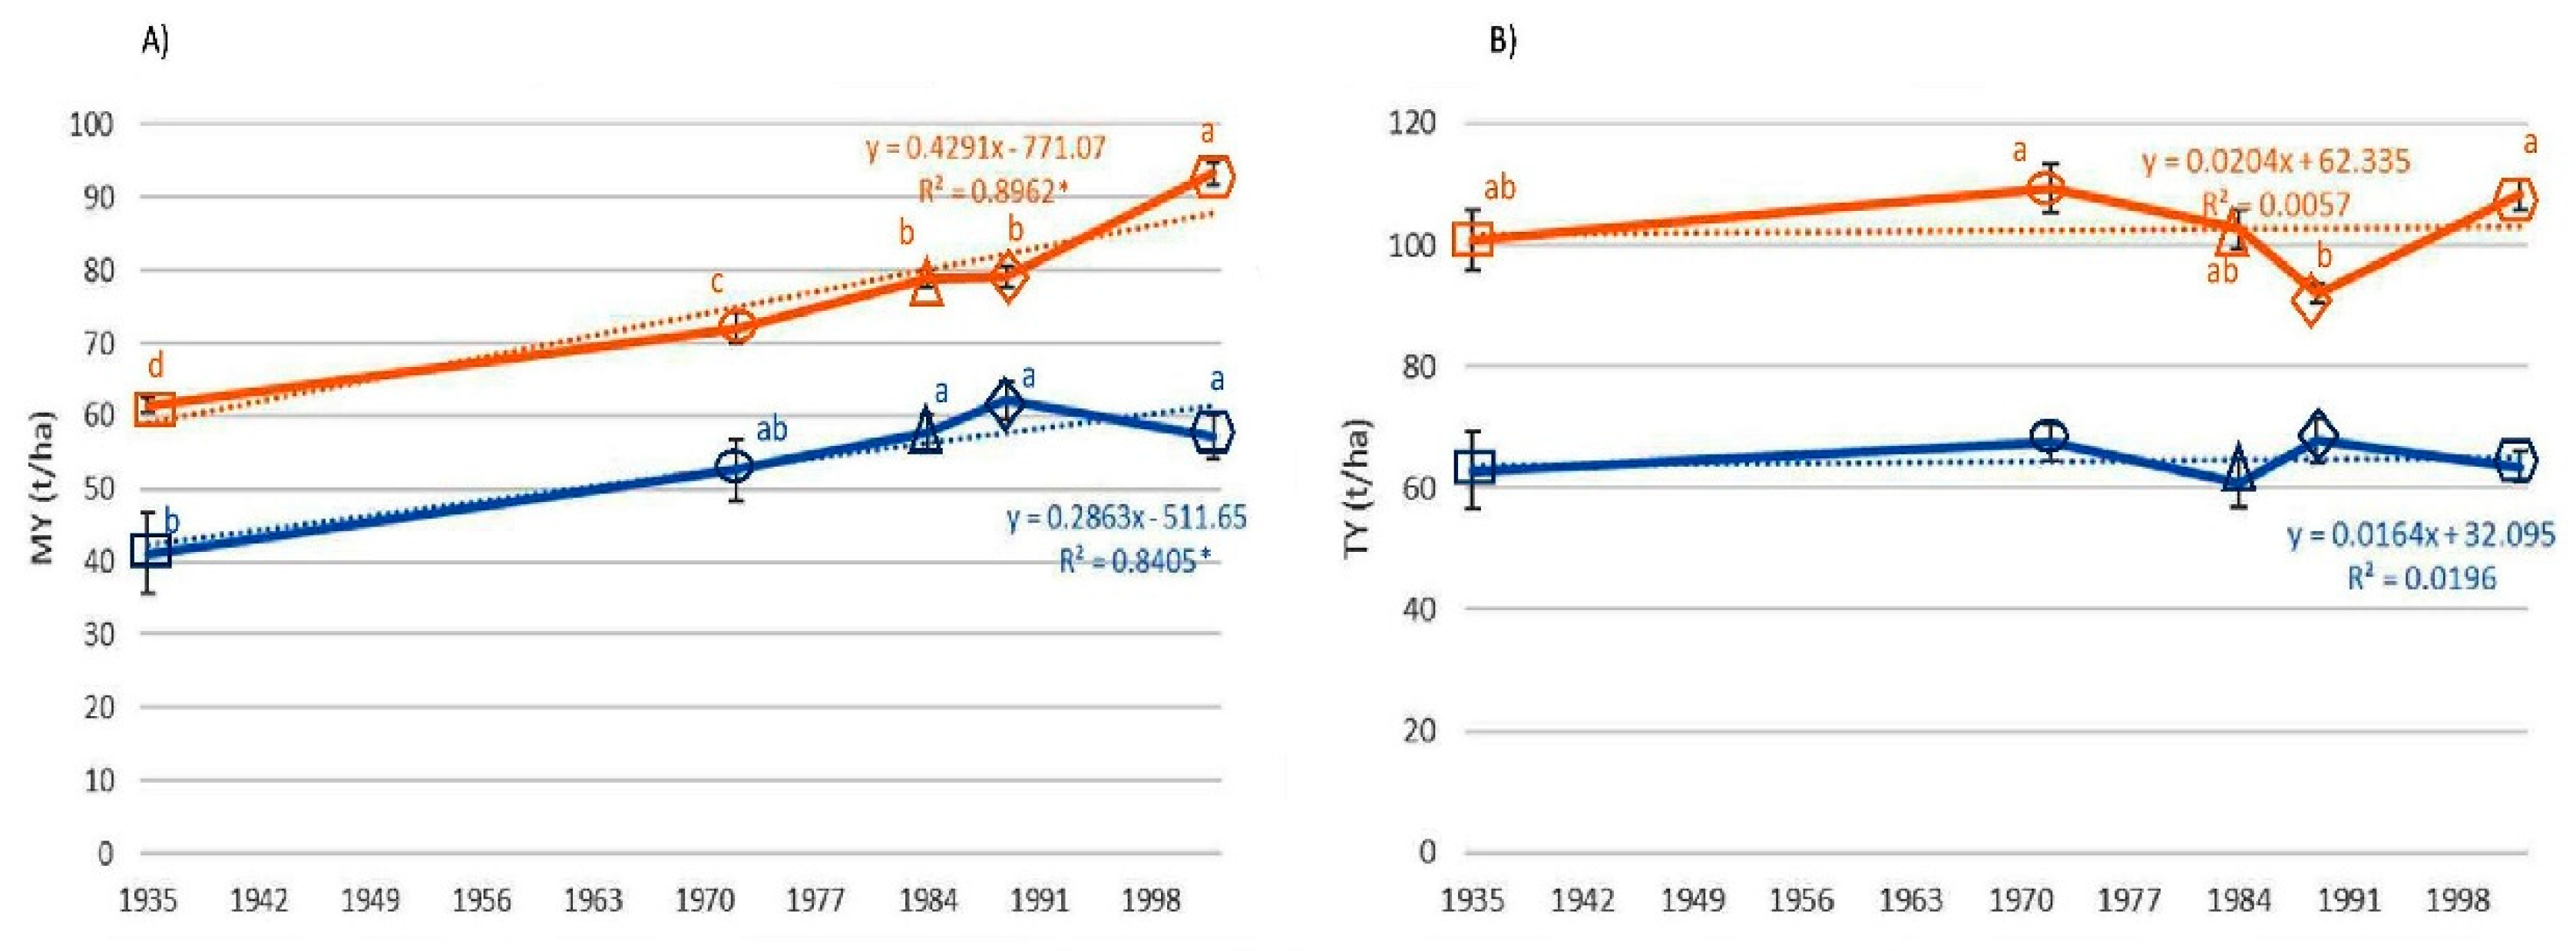
3.1. Fruit Yield
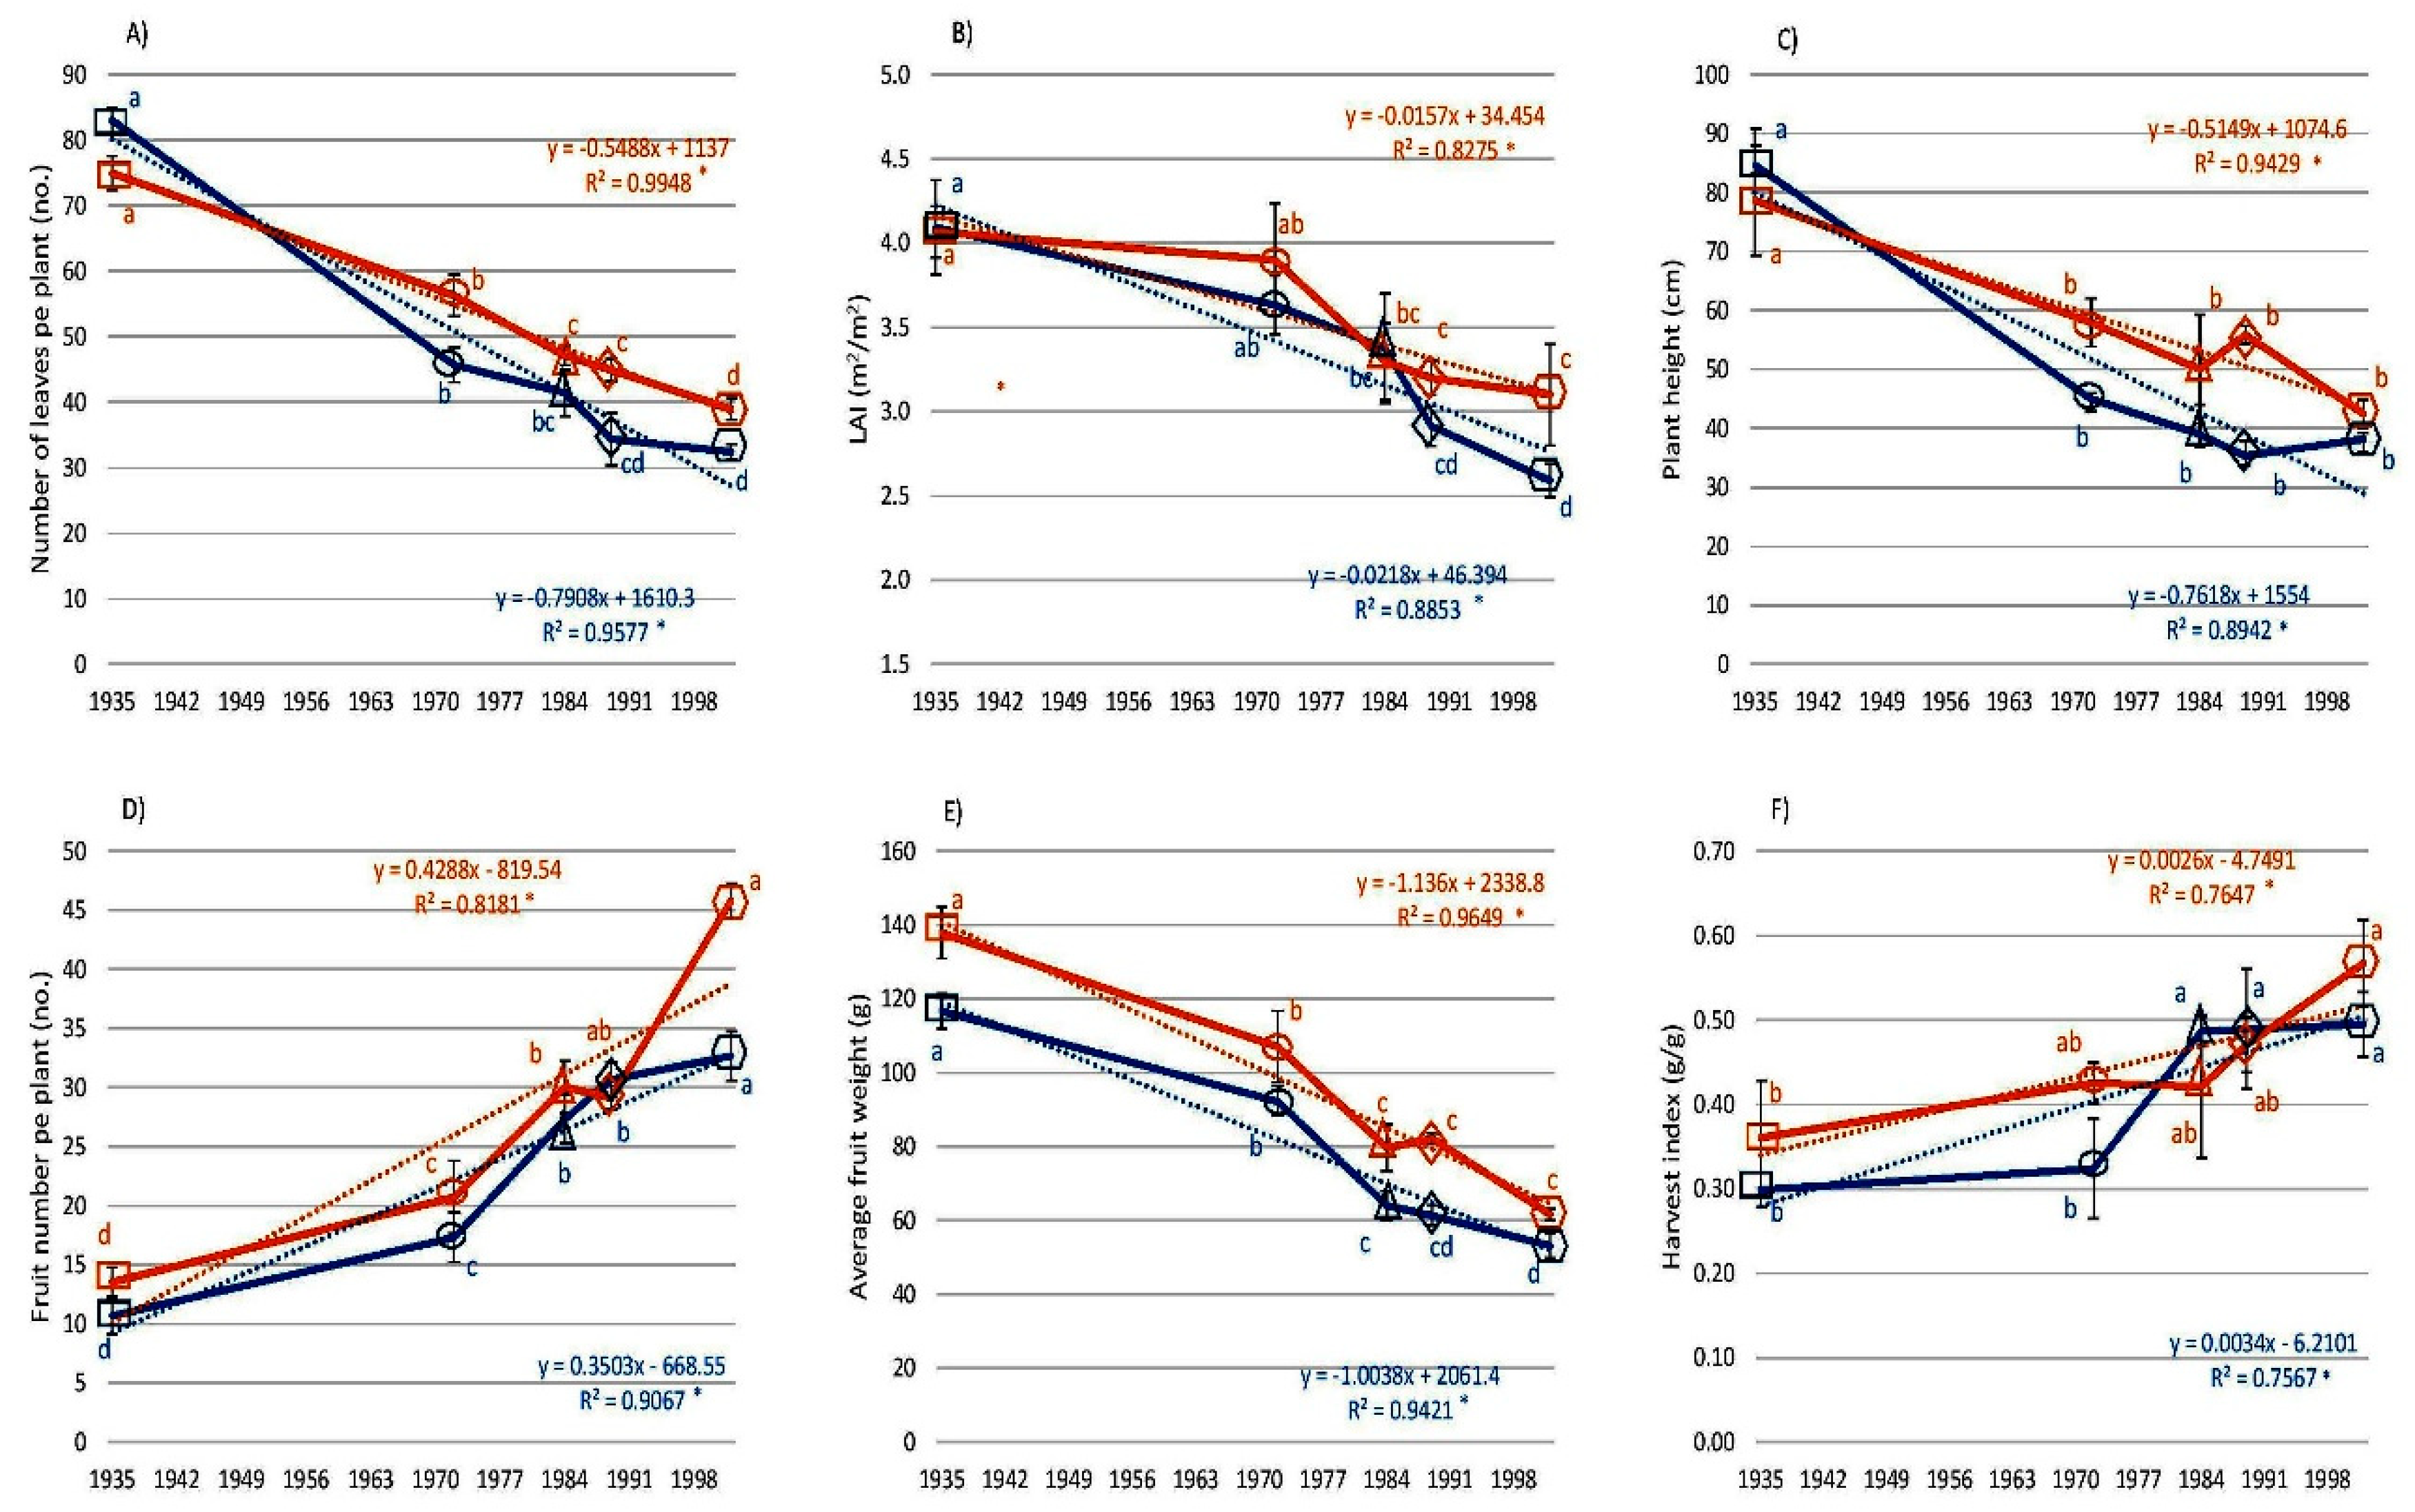
3.2. Morphological Traits
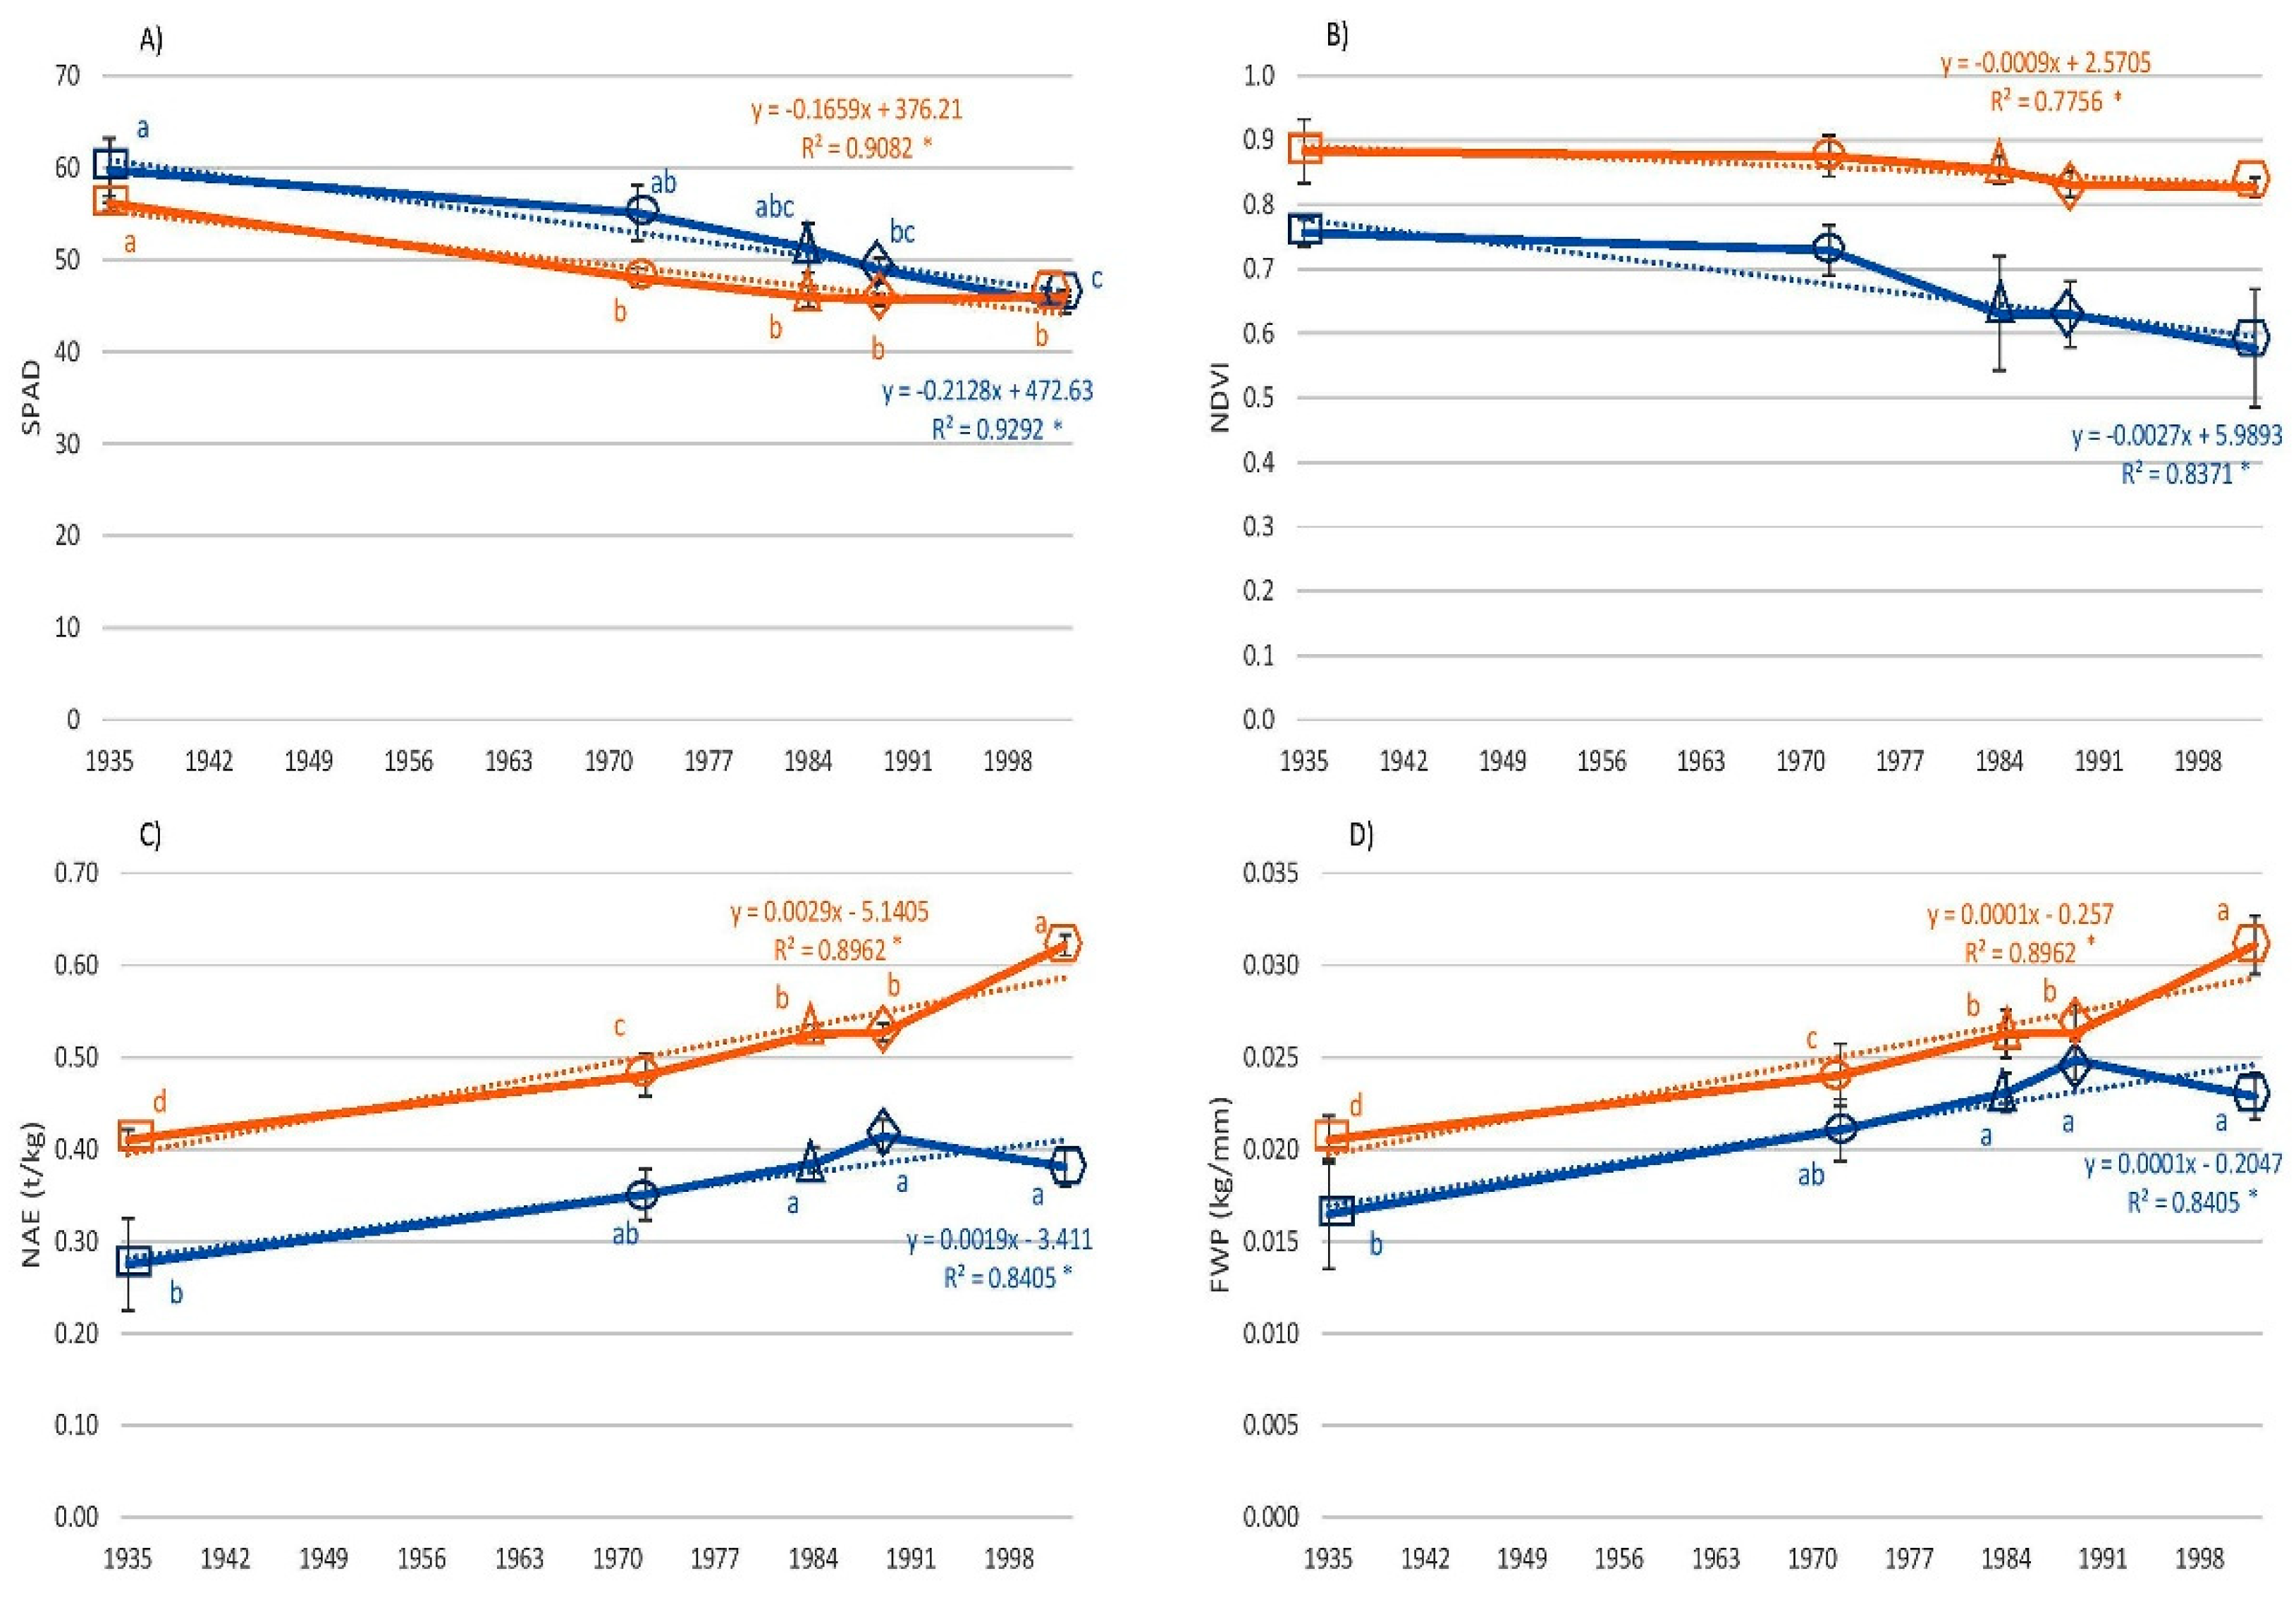
3.3. Physiological Traits
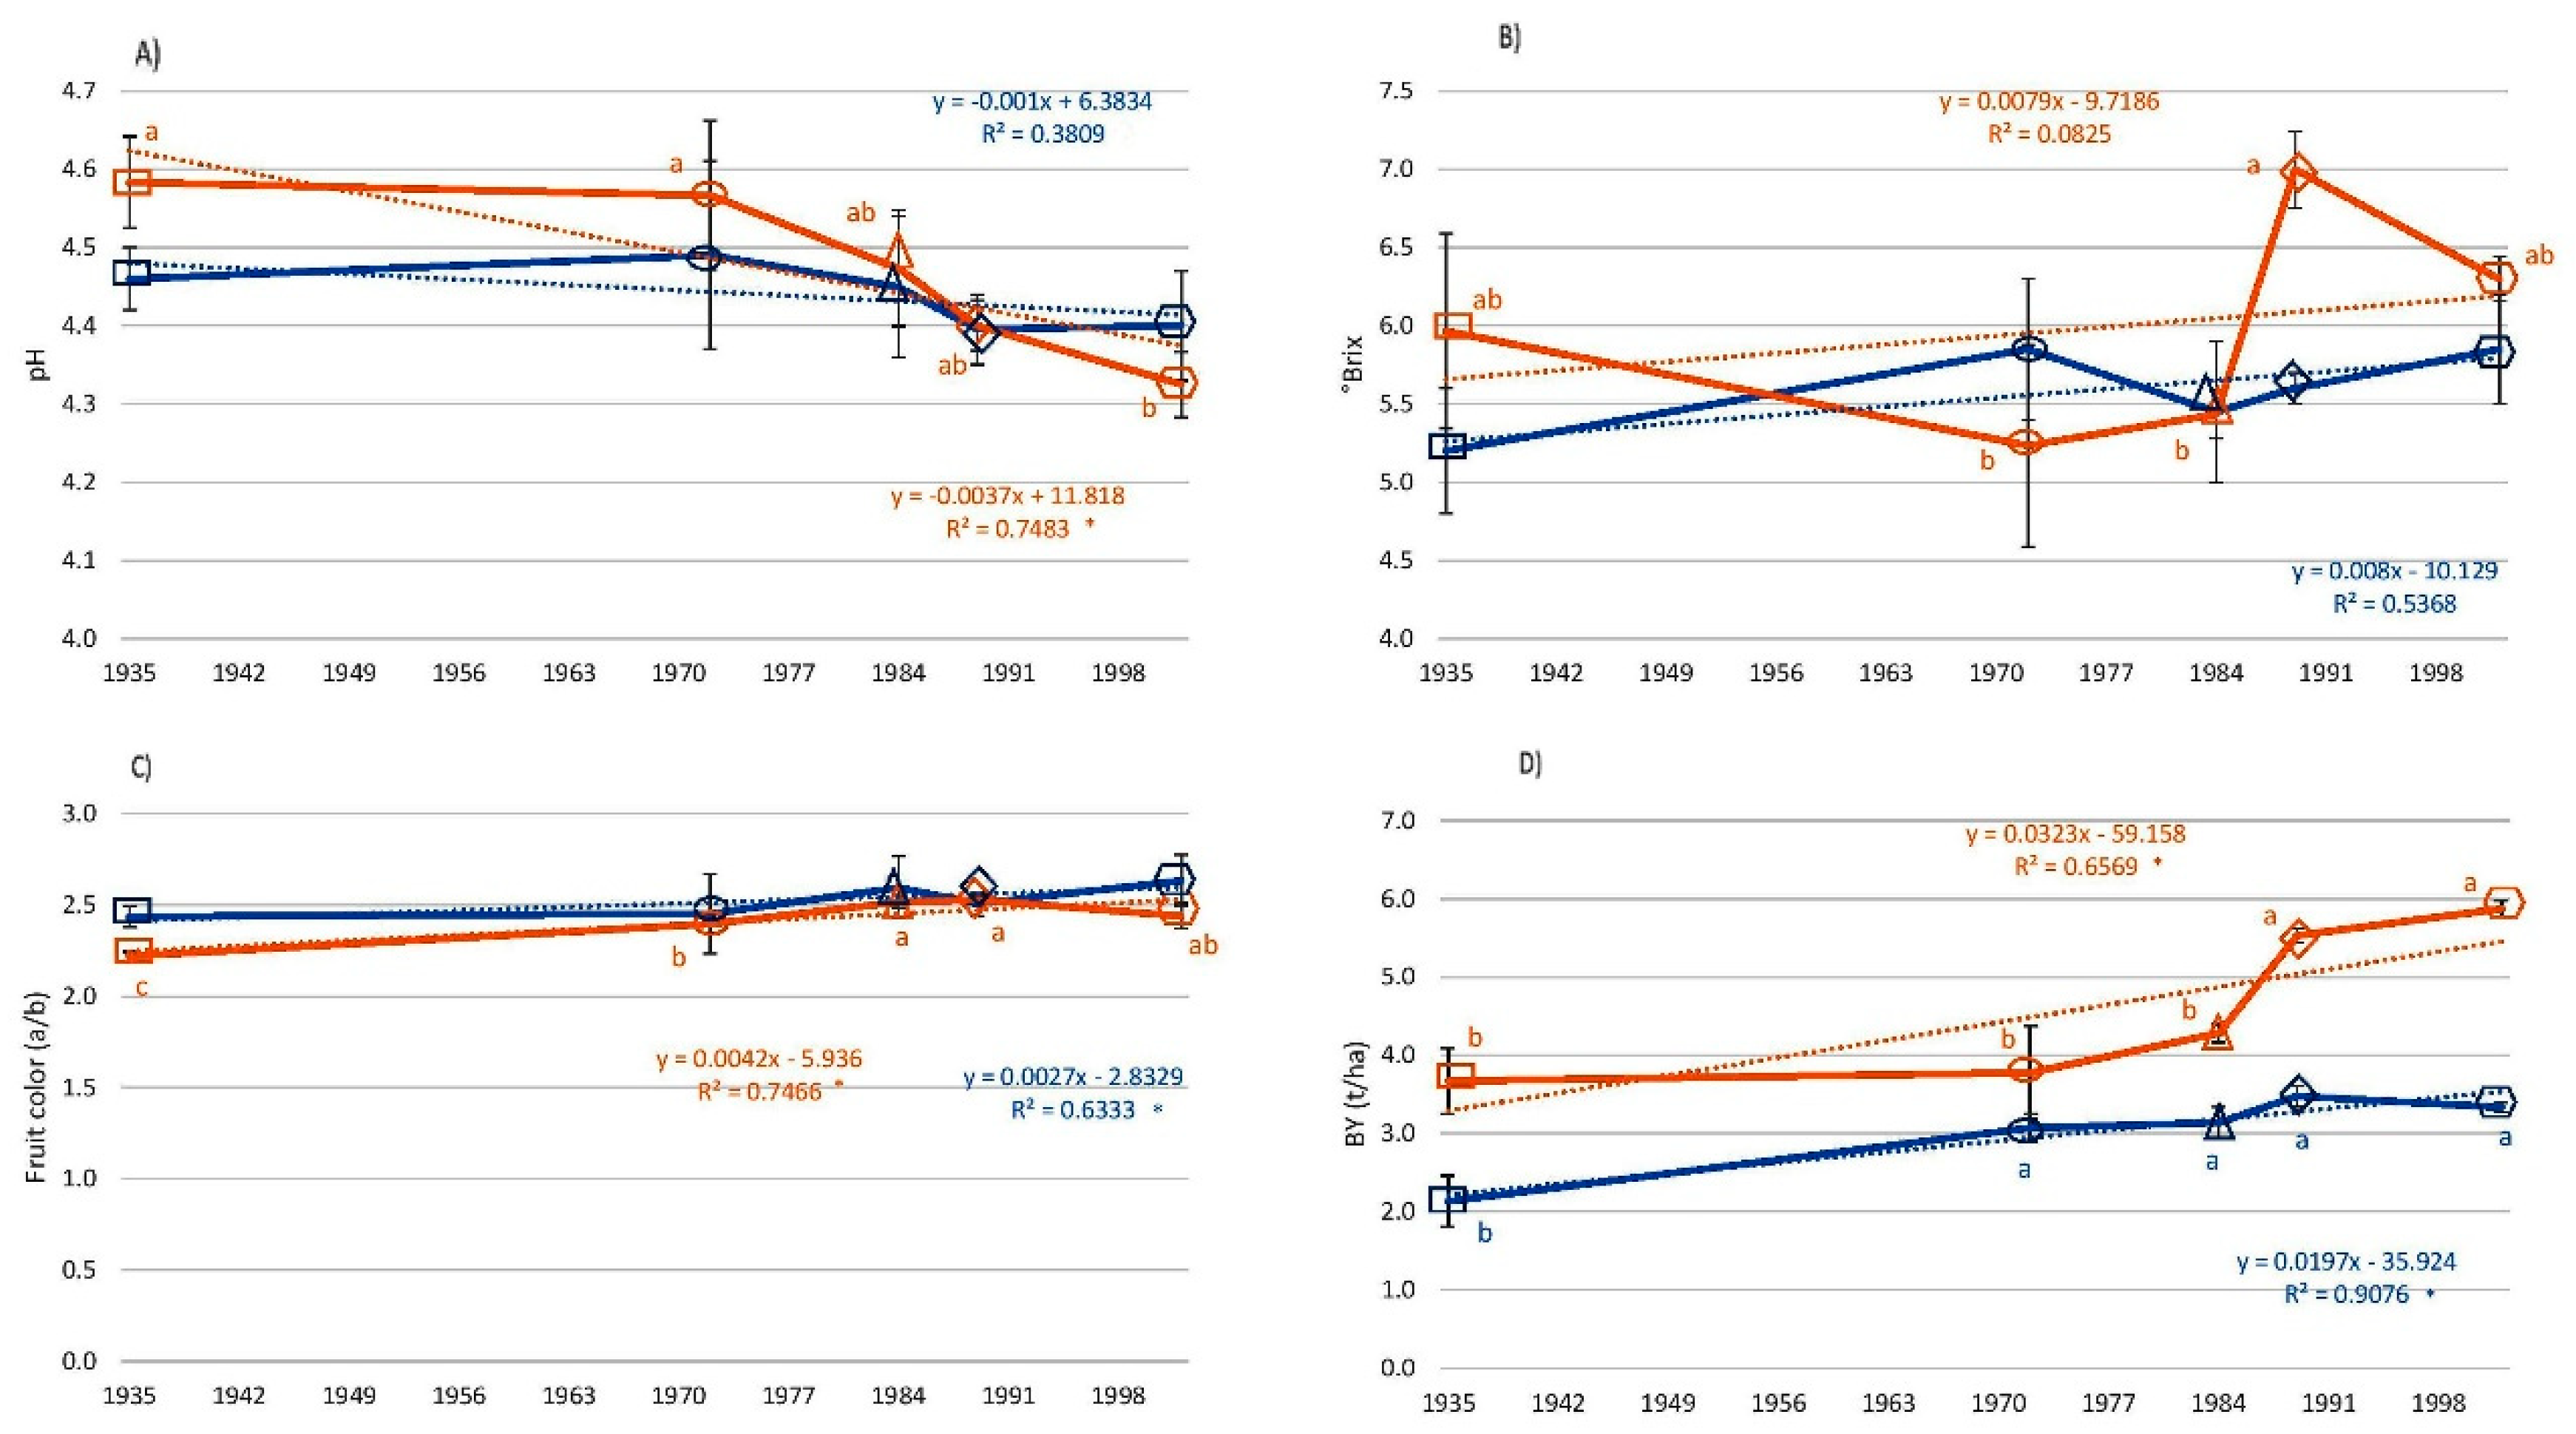
3.4. Fruit Quality Traits
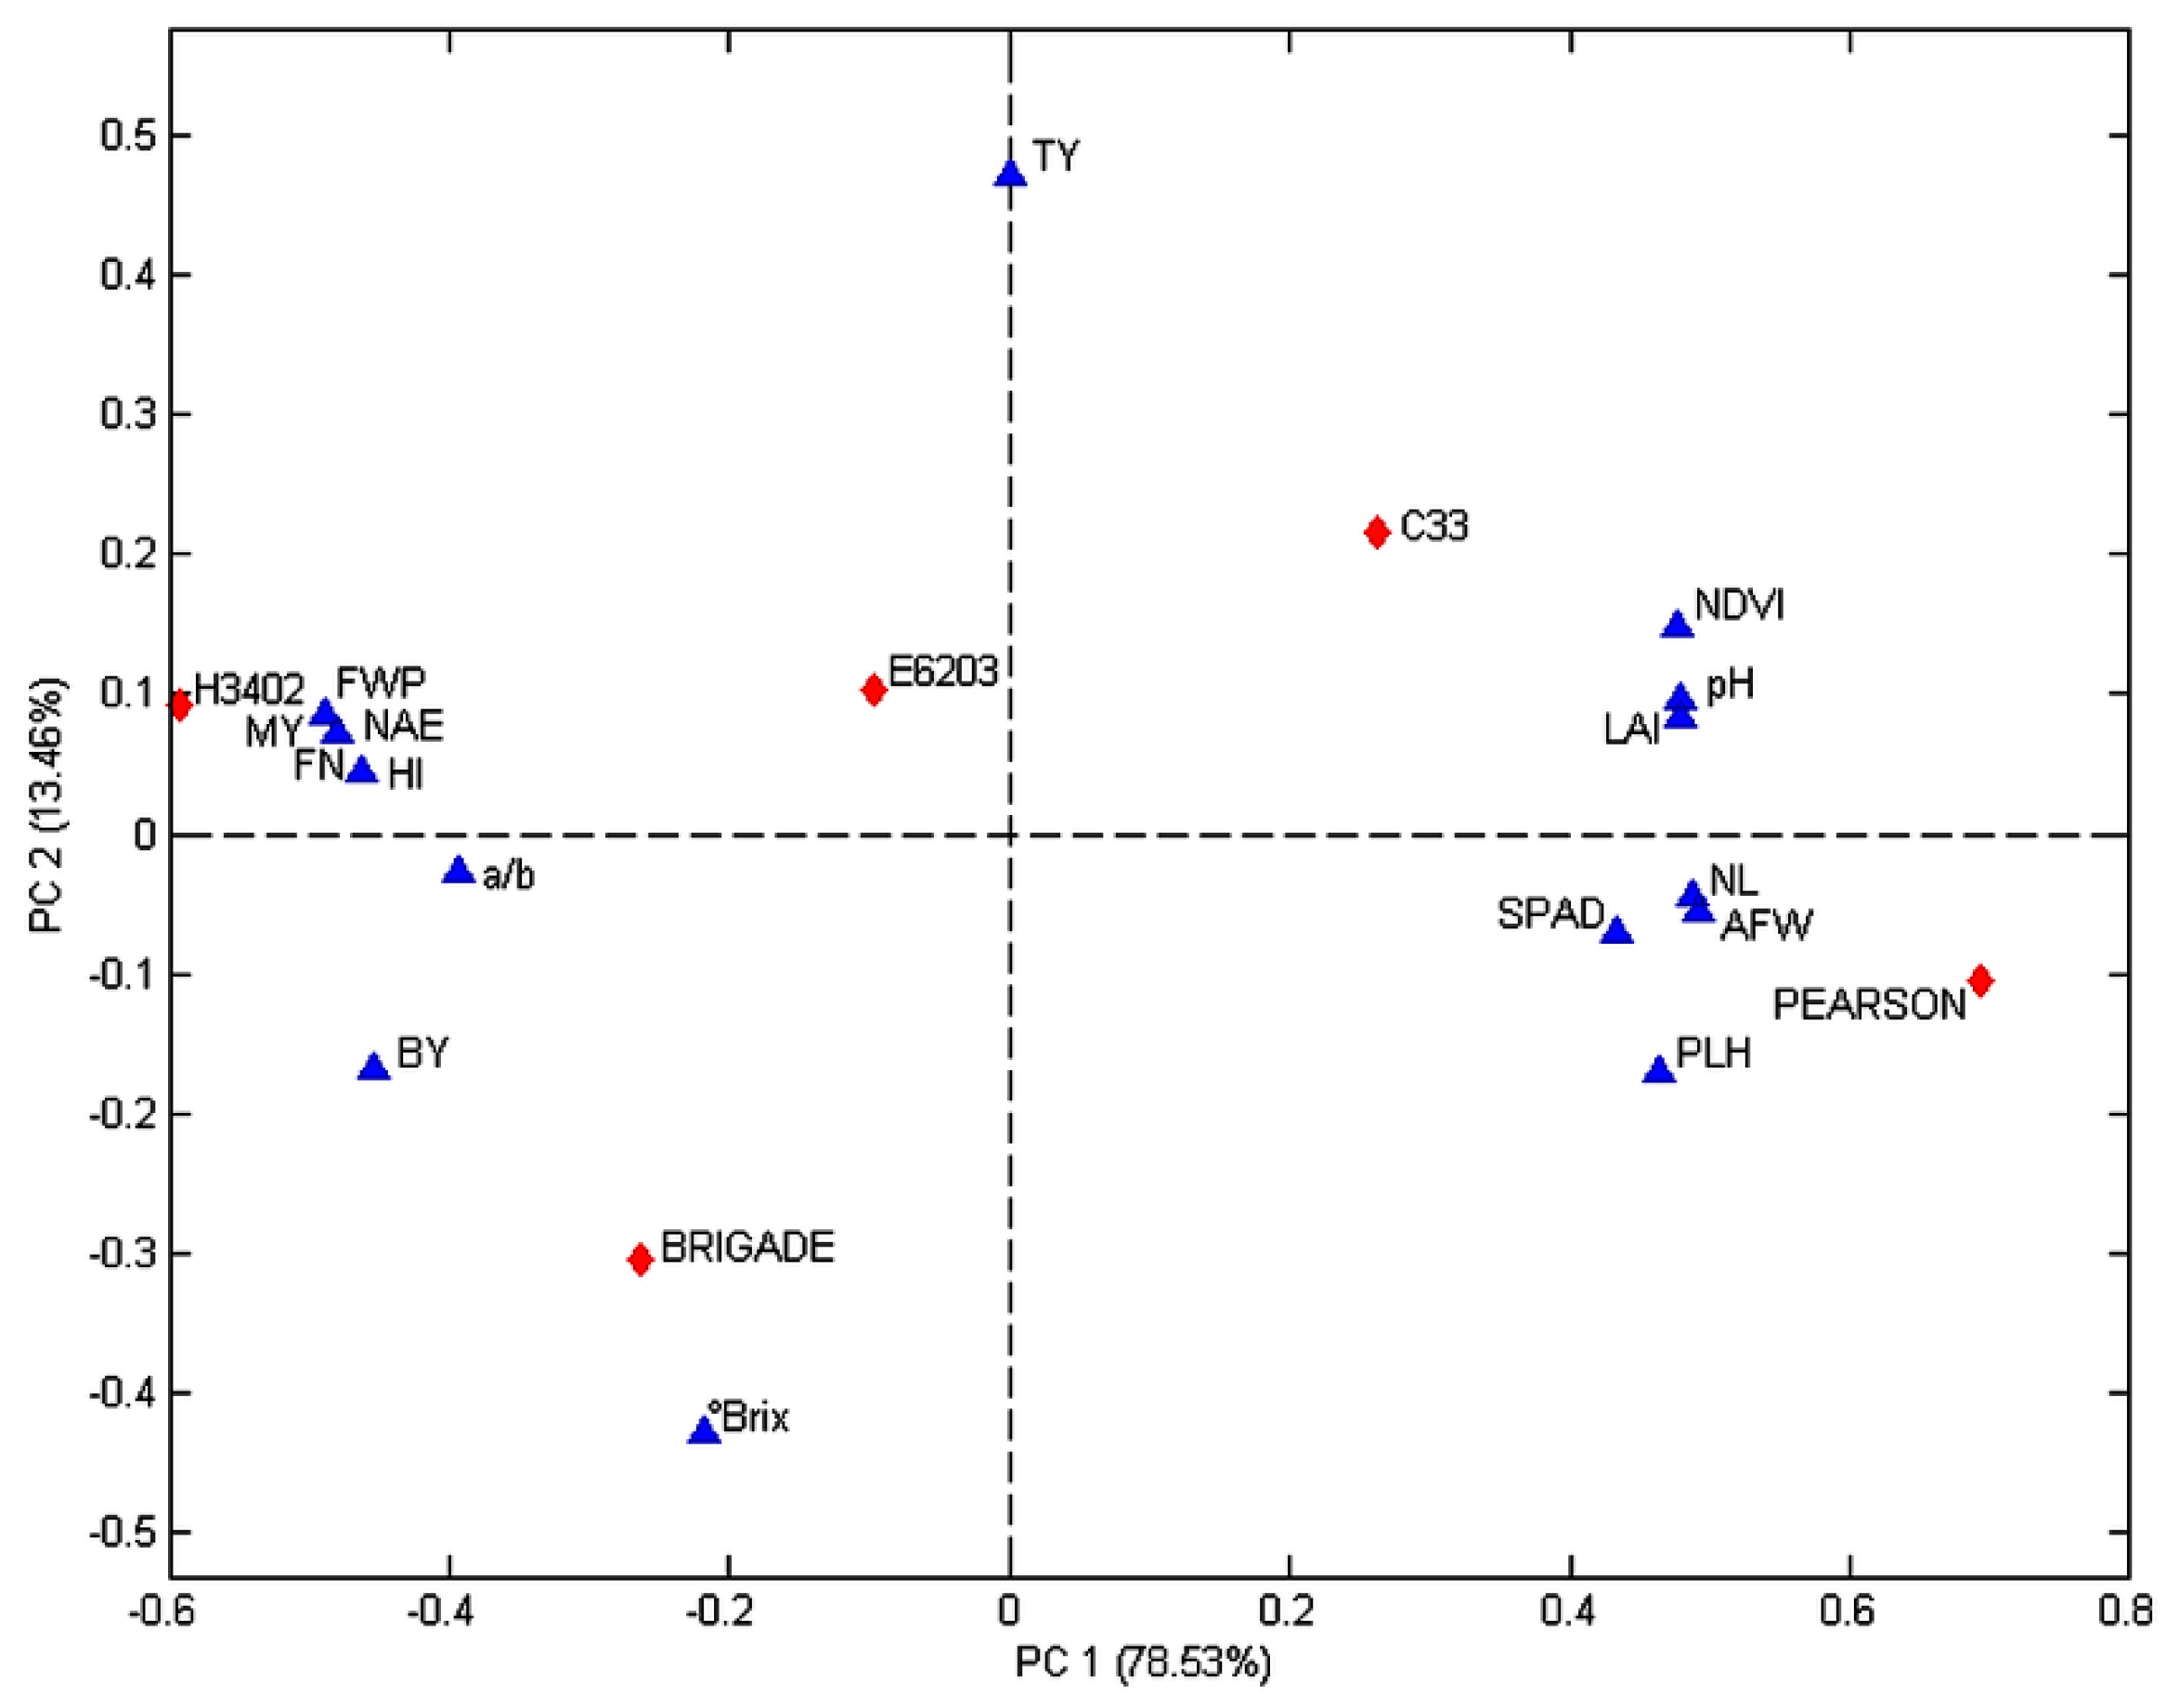
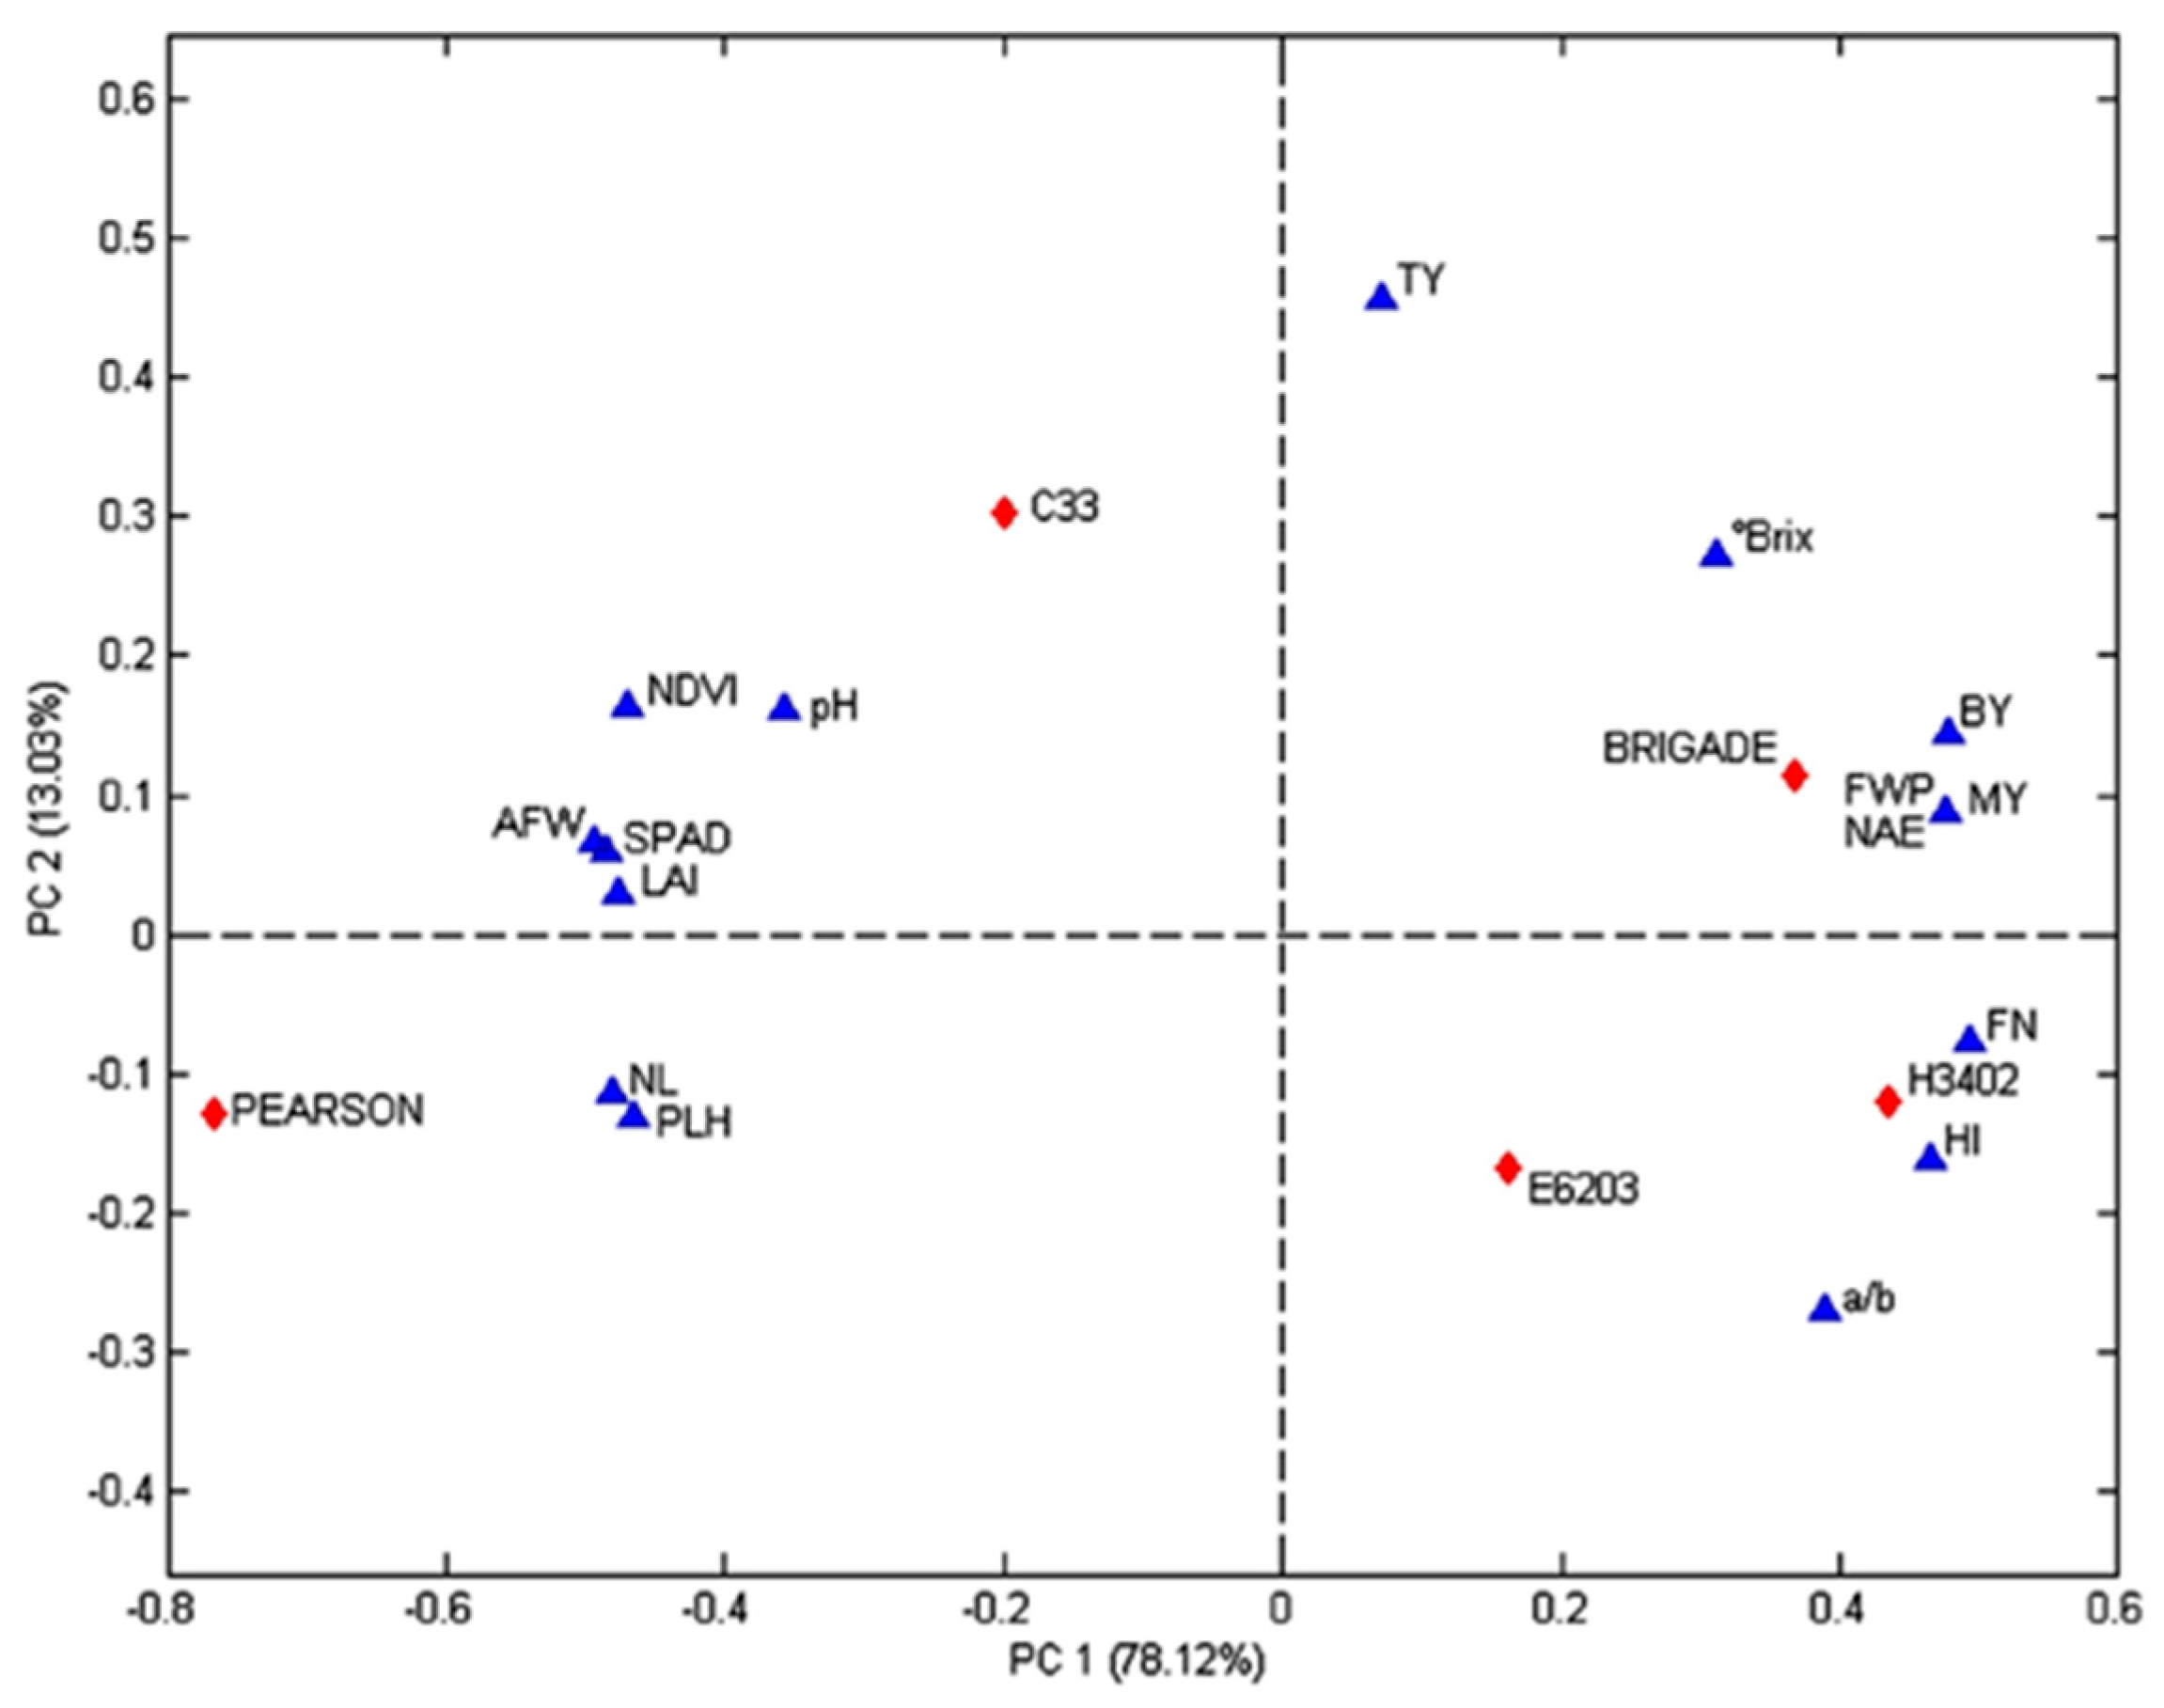
3.5. Principal Component Analysis
4. Discussion
5. Conclusions
Author Contributions
Funding
Data Availability Statement
Acknowledgments
Conflicts of Interest
References
- World Processing Tomato Council (WPTC). 2019. Available online: https://www.wptc.to (accessed on 8 December 2019).
- Cavigelli, M.A.; Teasdale, J.R.; Conklin, A.E. Long-term agronomic performance of organic and conventional field crops in the mid-Atlantic region. Agrobiol. J. 2018, 100, 785–794. [Google Scholar] [CrossRef]
- Ronga, D.; Zaccardelli, M.; Lovelli, S.; Perrone, D.; Francia, E.; Milc, J.; Ulrici, A.; Pecchioni, N. Biomass production and dry matter partitioning of processing tomato under organic vs conventional cropping systems in a Mediterranean environment. Sci. Hortic. 2017, 224, 163–170. [Google Scholar] [CrossRef]
- Graziani, F.; Onofri, A.; Pannacci, E.; Tei, F.; Guiducci, M. Size and composition of weed seedbank in long-term organic and conventional low-input cropping systems. Eur. J. Agron. 2012, 39, 52–61. [Google Scholar] [CrossRef]
- Ronga, D.; Lovelli, S.; Zaccardelli, M.; Perrone, D.; Ulrici, A.; Francia, E.; Milc, J.; Pecchioni, N. Physiological responses of processing tomato in organic and conventional Mediterranean cropping systems. Sci. Hortic. 2015, 190, 161–172. [Google Scholar] [CrossRef]
- La Torre, A.; Caradonia, F.; Matere, A.; Battaglia, V. Using plant essential oils to control Fusarium wilt in tomato plants. Eur. J. Plant Pathol. 2016, 144, 487–496. [Google Scholar] [CrossRef]
- Ronga, D.; Caradonia, F.; Setti, L.; Hagassou, D.; Giaretta Azevedo, C.V.; Milc, J.; Pedrazzi, S.; Allesina, G.; Arru, L.; Francia, E. Effects of innovative biofertilizers on yield of processing tomato cultivated in organic cropping systems in northern Italy. Acta Hortic. 2019, 1233, 129–136. [Google Scholar] [CrossRef]
- Ronga, D.; Caradonia, F.; Parisi, M.; Bezzi, G.; Parisi, B.; Allesina, G.; Pedrazzi, S.; Francia, E. Digestate biofertilizers and biochar to improve processing tomato production sustainability. Agronomy 2020, 10, 138. [Google Scholar] [CrossRef]
- Campigli, E.; Mancinelli, R.; Radicetti, E.; Caporali, F. Effect of cover crops and mulches on weed control and nitrogen fertilization in tomato (Lycopersicon esculentum Mill.). Crop Prot. 2010, 29, 354–363. [Google Scholar] [CrossRef]
- Martín-Closas, L.; Bach, M.A.; Pelacho, A.M. biodegradable mulching in an organic tomato production system. Acta Hortic. 2008, 767, 267–274. [Google Scholar] [CrossRef]
- Moreno, M.M.; Villena, J.; González-Mora, S.; Moreno, C. Response of healthy local tomato (Solanum lycopersicum L.) populations to grafting in organic farming. Sci. Rep. 2019, 9, 4592. [Google Scholar] [CrossRef]
- Caradonia, F.; Ronga, D.; Flore, A.; Barbieri, R.; Moulin, L.; Terzi, V.; Francia, E. Biostimulants and cherry rootstock increased tomato fruit yield and quality in sustainable farming systems. Ital. J. Agron. 2020, 15, 121–131. [Google Scholar] [CrossRef]
- Le Campion, A.; Oury, F.X.; Heumez, E.; Rolland, B. Conventional versus organic farming systems: Dissecting comparisons to improve cereal organic breeding strategies. Org. Agric. 2020, 10, 63–74. [Google Scholar] [CrossRef]
- Anastasi, U.; Corinzia, S.A.; Cosentino, S.L.; Scordia, D. Performances of Durum Wheat Varieties under Conventional and No-Chemical Input Management Systems in a Semiarid Mediterranean Environment. Agronomy 2019, 9, 788. [Google Scholar] [CrossRef]
- Lammerts van Bueren, E.T.; Jones, S.S.; Tamm, L.; Murphy, K.M.; Myers, J.R.; Leifert, C.; Messmer, M.M. The need to breed crop varieties suitable for organic farming, using wheat, tomato and broccoli as examples: A review. NJAS—Wagening. J. Life Sci. 2011, 58, 193–205. [Google Scholar] [CrossRef]
- Gonzalez-Cebrino, M.; Lozano, M.; Ayuso, M.C.; Bernalte, M.J.; Vidal-Aragon, M.C.; Gonzalez-Gomez, D. Characterization of traditional tomato varieties grown in organic conditions. Span. J. Agric. Res. 2011, 9, 444–452. [Google Scholar] [CrossRef]
- Ronga, D.; Francia, E.; Rizza, F.; Badeck, F.W.; Caradonia, F.; Montevecchi, G.; Pecchioni, N. Changes in yield components, morphological, physiological and fruit quality traits in processing tomato cultivated in Italy since the 1930’s. Sci. Hortic. 2019, 257, 108726. [Google Scholar] [CrossRef]
- Ronga, D.; Rizza, F.; Badeck, F.W.; Milc, J.; Laviano, L.; Montevecchi, G.; Pecchioni, N.; Francia, E. Physiological responses to chilling in cultivars of processing tomato released and cultivated over the past decades in Southern Europe. Sci. Horti. 2018, 231, 118–125. [Google Scholar] [CrossRef]
- USDA NRCS. Keys to Soil Taxonomy, National Cooperative Soil Survey, 10th ed.; USDA NRCS: Madison, WI, USA, 2006. [Google Scholar]
- Allen, R.G.; Pereira, L.S.; Raes, D.; Smith, M. Crop Evapotranspiration. Guidelines for Computing Crop Water Requirements FAO Irrigation and Drainage; Paper No. 56; FAO: Rome, Italy, 1998. [Google Scholar]
- Doorenbos, J.; Pruitt, W.O. Crop water requirement. In FAO Irrigation and Drainage; Paper No. 24 (rev.); FAO: Rome, Italy, 1977. [Google Scholar]
- Meier, U. Growth Stages of Mono- and Dicotyledonous Plants, 2nd ed.; BBCH Monography; Blackwell Wissenschaht-Verlag: Berlin, Germany, 2001. [Google Scholar]
- Cabello, M.J.; Castellanos, M.T.; Romojaro, F.; Martinez-Madrid, C.; Ribas, F. Yield and quality of melon grown under different irrigation and nitrogen rates. Agric. Water Manag. 2009, 96, 866–874. [Google Scholar] [CrossRef]
- Padilla-Díaz, C.M.; Rodriguez-Dominguez, C.M.; Hernandez-Santana, V.; Perez-Martin, A.; Fernandes, R.D.M.; Montero, A.; García, J.M.; Fernández, J.E. Water status, gas exchange and crop performance in a super high density olive orchard under deficit irrigation scheduled from leaf turgor measurements. Agric. Water Manag. 2018, 202, 241–252. [Google Scholar] [CrossRef]
- FAOSTAT. 2020. Available online: http://www.fao.org/faostat/en/#data/QC (accessed on 4 March 2020).
- Raun, W.R.; Solie, J.B.; Stone, M.L. Independence of yield potential and crop nitrogen response. Precis. Agric. 2010, 12, 508–518. [Google Scholar] [CrossRef]
- Tandzi, N.L.; Mutengwa, S.C. Factors Affecting Yield of Crops, Agronomy—Climate Change & Food Security, Amanullah, IntechOpen. 2020. Available online: https://www.intechopen.com/books/agronomy-climate-change-food-security/factors-affecting-yield-of-crops (accessed on 28 December 2020).
- Barrios-Masias, F.H.; Jackson, L.E. California processing tomatoes: Morphological, physiological and phenological traits associated with crop improvement during the last 80 years. Eur. J. Agron. 2014, 53, 45–55. [Google Scholar] [CrossRef]
- Sinclair, T.R.; Purcell, L.C. Is a physiological perspective relevant in a ‘geno-centric’ age? J. Exp. Bot. 2005, 56, 2777–2782. [Google Scholar] [CrossRef]
- Padilla, F.M.; Peña-Fleitas, M.T.; Gallardo, M.; Thompson, R.B. Threshold values of canopy reflectance indices and chlorophyll meter readings for optimal nitrogen nutrition of tomato. Ann. Appl. Biol. 2015, 166, 271–285. [Google Scholar] [CrossRef]
- Fortes, R.; Prieto, M.H.; Terrón, J.M.; Blanco, J.; Millán, S.; Campillo, C. Using apparent electric conductivity and NDVI measurements for yield estimation of processing tomato crop. Trans. ASABE 2014, 57, 827–835. [Google Scholar]
- Güler, S.; Büyük, G. Relationships among chlorophyll-meter reading value, leaf n and yield of cucumber and tomatoes. Acta Hortic. 2007, 729, 307–311. [Google Scholar] [CrossRef]
- Griffing, B. Use of a controlled-nutrient experiment to test heterosis hypotheses. Genetics 1990, 126, 753–767. [Google Scholar] [CrossRef] [PubMed]
- Grandillo, S.; Zamir, D.; Tanksley, S.D. Genetic improvement of processing tomatoes: A 20 years perspective. Euphytica 1999, 110, 85–97. [Google Scholar] [CrossRef]
- Liabeuf, D.; Francis, D.M. The use of historical datasets to develop multi-trait selection models in processing tomato. Euphytica 2017, 213, 100. [Google Scholar] [CrossRef]


| Genotype | Year of Release | Growth Habit | Fruit Characteristics |
|---|---|---|---|
| PEARSON | mid-1930s | Self-topping, semi-determinate, with dense foliage | globular and large fruits |
| C33 | early-1970s | short bush, determinate | globular and large fruits |
| E6203 | 1984 | determinate, with abundant flowering | medium blocky fruit |
| BRIGADE | 1989 | determinate, rustic | highly productive, with medium blocky fruit |
| H3402 | 2002 | determinate, rustic, bushy with high plant vigor | high fruit production, with medium oval fruit |
| Soil Characteristics | OFS | CFS |
|---|---|---|
| Sand (%) | 11.2 | 9.9 |
| Silt (%) | 67.5 | 57.4 |
| Clay (%) | 21.3 | 32.7 |
| pH | 7.8 | 8.1 |
| EC (dS m−1) | 0.2 | 0.1 |
| Exchangeable K2O (mg kg−1) (ammonium acetate method) | 179.9 | 285.4 |
| P2O5 (mg kg−1) (Olsen method) | 55.0 | 51.2 |
| TN (‰) (Kjeldahl method) | 1.3 | 1.5 |
| Organic matter (%) | 1.8 | 1.2 |
| CEC (meq 100 g−1) | 17.9 | 21.4 |
Publisher’s Note: MDPI stays neutral with regard to jurisdictional claims in published maps and institutional affiliations. |
© 2021 by the authors. Licensee MDPI, Basel, Switzerland. This article is an open access article distributed under the terms and conditions of the Creative Commons Attribution (CC BY) license (http://creativecommons.org/licenses/by/4.0/).
Share and Cite
Ronga, D.; Caradonia, F.; Vitti, A.; Francia, E. Agronomic Comparisons of Heirloom and Modern Processing Tomato Genotypes Cultivated in Organic and Conventional Farming Systems. Agronomy 2021, 11, 349. https://doi.org/10.3390/agronomy11020349
Ronga D, Caradonia F, Vitti A, Francia E. Agronomic Comparisons of Heirloom and Modern Processing Tomato Genotypes Cultivated in Organic and Conventional Farming Systems. Agronomy. 2021; 11(2):349. https://doi.org/10.3390/agronomy11020349
Chicago/Turabian StyleRonga, Domenico, Federica Caradonia, Antonella Vitti, and Enrico Francia. 2021. "Agronomic Comparisons of Heirloom and Modern Processing Tomato Genotypes Cultivated in Organic and Conventional Farming Systems" Agronomy 11, no. 2: 349. https://doi.org/10.3390/agronomy11020349
APA StyleRonga, D., Caradonia, F., Vitti, A., & Francia, E. (2021). Agronomic Comparisons of Heirloom and Modern Processing Tomato Genotypes Cultivated in Organic and Conventional Farming Systems. Agronomy, 11(2), 349. https://doi.org/10.3390/agronomy11020349