
Nitrogen Partitioning in Young “Julyprince” Peach Trees Grown with Different Irrigation and Fertilization Practices in the Southeastern United States


Abstract
1. Introduction
2. Materials and Methods
2.1. Plant Material and Field Characteristics
2.2. Experimental Design and Treatments
2.3. Process to Collect Samples and Analyze the N Content of Plant Tissues
2.3.1. Winter Pruning
2.3.2. Fruit Thinning
2.3.3. Summer Pruning
2.3.4. Harvested Fruit
2.3.5. Defoliation
2.4. Physiological Measurements
2.5. Statistical Analysis
3. Results
3.1. Fertilizer Levels
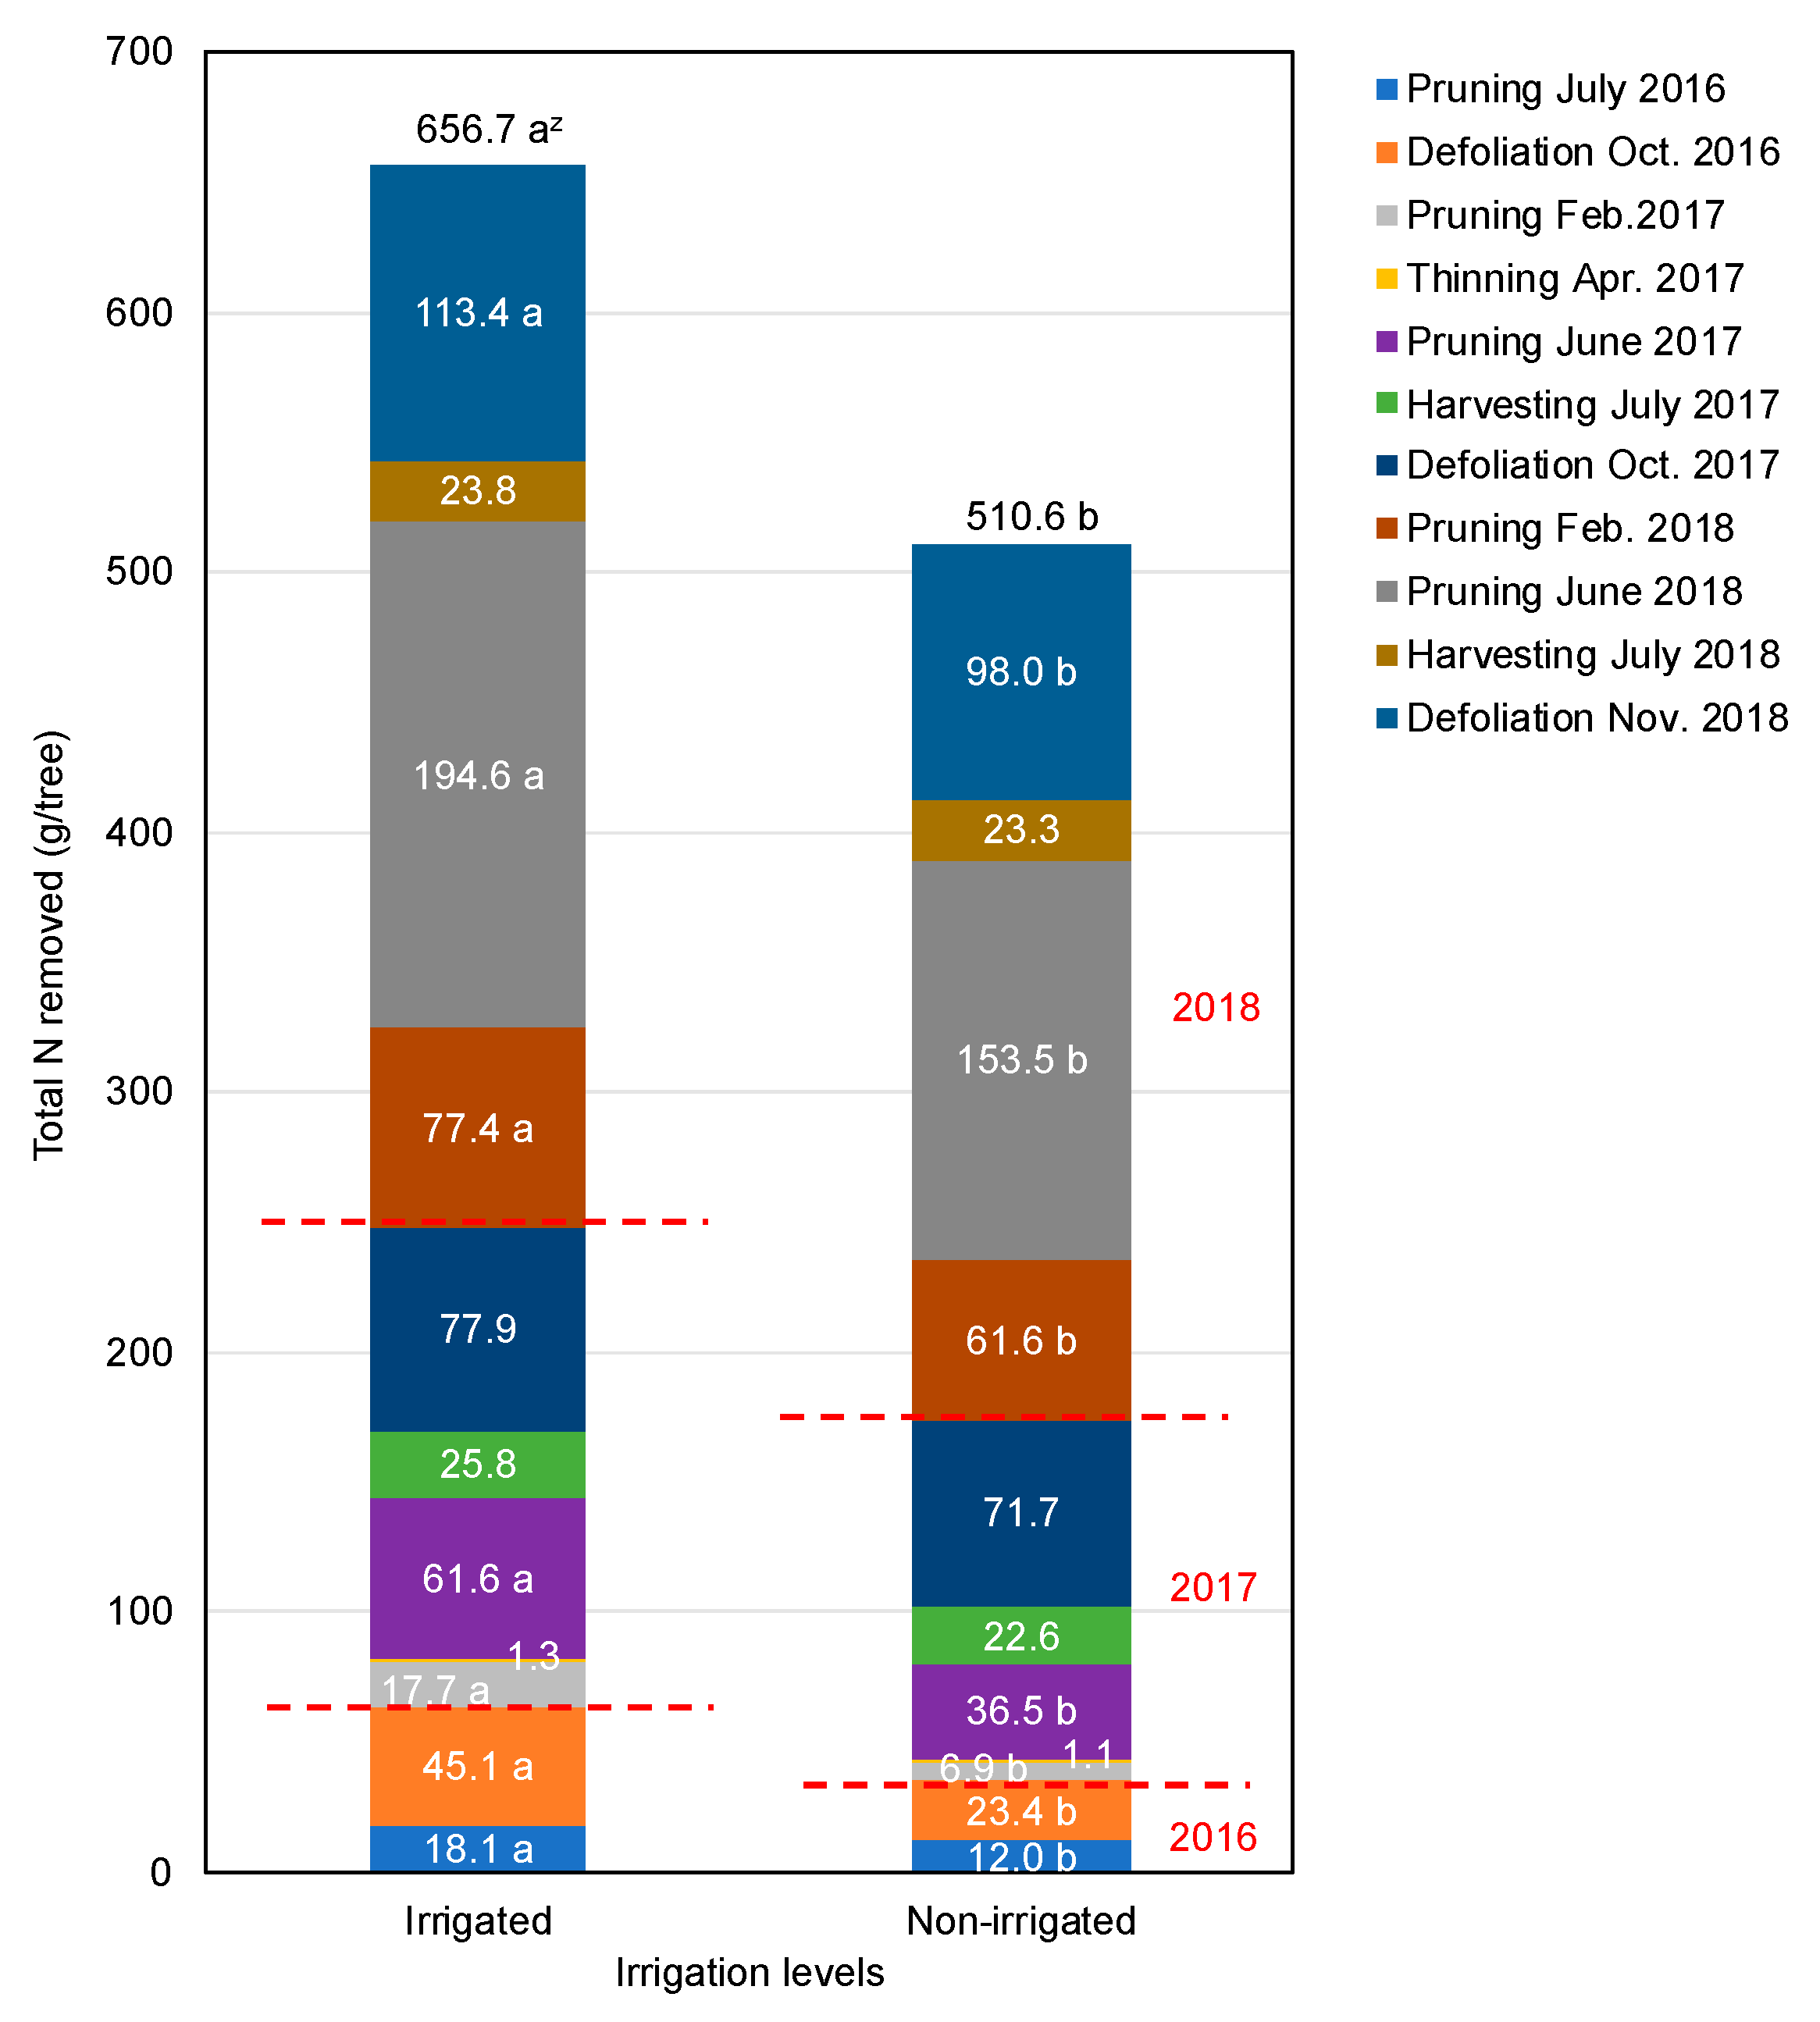
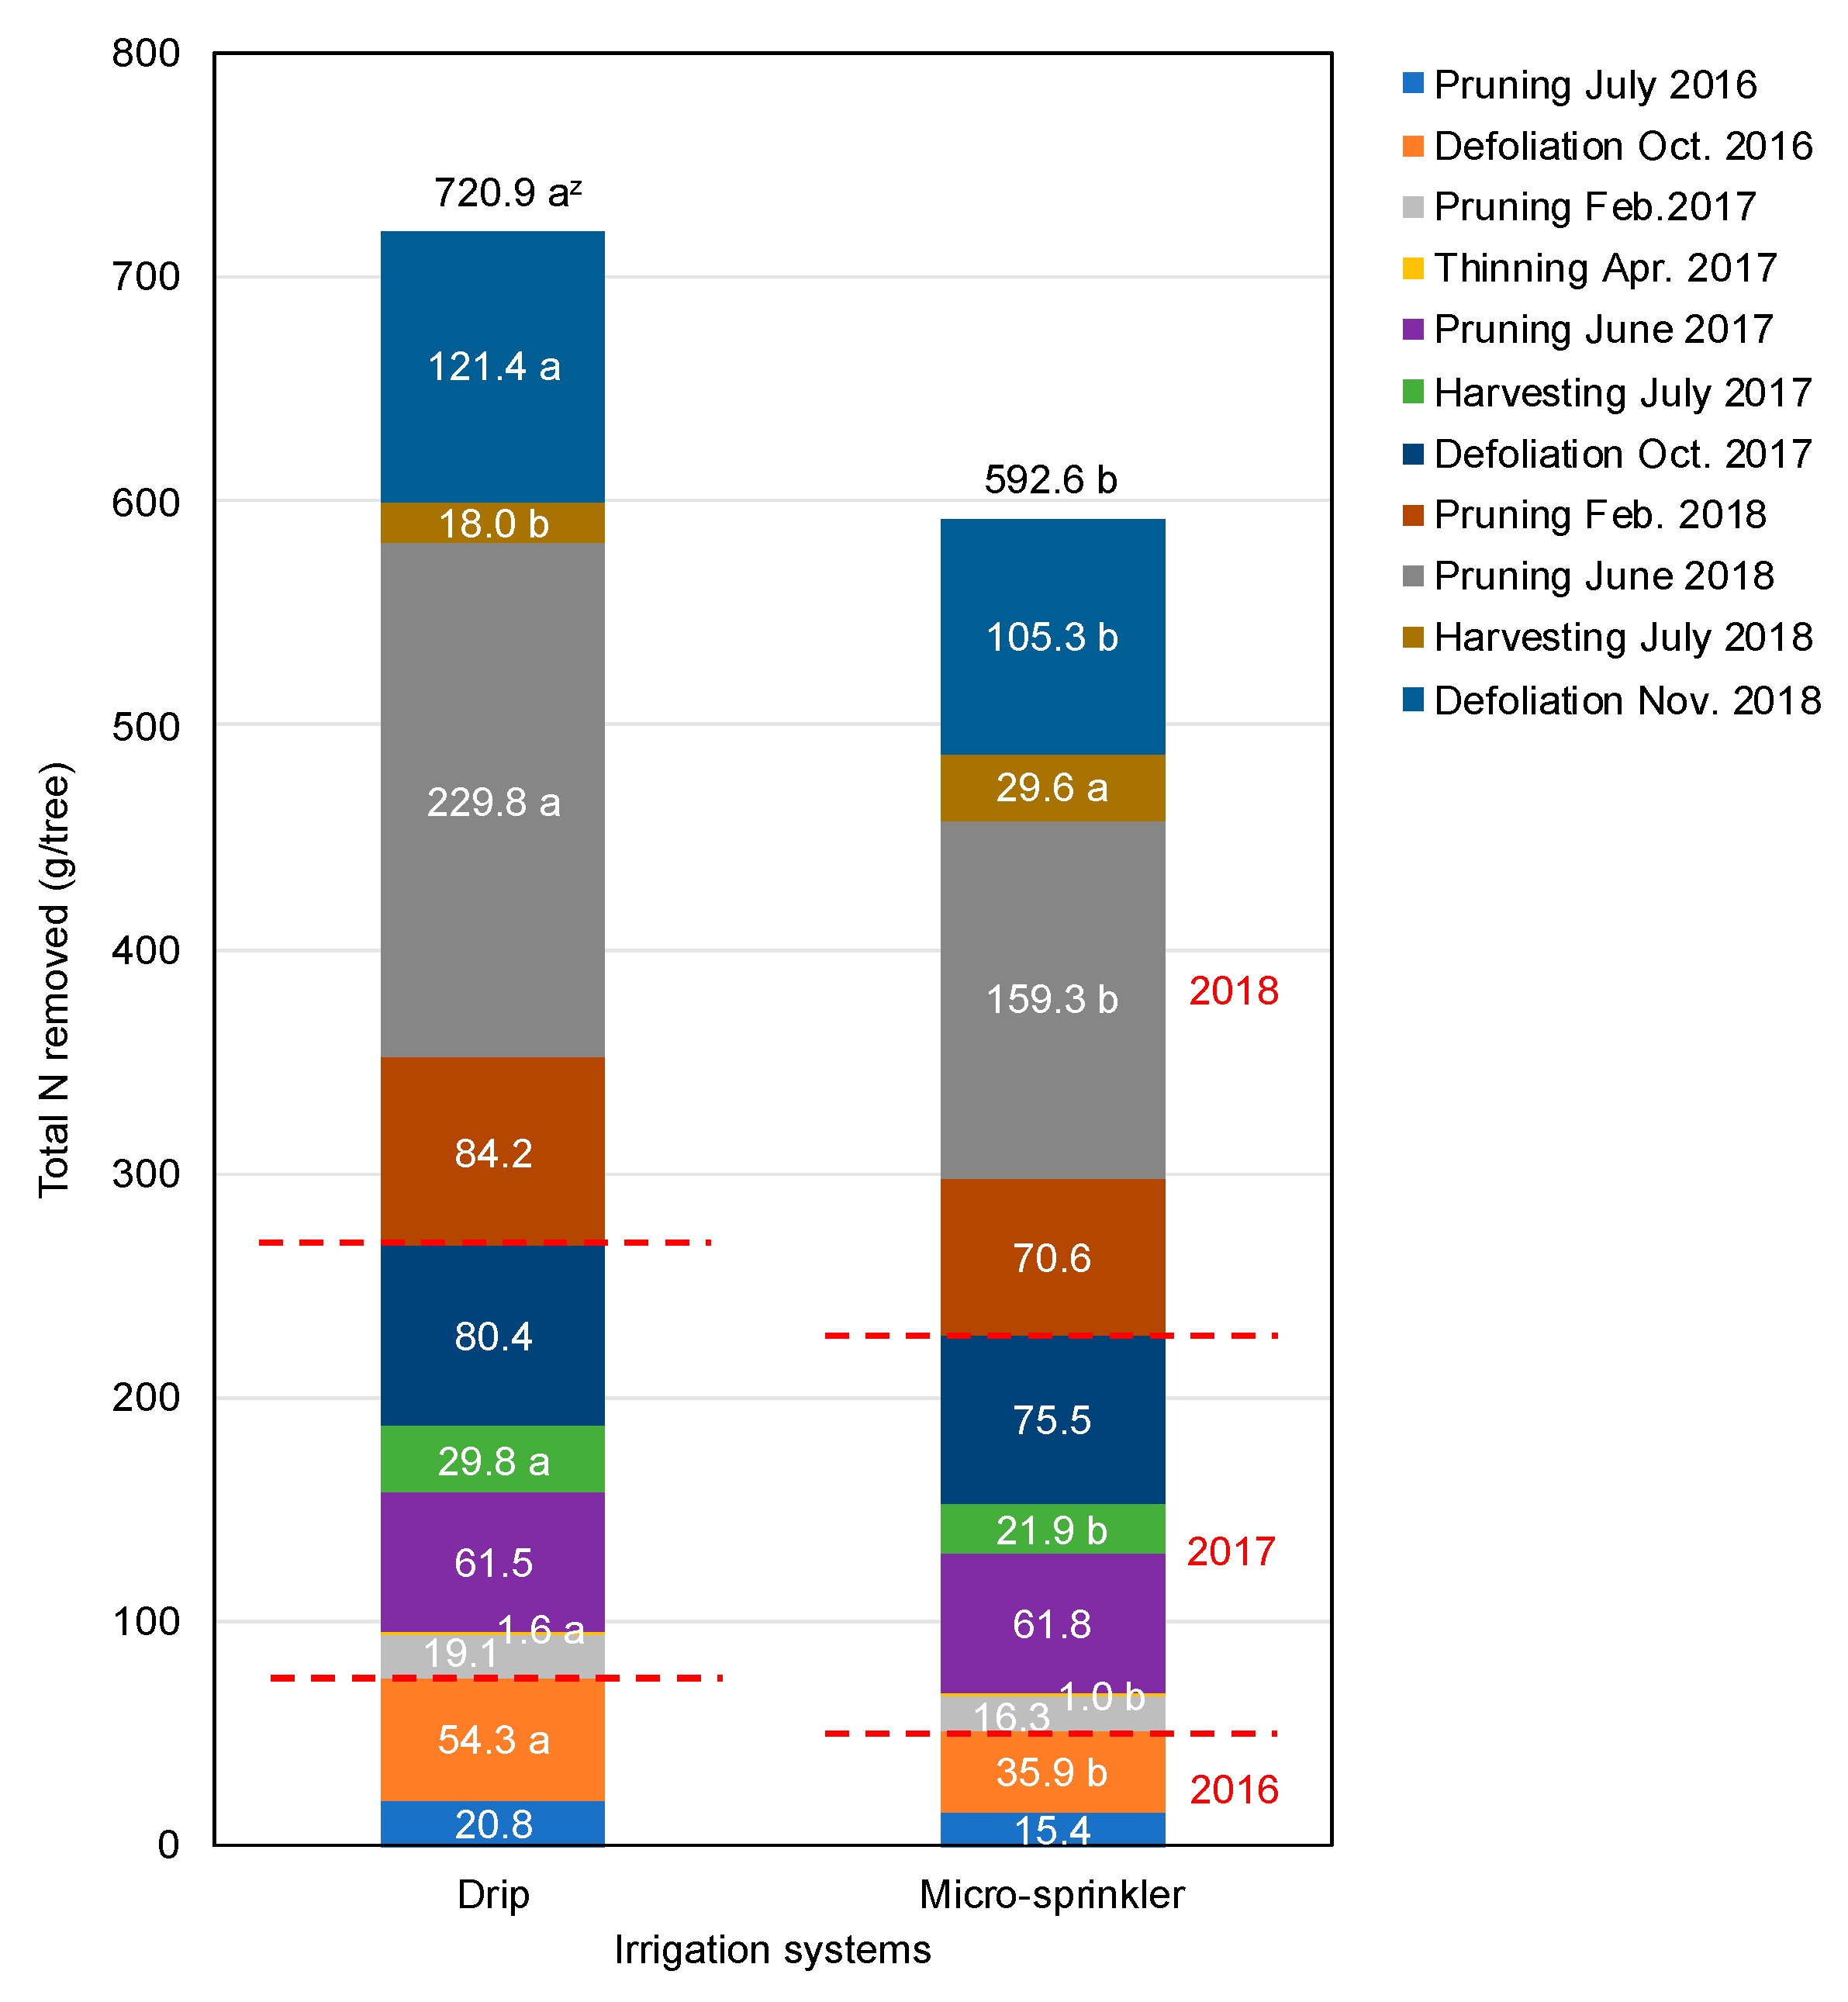
3.2. Irrigation Levels and Systems
4. Discussion
4.1. Fertilizer Levels
4.2. Irrigation Levels and Systems
5. Conclusions
Author Contributions
Funding
Institutional Review Board Statement
Informed Consent Statement
Data Availability Statement
Acknowledgments
Conflicts of Interest
References
- United States Drought Monitor. Available online: https://droughtmonitor.unl.edu/Data/Timeseries.aspx (accessed on 11 June 2019).
- Casamali, B. Irrigation and fertilization practices for young peach trees in the southeastern United States. Ph.D. Thesis, University of Georgia, Athens, GA, USA, 13 December 2019. [Google Scholar]
- Abrisqueta, J.M.; Mounzer, O.; Álvarez, S.; Conejero, W.; García-Orellana, Y.; Tapia, L.M.; Vera, J.; Abrisqueta, I.; Ruiz-Sánchez, M.C. Root dynamics of peach trees submitted to partial rootzone drying and continuous deficit irrigation. Agric. Water Manag. 2008, 95, 959–967. [Google Scholar] [CrossRef]
- Cockroft, B.; Olsson, K.A. Pattern of new root production in peach trees under irrigation. Austral. J. Agr. Res. 1972, 23, 1021–1025. [Google Scholar] [CrossRef]
- Williamson, J.G.; Coston, D.C. Planting method and irrigation rate influence vegetative and reproductive growth of peach planted at high density. J. Am. Soc. Hortic. Sci. 1990, 115, 207–212. [Google Scholar] [CrossRef]
- Albornoz, F. Crop responses to nitrogen overfertilization: A review. Sci. Hortic. 2016, 205, 79–83. [Google Scholar] [CrossRef]
- Horton, D.; Brannen, P.; Bellinger, B.; Lockwood, D.; Ritchie, D. 2015 Southeastern Peach, Nectarine and Plum Pest Management and Culture Guide, Bul. 1171; UGA Cooperative Extension: Athens, GA, USA, 2015; pp. 1–71. [Google Scholar]
- Gammon, N., Jr.; Shoemaker, J.S. Effect of fertilizers on mineral levels in the leaves of Flordawon peach. Florida State Hortic. Soc. 1963, 1746, 380–384. [Google Scholar]
- Smith, C.B.; Taylor, G.A. Tentative optimum leaf concentration of several elements for Elberta peach and Stayman apple in Pennsylvania orchards. Proc. Am. Soc. Hortic. Sci. 1952, 60, 33–41. [Google Scholar]
- Rufat, J.; DeJong, T.M. Estimating seasonal nitrogen dynamics in peach trees in response to nitrogen availability. Tree Physiol. 2001, 21, 1133–1140. [Google Scholar] [CrossRef] [PubMed]
- Baldi, E.; Toselli, M.; Marangoni, B. Nutrient partitioning in potted peach (Prunus persica L.) trees supplied with mineral and organic fertilizers. J. Plant Nutr. 2010, 33, 2050–2061. [Google Scholar] [CrossRef]
- Dichio, B.; Xiloyannis, C.; Sofo, A.; Montanaro, G. Effects of post-harvest regulated deficit irrigation on carbohydrate and nitrogen partitioning, yield quality and vegetative growth of peach trees. Plant Soil 2007, 290, 127–137. [Google Scholar] [CrossRef]
- Zhou, Q.; Melgar, J.C. Ripening season affects tissue mineral concentration and nutrient partitioning in peach trees. J. Plant Nutr. Soil Sci. 2019, 182, 203–209. [Google Scholar] [CrossRef]
- Policarpo, M.; Di Marco, L.; Gioacchini, P.; Tagliavini, M. Nitrogen use efficiency and N partitioning in early and late fruit ripening peach varieties. Acta Hortic. 2002, 592, 543–547. [Google Scholar] [CrossRef]
- Tagliavini, M.; Scudellazi, D.; Marangoni, B.; Toselli, M. Nitrogen fertilization management in orchards to reconcile productivity and environmental aspects. In Fertilizer and Environment. Developments in Plant and Soil Sciences; Rodriguez-Barrueco, C., Ed.; Springer: Dordrecht, The Netherlands, 1996; pp. 161–170. [Google Scholar]
- Steinberg, S.L.; Miller, J.C.; McFarland, M.J. Dry matter partitioning and vegetative growth of young peach trees under water stress. Aust. J. Plant Physiol. 1990, 17, 23–36. [Google Scholar] [CrossRef]
- Boland, A.M.; Jerie, P.H.; Mitchell, P.D.; Goodwin, I.; Connor, D.J. Long-term Effects of restricted root volume and regulated deficit irrigation on peach: I. Growth and mineral nutrition. J. Am. Soc. Hortic. Sci. 2000, 125, 135–142. [Google Scholar] [CrossRef]


| pH | P | K | Mg | Ca | B | Zn | Mn | Fe | Cu | NO3-N | NH4-N | Cation Exchange Capacity (CEC) | Organic Matter (OM) |
|---|---|---|---|---|---|---|---|---|---|---|---|---|---|
| kg·ha−1 | cmol·kg−1 | % | |||||||||||
| 5.95 | 58.9 | 188.4 | 184.8 | 866.4 | 0.5 | 3.3 | 22.4 | 66.2 | 1.4 | 17.0 | 5.4 | 4.84 | 1.51 |
| January | February | March | April | May | June | July | August | September | October | November | December | Total | |
|---|---|---|---|---|---|---|---|---|---|---|---|---|---|
| 2016 | 110 | 125 | 66 | 174 | 67 | 77 | 66 | 69 | 159 | 1 | 69 | 159 | 754 |
| 2017 | 247 | 66 | 53 | 97 | 91 | 194 | 91 | 112 | 130 | 207 | 28 | 79 | 952 |
| 2018 | 103 | 98 | 133 | 118 | 145 | 134 | 103 | 106 | 84 | 132 | 164 | 267 | 940 |
| 1981–2010 | 112 | 104 | 146 | 113 | 96 | 96 | 150 | 131 | 91 | 83 | 99 | 99 | 947 |
| Nutrient | Fertilizer Level | Sample Depth (cm) | P Value | |||||||||||
|---|---|---|---|---|---|---|---|---|---|---|---|---|---|---|
| 25% | 50% | 100% | 200% | 0–20 | 20–40 | Fertilizer Level | Sample Depth | |||||||
| kg·ha−1 | ||||||||||||||
| April 2017 | ||||||||||||||
| NH4–N | 2.3 | 2.4 | 4.7 | 7.6 | 4.8 | 3.7 | 0.091 | 0.523 | ||||||
| NO3–N | 17.2 | b z | 22.4 | b | 30.9 | ab | 48.3 | a | 31.4 | 28.0 | <0.001 | 0.533 | ||
| P | 57.7 | c | 60.0 | bc | 85.0 | ab | 105.4 | a | 107.9 | a | 46.2 | b | <0.001 | <0.001 |
| K | 155.1 | 144.1 | 141.6 | 156.4 | 161.1 | a | 137.5 | b | 0.223 | <0.001 | ||||
| April 2018 | ||||||||||||||
| NH4–N | 15.5 | c | 43.5 | bc | 47.7 | b | 123.0 | a | 86.1 | a | 28.7 | b | <0.001 | <0.001 |
| NO3–N | 37.3 | b | 45.6 | ab | 47.7 | ab | 63.6 | a | 45.0 | 52.1 | 0.019 | 0.230 | ||
| P | 69.7 | c | 87.5 | c | 123.2 | b | 165.8 | a | 155.3 | a | 67.8 | b | <0.001 | <0.001 |
| K | 183.3 | c | 224.6 | bc | 245.2 | b | 322.6 | a | 289.4 | a | 198.5 | b | <0.001 | <0.001 |
| May 2019y | ||||||||||||||
| NH4–N | 7.3 | 6.7 | 7.9 | 8.4 | 7.6 | N/A | 0.592 | N/A | ||||||
| NO3–N | 4.4 | 2.9 | 6.7 | 2.1 | 4.0 | 0.058 | ||||||||
| P | 89.9 | c | 104.8 | bc | 138.3 | b | 194.0 | a | 131.8 | <0.001 | ||||
| K | 146.7 | 151.1 | 163.0 | 160.9 | 155.4 | 0.548 | ||||||||
| Removal Event | Dry Weight (g/tree) | P Value | |||||||
|---|---|---|---|---|---|---|---|---|---|
| 25% | 50% | 100% | 200% | ||||||
| Pruning Leaf July 2016 | 360.9 | 382.6 | 355.3 | 340.9 | 0.888 | ||||
| Pruning Stem July 2016 | 270.8 | 287.5 | 270.1 | 256.0 | 0.895 | ||||
| Defoliation October 2016 | 1080.9 | 1121.4 | 980.6 | 1413.8 | 0.181 | ||||
| Pruning February 2017 | 875.2 | 992.4 | 811.4 | 1055.0 | 0.342 | ||||
| Thinning April 2017 | 39.6 | 41.3 | 38.0 | 41.2 | 0.978 | ||||
| Pruning Leaf June 2017 | 968.6 | ab z | 854.9 | b | 1149.7 | a | 1054.6 | ab | 0.028 |
| Pruning Stem June 2017 | 798.8 | ab | 725.8 | b | 965.8 | a | 894.9 | ab | 0.026 |
| Harvesting July 2017 | 1778.3 | 1616.1 | 1642.7 | 2017.3 | 0.179 | ||||
| Defoliation October 2017 | 2070.4 | 2003.2 | 2355.0 | 2204.7 | 0.124 | ||||
| Pruning February 2018 | 3169.4 | ab | 2761.9 | b | 3901.7 | a | 3400.5 | ab | 0.007 |
| Pruning Leaf June 2018 | 3766.1 | 3159.9 | 3944.2 | 3425.1 | 0.326 | ||||
| Pruning Stem June 2018 | 3138.3 | ab | 2523.7 | b | 3650.7 | a | 2805.6 | ab | 0.038 |
| Harvesting July 2018 | 1829.7 | 2276.7 | 1929.3 | 2014.4 | 0.752 | ||||
| Defoliation November 2018 | 3622.9 | 3557.6 | 3606.6 | 3639.2 | 0.986 | ||||
| Total | 23,769.9 | 22,304.9 | 25,601.0 | 24,563.0 | 0.121 | ||||
| N Concentration (% DW) | P Value | ||||||||
| 25% | 50% | 100% | 200% | ||||||
| Pruning Leaf July 2016 | 3.29 | b | 3.46 | ab | 3.43 | ab | 3.59 | a | 0.013 |
| Pruning Stem July 2016 | 0.96 | 0.99 | 0.93 | 0.97 | 0.891 | ||||
| Defoliation October 2016 | 2.92 | 2.96 | 2.95 | 2.99 | 0.808 | ||||
| Pruning February 2017 | 1.33 | 1.29 | 1.37 | 1.36 | 0.369 | ||||
| Thinning April 2017 | 2.78 | 2.92 | 2.82 | 3.05 | 0.201 | ||||
| Pruning Leaf June 2017 | 3.97 | 3.98 | 3.93 | 4.00 | 0.662 | ||||
| Pruning Stem June 2017 | 1.11 | 1.11 | 1.09 | 1.07 | 0.709 | ||||
| Harvesting July 2017 | 1.41 | a | 1.30 | b | 1.44 | a | 1.35 | ab | 0.001 |
| Defoliation October 2017 | 3.43 | 3.51 | 3.43 | 3.52 | 0.335 | ||||
| Pruning February 2018 | 2.11 | 2.08 | 2.12 | 2.07 | 0.807 | ||||
| Pruning Leaf June 2018 | 3.95 | 3.89 | 3.97 | 3.94 | 0.808 | ||||
| Pruning Stem June 2018 | 1.08 | 1.06 | 1.08 | 1.09 | 0.697 | ||||
| Harvesting July 2018 | 1.16 | 1.14 | 1.24 | 1.16 | 0.262 | ||||
| Defoliation November 2018 | 2.89 | 2.96 | 2.88 | 2.95 | 0.646 | ||||
| Removal Event | Dry Weight (g/tree) | P Value | |||
|---|---|---|---|---|---|
| Irrigated | Non-Irrigated | ||||
| Pruning Leaf July 2016 | 428.3 | a z | 291.6 | b | <0.001 |
| Pruning Stem July 2016 | 323.2 | a | 219.0 | b | <0.001 |
| Defoliation October 2016 | 1502.3 | a | 796.0 | b | <0.001 |
| Pruning February 2017 | 1350.0 | a | 517.0 | b | <0.001 |
| Thinning April 2017 | 42.4 | 37.6 | 0.441 | ||
| Pruning Leaf June 2017 | 1274.5 | a | 739.5 | b | <0.001 |
| Pruning Stem June 2017 | 1070.1 | a | 622.6 | b | <0.001 |
| Harvesting July 2017 | 1870.3 | 1656.9 | 0.136 | ||
| Defoliation October 2017 | 2258.2 | 2058.4 | 0.074 | ||
| Pruning February 2018 | 3709.4 | a | 2907.4 | b | <0.001 |
| Pruning Leaf June 2018 | 4067.6 | a | 3080.1 | b | 0.004 |
| Pruning Stem June 2018 | 3404.3 | a | 2654.9 | b | 0.010 |
| Harvesting July 2018 | 2119.9 | 1905.2 | 0.481 | ||
| Defoliation November 2018 | 3818.7 | a | 3394.4 | b | 0.011 |
| Total | 27,239.1 | a | 20,880.4 | b | <0.001 |
| N Concentration (% DW) | P Value | ||||
| Irrigated | Non-Irrigated | ||||
| Pruning Leaf July 2016 | 3.45 | 3.43 | 0.695 | ||
| Pruning Stem July 2016 | 0.98 | 0.94 | 0.452 | ||
| Defoliation October 2016 | 2.98 | 2.93 | 0.365 | ||
| Pruning February 2017 | 1.32 | 1.35 | 0.384 | ||
| Thinning April 2017 | 2.94 | 2.85 | 0.351 | ||
| Pruning Leaf June 2017 | 3.93 | 4.00 | 0.098 | ||
| Pruning Stem June 2017 | 1.09 | 1.11 | 0.420 | ||
| Harvesting July 2017 | 1.38 | 1.37 | 0.507 | ||
| Defoliation October 2017 | 3.46 | 3.48 | 0.600 | ||
| Pruning February 2018 | 2.08 | 2.11 | 0.600 | ||
| Pruning Leaf June 2018 | 3.88 | b | 3.99 | a | 0.034 |
| Pruning Stem June 2018 | 1.05 | b | 1.11 | a | 0.014 |
| Harvesting July 2018 | 1.14 | b | 1.21 | a | 0.043 |
| Defoliation November 2018 | 2.96 | 2.87 | 0.081 | ||
| Removal Event | Dry Weight (g/tree) | P Value | |||
|---|---|---|---|---|---|
| Drip | Micro-Sprinkler | ||||
| Pruning Leaf July 2016 | 486.7 | 369.9 | 0.135 | ||
| Pruning Stem July 2016 | 365.7 | 280.6 | 0.153 | ||
| Defoliation October 2016 | 1716.1 | 1288.6 | 0.086 | ||
| Pruning February 2017 | 1505.8 | 1194.2 | 0.392 | ||
| Thinning April 2017 | 53.3 | a z | 31.5 | b | 0.028 |
| Pruning Leaf June 2017 | 1272.2 | 1276.7 | 0.973 | ||
| Pruning Stem June 2017 | 1058.4 | 1081.7 | 0.825 | ||
| Harvesting July 2017 | 2076.6 | 1663.9 | 0.087 | ||
| Defoliation October 2017 | 2315.0 | 2201.5 | 0.432 | ||
| Pruning February 2018 | 3962.9 | 3455.8 | 0.116 | ||
| Pruning Leaf June 2018 | 4674.7 | a | 3460.6 | b | 0.019 |
| Pruning Stem June 2018 | 4074.4 | a | 2734.2 | b | 0.004 |
| Harvesting July 2018 | 1586.4 | b | 2653.3 | a | 0.036 |
| Defoliation November 2018 | 3933.0 | 3704.5 | 0.360 | ||
| Total | 29,081.2 | a | 25,397.0 | b | 0.015 |
| N Concentration (% DW) | P Value | ||||
| Drip | Micro-Sprinkler | ||||
| Pruning Leaf July 2016 | 3.53 | 3.38 | 0.190 | ||
| Pruning Stem July 2016 | 0.99 | 0.98 | 0.929 | ||
| Defoliation October 2016 | 3.16 | a | 2.80 | b | 0.016 |
| Pruning February 2017 | 1.28 | 1.37 | 0.072 | ||
| Thinning April 2017 | 2.93 | 2.95 | 0.912 | ||
| Pruning Leaf June 2017 | 3.93 | 3.94 | 0.922 | ||
| Pruning Stem June 2017 | 1.09 | 1.08 | 0.752 | ||
| Harvesting July 2017 | 1.45 | 1.32 | 0.109 | ||
| Defoliation October 2017 | 3.48 | 3.43 | 0.484 | ||
| Pruning February 2018 | 2.11 | 2.05 | 0.587 | ||
| Pruning Leaf June 2018 | 3.92 | 3.83 | 0.410 | ||
| Pruning Stem June 2018 | 1.16 | a | 0.94 | b | 0.009 |
| Harvesting July 2018 | 1.15 | 1.13 | 0.611 | ||
| Defoliation November 2018 | 3.09 | a | 2.84 | b | 0.002 |
Publisher’s Note: MDPI stays neutral with regard to jurisdictional claims in published maps and institutional affiliations. |
© 2021 by the authors. Licensee MDPI, Basel, Switzerland. This article is an open access article distributed under the terms and conditions of the Creative Commons Attribution (CC BY) license (http://creativecommons.org/licenses/by/4.0/).
Share and Cite
Casamali, B.; van Iersel, M.W.; Chavez, D.J. Nitrogen Partitioning in Young “Julyprince” Peach Trees Grown with Different Irrigation and Fertilization Practices in the Southeastern United States. Agronomy 2021, 11, 350. https://doi.org/10.3390/agronomy11020350
Casamali B, van Iersel MW, Chavez DJ. Nitrogen Partitioning in Young “Julyprince” Peach Trees Grown with Different Irrigation and Fertilization Practices in the Southeastern United States. Agronomy. 2021; 11(2):350. https://doi.org/10.3390/agronomy11020350
Chicago/Turabian StyleCasamali, Bruno, Marc W. van Iersel, and Dario J. Chavez. 2021. "Nitrogen Partitioning in Young “Julyprince” Peach Trees Grown with Different Irrigation and Fertilization Practices in the Southeastern United States" Agronomy 11, no. 2: 350. https://doi.org/10.3390/agronomy11020350
APA StyleCasamali, B., van Iersel, M. W., & Chavez, D. J. (2021). Nitrogen Partitioning in Young “Julyprince” Peach Trees Grown with Different Irrigation and Fertilization Practices in the Southeastern United States. Agronomy, 11(2), 350. https://doi.org/10.3390/agronomy11020350