Article

Preliminary Effects of Crop Residue Management on Soil Quality and Crop Production under Different Soil Management Regimes in Corn-Wheat Rotation Systems

by
Morad Mirzaei
1,*,
Manouchehr Gorji Anari
1,*,
Ehsan Razavy-Toosi
2,
Hossein Asadi
1,
Ebrahim Moghiseh
3,
Nermina Saronjic
4 and
Jesús Rodrigo-Comino
5,6,*
1
Department of Soil Science and Engineering, Faculty of Agricultural Engineering and Technology, University of Tehran, Karaj 31587-77871, Iran
2
Department of Plant, Soil and Microbial Sciences, Michigan State University, East Lansing, MI 48824, USA
3
Nuclear Agriculture Research School, Nuclear Science and Technology Research Institute, Karaj 31465-1498, Iran
4
Department of Forest and Soil Sciences, Institute of Soil Research, University of Natural Resources and Life Sciences (BOKU), Peter-Jordan Strasse 82, 1190 Vienna, Austria
5
Soil Erosion and Degradation Research Group, Department of Geography, University of Valencia, 46010 Valencia, Spain
6
Physical Geography, University of Trier, 54286 Trier, Germany
*
Authors to whom correspondence should be addressed.
Agronomy 2021, 11(2), 302; https://doi.org/10.3390/agronomy11020302
Submission received: 18 January 2021 / Revised: 4 February 2021 / Accepted: 5 February 2021 / Published: 9 February 2021
(This article belongs to the Special Issue Conservation Tillage in Sustainable Agro-Ecosystems)

Abstract

:
Strategic management of crop residues is essential to enhance soil quality for sustainable agriculture. However, little is known about the specific amounts of crop residues needed to improve soil quality characteristics which are key to develop economic plans. In this study, we investigated the effects of applying crop residue at five rates, including 100% (R100), 75% (R75), 50% (R50), 25% (R25), and 0% (R0), on wheat yield and soil properties. Field experiments were conducted for two cropping seasons in a wheat-corn rotation under conventional (CT) and no-till (NT) systems to observe the first results obtained during short-term periods (one-year application). During the study, the wheat and corn fields were irrigated. Application of plant residue resulted in increased soil organic carbon (SOC) and available nutrients and improved soil physical properties, i.e., aggregates mean weight diameter in wet (MWDw) and dry (MWDd) conditions, water-stable aggregates (WSA), dry-stable aggregates, (DSA), soil water infiltration (SWI), soil available water (SAW), and yield of wheat and corn. The effects were stronger at higher residue application rates. In the CT system, compared to R0, R100 resulted in the highest increase equal to 38, 29, 23, 34, 35, 41, and 11% for SOC, MWDw, MWDd, WSA, DSA, SAW, and wheat grain yield, respectively. This was equivalent to 28, 19.5, 19, 37, 44, 52, and 6% for the NT system, respectively. Generally, the NT system resulted in a stratification of the soil properties within 0–10 cm compared to 10–20 cm soil depth, but a uniform distribution for both depths under CT system. Overall, these results show that crop residue application can improve soil quality and yield in cereal production systems under semi-arid conditions during the first year of application. It will be key to monitor these changes in along-term field studies.

1. Introduction

The major challenges that humankind faces to date include food insecurity, water scarcity, land degradation, energy shortages, and climate change due to increased greenhouse gas emissions [1,2,3]. These challenges affect the sustainable use of natural resources [4]. However, soils are in several cases mismanaged and deteriorated [5,6]. Providing food for the growing population and reducing environmental damage requires sustainable soil use [7]. Many studies have reported that retaining plant residue in soil could lead to improved physical, chemical and biological properties, which provide better conditions for plant root growth and sustainable crop production [8,9] and even protect against soil erosion processes [10,11]. Plant residue refers to parts of the plant that remain in the field after harvest [12]. Around 3.5–4 × 10⁹ Mg of plant, residues are produced each year globally, among which 75% come from cereals [13].
Worldwide, removal of crop residue from the field after crop harvest is the norm or cultural heritage to conserve the plantation “clean” [5,6,10]. The removed residues are generally used for food and fiber (animal feed and bedding, biofuel production, building materials, household fuel, paper making, and mushroom cultivation), negatively affecting soil fertility, agronomic productivity, and environmental quality [14]. In addition, in many developing countries, conventional agricultural methods such as intensive tillage and the burning of crop residue exacerbate these impacts [15]. Therefore, proper management of crop residue is necessary for improving soil fertility and quality. Some researchers suggested that 30 to 50% of crop residue could be removed from the farm without causing any adverse impacts on soil [16]. Vasconcelos et al. [17] suggested 6 Mg ha−1 of crop residue as an appropriate management practice to maintain proper soil cover and prevent soil C loss. Kumari et al. [18] found that 100% retention of plant residue resulted in the highest aggregate stability and water holding capacity. Increasing crop yield has also been reported by retaining 100% to 150% of crop residues [19,20]. Furthermore, some researchers have shown that the retention of a moderate amount (50%) of crop residues can increase crop production [21,22]. Some studies have shown that the removal of approximately 50% of residue has little effect on crop yield [23,24]. On the other hand, recent studies reported adverse impacts of crop residue removal on soil quality and crop yield [25]. The amount of crop residue that can be removed from agricultural land without having any negative effects on soil quality and yield production is greatly site-specific and non-well studied to date. It depends on the amount of residue, soil properties, soil fertility status, cropping system, management duration, and differs by agricultural management practices, climate, region, and should be evaluated on a smaller-scale basis [18,26,27,28]. Also, irrigation can affect the potential of crop residue management on soil quality [29].
Each year a massive amount of crop residues are produced in Iran, but unfortunately, these residues are mostly burned or removed for fodder, energy production or other purposes. Also, in many areas, conventional agriculture practices, such as intensive tillage and lack of proper crop rotation, are common. Furthermore, in many areas, soils with low levels of organic matter and poor fertility respond fast to sustainable management practices [30,31]. Therefore, plant residue management requires careful consideration to determine the appropriate amount of crop residue to improve soil quality. To our knowledge, no comprehensive studies have reported the effects of different rates of crop residue retention on soil properties and crop yield simultaneously in Iran. Such information is essential to gain more insights into sustainable management of crop residue. Therefore, the main goals of this research are to (a) investigate the short term effect of applying different rates of crop residue on soil physical and chemical properties in topsoil layers, and (b) assess the short term impact on wheat and corn yield in a wheat-corn rotation under conventional and no-till farming systems. Our research hypothesis was to test if retaining higher crop residue rates in both conventional tillage (CT) and no-tillage (NT) systems would improve soil quality and wheat yield, although their effect could be more evident in the NT system, a priori. This study is conducted to assess these results at a short-term period (1-year), considering if positive results are obtained, to recommend this investigation for longer term-periods and larger scales. As a case study, we select a representative agricultural region in the semi-arid region of Karaj, located in the Alborz province, Iran.

2. Materials and Methods

2.1. Site Characteristics and Experimental Design

The investigation was conducted at the Agriculture Research Station of the College of Agriculture and Natural Resources, University of Tehran, Karaj, Iran (35°48′32″ N, 50°58′06″ E, 1308 elevation) in July of 2018. The site is characterized by a semiarid climate with a mean air temperature and rainfall of 13.7 °C and 245.5 mm, respectively. Two field sites with two management practices conventional tillage (CT) and no-tillage (NT) systems, were selected for this study (Figure 1). Both fields were cultivated with wheat (Triticum aestivum L.)-corn (Zea mays L.) rotation for fifteen years before the experiment. During these years, in the CT system, post-harvest crop residue was removed from the farm for several purposes, including food and bedding for animals, building materials and household fuel, but in the NT system, crop residues remained on the farm.
For each of the tillage management systems, the field size was 19 × 22 m. Each field was divided into 20 plots of 3 × 4 m. The experimental design was a split-plot with four replications for each treatment with a 2 m distance between replicates and 1 m distance between the plots. The physical-chemical properties of the soil before the start of the experiment are given in Table 1. Soil textures were sandy loam and clay loam under CT and NT respectively. It could be because the study area has been alluvial plains since ancient times, which probably transportation and sedimentation process led to the formation of soils with different parent material and characteristics in this area.

2.2. Treatment Applications

Wheat residue treatments were applied in both NT and CT following wheat harvest from the previous year. For this purpose, crop residue was removed from the fields and partly chopped. Then five different rates of wheat residue, including 3.5 ton ha−1 (100%, R100), 2.625 ton ha−1 (75%, R75), 1.75 ton ha−1 (50%, R50), 0.875 ton ha−1 (25%, R25), and no-residue (0%, R0) were distributed uniformly on the surface of appropriate plot in CT and NT. Corn was planted in July 2018 using a row crop planter with a 75 cm distance between the rows and 10 cm within row distance between the plants. Each plot included a total of six rows. In the NT field, seed placement was carried out using a planter with a single coulter. In the CT, before seed placement, the soil was cultivated with a moldboard plow to a depth of 35 cm, followed by disking and leveling. Basal NPK fertilizers were broadcasted in the form of 50 kg urea, 70 kg potassium sulfate, and 150 kg superphosphate per hectare. Additional N was top-dressed at V8/(80 kg Urea ha−1) and V10 (270 kg Urea ha−1). The fields were irrigated after planting and on a 7–10 d basis thereafter. Weeds were removed manually at V4 and V8 stages.
After corn harvest in October 2018, five different rates of corn residue, including 6 ton ha−1 (100%, R100), 4.5 ton ha−1 (75%, R75), 3 ton ha−1 (50%, R50), 1.5 ton ha−1 (25%, R25), and no-residue (0%, R0) were applied in the same plots under NT and CT systems. Winter wheat (Triticum aestivum L.) was planted in November 2018. For this purpose, 208 (kg ha−1) of wheat seed were planted using a drilling machine with a 13.5 cm distance between the rows (MZK3-21-21, Machine Barzegar Company, Hamedan, Iran). Basal fertilization included 50 kg urea, 200 kg superphosphate, and 150 kg potassium sulfate. Additional N was applied at late tillering (110 kg urea ha−1), stem elongation (110 kg urea ha−1), and spiking (50 kg urea ha−1). The plots were irrigated after planting and based on environmental conditions thereafter.

2.3. Plant Residue Analyses

The wheat and corn residue were collected after harvesting dried and finely ground for analyses. Organic carbon (OC) was determined using the Walkley and Black method [32]. Total nitrogen (TN) in plant residue was determined using the Kjeldahl method [33]. The P and K concentrations in the samples were measured on dry-ashed samples using spectrophotometric and flame photometric methods, respectively [33]. Atomic absorption spectrophotometry was used to determine Cu, Fe, Mn, and Zn in plant residue [33]. (Table 2).

2.4. Soil Sampling and Analysis

After wheat harvesting, soil samples were collected using an auger sampler from 0–10 cm and 10–20 cm depths of each plot. Soil samples were collected from three plot spots and, subsequently, uniformly mixed to make one composite sample per soil depth. Soil samples were air-dried, sieved (2 mm) and stored until analyses were carried out. Soil organic carbon (SOC) was determined using Walkley and Black [32] method, pH and electrical conductivity (EC) were measured in saturated soil extracts. Available phosphorus was determined using the NaHCO3 method [34]. The ammonium acetate method was used for determining available potassium [35]. Total nitrogen (TN) was measured using the method described by Bremner and Mulvaney [36]. Micronutrients were measured in DTPA extracts [37] using atomic absorption spectrophotometry.

2.5. Soil Organic Carbon (SOC) and Total Nitrogen (TN) Stocks

The soil organic carbon and total nitrogen stock (Mg ha−1) were calculated for 0–10 cm and 10–20 cm soil depths using the concentration and soil bulk density at each soil depth [38,39]. Values of soil bulk density differed at soil depths (Table 1).

2.6. Stratification Soil Properties

Stratification ratio (SR) for a soil property is defined as the ratio of its value at the soil surface to that at a lower depth and it is used as an indicator of dynamic soil quality [40]. In this research, stratification ratios (SR) of the measured soil properties were calculated by dividing the mentioned parameters content of the 0–10 cm soil depth into those of 10–20 cm [39,40].

2.7. Soil Physical Analysis

2.7.1. Aggregate Stability Indexes Determination

The separation of aggregate-size was conducted by the wet and dry method [41]. For wet sieving, 50-g air-dried (8 mm sieved) soil sample was put on the top of a 4-mm sieve and submerged for 5 min in deionized water at room temperature to allow slaking [42]. Sieving was performed by moving the sieves up and down 3 cm, 50 times in 2 min to achieve aggregate separation [43]. A series of six sieves (4, 2, 1, 0.5, 0.25 and 0.125 mm) was used for this purpose. A shaker and the dry-sieving methods were used to determine the secondary particle size distribution of the soils in dry condition [42]. Briefly, 50 g of air-dried (8 mm sieved) soil sample was put on sieve series and then shaken for 5 min. The selected sieve sizes were 4, 2, 1, 0.5, 0.25 and 0.125 mm. Additional indexes, including aggregates mean weight diameter in wet (MWDw) and dry condition (MWDd) conditions [42], as well as dry-stable aggregates larger than 0.25 mm (DSA > 0.25 mm in %) and water-stable aggregates (WSA > 0.25 mm in %), were measured [44,45]:
MWD   =     i = 1 n X i W i
DSA   >   0.25   mm   =     M   0.25 M t × 100
WSA   >   0.25   mm   =   M   0.25 M t × 100
where Xi is the arithmetic mean diameter of each aggregate size fraction (mm), Wi is the proportion of aggregates in the corresponding size fraction, M 0.25 is the sum of aggregates mass (g) within all size classes coarser than 0.25 mm, and Mt is the total mass of soil sample (g) was used for sieving.

2.7.2. Soil Infiltration and Available Water

Following the wheat harvesting, infiltration rates were measured at three points per plot, using the double ring method [46], included two cylinders with a height of 35 cm and inner-ring diameters of 50 and 35 cm, respectively. The double-ring infiltrometer was tamped 5 cm into the soil. Changes in water height were recorded for the first ten minutes at intervals of one minute and up to 60 min every five minutes. The moisture contents of soil samples at field capacity and wilting point were determined using the pressure plate and pressure membrane apparatuses. Plant available water (Aw) was calculated from the difference of moisture content of field capacity and wilting point [47].

2.8. Yield Measurement

Corn and wheat were harvested in October 2018 and July 2019, respectively. After excluding the plot margins, a 1 × 1 m quadrat was used to harvest three locations within each plot. To calculate total biomass for wheat, the whole plants were harvested and numbered and weighted for each plot separately, and their mean was calculated as total biomass yield per m2 and finally scaled up to a one-hectare basis. The harvested plants were manually threshed, and separated grain and straw were measured. For determination of corn yield, fresh weights of the harvested plants were recorded. Plant subsamples were dried at 60 °C for 48 h and dry matter yield was estimated [48,49].

2.9. Statistical Analyses

The data were statistically analyzed using general linear models (GLM) procedure, using SAS 9.4 software (SAS Institute Inc., Cary, NC, USA). Means were compared by the Duncan method at the 0.05 probability level.

3. Results and Discussion

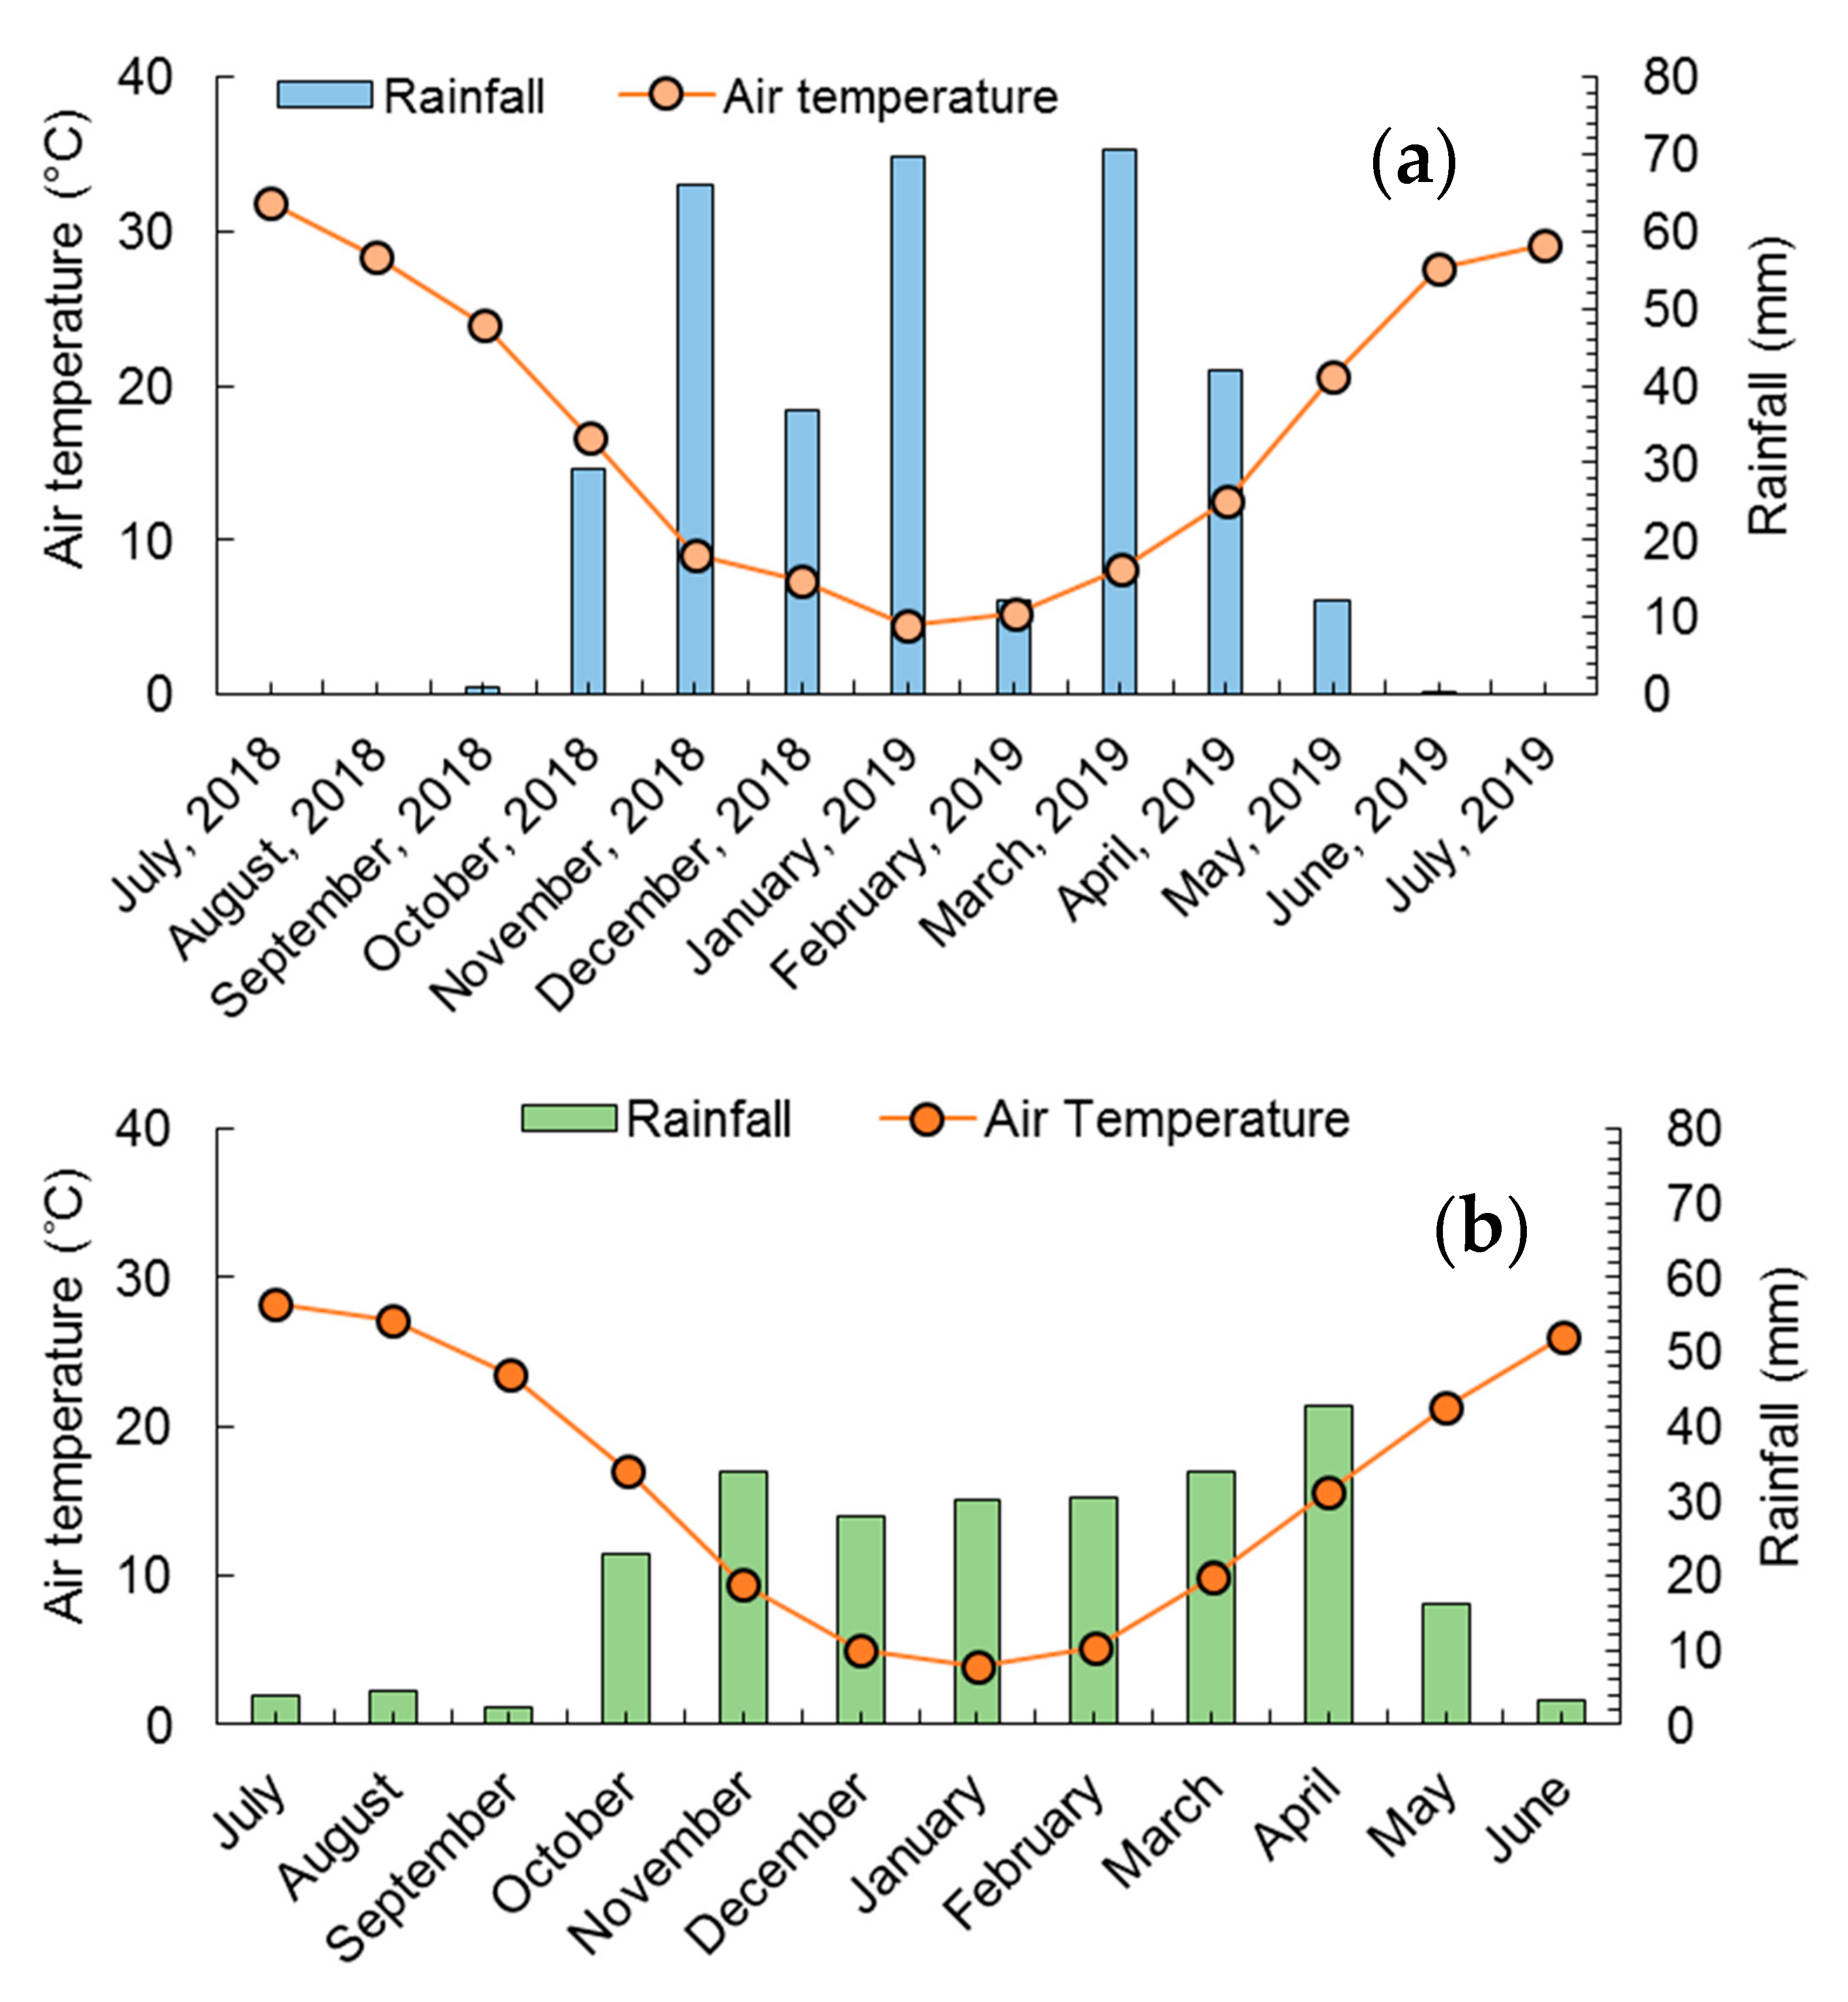
3.1. Weather Conditions

In general, during the experiment, the mean air temperature was high in summer 2018 (Figure 2a). By the beginning of the fall season, it started falling trend and reached its lowest values in winter 2019, and then followed the raising trend raised until summer 2019.The highest (32 °C) and lowest (4.5 °C) mean air temperature was recorded in July 2018 and January 2019, respectively. Also during this period, the main rainfall events were observed from October 2018 to May 2019, with November, January and March being the rainiest months. The highest rainfall (71 mm) was recorded in March 2019. In the summer of 2018 and 2019, the rainfall was almost zero. The long-term data (2005–2017) of monthly rainfall and mean air temperature is presented in Figure 2b. As the results show, the long-term trend of mean air temperature is similar to the air temperature trend during the study period (2018–2019). Monthly long-term rainfalls in summer and spring are approximately the same as those in 2018 and 2019, while in fall and winter (except in February), these amounts are substantially lower compared to those during the study period. However, during the experiment irrigation was used, which demonstrates that our studied period is a representative period of our experimental monitoring time.

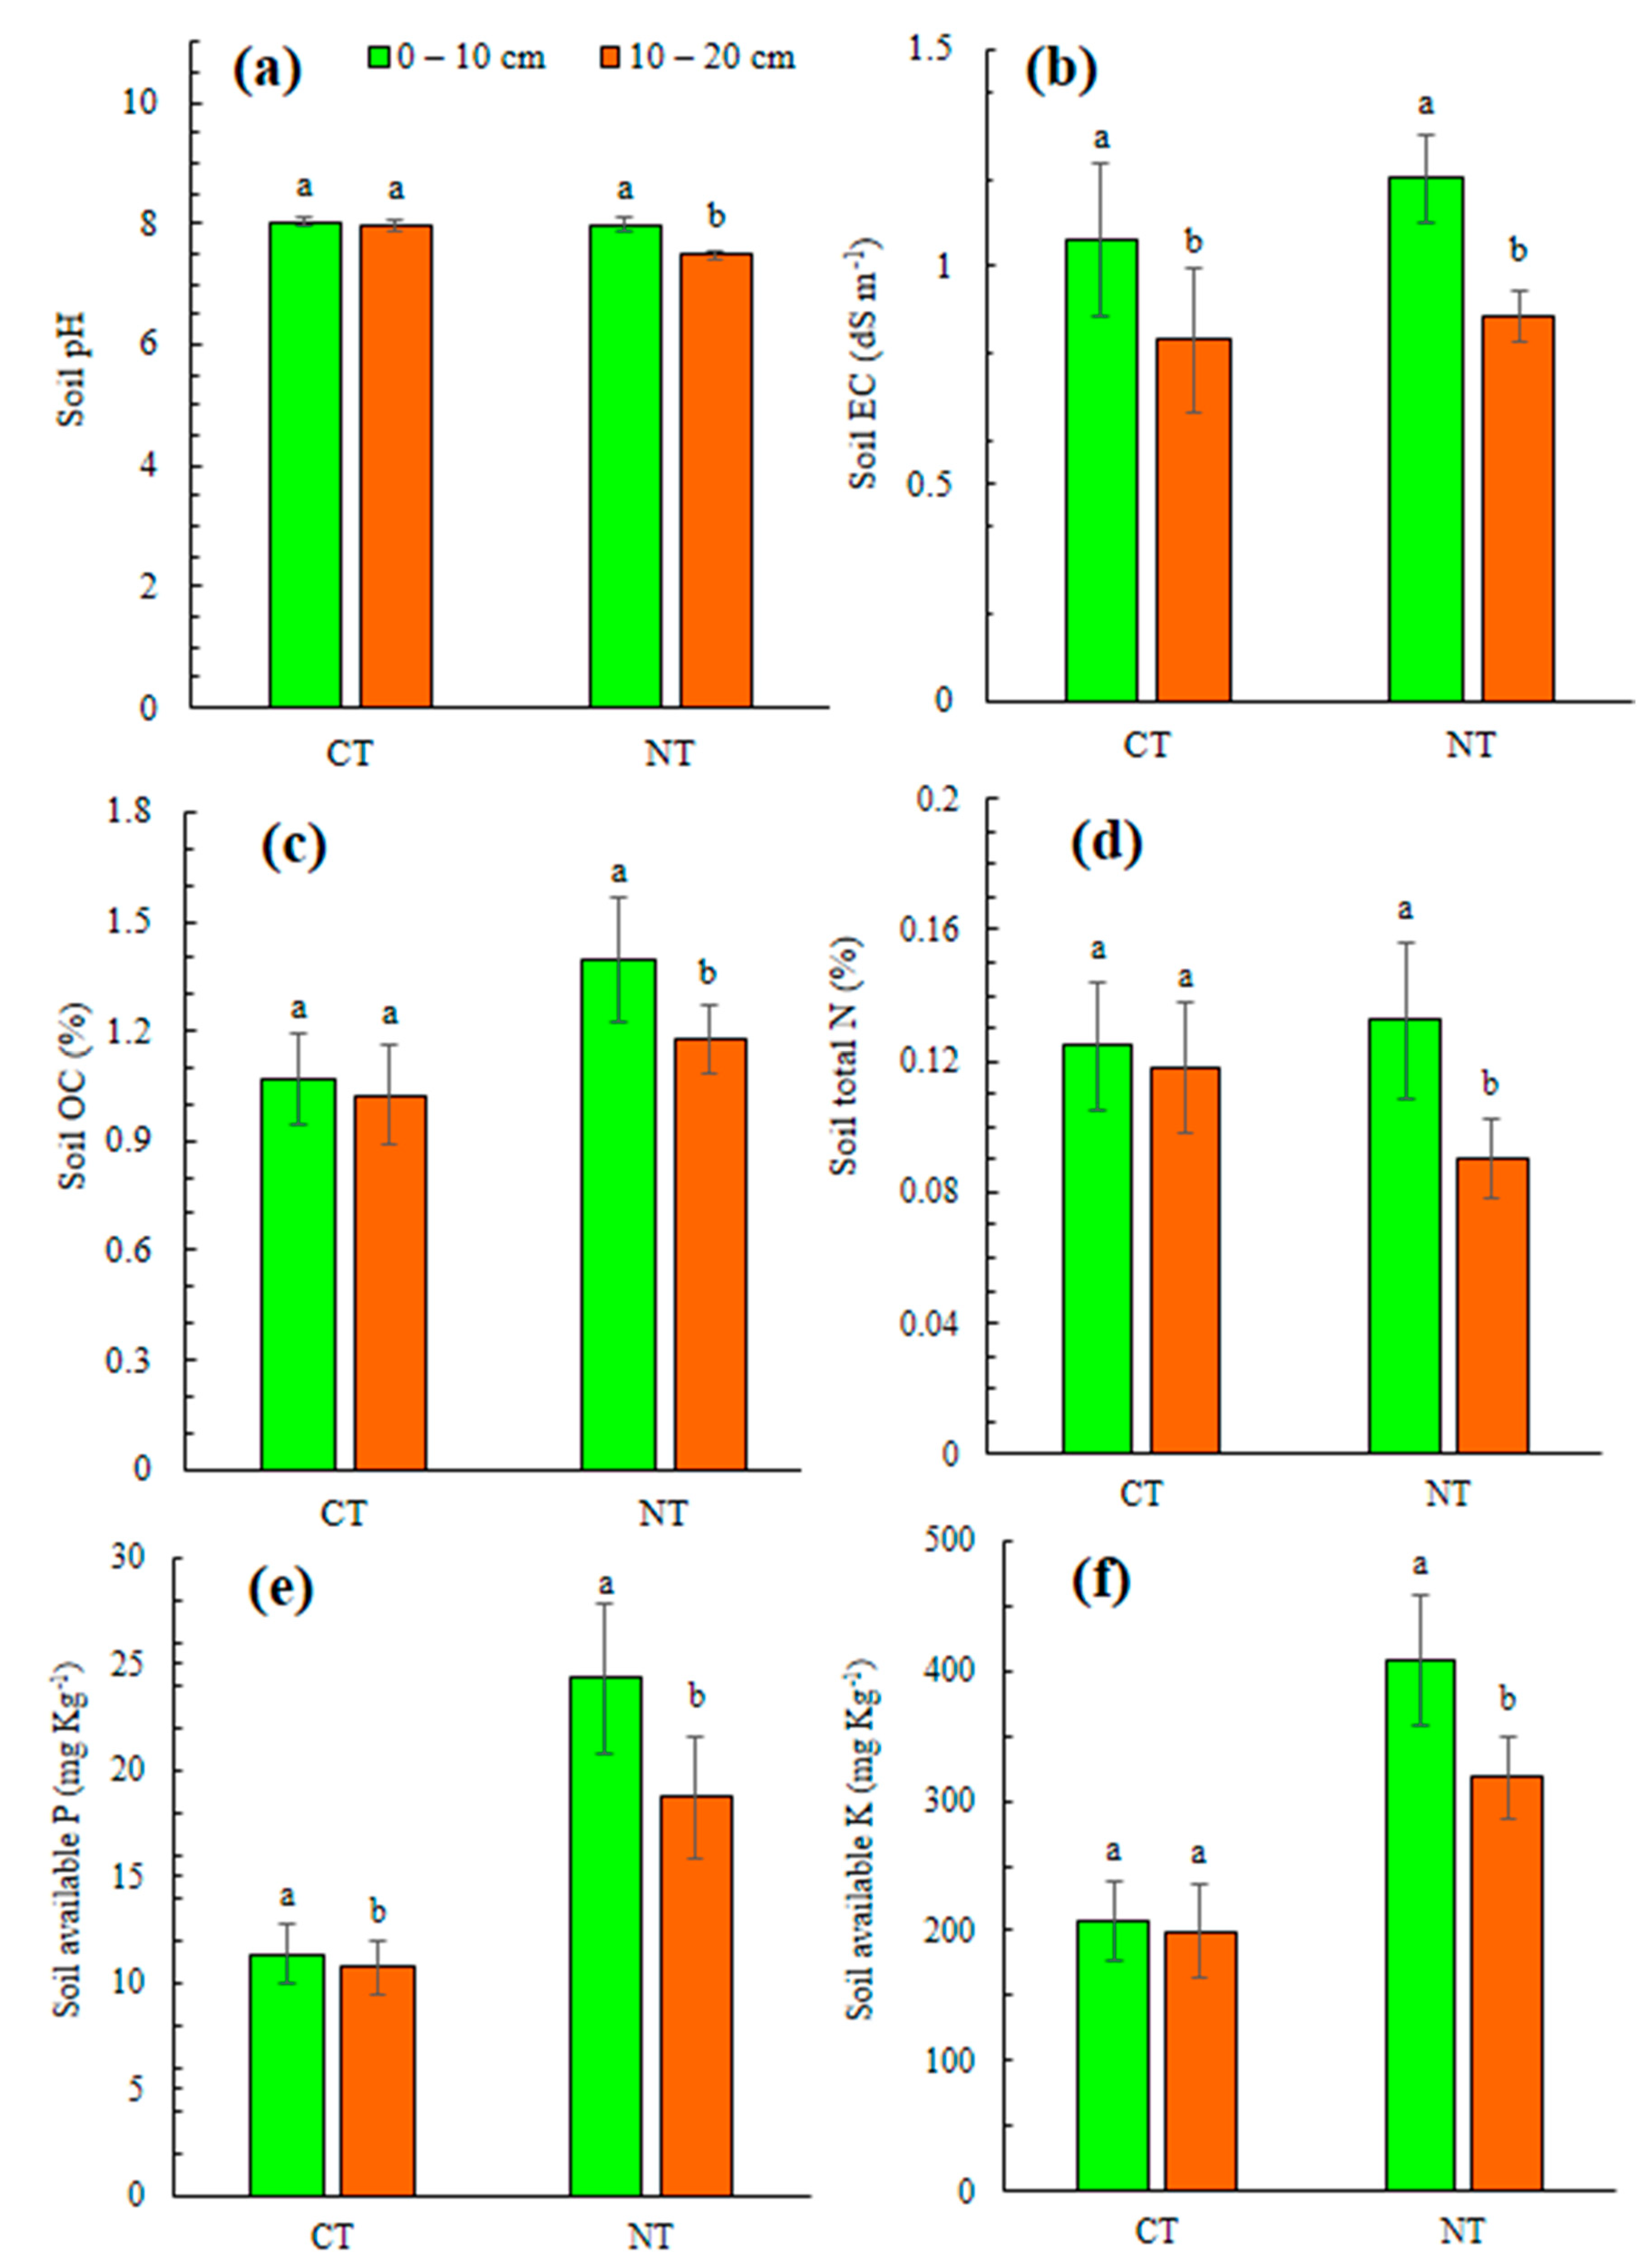
3.2. Soil Chemical Properties

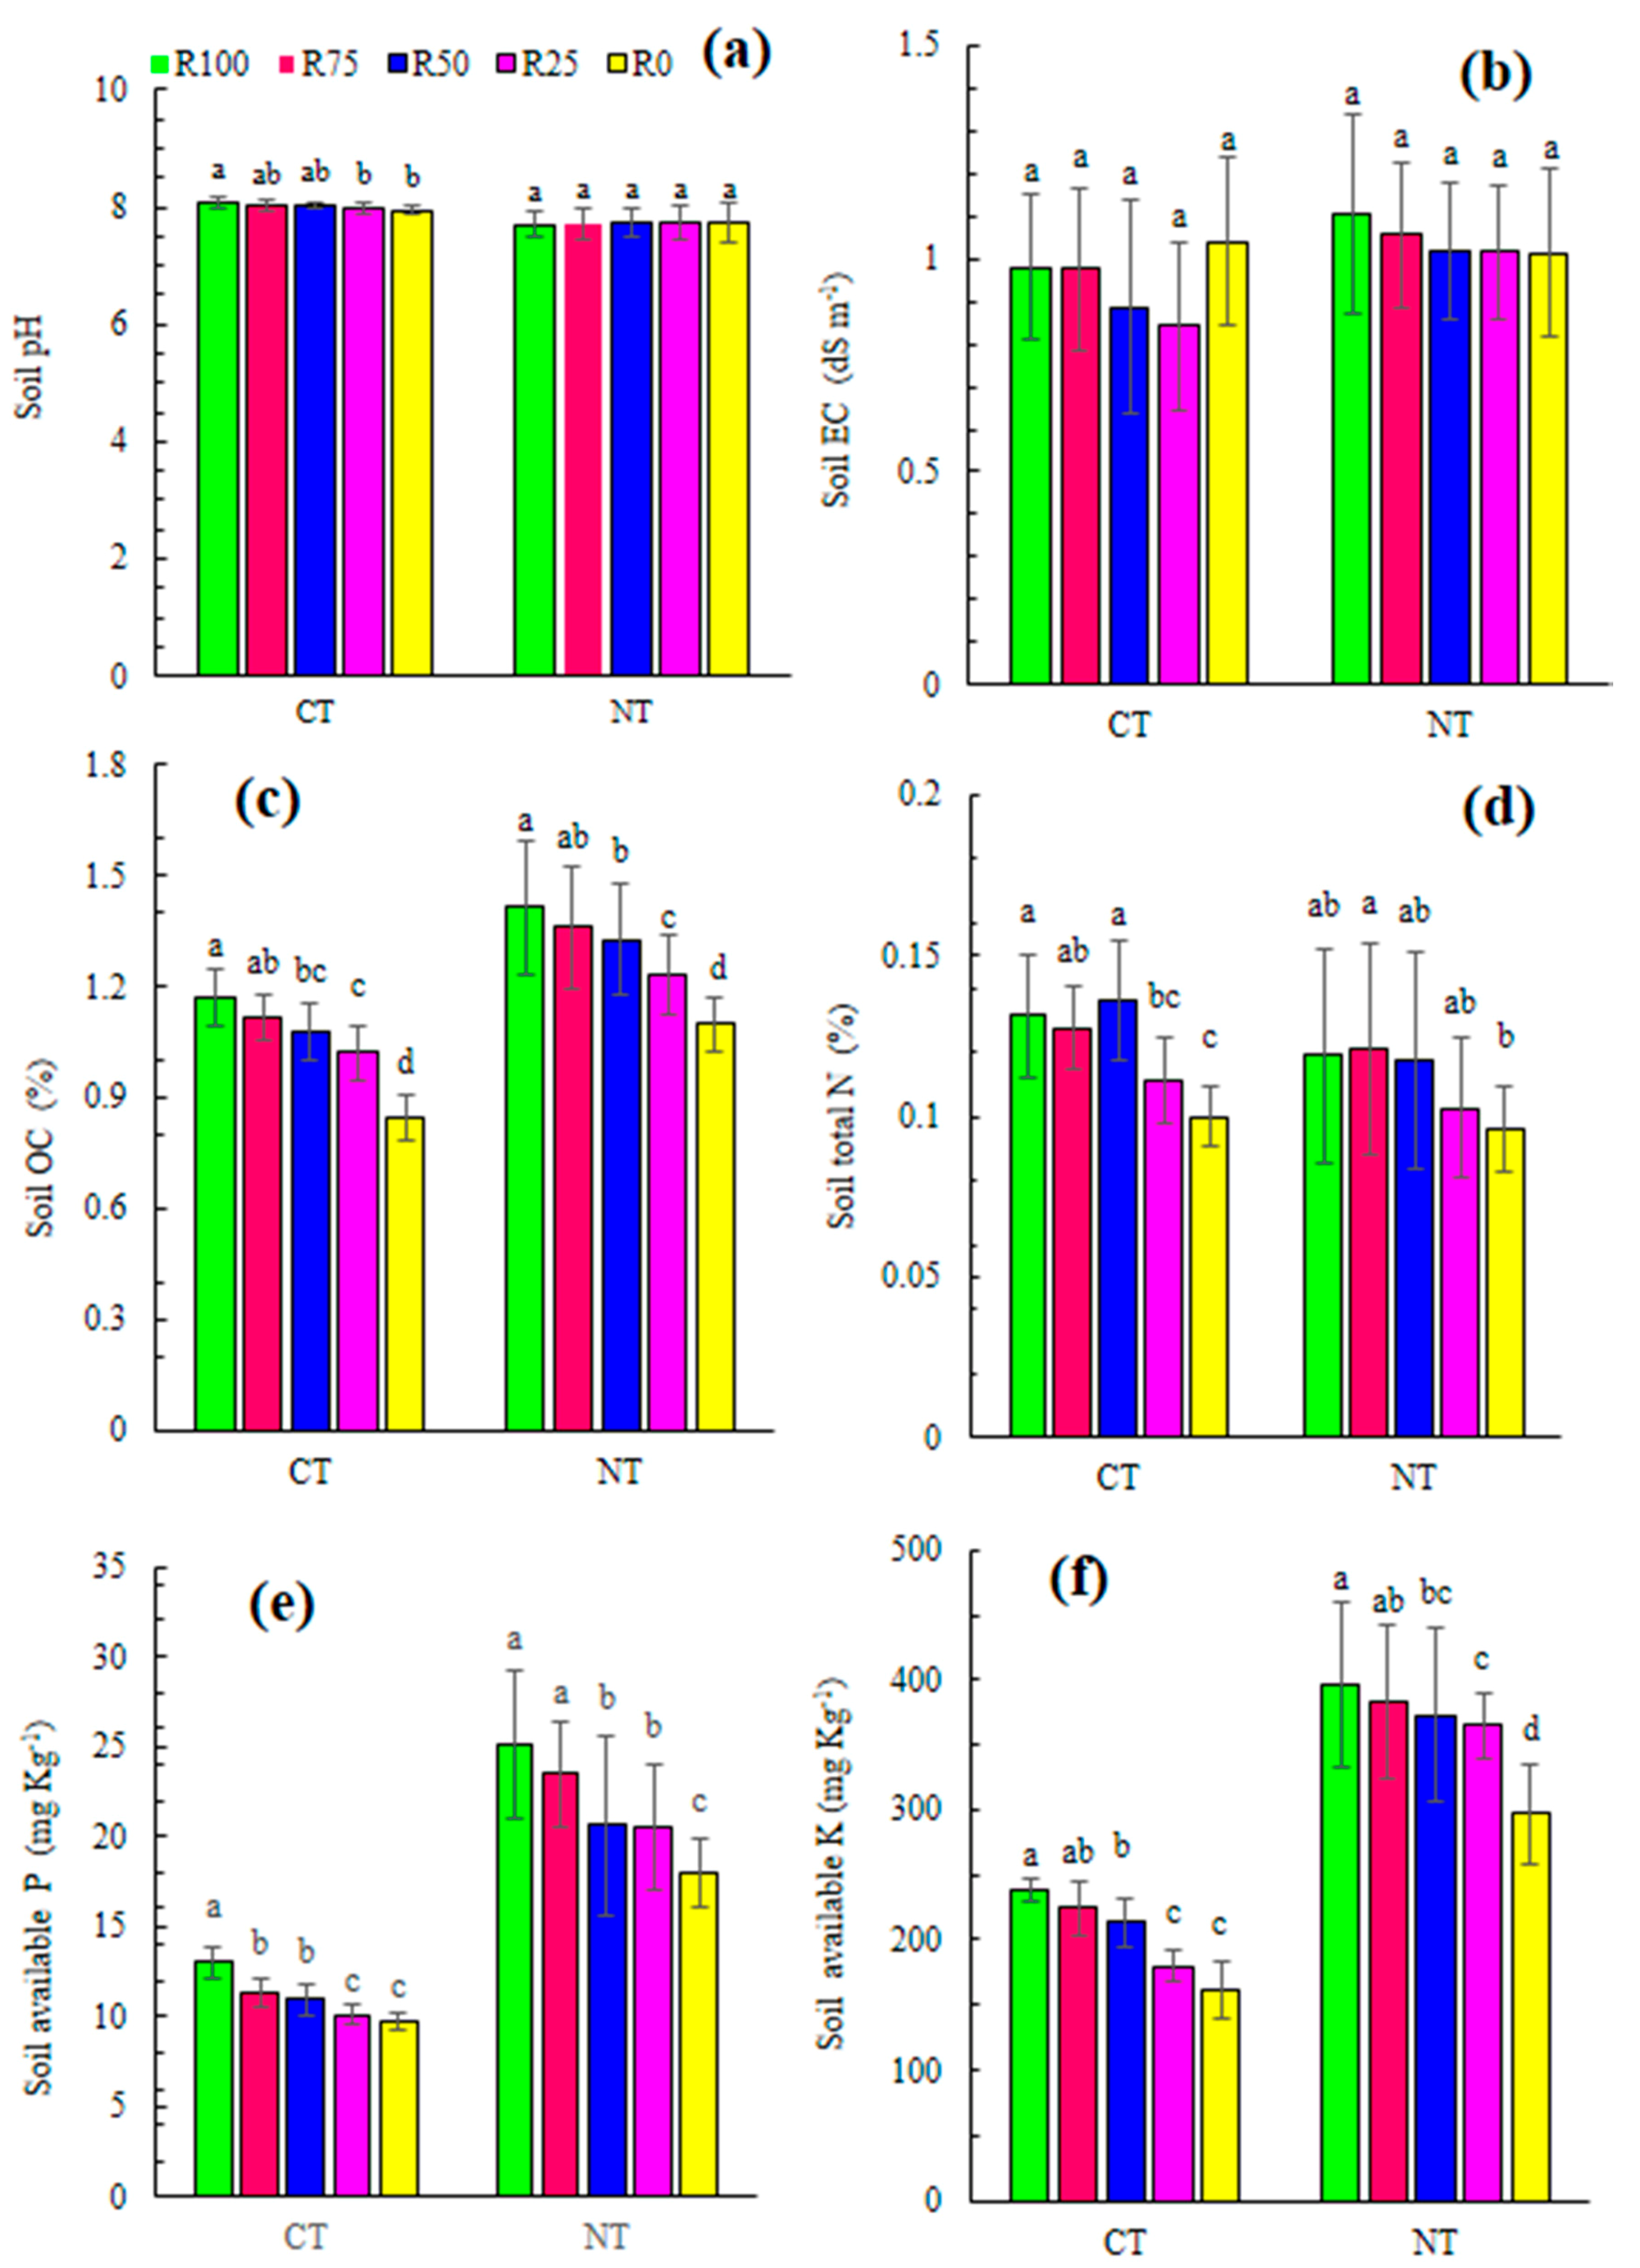
3.2.1. Soil pH and EC

In the CT system, residue increased soil pH, with the highest pH value (8.08) under R100 and the lowest under R0 (7.94). The only significant difference (p < 0.05) was observed between R100 and both R0 and R25 (Figure 3a). Residue application had no impact on soil electrical conductivity (EC) under this system (Figure 3b). In the NT system, no significant difference was observed among residue treatments on soil pH and EC (Figure 3a,b). Both parameters were significantly (p < 0.05) higher in 0–10 cm, compared to 10–20 cm under this system, while in the CT system, only soil EC was significantly (p < 0.05) higher at the 0–10 cm compared with 10–20 cm (Figure 4). Also, the interaction effects of residue rate and tillage system had a significant effect (p < 0.05) on soil pH, where CTR100 and NTR100 resulted in the highest (8.08) and lowest (7.7) amounts among the treatments respectively (Table 3). However, the interaction effects did not significantly impact EC. Hargrove et al. [50] and Blevins et al. [51] also reported higher soil pH under CT compared to NT in Kentucky. However, Edwards et al. [52] found no difference in soil pH between NT and CT. Differences between soil pH under tillage systems may be attributed to the buffering capacity of different soil types. In the NT system, soil texture is clay loam with a higher buffering capacity than the soil under the CT system (sandy loam) and it prevents drastic changes in soil pH [53]. Furthermore, nutrient movement in the soil, crop residue decomposition rate, and infiltration capacity could have contributed to the variation in data observed.
Soil pH increase after the addition of crop residue has also been observed in other studies [54], probably due to decarboxylation of organic anions and release of OH or high concentrations of basic cations such as Ca, Mg, and K, released during the decomposition of plant residue [55,56]. In this study, the highest pH measured in R100 treatment represents the higher potential contribution of larger residue rates to release excess alkaline cations and create a liming effect compared to lower residue rates. However, the results of this study are not in line with those who reported decreased soil pH under residue retention due to acidifying processes during the mineralization of crop residue, nitrification of applied N fertilizer, root exudation, and also the increased number of electrolytes under NT system [8,57,58,59].
In general, changes in soil pH are controlled by many factors, including the chemical composition of residue, biological activity, soil organic matter content, and texture [56]. The high soil pH and EC values at 0–10 cm depth in the no-tillage system indicate the high plant residue on the soil surface and lack of soil disturbance, leading to release and accumulation of nutrients on the soil surface and consequently increasing soil pH and EC. The increase in soil EC at shallow depth may be attributed to the increased evapotranspiration, which leads to the accumulation of solutes on the soil surface in the CT system.

3.2.2. Soil Organic Carbon (SOC) and C:N Ratio

SOC content increased significantly with increasing residue rates compared to no residue under CT and NT systems, with the highest amount recorded in R100 (Figure 3c). NT with full retention of crop residue (NTR100) resulted in the highest amount (1.41%) of SOC among management practices (Table 3). The lowest amount (0.84%) of SOC was measured under CT system with no residue (CTR0). In addition, SOC concentration was significantly (p < 0.05) higher in the 0–10 cm than 10–20 cm soil depth under the no-tillage system, while in the CT system, the differences between the two depths were not significant (Figure 4c). The effect of treatment on C: N ratio was not significant. Short term increases in SOC under NT with residue application than CT system has been previously reported by several researchers [60,61,62,63,64,65], which were attributed to the less soil disturbance low oxidation of organic matter (crop residues), and higher aggregates stability compared to CT system [60,61,62]. In addition, in the current research, differences in soil texture under tillage systems could be accounted for the variation in SOC. Increasing soil clay concentration under NT system protects soil organic matter pools from rapid decomposition and increase the rate of accumulation of SOC [65].
The significant increase in SOC concentration with residue retention is attributed to increased residue-derived SOC [66]. The SOC results in both CT and NT systems indicated that even the maintenance of small amounts of crop residue can significantly increase soil SOC related to residue rates. Soil carbon and organic matter are greatly affected by the amount of plant residue returned to the soil [67]. The results of this study are in line with the findings of those reported by several studies in short terms and long terms [18,57,58,59,68,69]. Higher SOC concentration in the 0–10 cm than 10–20 cm soil depth under no-tillage in this study explains that crop residue remains mostly at the soil surface in the no-tillage system, reflecting stratification of organic matter. In previous studies [58,70,71], the higher SOC in the soil surface compared to lower depth mainly were attributed to the less contact of crop residue with soil and lower decomposition rates.

3.2.3. Total Nitrogen (TN), Available K (Ava K), and Available P (Ava P)

Crop residue applied at R100, R75, R50 and R25 enhanced NPK under CT and NT systems compared to R0 (Figure 3d–f). The results also showed that the amounts of these nutrients were significantly higher (p < 0.05) at a depth of 0–10 cm compared to 10–20 cm under NT system (Figure 4d–f). The interaction effects of residue rate and tillage system had an only significant effect on available K and P, but not on TN. NTR100 and CTR0 led to the highest and lowest amount of the Ava K and Ava P respectively (Table 3). Neugschwandtner et al. [72] also reported retention of P and K under NT system. In this research, the high level of Available K and P in the NT system could be attributed to increased SOC as well as to finer soil texture compared to CT system which minimises downward movement of nutrients.
These results are in line with those reported by [8,54,65,73] indicating more total N, available P and K with residue retention compared to residue removal. Crop residue is an important source of nutrients, and its recycling can release nutrients and increase soil fertility, reducing dependency on chemical fertilizers [9]. Overall, in the CT system, a significant increase in soil macronutrients was achieved by retaining 50% and higher values of residue in the soil. In the CT system, it seems that due to soil disturbance by the plow and higher oxidation and decomposition, the retention of 25% of the residue could not make a significant contribution to increasing macronutrients, therefore larger amounts of residue needed to improve the nutrient status in this system. Whereas, in the NT system, even retaining the lower amount of residue (25%) was enough to increase the soil macronutrients significantly, reflecting better decomposition circumstances under the NT system. On the other hand, the concentration of these three nutrients decreased with soil depth in the NT system. The stratification of nutrients was previously reported under no-tillage practices [63,64,72]. Crop residue enriches the soil with nutrients through mineralization of nutrients, reduces the stabilization of nutrients and minimizes nutrient loss through runoff and soil erosion [8,74]. Nutrient release from residue retention mainly depends on the amount of residue retained, soil properties, climate, mineralization rate, quality of residue, fertilizer application, and site characteristics.

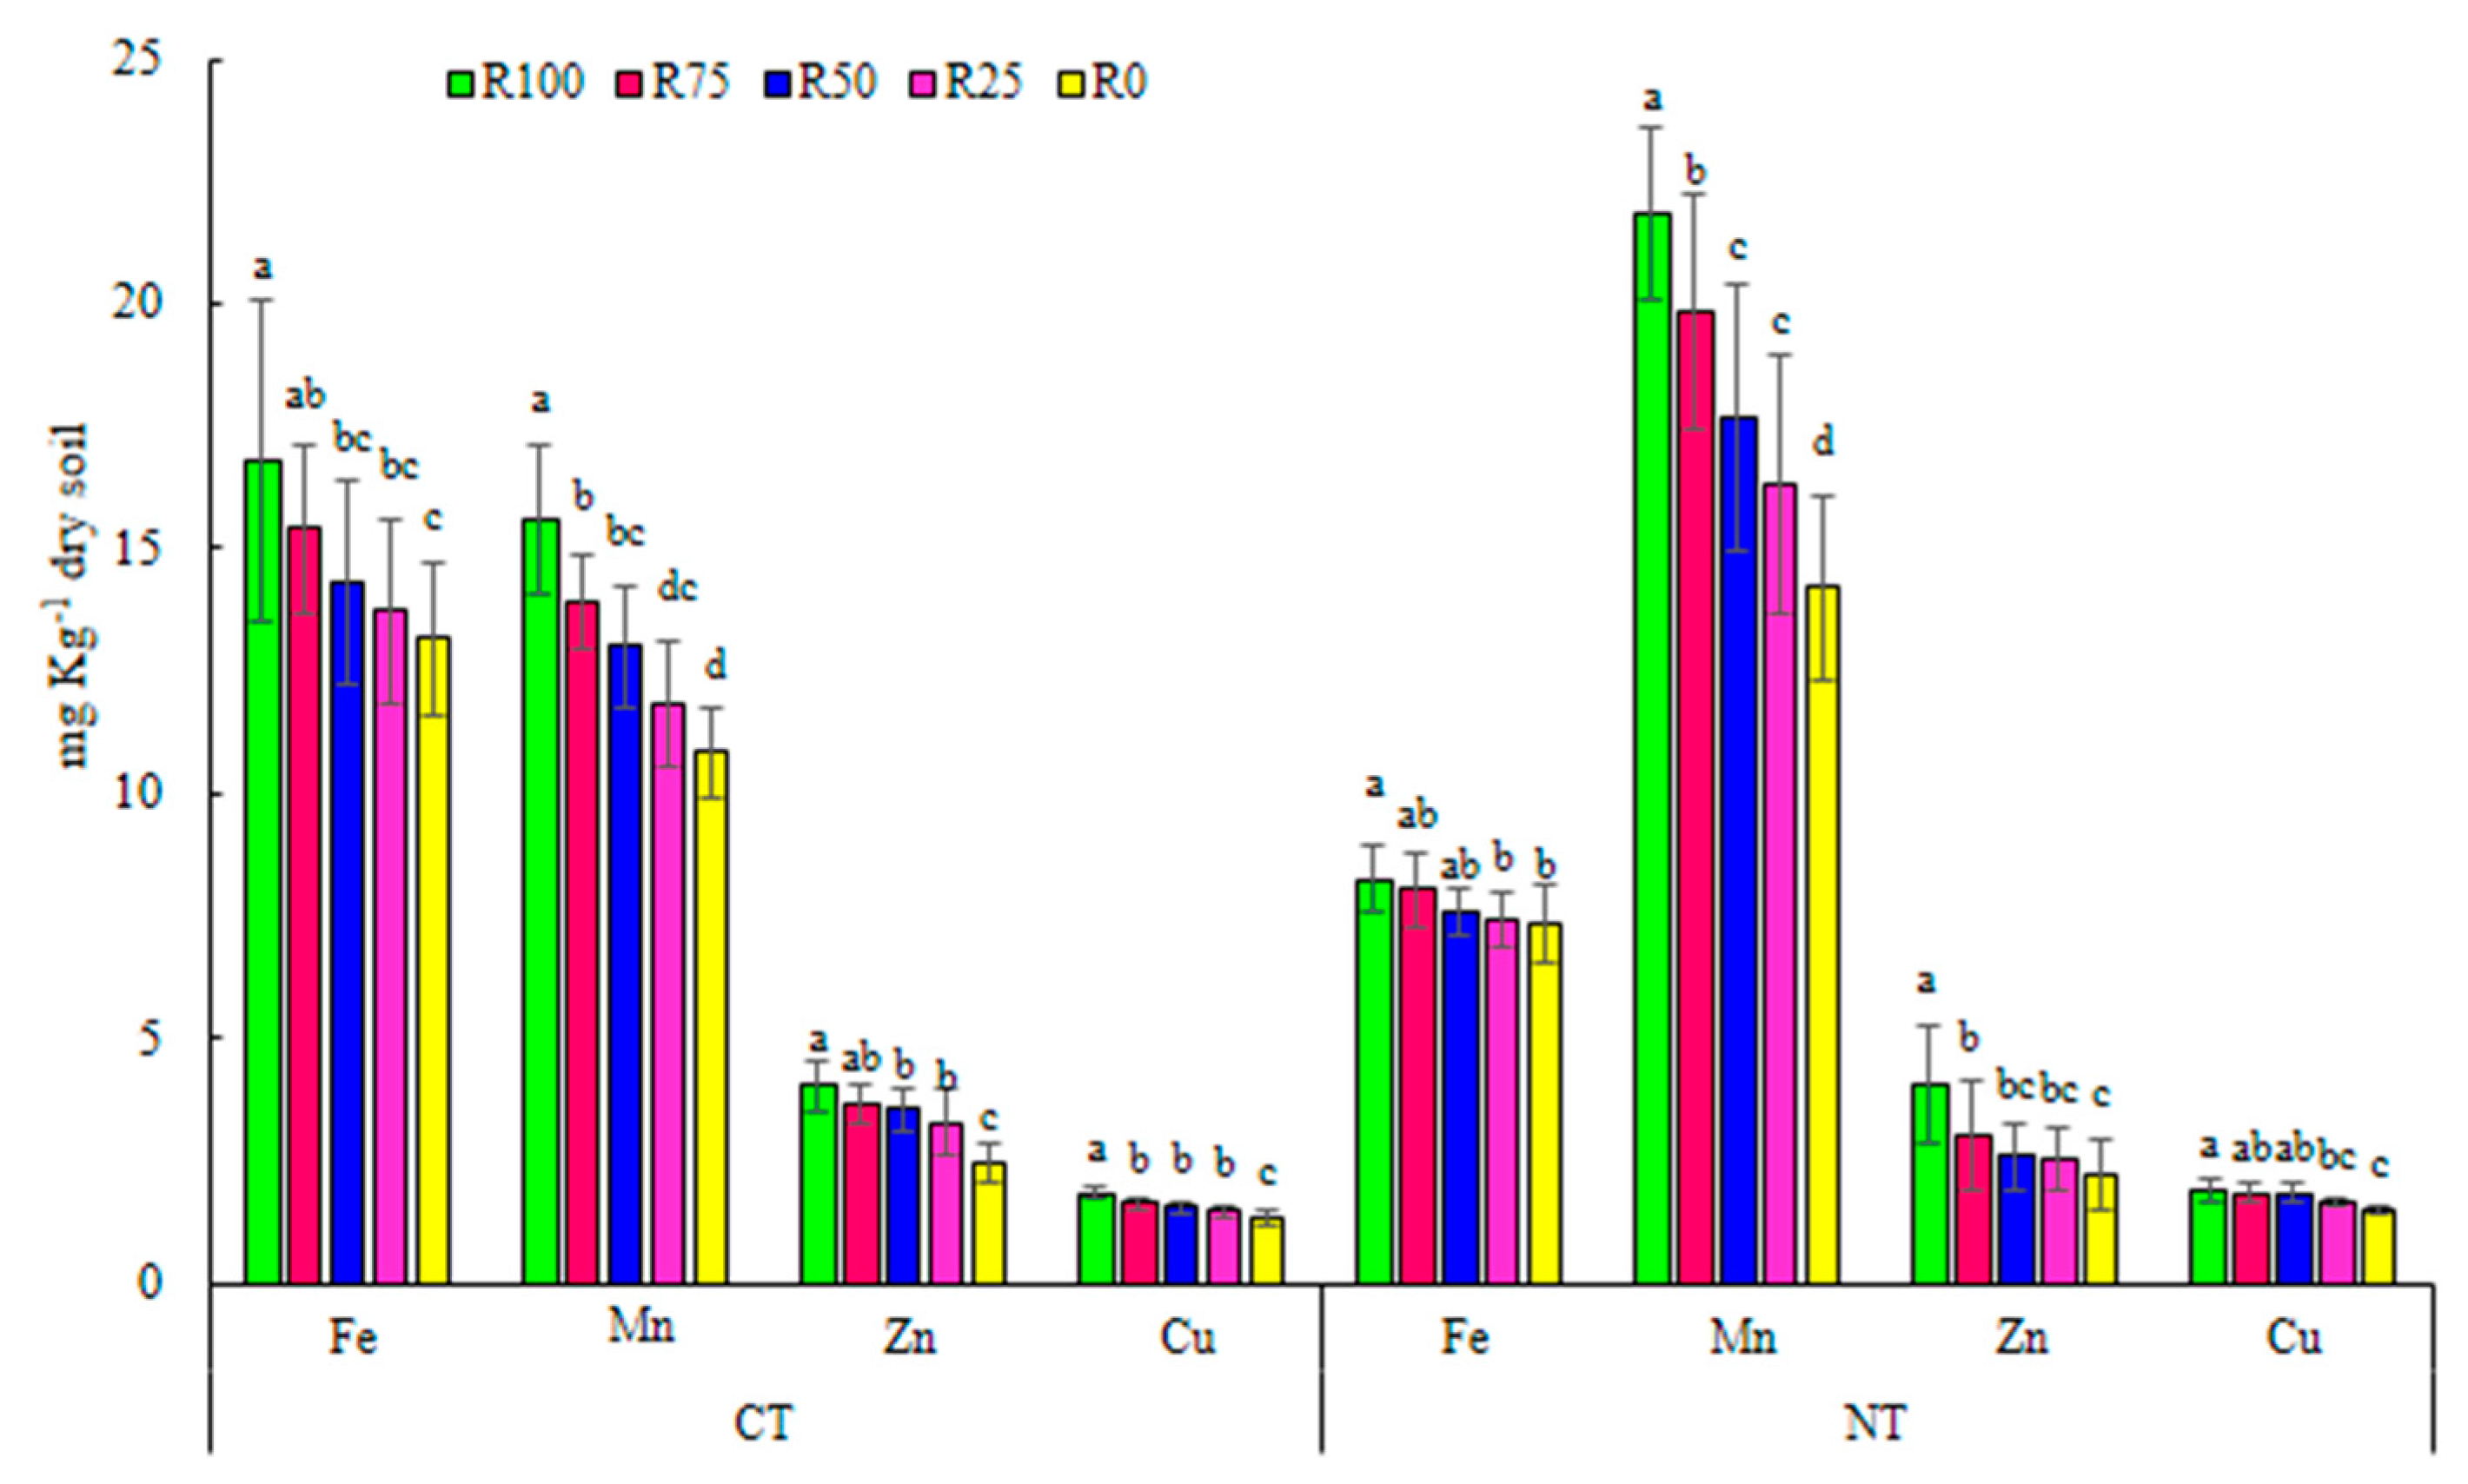
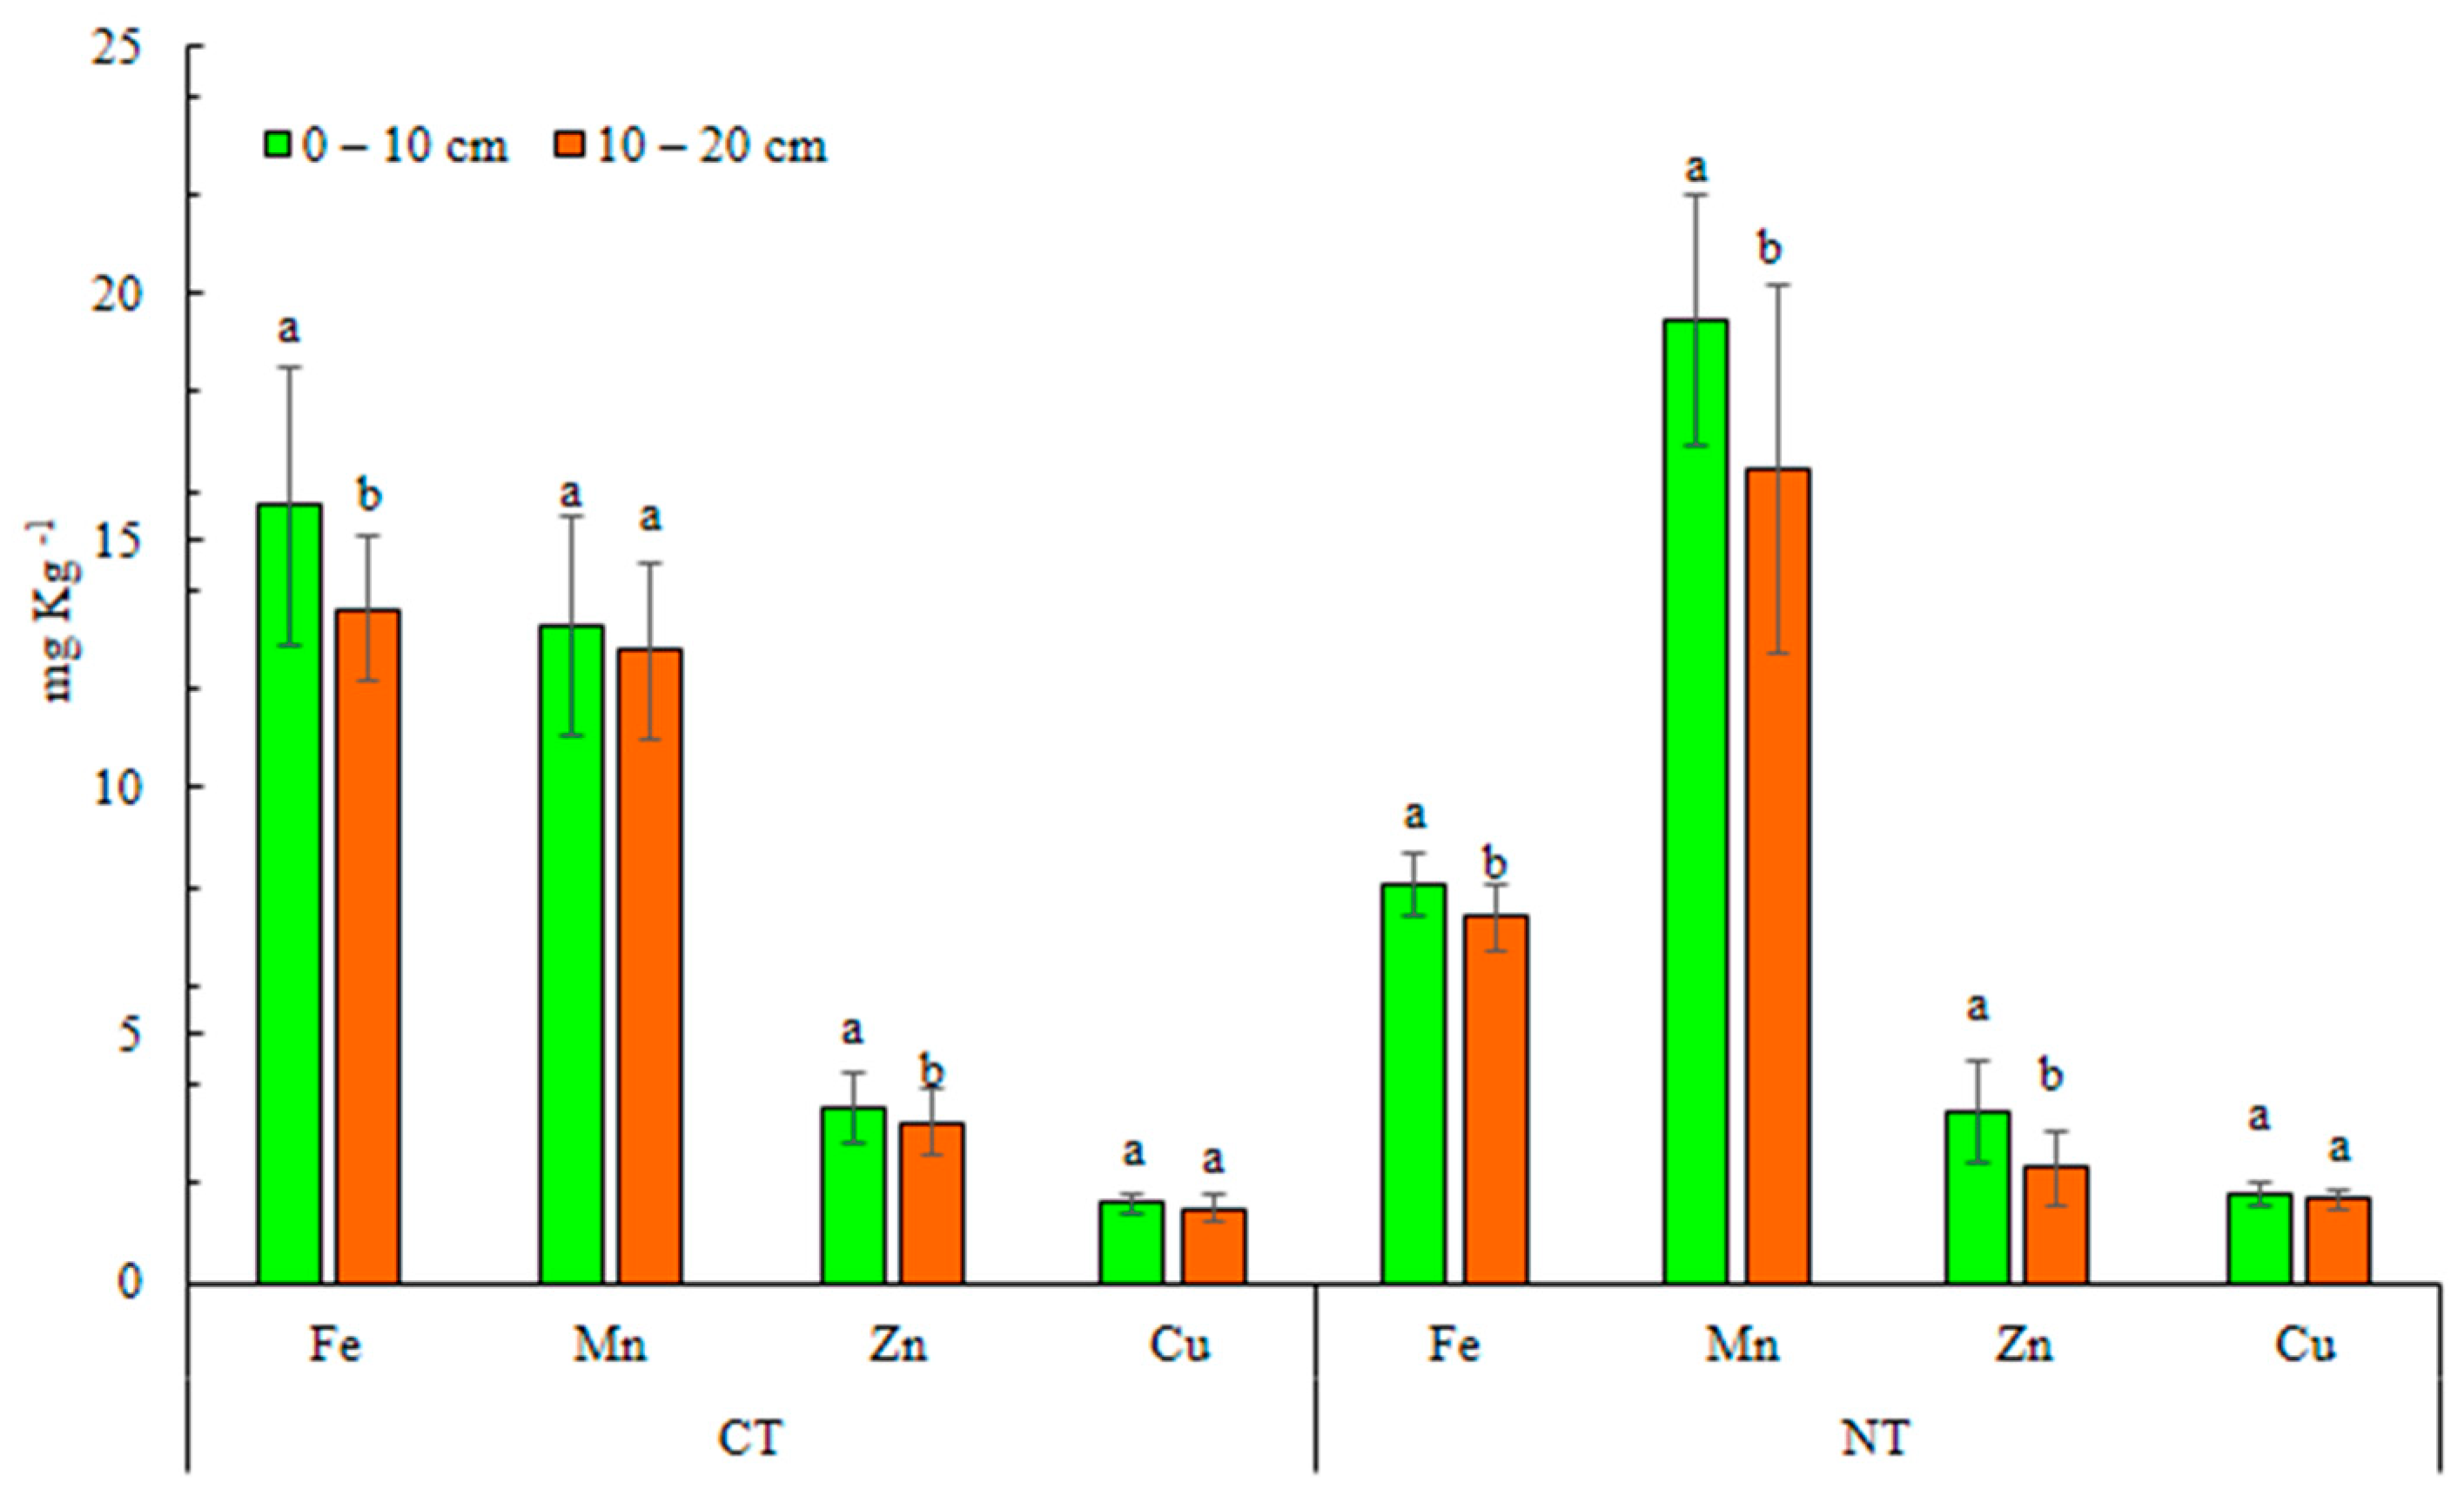
3.2.4. Micronutrients (Fe, Mn, Cu, Zn)

Residue addition increased micronutrients for both CT and NT systems. Applying higher residue rates resulted in higher concentrations of nutrients, with the highest values obtained from R100 (Figure 5). Augmentation of micronutrients with plant residue addition might be due to the chelating of organic materials that are released due to the decomposition of crop residue and contribute to micronutrients’ availability by preventing processes like leaching, oxidation, and fixation [9,75]. Among the micronutrients, only Mn was significantly (p < 0.05) influenced by the interaction effects of residue rates and tillage system (Table 4), where NTR100 resulted in the highest amount (21.8 mg kg−1) of Mn. Higher Mn content under NT has also been reported by other scholars [51,52]. Also, in the NT system, the values of micronutrients appeared to be significantly greater in 0–10 cm compared to 10–20 cm soil depth (Figure 6). The increased organic matter in the surface layers could be account for these results. Richards et al. [76] reported that soil organic matter increases micronutrients solubility and availability for plant uptake by forming chelates. These researchers suggested using organic amendments as an ideal source for areas with microelements deficit. Micronutrient deficiency is reported to decrease crop productivity [77]. Therefore, the application of crop residue is recognized as an effective strategy for enhancing soil micronutrients [9].

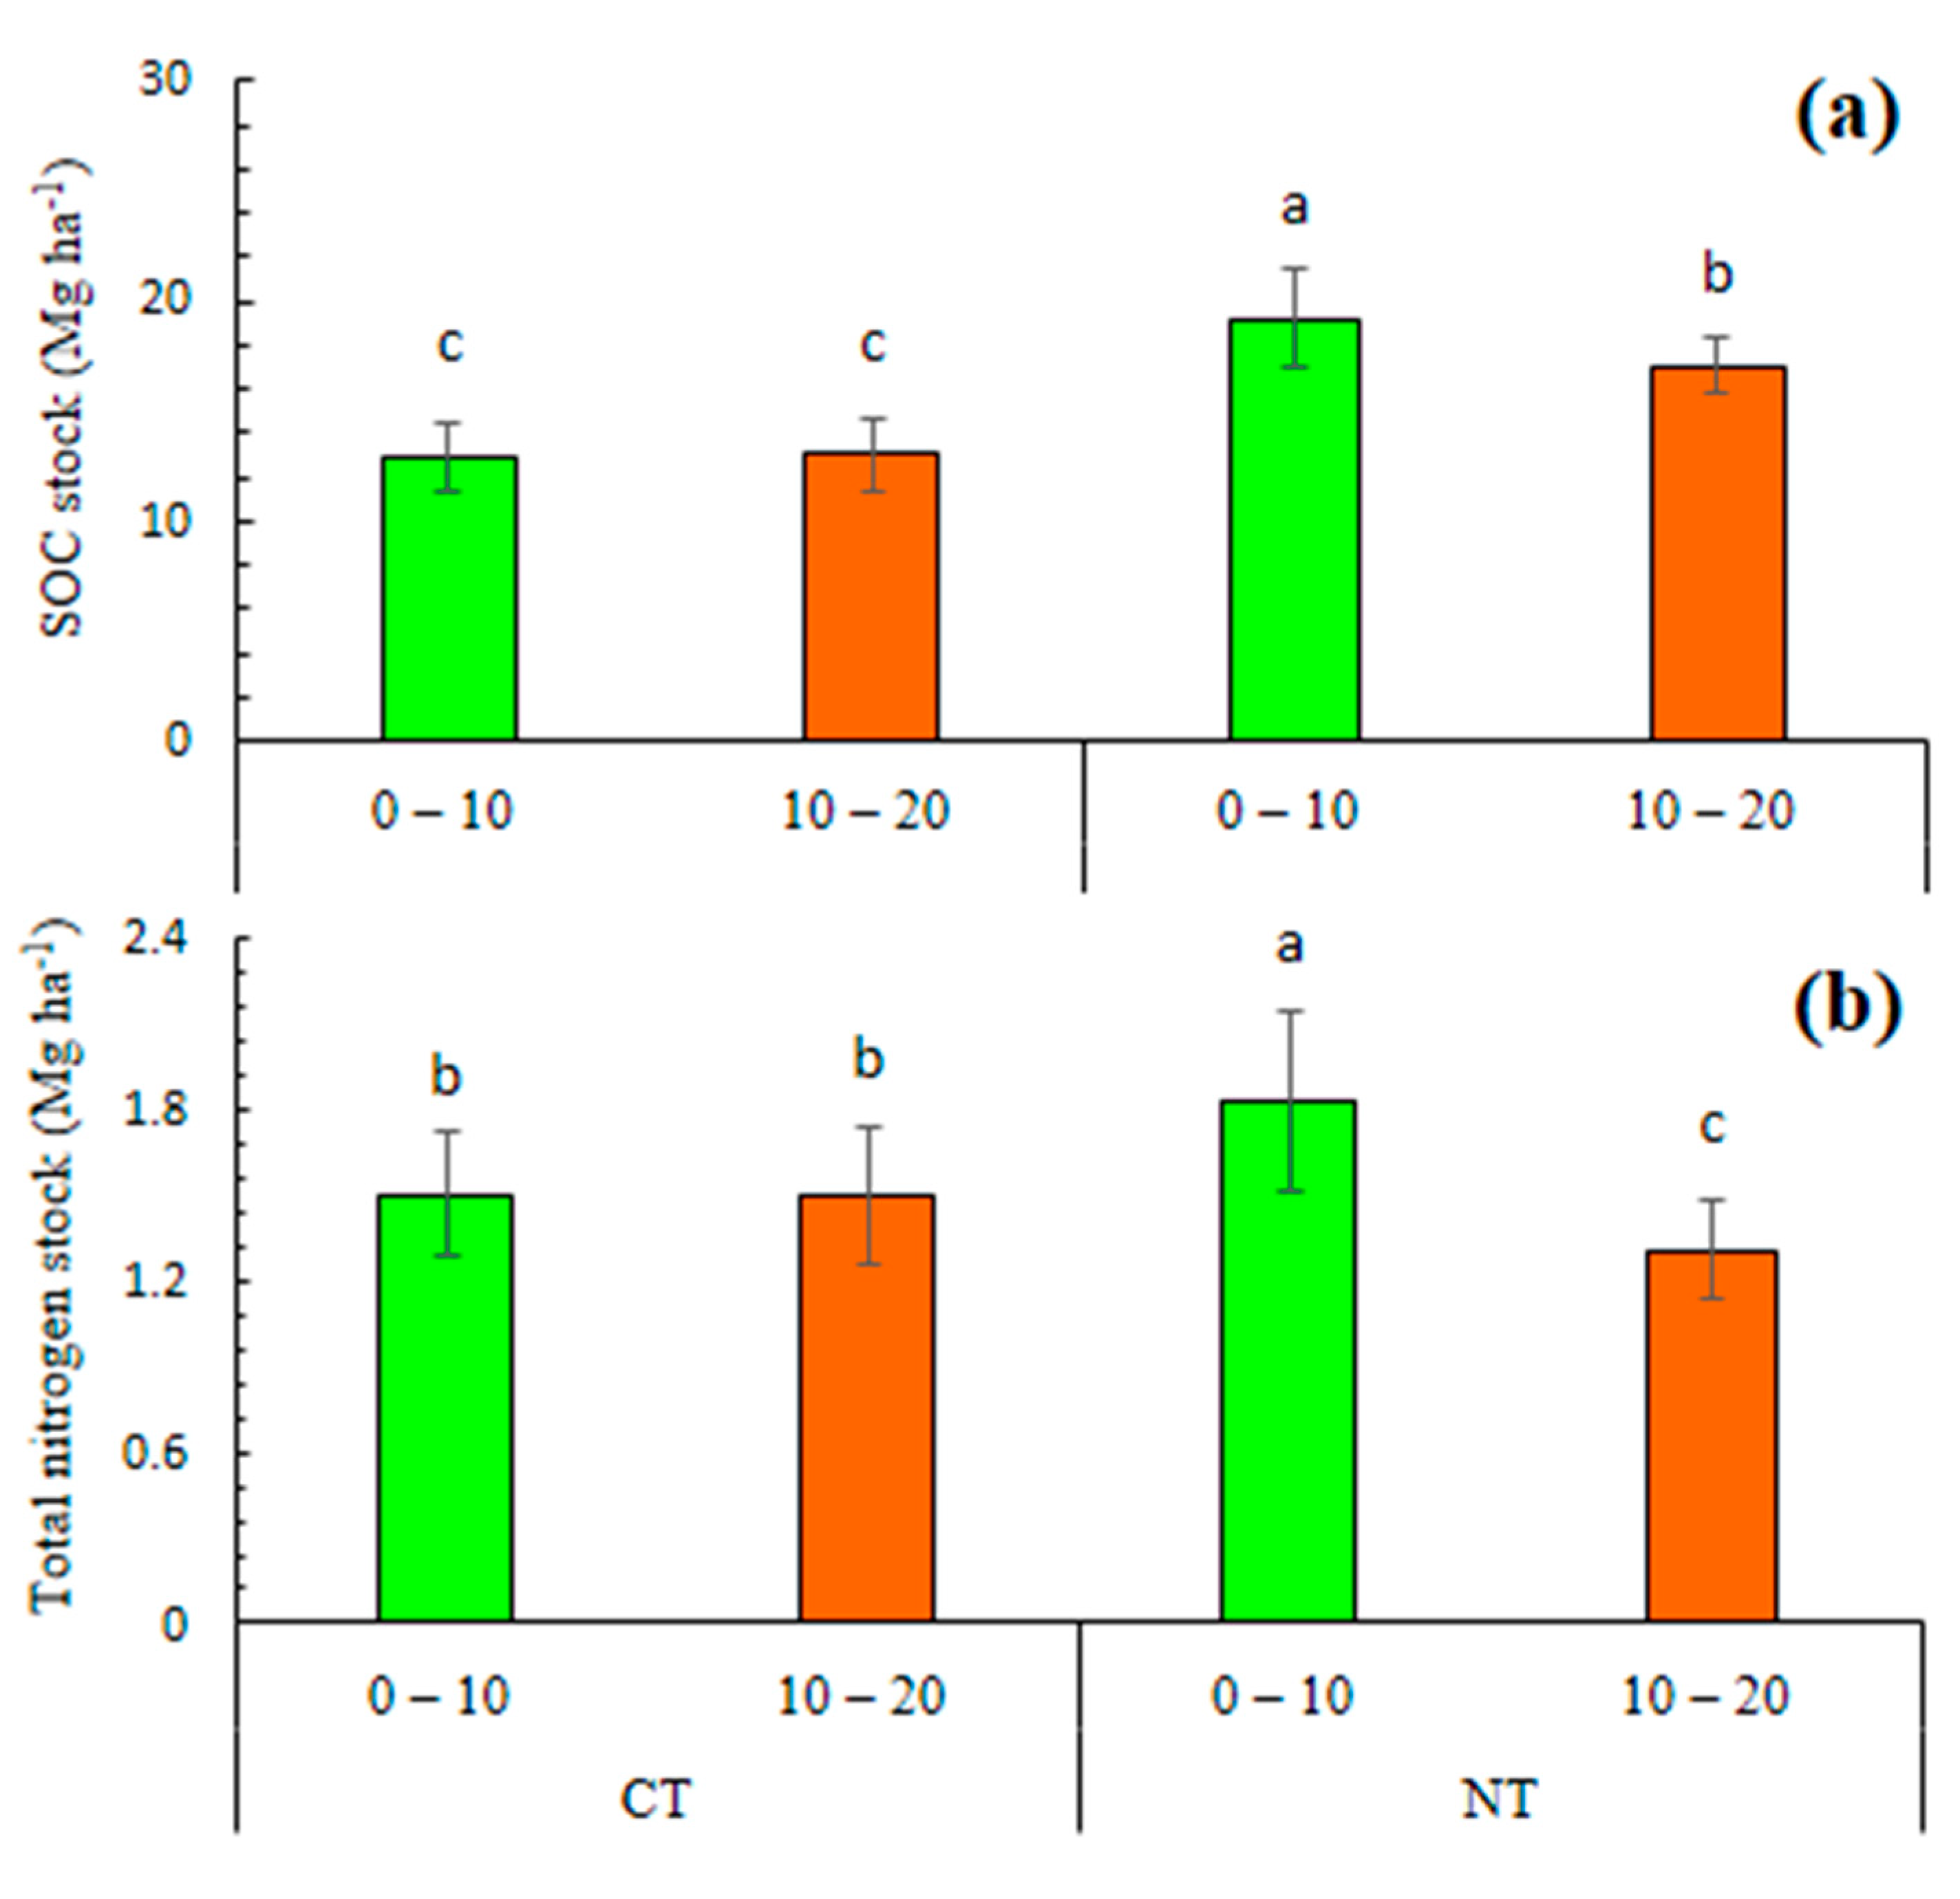
3.2.5. Soil Organic Carbon (SOC) and Total Nitrogen (TN) Stocks at 0–10 and 10–20 cm Soil Depths

The SOC stock at the 0–10 cm (19 Mg ha−1) was significantly higher (p < 0.05) than that to 10–20 cm (17 Mg ha−1) soil depth under NT system (Figure 7a). Whereas, under the CT system no significant differences were observed for SOC stock between two depths. Also, TN stock was significantly higher at the 0–10 cm (1.8 Mg ha−1) compared to that of 10–20 cm (1.3 Mg ha−1) under NT system (Figure 7b). By contrast, TN stocks were not significantly different between the two soil depths under CT system. Previous findings show that SOC and TN stocks are usually higher at the soil surface under conservative tillage than under conventional tillage [44,78,79], which is attributed to the less soil disturbance and mechanical operations, increased physical protection of soil organic matter by lower degradation of soil aggregates, and also lower microbial decomposition relative to conventional tillage. In addition, increasing crop biomass and retaining more residue under NT are accounted for higher SOC and TN stocks [39]. Furthermore, the fine-textured (clay loam) soil in the NT system in the current research, could also explain higher SOC and TN stocks. Clay-rich soils collect SOC more rapidly than sandy soils. It is assumed that at least two separate mechanisms protect the SOC by clay particles. First, chemical stabilization and adsorption of SOC onto negatively charged clay minerals with high surface area, and secondly by physically protection of SOC from microbial decomposition through the formation of soil aggregates [80]. Also, clay particles reduce N mineralization through the physical protection of organic N and chemical stabilization of humic substances which have high concentrations of organic N [80,81].

3.3. Soil Physical Properties

3.3.1. Aggregates Mean Weight Diameter in Wet (MWDw) and Dry Condition (MWDd) Conditions

Medium (R50) and higher rates of residue could enhance MWDW and MWDd significantly (p < 0.05) compared to residue removal (R0), while lower residue rates (R25) had no significant effect (Table 5 and Table 6). MWDw was not significantly affected by residue rate and soil tillage interactions effects, but MWDd was significantly (p < 0.05) affected by this effect. The highest (1.74 mm) and the lowest (1.36) values of MWDd were measured in NTR100 and CTR0 respectively (Table 7). Higher values of aggregates mean weight diameter under NT and higher residue retention treatments have also been reported previously in short term and long term studies [82,83,84,85,86]. Reduced MWD in the CT system is mainly due to the breakdown of soil aggregates by the plow, and physical disturbance of soil structure [82]. Furthermore, in the current study, coarse soil texture (sandy loam) under CT, create a suitable condition for rapid soil organic matter decomposition and reduce aggregate resistance against destructive forces [86,87]. The increase of MWD under NT system could be related to clay texture as well as less mechanical disturbance and decomposition of crop residue which caused greater biological activity and consequently led to the creation of larger stable aggregates.
MWDW and MWDd were significantly (p < 0.05) larger at 0–10 cm than that of 10–20 cm under the NT system (Table 6). Sithole et al. [71] also found a significantly higher MWD in the 0–10 cm under NT system. Similar to our findings, the other studies have shown that inputs of crop residue increase MWD [70,88]. The increase in MWDw and MWDd indices in the residue treatments compared to the residue removal can mainly be attributed to the increase in organic carbon in these treatments, which had a positive linear relationship with SOC (Figures S1 and S2). In a various research, it has been reported that organic carbon as a binding agent improves larger aggregate formation and leads to increased MWD [89,90]. The stability of soil aggregates has a positive relationship with the amount of soil organic matter added to the soil [91]. Whereas the removal of plant residue causes structural degradation and reduces the stability of soil aggregates [8,92]. The addition of crop residue performs several positive functions for soil structural improvement and aggregate stability. The presence of crop residue reduces the force of raindrops and moderates the destructive effects of repeated soil freezing and thawing, which help to stabilize the soil aggregates [93]. It also stimulates soil microbial activity and releases organic compounds that play a positive role in the binding of soil particles to each other and increasing aggregate stability [8].

3.3.2. Water-Stable Aggregates (WSA) and Dry-Stable Aggregates (DSA)

In CT and NT systems, WSA and DSA indexes responded positively to residue addition compared to no residue treatment (R0) (Table 5 and Table 6). Also, a significant increase (p < 0.05) in WSA and DSA indexes was observed at 0–10 cm compared to 10–20 cm under the NT system (Table 6), but the interaction effects of residue rate and tillage system were not significant for both parameters. Aggregate stability is one of the most sensitive soil properties to the removal of plant residue, which decreases with the reduction of plant residue. The main reason for increased WSA and DSA indexes in residue treatments can be attributed to the increased organic matter in these treatments. Organic carbon from the decomposition of plant residue acts as a cementing agent that leads to the aggregation of primary soil particles and the formation of stable aggregates. WSA and DSA positively correlated with soil organic carbon under CT and NT systems, (Figures S1 and S2). A positive correlation between aggregate stability and soil organic matter content has also been reported previously [91]. Removal of crop residue from cropland weakened soil aggregates by limiting the number of binder compounds produced for aggregation as well as further susceptibility of soil aggregates to disruption by raindrop impacts [8,68,82]. Many studies have reported significant reductions in aggregate stability with increased crop residue removal [92,94].
On the one hand, crop residue application results in the intensification of microbial activity as a major factor in aggregation processes and the formation of coarse aggregates [95,96]. On the other hand, the addition of crop residue leads to an increase in soil organic matter and the formation of stable aggregates, thereby reducing their decay [8]. In addition, the existence of crop residue modulates the temperature and humidity fluctuations in the soil surface and prevents the loss of soil organic matter and destruction of aggregates [97]. The reason for the increase in WSA and DSA indexes at a depth of 0–10 cm compared to a depth of 10–20 cm is probably due to the increase in biomass from residue to the soil as a result of more activity of soil organisms, which causes the formation of coarse aggregates, especially in the surface layer, which is similar to the findings of [89].

3.3.3. Available Water

Residue treatments, including R25 to R100, resulted in a significant (p < 0.05) increase in available water compared to the R0 (Table 5 and Table 6). Soil available water was also significantly (p < 0.05) influenced by interactions effects of residue rate and tillage system (Table 7). The highest value (27%) of this parameter was recorded in NT with full retention of crop residue (NTR100), while the lowest (~15%) values were observed under CT without residue application (CTR0). The present results are in agreement with the findings of the others [70,98]. In the NT, soil layer of 0–10 cm had significantly higher available water content than that of 10–20 cm, whereas, in CT, the differences between two depths were not significant (Table 5 and Table 6). Application of residues in the NT system reduced runoff and evaporation. In addition, the fine soil texture prevents rapid moisture loss, while in the CT system, mixing of crop residue by tillage well as coarse soil texture caused faster decomposition and reduce positive effects of crop residue on moisture retention [70,99,100]. In addition, probably in the sandy loam soil under CT system, more water from deep layer moving up to surface via capillar and evaporate which resulted in lower water retention in this system.
Crop residue improved soil water content by (1) improving soil infiltration rate, (2) preventing water loss by evaporation and reducing soil temperature fluctuations, and (3) increasing SOM concentration, which increases water holding capacity of the soil [17]. Also, increasing the amount of available water as a result of adding more residue can be attributed to improving soil structure and aggregate stability. Moreover, creating favorable conditions for soil microbial growth and activity, which can increase the number of small and large soil pores as well as better infiltration of water [95] could be another reason [100]. The positive correlation between soil available water versus SOC concentration in both CT and NT systems implies that an increase in SOC levels, via an increasing the plant residue rates, resulted in greater soil available water (Figures S1 and S2). Avoiding mechanical soil disturbance, more accumulation of organic matter, maintaining a permanent soil cover by crop residue, and abundance of stable aggregates indicates the greater available water content at a depth of 0–10 cm compared to 10–20 cm in the no-till system. Higher soil water content in surface layers of NT, due to crop residue mulch was also observed by [101].

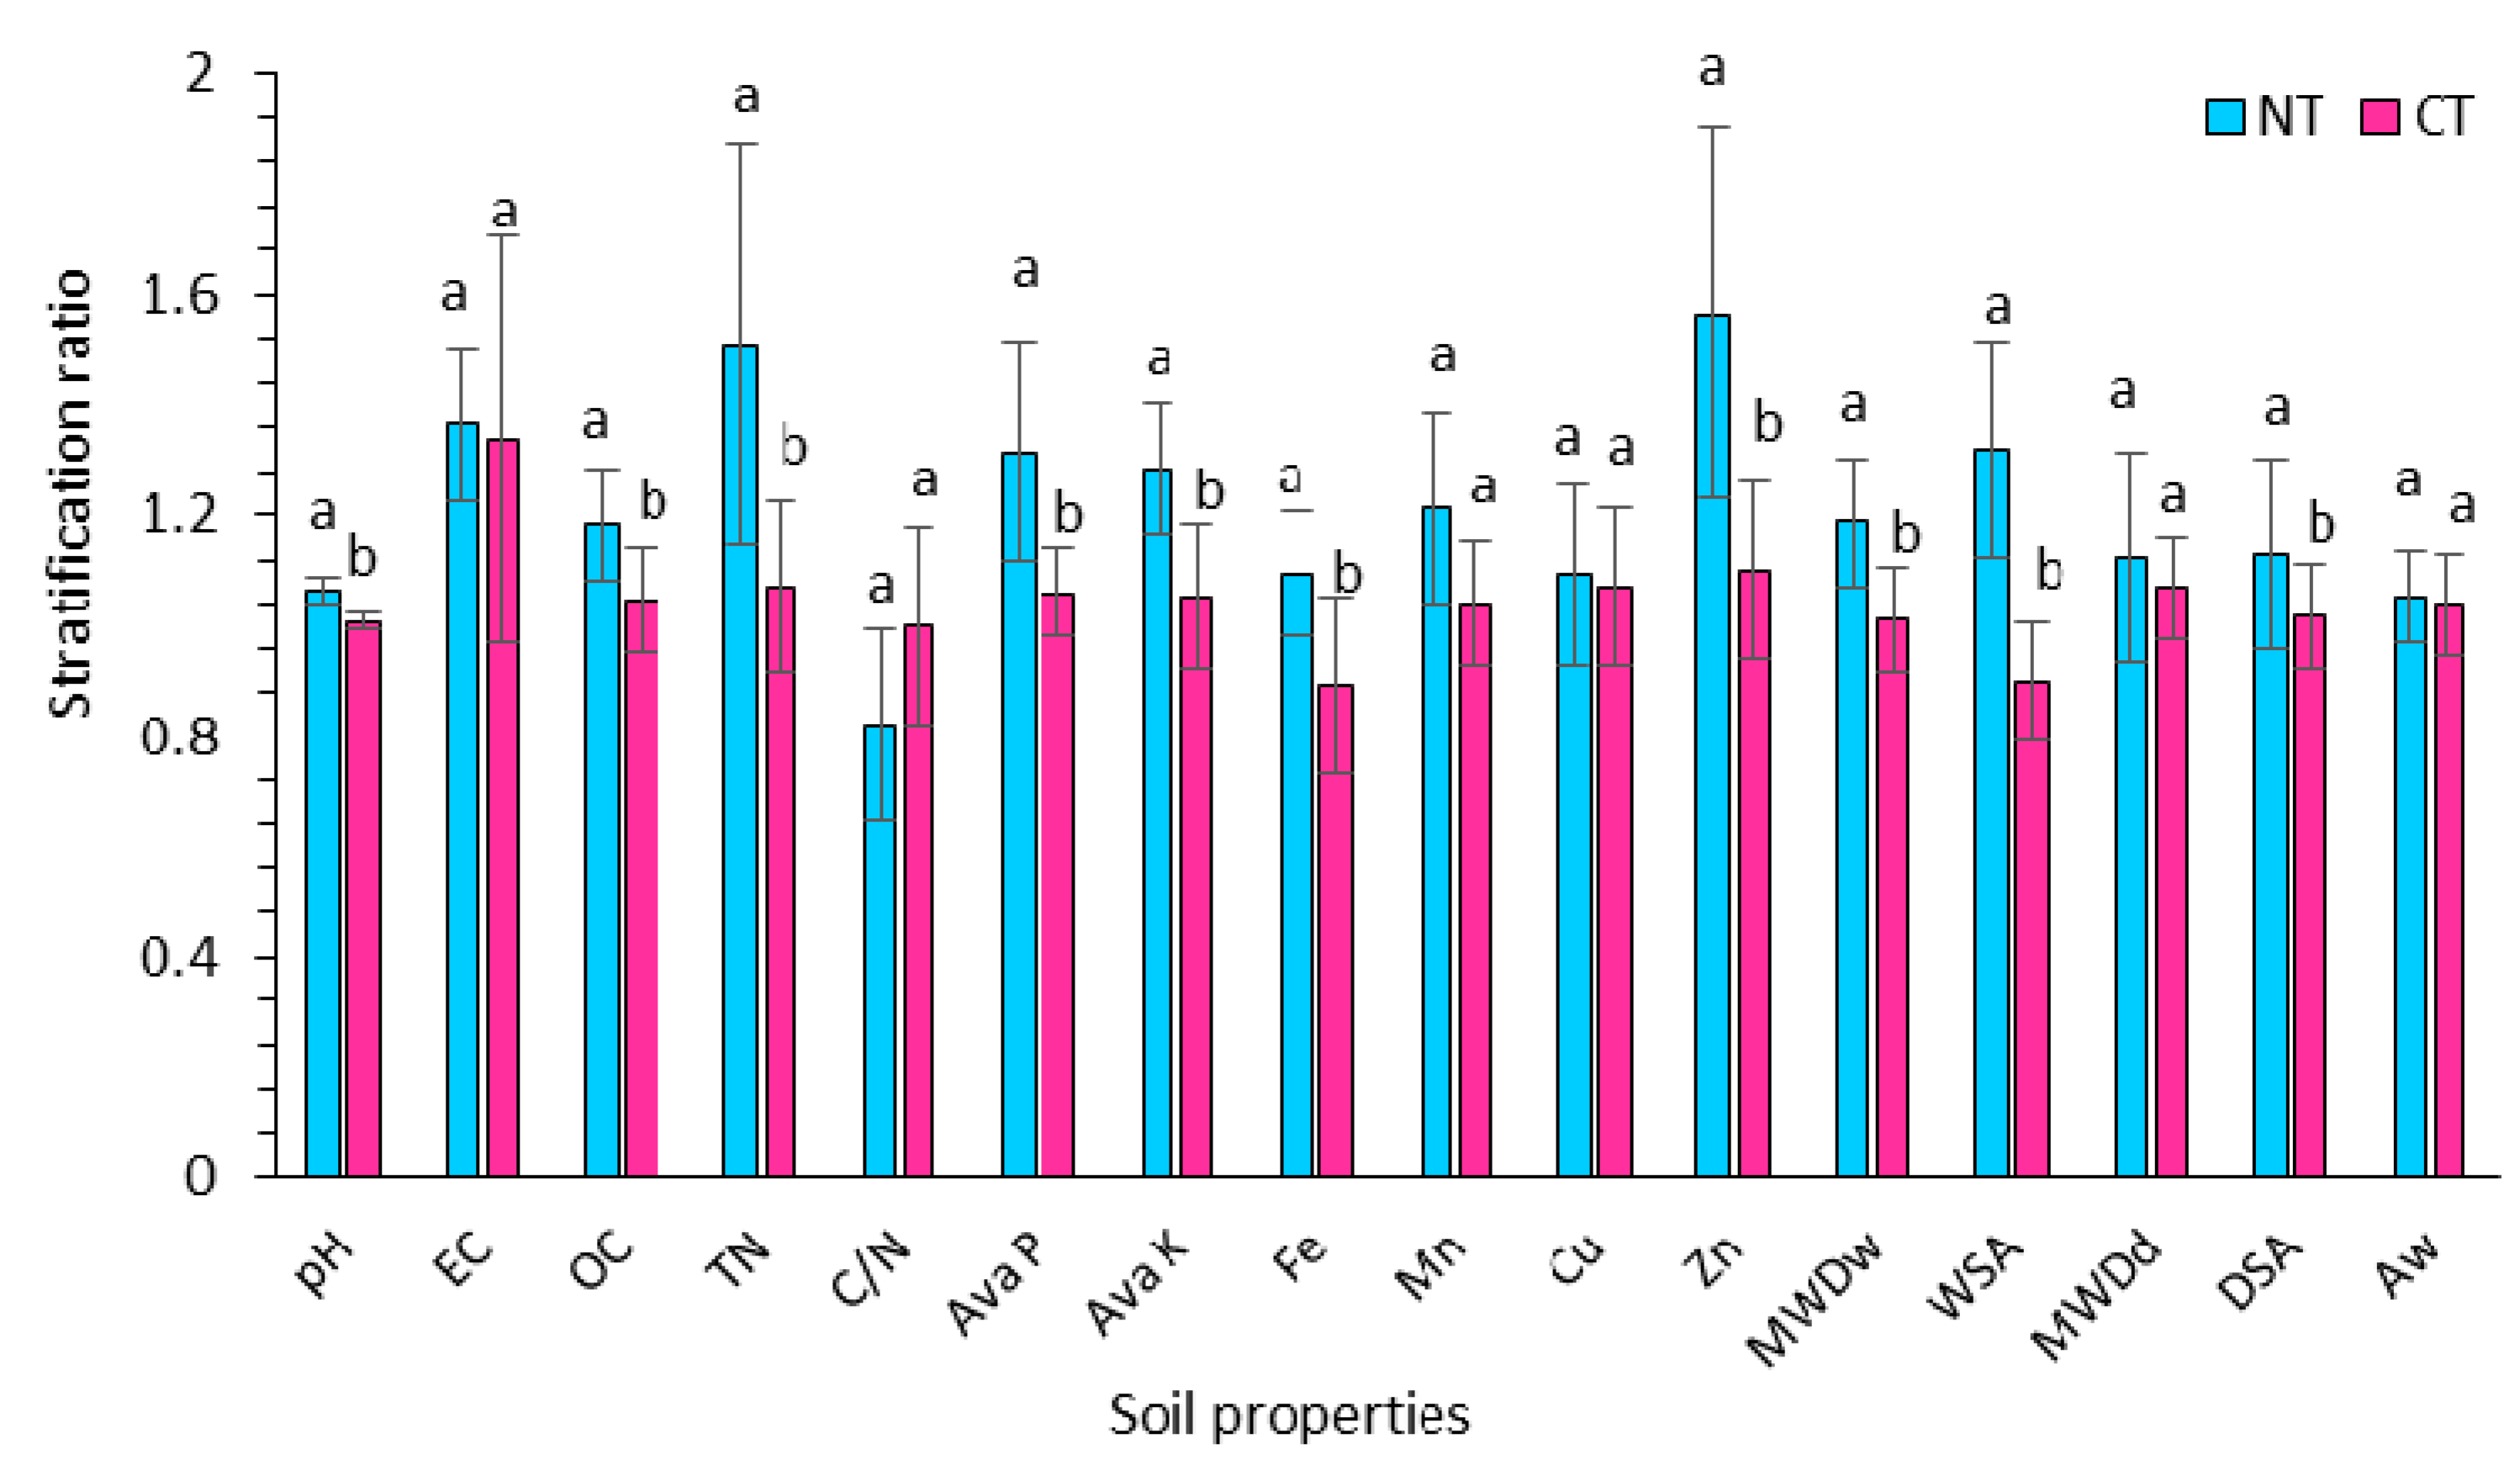
3.4. Stratification Ratio (SR) of Soil Properties

The values of SR were greater in NT than CT and in most cases, significant increases (p < 0.05) were observed in NT compared to CT system (Figure 8). These results are similar to those previously found by the other authors [40,72,102,103]. The increased SR under NT system is the result of an accumulation of crop residue and SOC on the soil surface and thus improvement of soil quality at the soil surface [39,104,105,106]. Lower values of SR in CT system is probably due to incorporating of crop residue with plow which homogenized the crop residue distribution with soil depth and slightly stratified it.

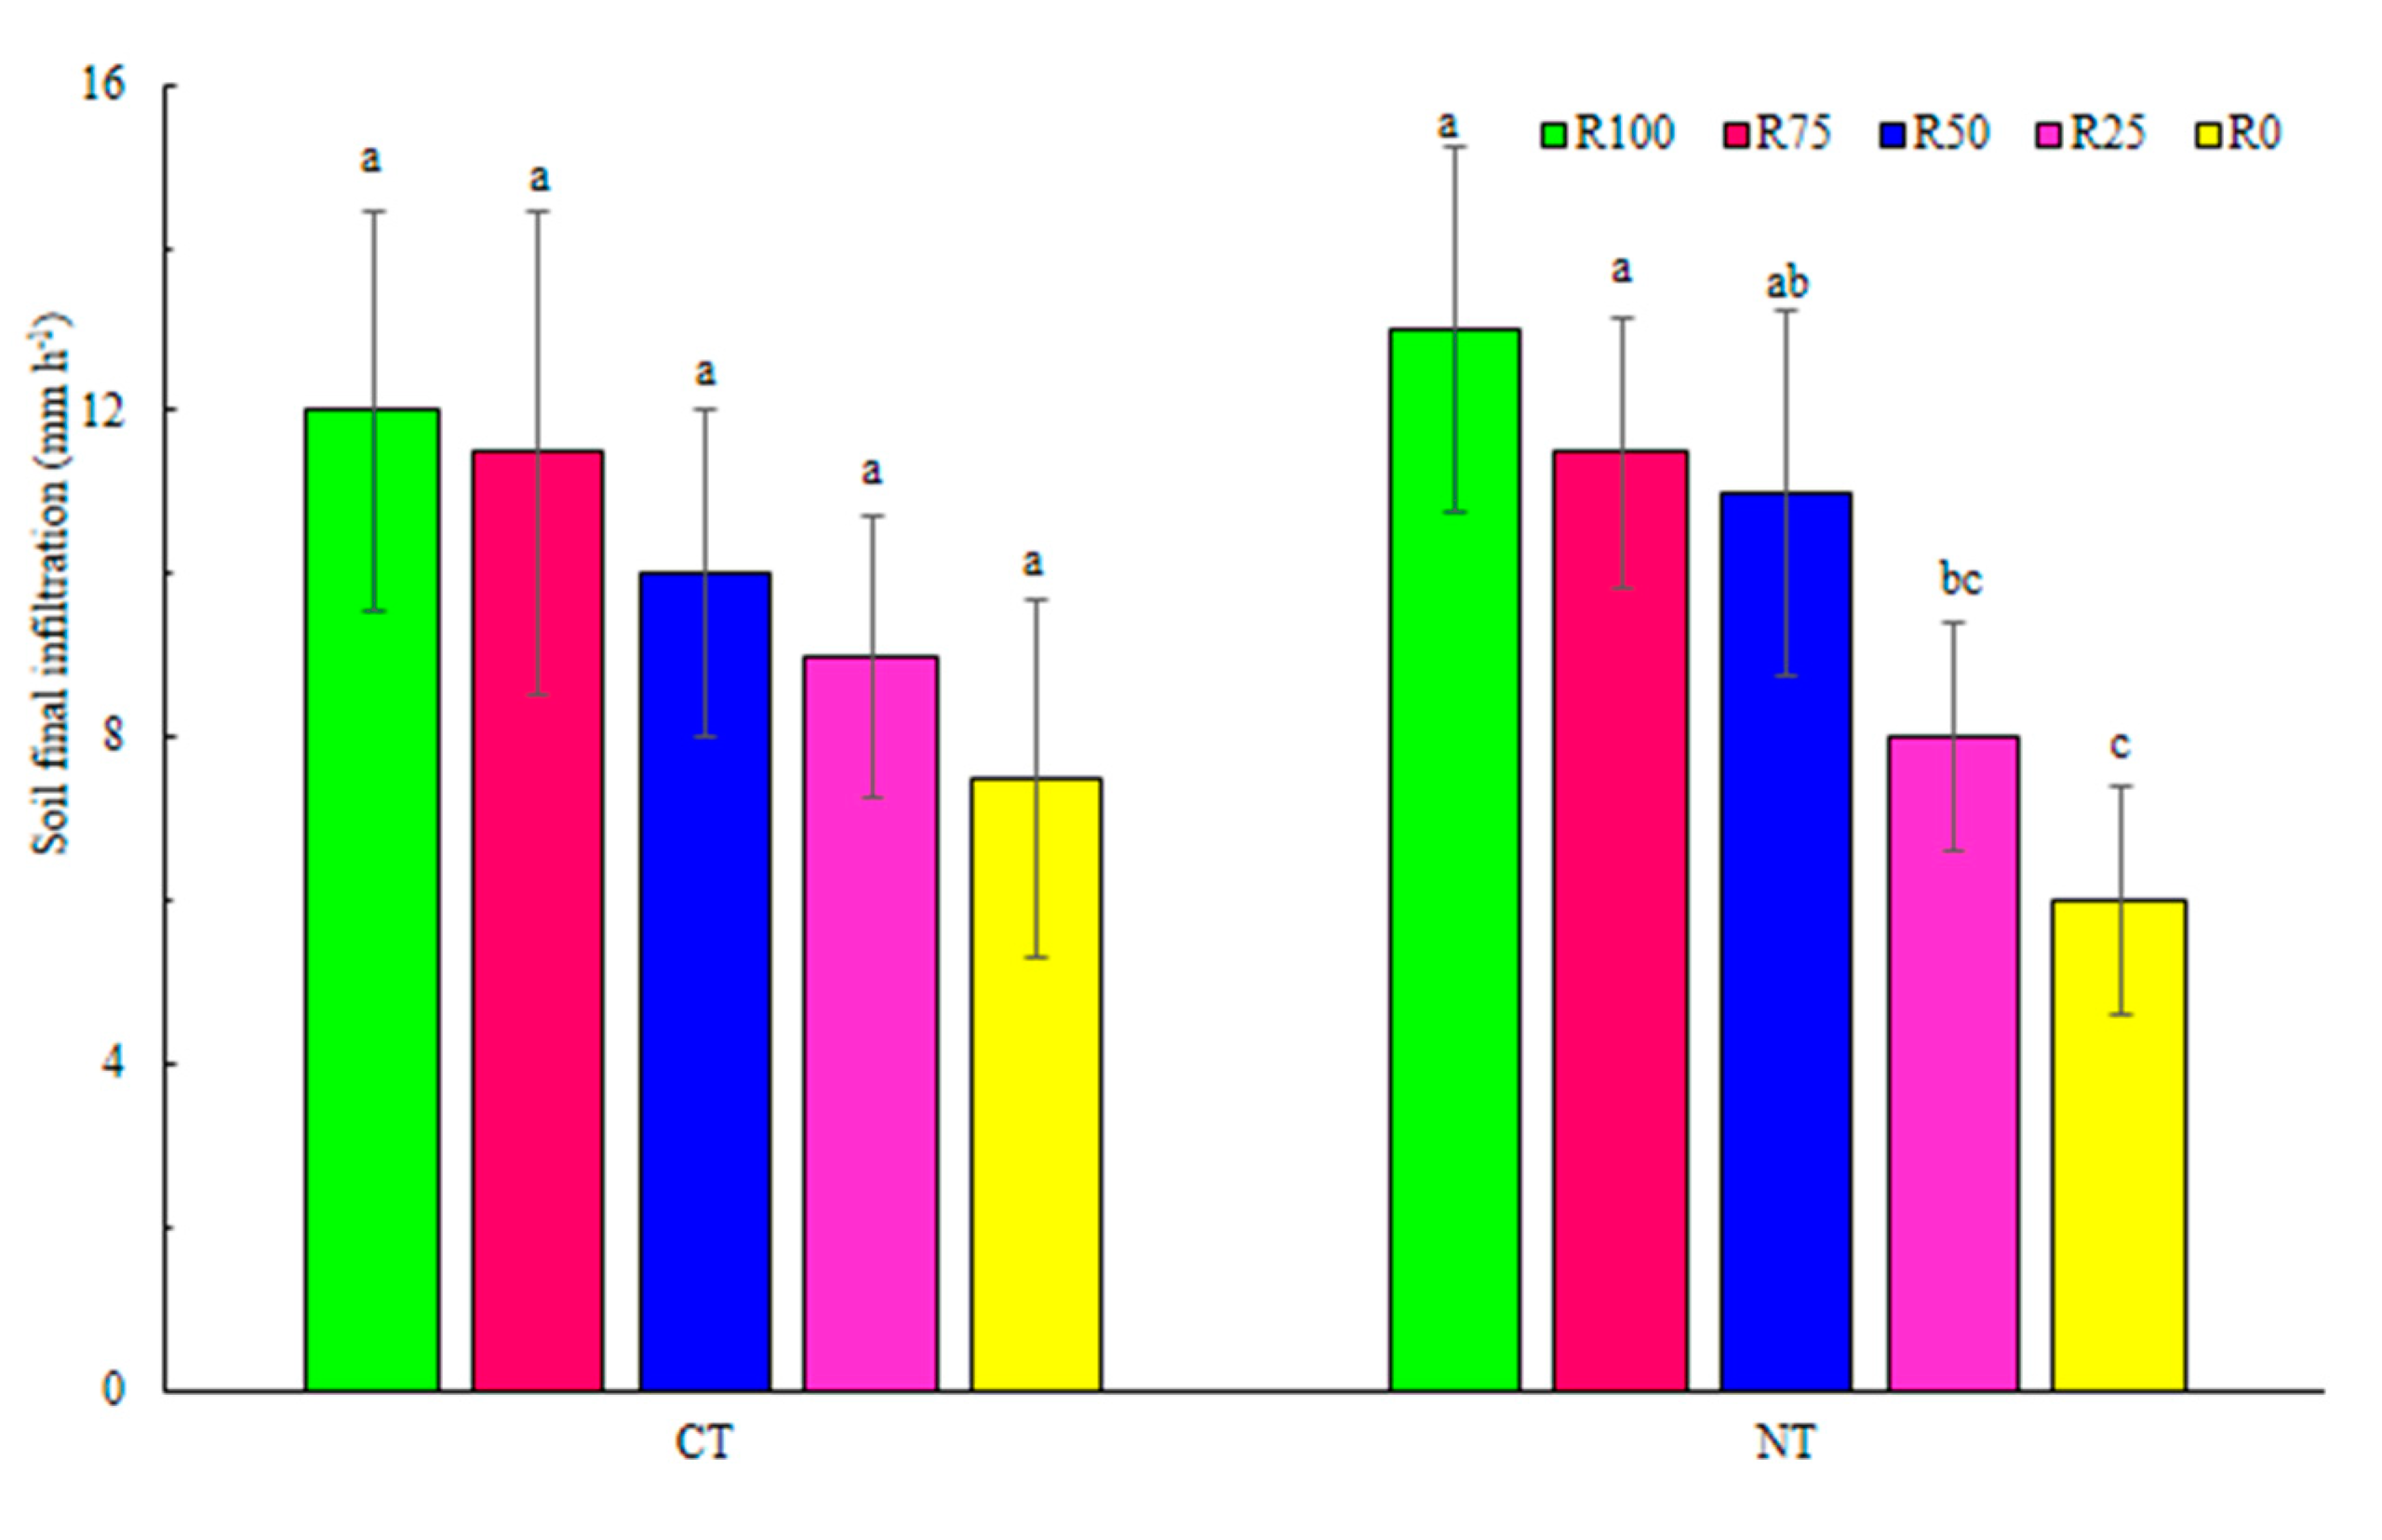
3.5. Soil Infiltration Rate

The results showed that increasing crop residue enhanced the final soil infiltration in the CT system, but no significant differences were noticed among the residue treatments (Figure 9). In the NT system, R50 and higher rates significantly (p < 0.05)) increased final soil infiltration compared to R0. The interaction effects of crop residue and soil tillage had no significant effect on soil final infiltration (Figure 10). The highest value of final soil infiltration (13 mm hr−1) was recorded in R100 (Figure 9). Higher SOC content, greater stability of soil aggregates, improved soil porosity, which plays significant roles in increasing soil physical and hydrological properties, are the reasons for higher soil infiltration under residue treatments [99]. According to our results, Johnson et al. [107] reported that soil infiltration was two times higher under the full return of residue (>7 Mg ha–1) than under less return of residue (<2 Mg ha–1). Also, Chalise et al. [69] found a 66% increase in soil infiltration under residue retention compared to no residue in a no-till corn-soybean rotation. Besides, Blanco-Canqui et al. [25] in Ohio found four-times lower soil infiltration with none residue (0%) than 100% residue. These reductions were attributed to soil surface sealing or crusting, consolidation caused by raindrops impacting the unmulched soil surface, and lower surface-connected earthworm burrows [25].

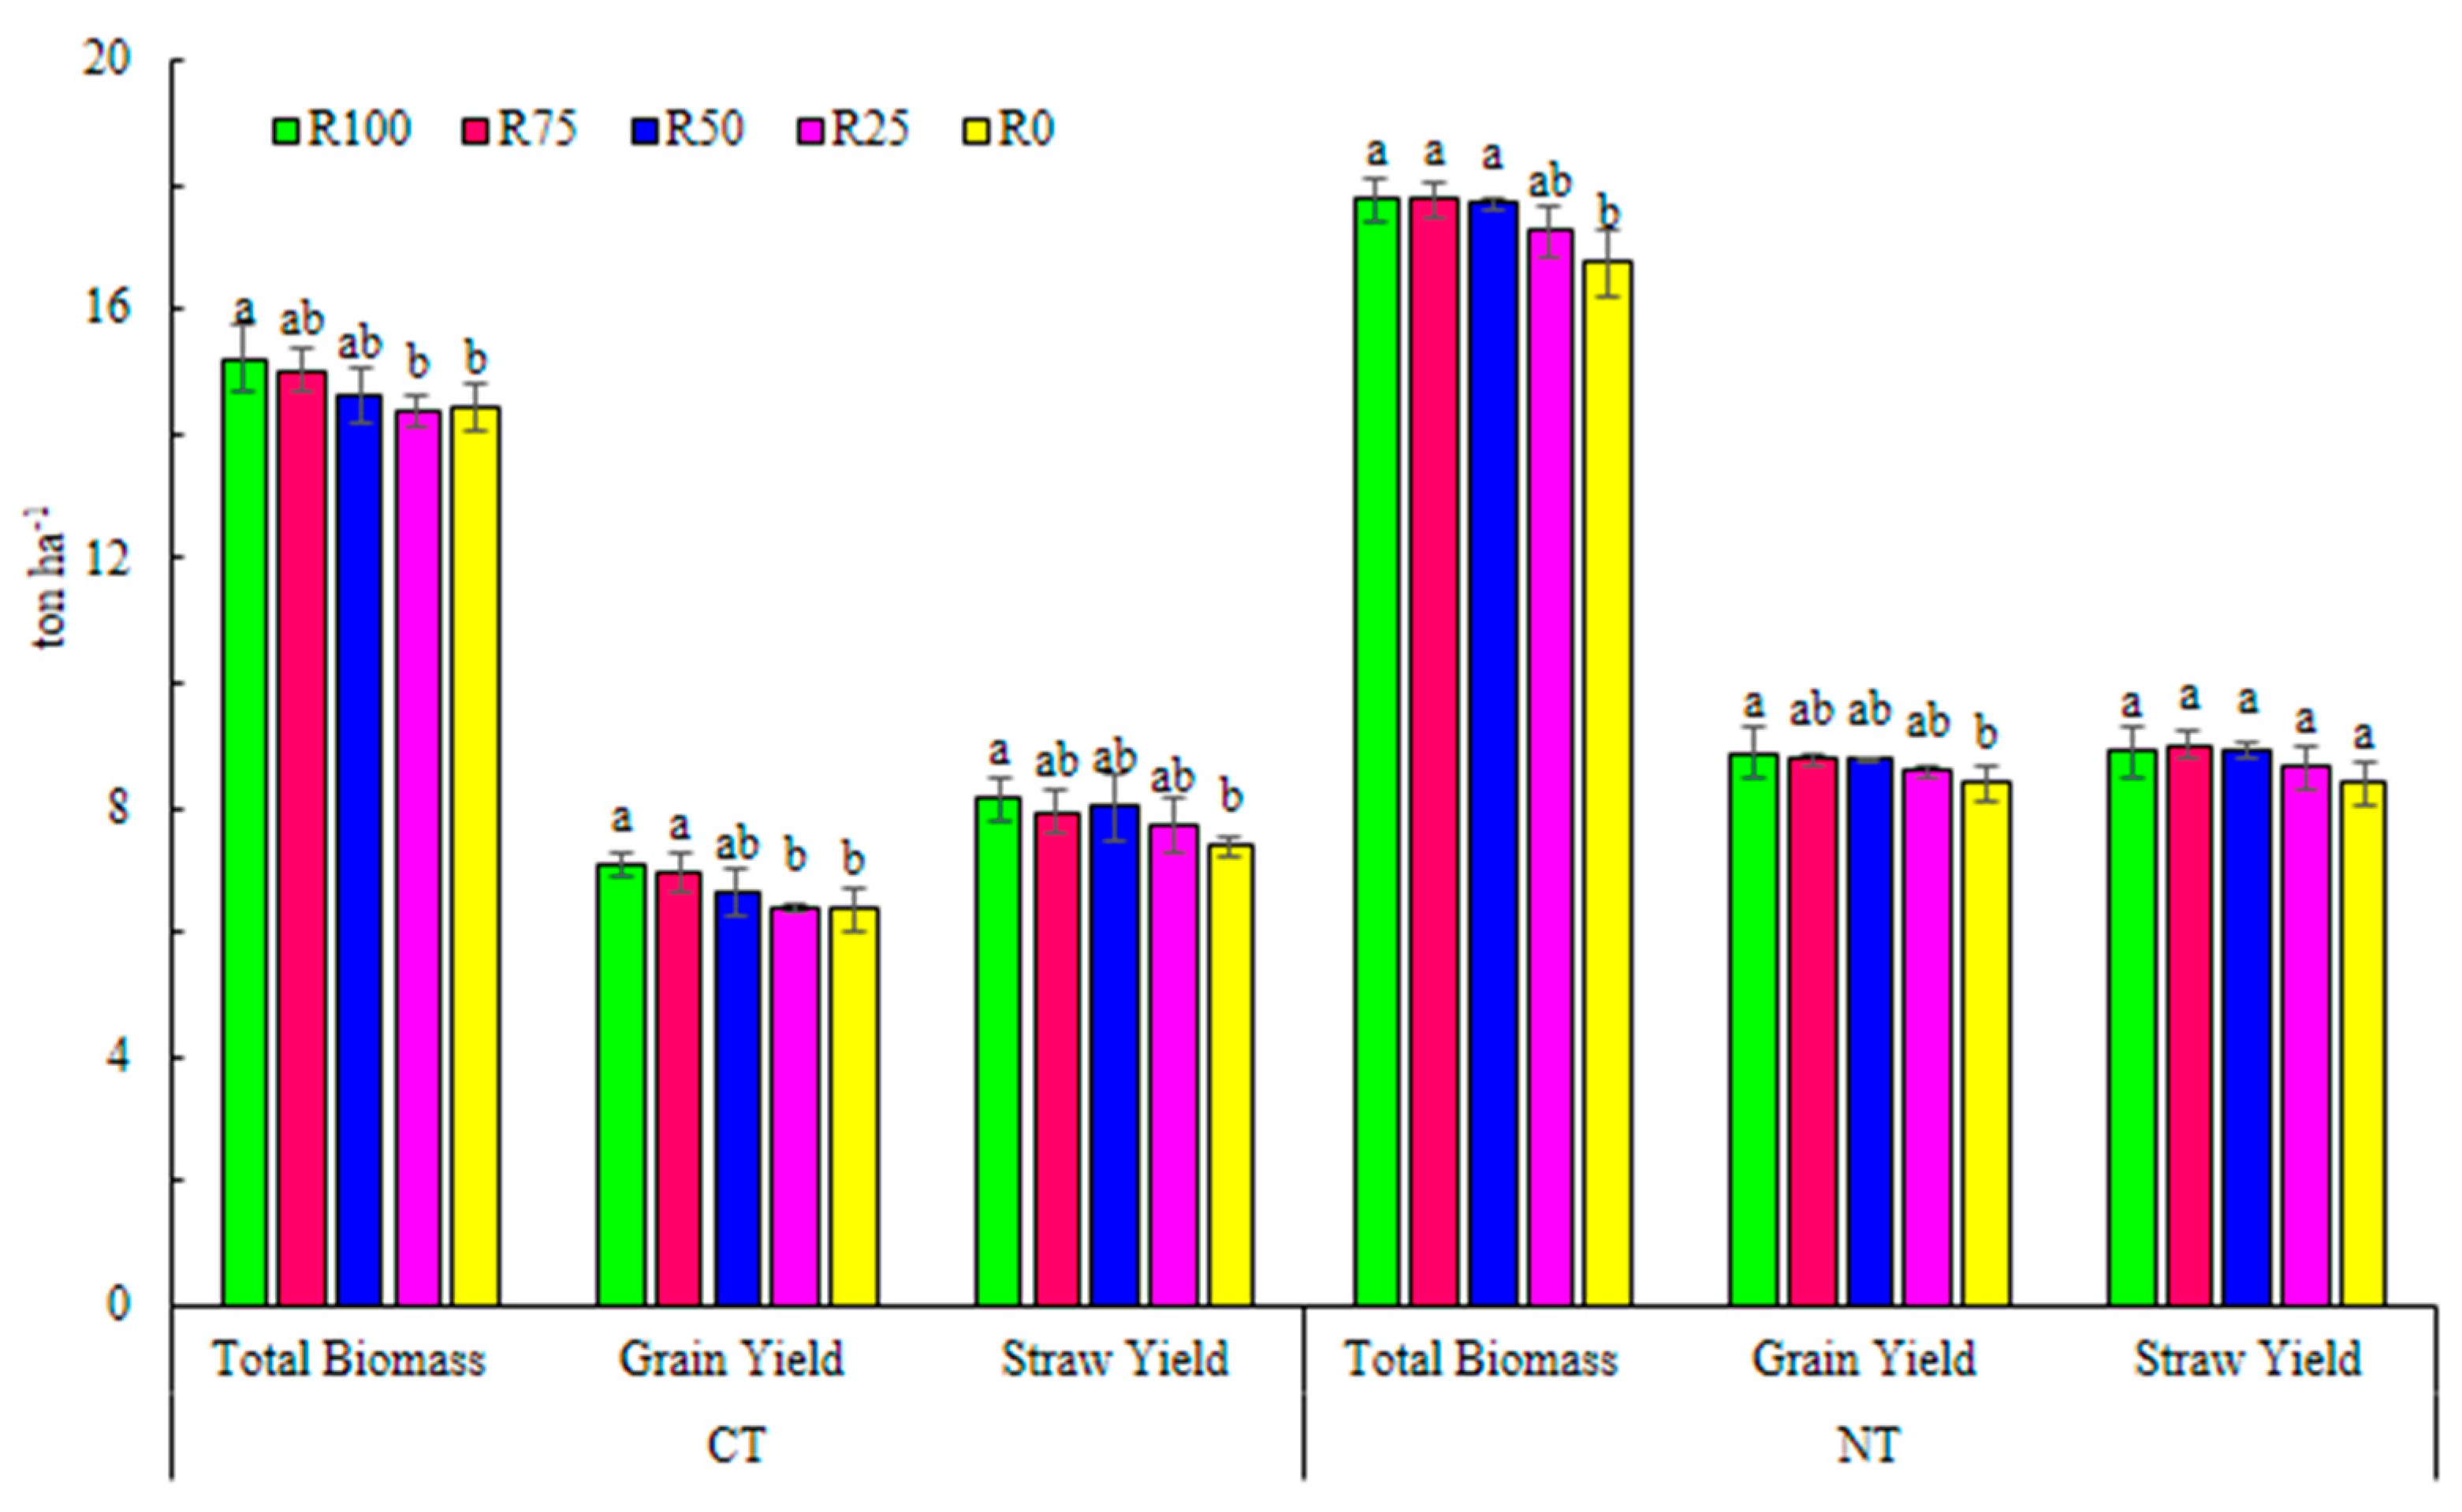
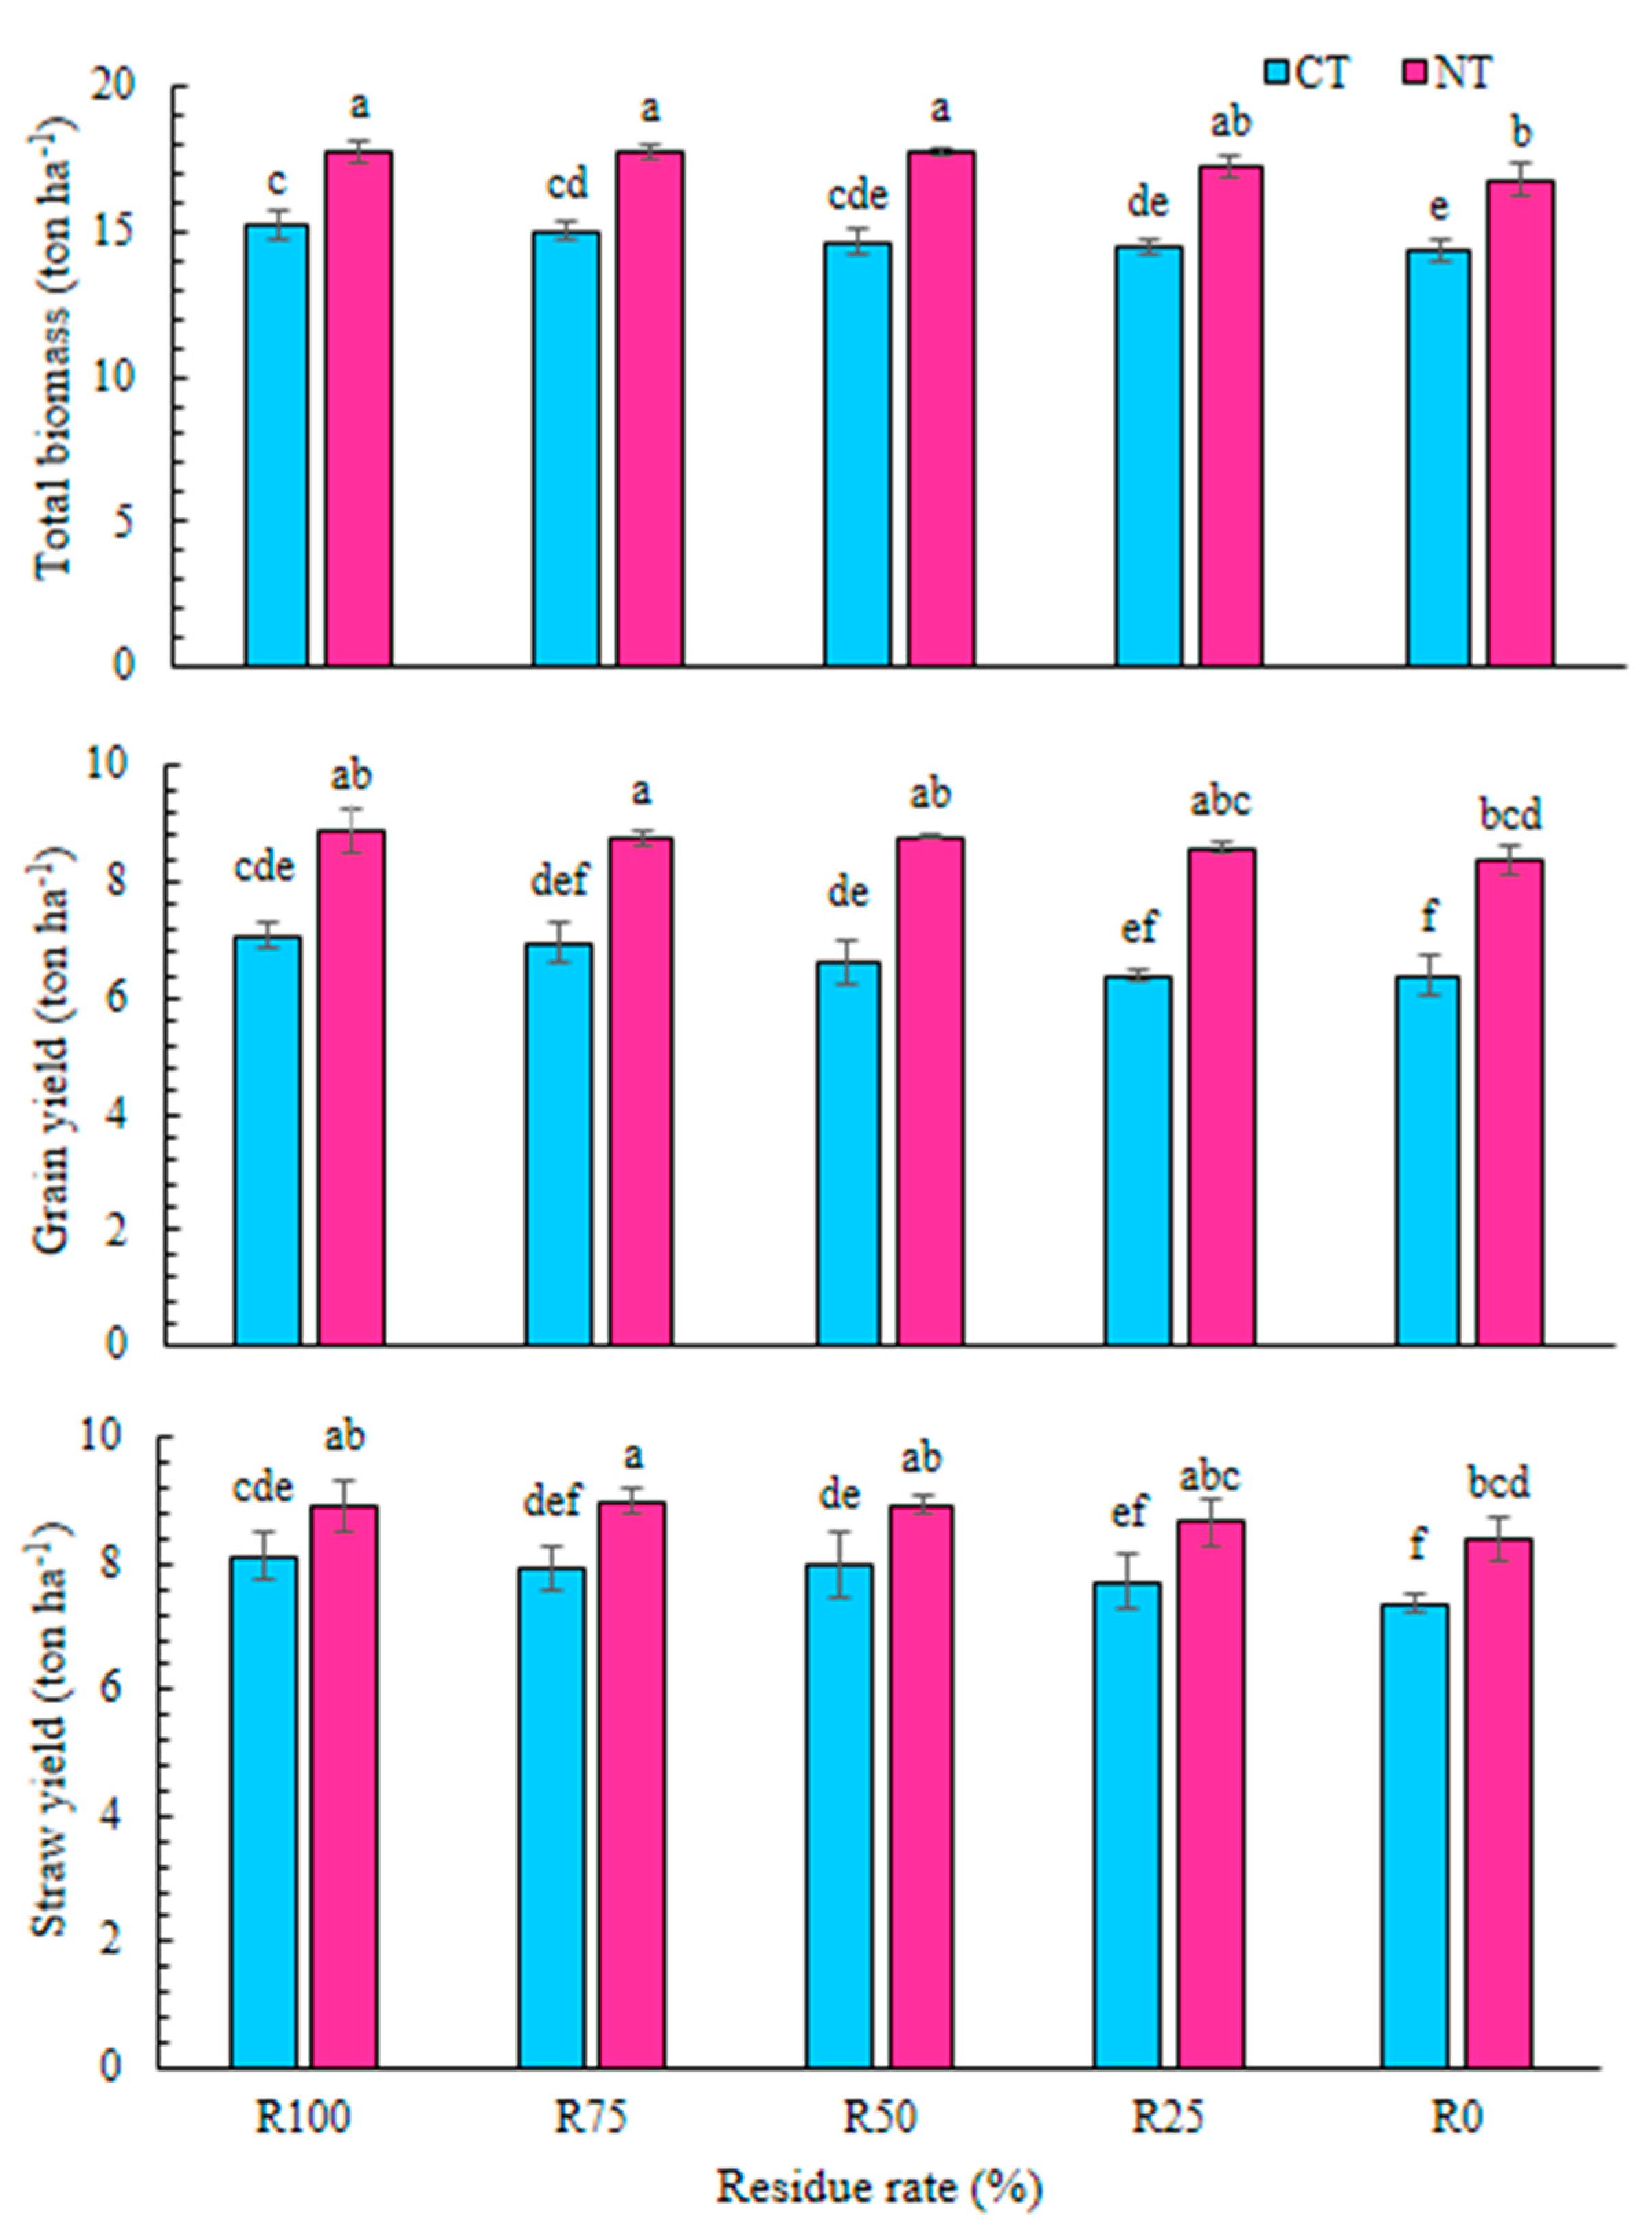
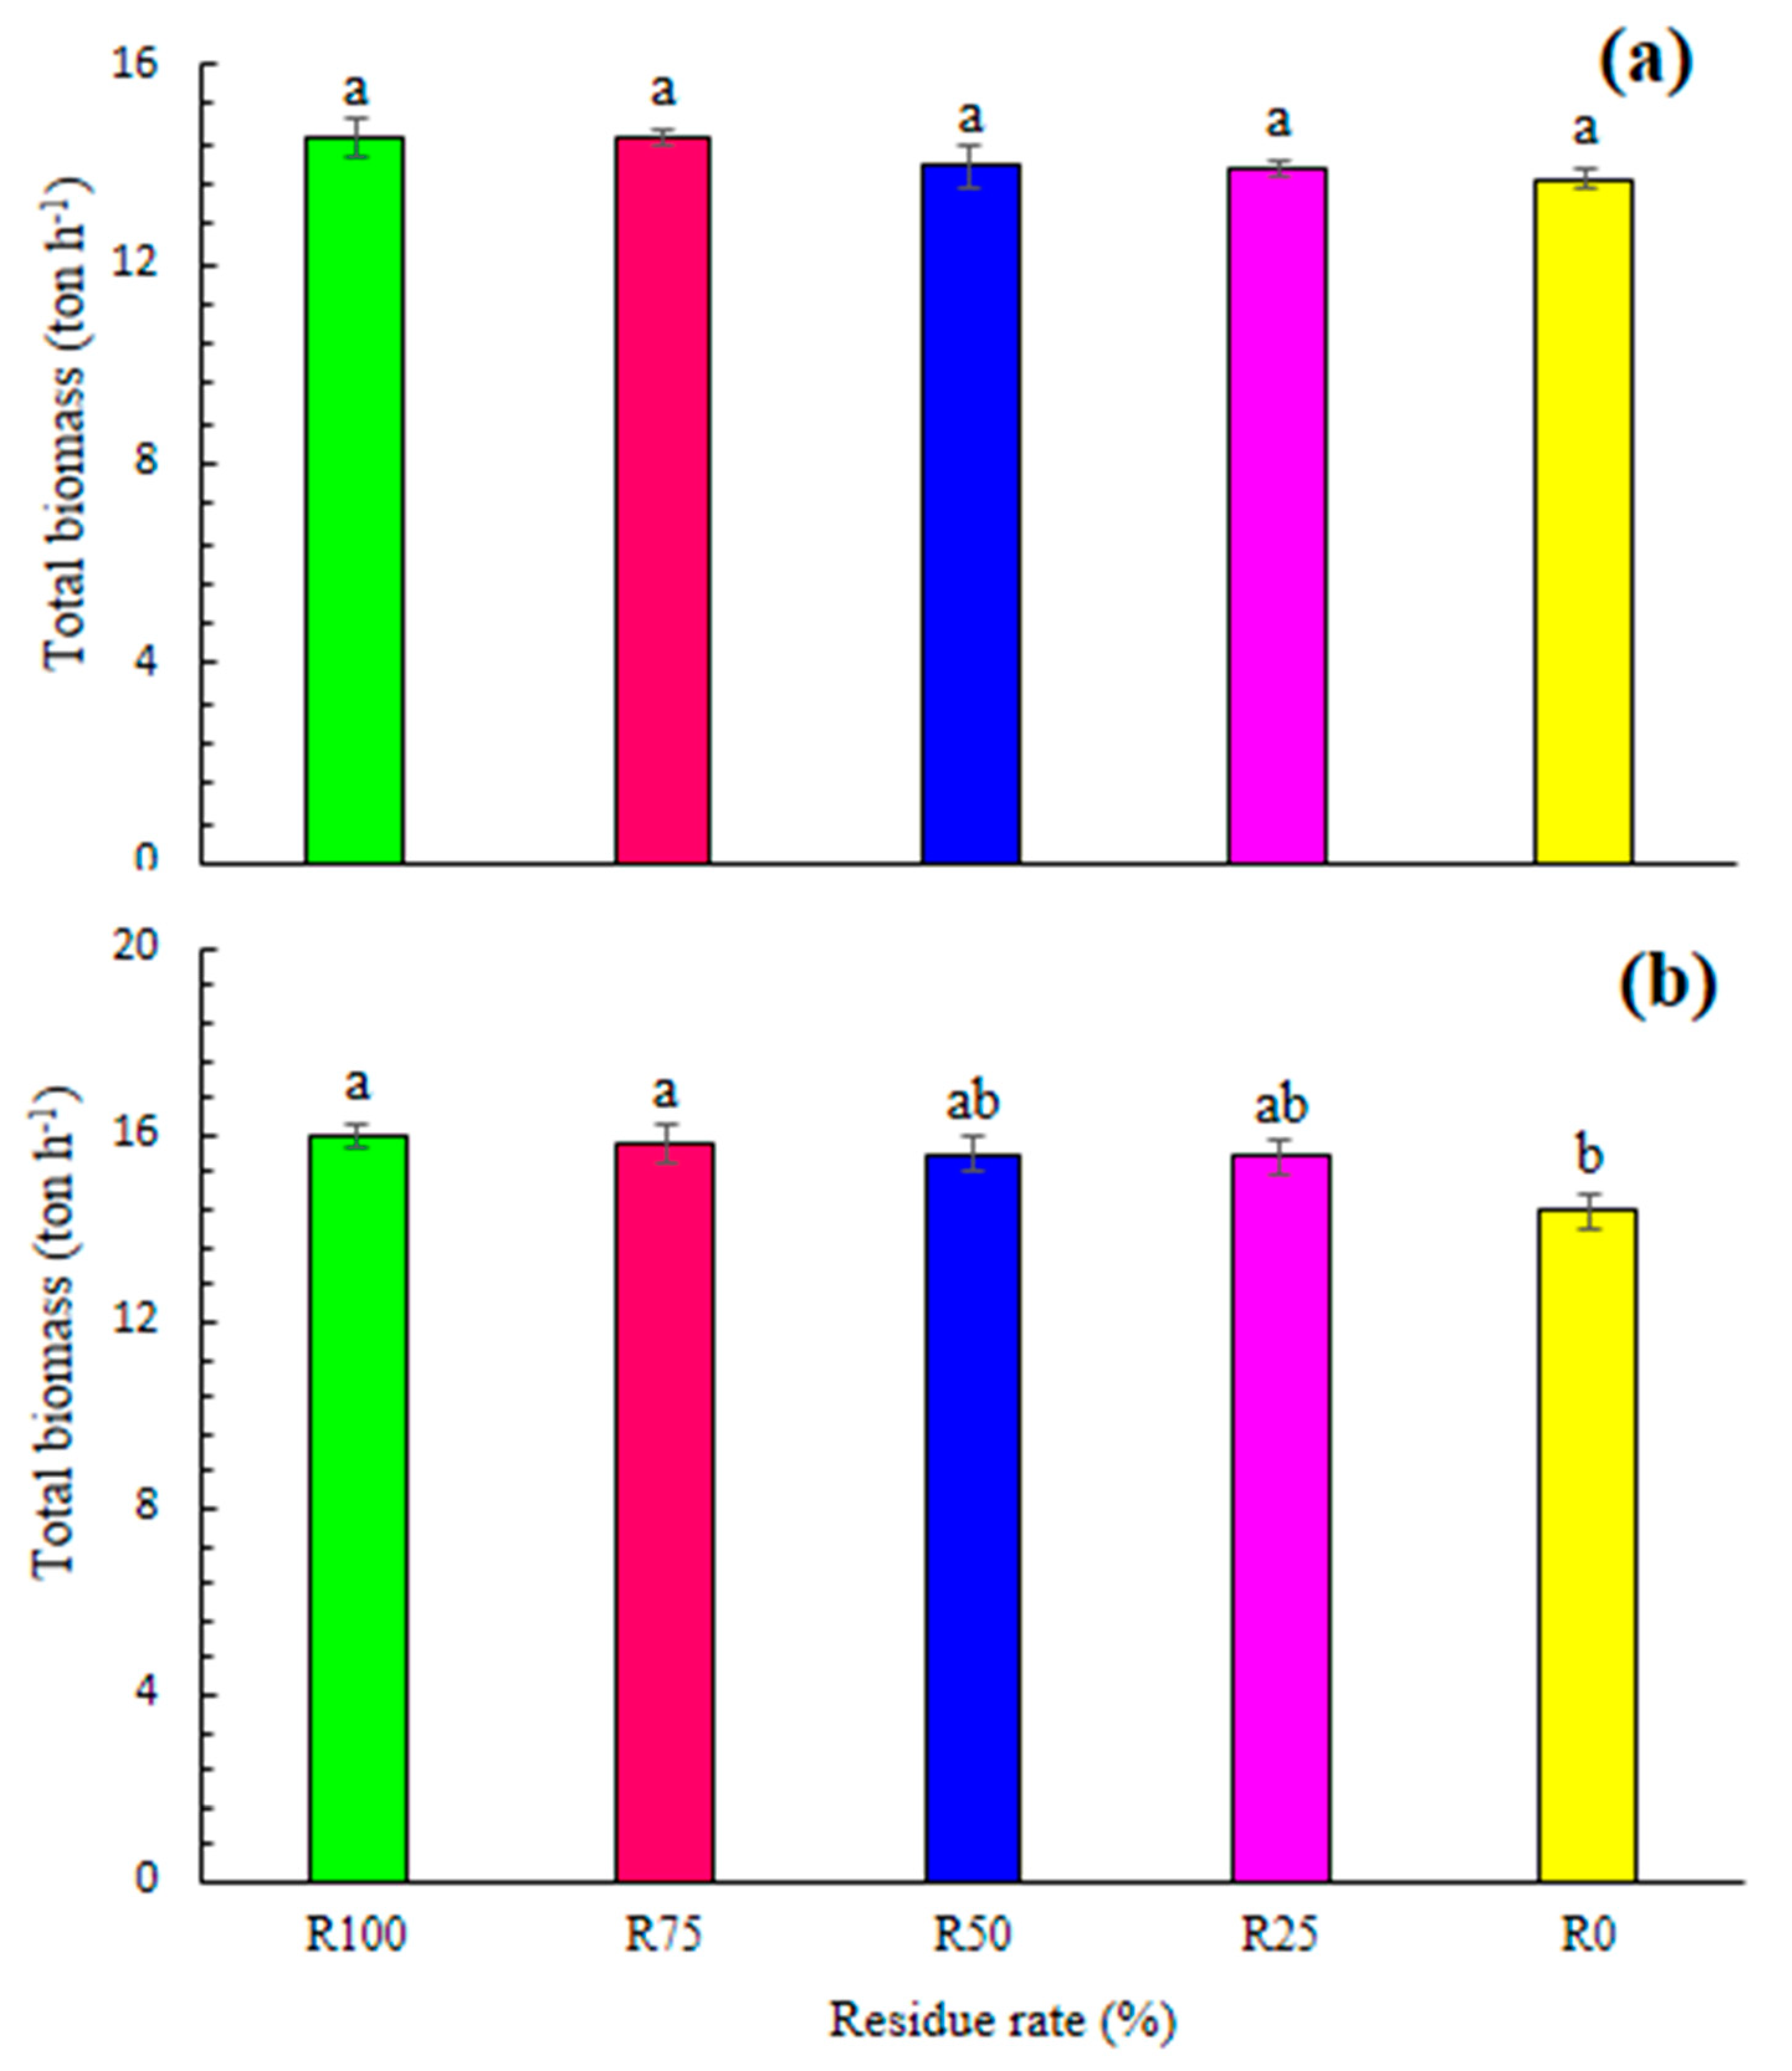
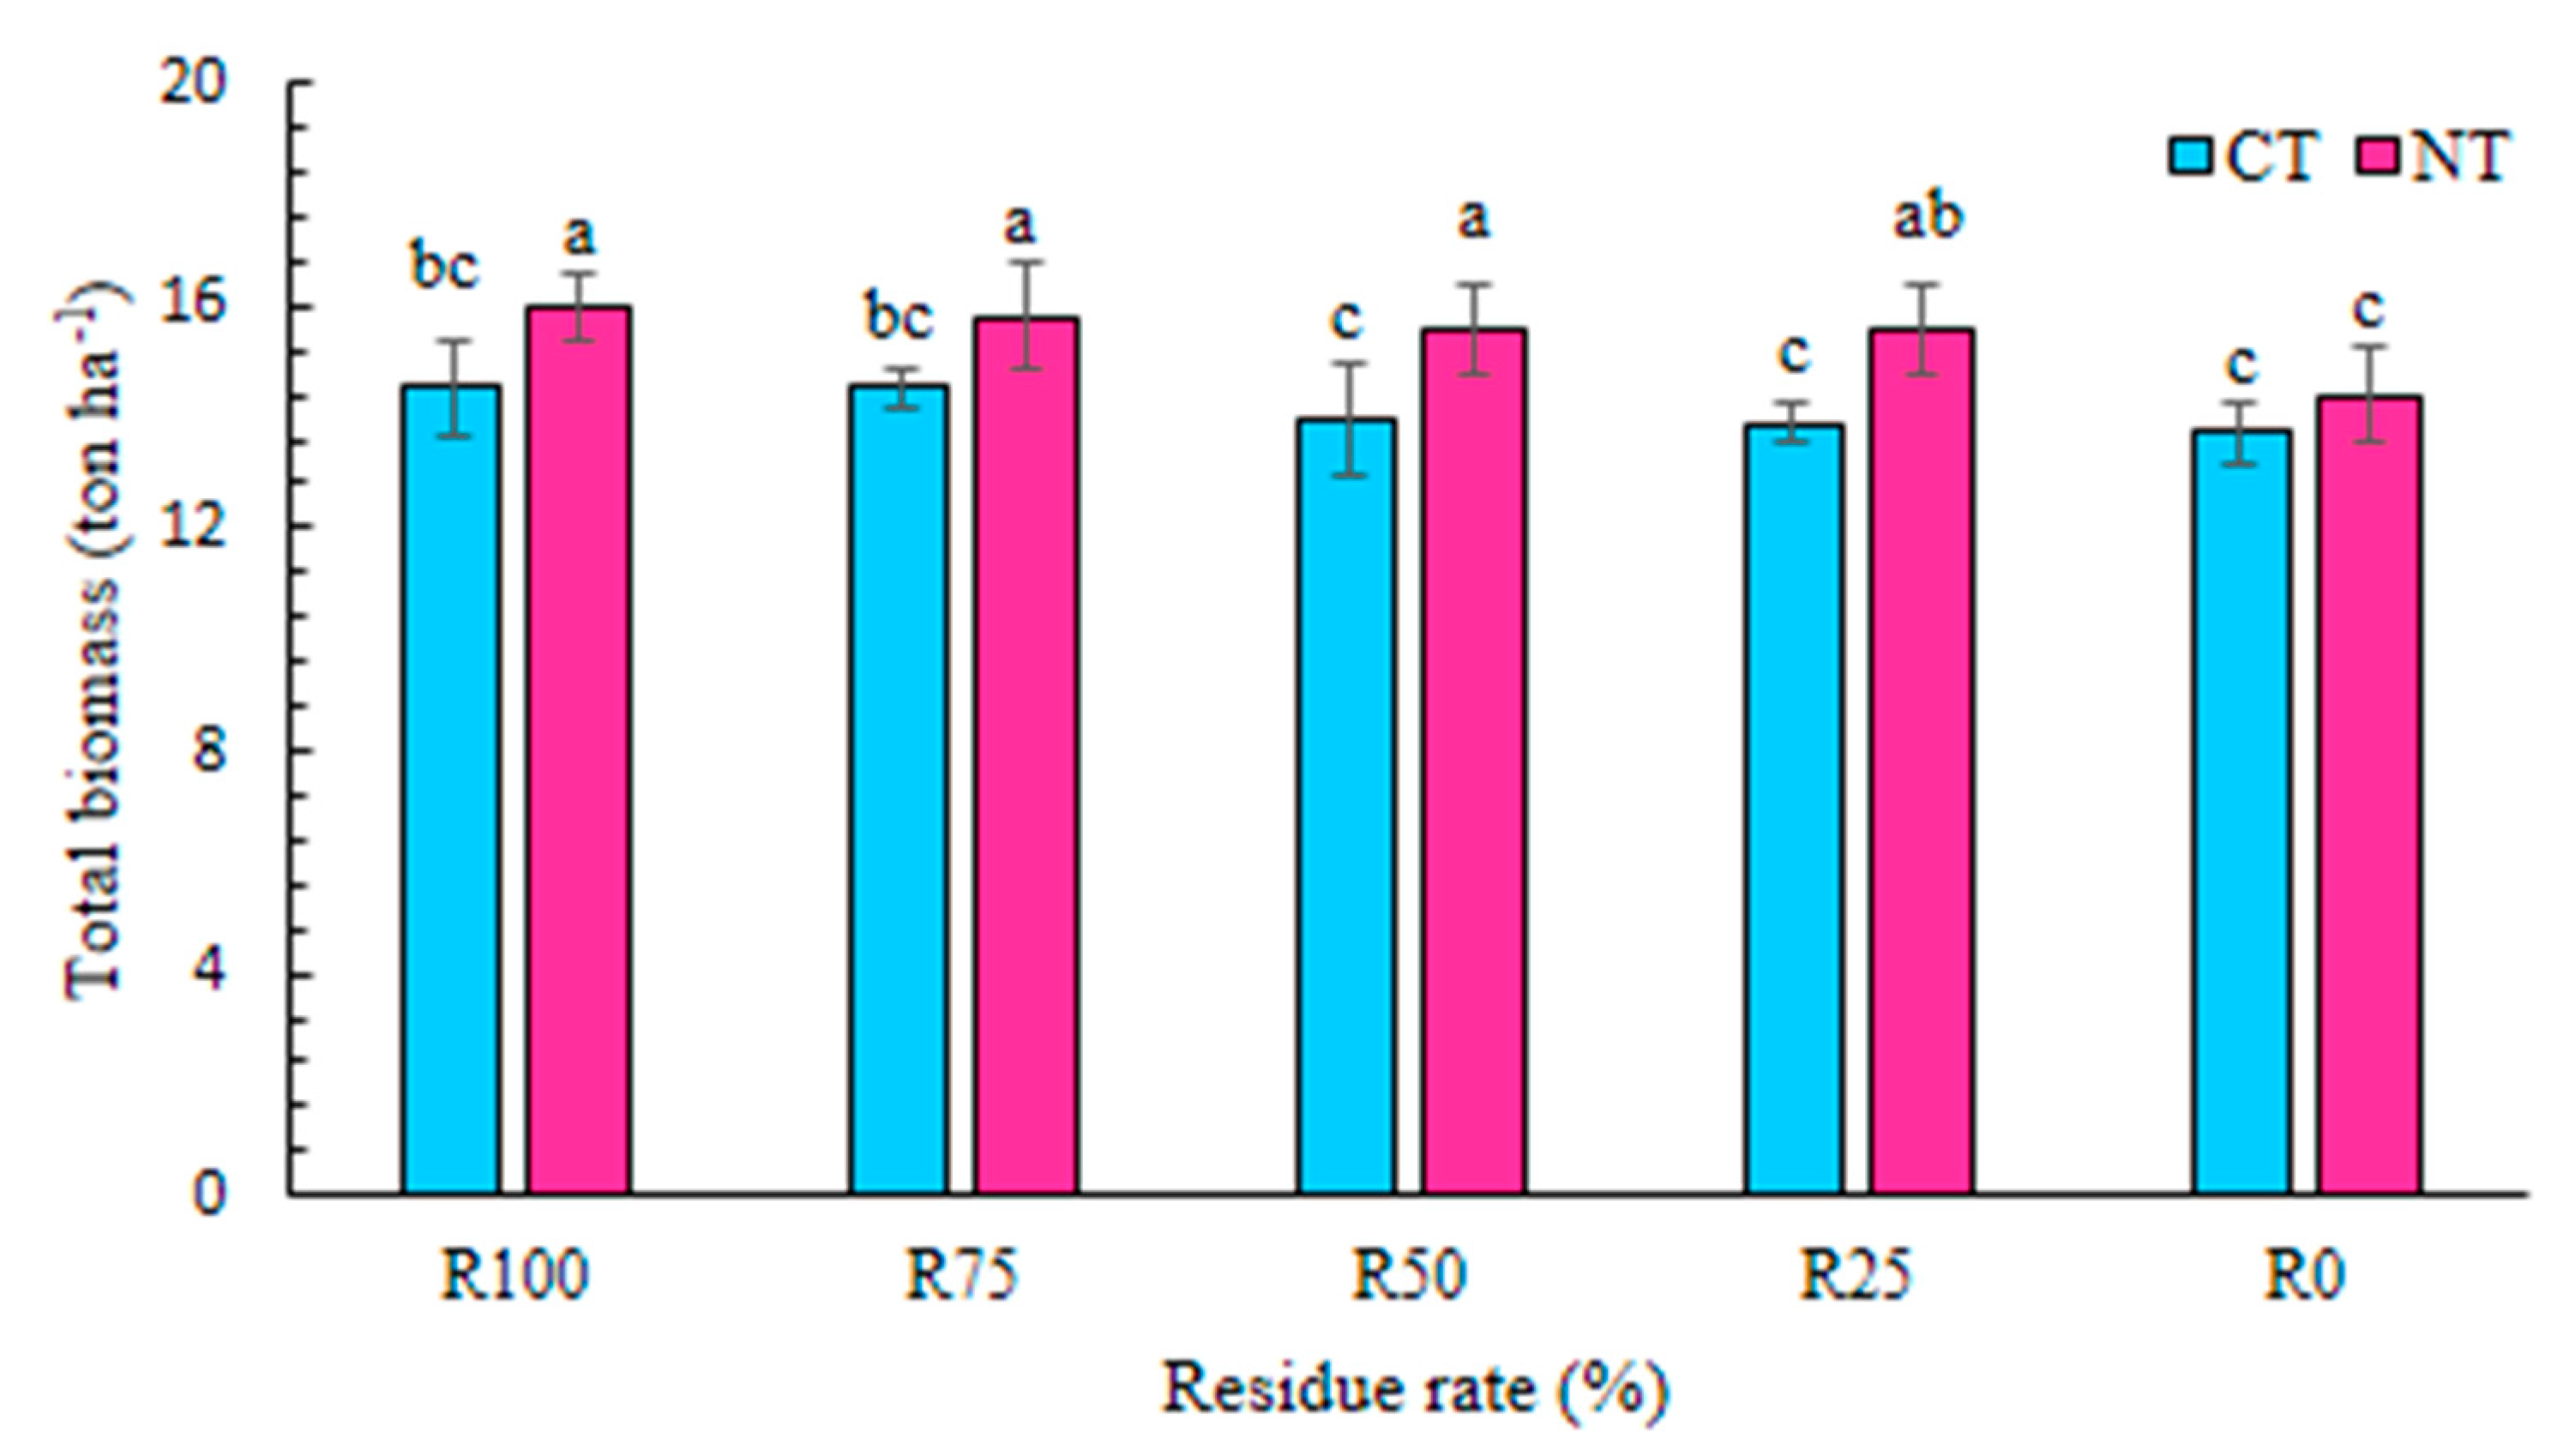
3.6. Wheat and Corn Yield

Overall, crop residue application to both conventional and no-tillage systems increased wheat yield (Figure 11). In the CT system, the highest wheat total biomass (15 Mg ha−1), grain (7 Mg ha−1), and straw (8 Mg ha−1) yield were obtained from R100. The identical values for R100 under NT system were 17.7, 8.8, and 9 Mg ha−1, respectively. Also, the wheat yield was significantly (p < 0.05) influenced by the interaction effects of residue rate and soil tillage, where all the applied residue rates resulted in significantly higher wheat total biomass, grain and straw yields under NT system compared to those under CT system (Figure 12). Corn yield was not significantly affected neither by residue rate nor the interaction effects of residue rate and soil tillage (Figure 13 and Figure 14), probably due to the short duration during the corn season, which is not sufficient for crop residue to show their actual potential on crop performance. An increasing trend in wheat yield could be attributed to increasing residue retention under NT system, reducing water loss and increasing moisture storage due to finer texture [108], improving soil quality, adjusting soil temperature, increasing soil organic matter and soil aggregate stability [109], and stronger nutrient availability [110]. In addition, improved soil organic C which stimulates soil microbial activity could have contributed to increased wheat yield [14,65,100,111]. Also, a higher yield of NT in the first year may reflect the consequence of improved soil condition under this system during previous years. Elevated positive correlations between wheat yield and soil available water and macronutrients (NPK) indicate better soil quality affected by crop residue application to both CT and NT systems (Figures S3 and S4). Our results agree with other findings [25,110,112]. However, contradictory findings have also been reported in some studies. For example, Birrell et al. [113] concluded that corn harvest had little effect on soil quality or crop yield. Ulmer et al. [114] also reported that residue removal did not affect corn, soybean, and bean yields. These successful results can be compared to other strategies applied in recent research, such as the use of cover crops, where water availability and crop production were higher than leaving the soil bare [115,116].

4. Conclusions

In this study, short-term investigation of applying crop residue from a lower rate (25%) to a higher rate (100%) and the reduction of tillage under irrigated condition, registered rapid and positive effects on soil physical and chemical properties and crop yield. Soil organic C content, nutrient status, aggregate stability, infiltration, available water content, and yields of wheat and corn in the semiarid region under both CT and NT systems were higher in residue treatments compared to removal of residue. Applying residues at R100 followed by R75 and R50 led to significant increases in most of the measured parameters. Our results advocate establishing and monitoring long-term studies on applying crop residues to investigate the full potential of crop residue application and management. In the NT system, the studied characteristics showed a significant increase at a depth of 0–10 cm compared to a depth of 10–20 cm, while in the conventional tillage system, the changes in the studied characteristics at the two depths were almost uniform. Overall, considering the positive results of crop residue on soil quality and crop yield in this study at short-term period, and the necessity of using crop residue to meet other needs of farmers, such as livestock feeding, roof surface isolation, building making, etc., it is crucial to be kept at least 50% of crop residue on the soil surface after harvest in agricultural systems in similar semiarid environments.

Supplementary Materials

The following are available online at https://www.mdpi.com/2073-4395/11/2/302/s1, Figure S1. The regression between soil organic carbon with soil mean weigh diameter (MWDW, MWDd) (a), wet and dry stable aggregates (WSA, DSA) (b), soil available water (SAW), and soil final infiltration (FI) (c) in the CT system. Figure S2. The regression between soil organic carbon with soil mean weigh diameter (MWDW, MWDd) (a), wet and dry stable aggregates (WSA, DSA) (b), soil available water (SAW), and soil final infiltration (FI) (c) in the NT system. Figure S3. The regression between wheat total biomass (TB), grain yield (GY), straw yield (SY) with soil available water (a), soil total nitrogen (b), soil available phosphorous (c), soil available potassium (d) in the CT system. Figure S4. The regression between wheat total biomass (TB), grain yield (GY), straw yield (SY) with soil available water (SAW) (a), soil total nitrogen (b), soil available phosphorous (c), soil available potassium (d) in the NT system.

Author Contributions

Data collection, analysis, and writing original draft, M.M.; supervision on research methodologies and the general structuring of the manuscript, M.G.A.; providing technical guidance on draft preparation, E.R.-T.; review and editing, J.R.-C., H.A., E.M., and N.S. All authors have read and agreed to the published version of the manuscript.

Funding

This research was funded by Iran National Science Foundation (INSF) in Tehran, Iran.

Institutional Review Board Statement

Not applicable.

Informed Consent Statement

Not applicable.

Data Availability Statement

Data sharing not applicable.

Acknowledgments

The authors greatly acknowledge Iran National Science Foundation (INSF) for financing this study.

Conflicts of Interest

The authors declare no conflict of interest.

References

  1. Mohammed, S.; Alsafadi, K.; Talukdar, S.; Kiwan, S.; Hennawi, S.; Alshihabi, O.; Sharaf, M.; Harsanyie, E. Estimation of Soil Erosion Risk in Southern Part of Syria by Using RUSLE Integrating Geo Informatics Approach. Remote Sensing Applications: J. Soc. Environ. 2020, 20, 100375. [Google Scholar] [CrossRef]
  2. Enaruvbe, G.O.; Keculah, K.M.; Atedhor, G.O.; Osewole, A.O. Armed Conflict and Mining Induced Land-Use Transition in Northern Nimba County, Liberia. J. Glob. Ecol. Conserv. 2019, 17, e00597. [Google Scholar] [CrossRef]
  3. Bayu, E.K. Determinant Variables for Women’s Participation in Soil and Water Conservation Practices in North Western Ethiopia: The Case of Shebel Berenta District (Woreda), East Gojjam Zone, Amhara National Regional State. J. Air Soil Water Res. 2020, 13. [Google Scholar] [CrossRef]
  4. Lal, R. World soils and global issues. J. Soil Tillage Res. 2007, 97, 1–4. [Google Scholar] [CrossRef]
  5. Rodrigo-Comino, J.; López-Vicente, M.; Kumar, V.; Rodríguez-Seijo, A.; Valkó, O.; Rojas, C.; Pourghasemi, H.R.; Salvati, L.; Bakr, N.; Vaudour, E.; et al. Soil Science Challenges in a New Era: A Transdisciplinary Overview of Relevant Topics. J. Air Soil Water Res. 2020, 13. [Google Scholar] [CrossRef]
  6. Bridges, E.M.; Oldeman, L.R. Global Assessment of Human-Induced Soil Degradation. J. Arid Soil Res. Rehab. 1999, 13, 319–325. [Google Scholar] [CrossRef]
  7. Garnett, T.; Appleby, M.C.; Balmford, A.; Bateman, I.J.; Benton, T.G.; Bloomer, P.; Fraser, D. Sustainable intensification in agriculture: Premises and policies. Science 2013, 341, 33–34. [Google Scholar] [CrossRef] [PubMed]
  8. Blanco-Canqui, H.; Lal, R. Crop residue removal impacts on soil productivity and environmental quality. Crit. Rev. Plant Sci. 2009, 28, 139–163. [Google Scholar] [CrossRef]
  9. Dhaliwal, S.; Naresh, R.; Mandal, A.; Singh, R.; Dhaliwal, M. Dynamics and transformations of micronutrients in agricultural soils as influenced by organic matter build-up: A review. J. Environ. Sustain. Indic. 2019, 1, 100007. [Google Scholar] [CrossRef]
  10. Lyles, L.; Allison, B.E. Equivalent wind-erosion protection of selected crop residues. Transact. ASAE 1981, 24, 0405–0408. [Google Scholar] [CrossRef]
  11. Cerdà, A.; Rodrigo-Comino, J.; Giménez-Morera, A.; Keesstra, S.D. Hydrological and erosional impact and farmer’s perception on catch crops and weeds in citrus organic farming in Canyoles river watershed, Eastern Spain. Agric. Ecosyst. Environ. 2018, 258, 49–58. [Google Scholar] [CrossRef]
  12. Lal, R. World crop residues production and implications of its use as a biofuel. J. Environ. Int. 2005, 31, 575–584. [Google Scholar] [CrossRef]
  13. Bhattacharyya, P.; Barman, D. Crop residue management and greenhouse gases emissions in tropical rice lands. In Soil Management and Climate Change; Elsevier: Amsterdam, The Netherlands, 2018; pp. 323–335. [Google Scholar] [CrossRef]
  14. Maw, M.J.; Goyne, K.W.; Fritschi, F.B. Soil carbon changes following conversion to annual biofuel feedstocks on marginal lands. Agron. J. 2019, 111, 4–13. [Google Scholar] [CrossRef]
  15. Orr, M.-J.; Gray, M.B.; Applegate, B.; Volenec, J.J.; Brouder, S.M.; Turco, R.F. Transition to second generation cellulosic biofuel production systems reveals limited negative impacts on the soil microbial community structure. J. Appl. Soil Ecol. 2015, 95, 62–72. [Google Scholar] [CrossRef]
  16. Graham, R.L.; Nelson, R.; Sheehan, J.; Perlack, R.; Wright, L.L. Current and potential US corn stover supplies. Agron. J. 2007, 99, 1–11. [Google Scholar] [CrossRef]
  17. Vasconcelos, A.L.S.; Cherubin, M.R.; Feigl, B.J.; Cerri, C.E.; Gmach, M.R.; Siqueira-Neto, M. Greenhouse gas emission responses to sugarcane straw removal. Biomass Bioenerg. 2018, 113, 15–21. [Google Scholar] [CrossRef]
  18. Kumari, K.; Prasad, J.; Solanki, I.S.; Chaudhary, R. Long-term effect of crop residues incorporation on yield and soil physical properties under rice-wheat cropping system in calcareous soil. J. Soil Sci. Plant Nutr. 2018, 18, 27–40. [Google Scholar] [CrossRef] [Green Version]
  19. Doran, J.W.; Wilhelm, W.W.; Power, J.F. Crop residue removal and soil productivity with no-till corn, sorghum, and soybean. Soil Sci. Soc. Am. J. 1984, 48, 640–645. [Google Scholar] [CrossRef] [Green Version]
  20. Power, J.F.; Koerner, P.T.; Doran, J.W.; Wilhelm, W.W. Residual effects of crop residues on grain production and selected soil properties. Soil Sci. Soc. Am. J. 1998, 62, 1393–1397. [Google Scholar] [CrossRef] [Green Version]
  21. De Aquino, G.S.; Medina, C.D.C. Productivity and biometric and physiological indices of sugarcane grown under different amounts of straw. Pesqui. Agropecu. Brasil. 2014, 49, 173–180. [Google Scholar]
  22. Aquino, G.S.D.; Medina, C.D.C.; Porteira, A.L., Jr.; Santos, L.O.; Cunha, A.C.B.; Kussaba, D.A.O.; Santiago, A.D. Root system and productivity of sugarcane ratoon associated to different quantities of straw. Pesqui. Agropecu. Brasil. 2015, 50, 1150–1159. [Google Scholar] [CrossRef] [Green Version]
  23. Kenney, I.; Blanco-Canqui, H.; Presley, D.R.; Rice, C.W.; Janssen, K.; Olson, B. Soil and crop response to stover removal from rainfed and irrigated corn. Gcb Bioenerg. 2015, 7, 219–230. [Google Scholar] [CrossRef]
  24. Jin, V.L.; Schmer, M.R.; Wienhold, B.J.; Stewart, C.E.; Varvel, G.E.; Sindelar, A.J.; Vogel, K.P. Twelve years of stover removal increases soil erosion potential without impacting yield. Soil. Sci. Soc. Am. J. 2015, 79, 1169–1178. [Google Scholar] [CrossRef]
  25. Blanco-Canqui, H.; Lal, R. Soil and crop response to harvesting corn residues for biofuel production. Geoderma 2007, 141, 355–362. [Google Scholar] [CrossRef]
  26. Blanco-Canqui, H.; Ferguson, R.B.; Jin, V.L.; Schmer, M.R.; Wienhold, B.J.; Tatarko, J. Can cover crop and manure maintain soil properties after stover removal from irrigated no-till corn? Soil Sci. Soc. Am. J. 2014, 78, 1368–1377. [Google Scholar] [CrossRef] [Green Version]
  27. Schertz, D.L. Conservation tillage: An analysis of acreage projections in the United States. J. Soil Water Conserv. 1988, 43, 256–258. [Google Scholar]
  28. Ball, B.C.; Robertson, E.A.G. Straw incorporation and tillage methods: Straw decomposition, denitrification and growth and yield of winter barley. J. Agric. Eng. Res. 1990, 46, 223–243. [Google Scholar] [CrossRef]
  29. Chatterjee, S.; Bandyopadhyay, K.K.; Pradhan, S.; Singh, R.; Datta, S.P. Effects of irrigation, crop residue mulch and nitrogen management in maize (Zea mays L.) on soil carbon pools in a sandy loam soil of Indo-gangetic plain region. Catena 2018, 165, 207–216. [Google Scholar] [CrossRef]
  30. Zeraatpisheh, M.; Ayoubi, S.; Sulieman, M.; Rodrigo-Comino, J. Determining the Spatial Distribution of Soil Properties Using the Environmental Covariates and Multivariate Statistical Analysis: A Case Study in Semi-Arid Regions of Iran. J. Arid Land 2019, 11, 551–566. [Google Scholar] [CrossRef] [Green Version]
  31. Rodrigo-Comino, J.; Keshavarzi, A.; Bagherzadeh, A.; Brevik, E.C. The use of multivariate statistical analysis and soil quality indices as tools to be included in regional management plans. A case study from the Mashhad Plain, Iran. Cuad. Investig. Geogr. 2019, 45, 687–708. [Google Scholar] [CrossRef] [Green Version]
  32. Walkley, A.; Black, I.A. An examination of the Degtjareff method for determining soil organic matter, and a proposed modification of the chromic acid titration method. Soil Sci. 1934, 37, 29–38. [Google Scholar] [CrossRef]
  33. Jones, J.B., Jr. Laboratory Guide for Conducting Soil Tests and Plant Analysis; CRC Press: Boca Raton, FL, USA, 2001. [Google Scholar] [CrossRef]
  34. Page, A.L.; Miller, R.H.; Jeeney, D.R. Methods of soil analysis, part 2: Chemical and mineralogical properties. Amer. Soc. Agron. 1982, 1159. [Google Scholar]
  35. Knudsen, D.; Peterson, G.; Pratt, P. Methods of Soil Analysis. Chemical and Microbiological Properties. Amer. Soc. Agron. 1982, 229–230. [Google Scholar]
  36. Bremmer, J.M.; Mulvaney, C.S. Methods of soil analysis, Part 2. Chemical and microbiological properties. Agronomy 1965, 9, 1179–1237. [Google Scholar] [CrossRef]
  37. Lindsay, W.L.; Norvell, W.A. Development of a DTPA soil test for zinc, iron, manganese, and copper. Soil Sci. Soc. Am. J. 1978, 42, 421–428. [Google Scholar] [CrossRef]
  38. Wang, W.J.; Dalal, R.C. Carbon inventory for a cereal cropping system under contrasting tillage, nitrogen fertilisation and stubble management practices. Soil Tillage Res. 2006, 91, 68–74. [Google Scholar] [CrossRef]
  39. Lozano-García, B.; Parras-Alcántara, L. Short-term effects of olive mill by-products on soil organic carbon, total N, C: N ratio and stratification ratios in a Mediterranean olive grove. Agric. Ecosyst. Environ. 2013, 165, 68–73. [Google Scholar] [CrossRef]
  40. Franzluebbers, A.J. Soil organic matter stratification ratio as an indicator of soil quality. Soil Tillage Res. 2002, 66, 95–106. [Google Scholar] [CrossRef]
  41. Elliott, E. Aggregate structure and carbon, nitrogen, and phosphorus in native and cultivated soils. Soil Sci. Soc. Am. J. 1986, 50, 627–633. [Google Scholar] [CrossRef]
  42. Kemper, W.D.; Rosenau, R.C. Aggregate stability and size distribution. Methods of soil analysis. Part 1. Physical and mineralogical methods. Soil Sci. Soc. Am. J. 1986, 425–442. [Google Scholar] [CrossRef]
  43. Bhattacharyya, R.; Tuti, M.; Kundu, S.; Bisht, J.; Bhatt, J. Conservation tillage impacts on soil aggregation and carbon pools in a sandy clay loam soil of the Indian Himalayas. Soil Sci. Soc. Am. J. 2012, 76, 617–627. [Google Scholar] [CrossRef]
  44. Nandan, R.; Singh, V.; Singh, S.S.; Kumar, V.; Hazra, K.K.; Nath, C.P.; McDonald, A. Impact of conservation tillage in rice–based cropping systems on soil aggregation, carbon pools and nutrients. Geoderma 2019, 340, 104–114. [Google Scholar] [CrossRef]
  45. Shahabinejad, N.; Mahmoodabadi, M.; Jalalian, A.; Chavoshi, E. The fractionation of soil aggregates associated with primary particles influencing wind erosion rates in arid to semiarid environments. Geoderma 2019, 356, 113936. [Google Scholar] [CrossRef]
  46. Reynolds, W.D. Saturated and field-unsaturated water flow parameters: Laboratory methods. Phys. Methods 2002, 802–817. [Google Scholar]
  47. Cassel, D.K.; Nielsen, D.R. Field capacity and available water capacity. Methods Soil Anal. Part 1 Phys. Mineral. Methods 1986, 5, 901–926. [Google Scholar]
  48. Ghosheh, H.Z.; Bsoul, E.Y.; Abdullah, A.Y. Utilization of alfalfa (Medicago sativa L.) as a smother crop in field corn (Zea mays L.). J. Sustain. Agric. 2005, 25, 5–17. [Google Scholar] [CrossRef]
  49. Roozeboom, K.L.; Wang, D.; McGowan, A.R.; Propheter, J.L.; Staggenborg, S.A.; Rice, C.W. Long-term biomass and potential ethanol yields of annual and perennial biofuel crops. Agron. J. 2019, 111, 74–83. [Google Scholar] [CrossRef] [Green Version]
  50. Hargrove, W.L.; Reid, J.T.; Touchton, J.T.; Gallaher, R.N. Influence of Tillage Practices on the Fertility Status of an Acid Soil Double-Cropped to Wheat and Soybeans 1. Agron. J. 1982, 74, 684–687. [Google Scholar] [CrossRef]
  51. Blevins, R.L.; Smith, M.S.; Thomas, G.W. Changes in soil properties under no-tillage. In No-Tillage Agriculture; Springer: Boston, MA, USA, 1984; pp. 190–230. [Google Scholar] [CrossRef]
  52. Edwards, J.H.; Wood, C.W.; Thurlow, D.L.; Ruf, M.E. Tillage and crop rotation effects on fertility status of a Hapludult soil. Soil Sci. Soc. Am. J. 1992, 56, 1577–1582. [Google Scholar] [CrossRef]
  53. Motta, A.C.; Reeves, D.W.; Touchton, J.T. Tillage intensity effects on chemical indicators of soil quality in two coastal plain soils. Commun. Soil Sci. Plant Anal. 2002, 33, 913–932. [Google Scholar] [CrossRef] [Green Version]
  54. Souza, R.A.; Telles, T.S.; Machado, W.; Hungria, M.; Tavares Filho, J.; de Fátima Guimarães, M. Effects of sugarcane harvesting with burning on the chemical and microbiological properties of the soil. J. Agric. Ecosyst. Environ. 2012, 155, 1–6. [Google Scholar] [CrossRef]
  55. Tang, C.; Rengel, Z. Role of plant cation/anion uptake ratio in soil acidification. In Handbook of Soil Acidity; Marcel Dekker: New York, NY, USA, 2003; pp. 57–81. [Google Scholar] [CrossRef]
  56. Butterly, C.; Baldock, J.; Tang, C. Chemical mechanisms of soil pH change by agricultural residues. In Dalam: 19th World Congress of Soil Science, Soil Solutions for a Changing World; International Union of Soil Sciences: Brisbane, Australia, 2010; Volume 4, pp. 1–6. [Google Scholar]
  57. Rahman, M.H.; Okubo, A.; Sugiyama, S.; Mayland, H.F. Physical, chemical and microbiological properties of an Andisol as related to land use and tillage practice. Soil Tillage Res. 2008, 101, 10–19. [Google Scholar] [CrossRef]
  58. Gura, I.; Mnkeni, P.N.S. Crop rotation and residue management effects under no till on the soil quality of a Haplic Cambisol in Alice, Eastern Cape, South Africa. Geoderma 2019, 337, 927–934. [Google Scholar] [CrossRef]
  59. Malobane, M.E.; Nciizah, A.D.; Mudau, F.N.; Wakindiki, I.I. Tillage, crop rotation and crop residue management effects on nutrient availability in a sweet sorghum-based cropping system in marginal soils of South Africa. Agronomy 2020, 10, 776. [Google Scholar] [CrossRef]
  60. Saha, S.; Chakraborty, D.; Sharma, A.R.; Tomoar, R.K.; Bhadraray, S.; Sen, U.; Kalra, N. Effect of tillage and residue management on soil physical properties and crop productivity in maize (Zea mays)–Indian mustard (Brassica juncea) system. Indian J. Agric. Sci. 2010, 80, 679–685. [Google Scholar]
  61. Bescansa, P.; Imaz, M.J.; Virto, I.; Enrique, A.; Hoogmoed, W.B. Soil water retention as affected by tillage and residue management in semiarid Spain. Soil Tillage Res. 2006, 87, 19–27. [Google Scholar] [CrossRef]
  62. You, D.; Tian, P.; Sui, P.; Zhang, W.; Yang, B.; Qi, H. Short-term effects of tillage and residue on spring maize yield through regulating root-shoot ratio in Northeast China. Sci. Rep. 2017, 7, 1–11. [Google Scholar] [CrossRef] [PubMed] [Green Version]
  63. Lemtiri, A.; Colinet, G.; Alabi, T.; Bodson, B.; Olivier, C.; Brostaux, Y.; Francis, F. Short-Term Effects of Tillage Practices and Crop Residue Exportation on Soil Organic Matter and Earthworm Communities in Silt Loam Arable Soil. In Soil Management and Climate Change; Academic Press: Cambridge, MA, USA, 2018; pp. 53–71. [Google Scholar] [CrossRef]
  64. Pandiaraj, T.; Selvaraj, S.; Ramu, N. Effects of Crop Residue Management and Nitrogen Fertilizer on Soil Nitrogen and Carbon Content and Productivity of Wheat (Triticum aestivum L.) in Two Cropping Systems. J. Agric. Sci. Tech. 2015, 17, 249–260. [Google Scholar]
  65. Dong, Q.; Yang, Y.; Yu, K.; Feng, H. Effects of straw mulching and plastic film mulching on improving soil organic carbon and nitrogen fractions, crop yield and water use efficiency in the Loess Plateau, China. Agric. Water Manag. 2018, 201, 133–143. [Google Scholar] [CrossRef]
  66. Poeplau, C.; Don, A. Carbon sequestration in agricultural soils via cultivation of cover crops–A meta-analysis. J. Agric. Ecosyst. Environ. 2015, 200, 33–41. [Google Scholar] [CrossRef]
  67. Kendall, J.R.; Long, D.S.; Collins, H.P.; Pierce, F.J.; Chatterjee, A.; Smith, J.L.; Young, S.L. Soil carbon dynamics of transition to Pacific Northwest cellulosic ethanol feedstock production. Soil. Sci. Soc. Am. J. 2015, 79, 272–281. [Google Scholar] [CrossRef]
  68. Stetson, S.J.; Osborne, S.L.; Schumacher, T.E.; Eynard, A.; Chilom, G.; Rice, J.; Pikul, J.L., Jr. Corn residue removal impact on topsoil organic carbon in a corn–soybean rotation. Soil Sci. Soc. Am. J. 2012, 76, 1399–1406. [Google Scholar] [CrossRef]
  69. Chalise, K.S.; Singh, S.; Wegner, B.R.; Kumar, S.; Pérez-Gutiérrez, J.D.; Osborne, S.L.; Rohila, J.S. Cover crops and returning residue impact on soil organic carbon, bulk density, penetration resistance, water retention, infiltration, and soybean yield. Agron. J. 2019, 111, 99–108. [Google Scholar] [CrossRef] [Green Version]
  70. Fuentes, M.; Govaerts, B.; De León, F.; Hidalgo, C.; Dendooven, L.; Sayre, K.D.; Etchevers, J. Fourteen years of applying zero and conventional tillage, crop rotation and residue management systems and its effect on physical and chemical soil quality. Eur. J. Agron. 2009, 30, 228–237. [Google Scholar] [CrossRef]
  71. Sithole, N.J.; Magwaza, L.S.; Thibaud, G.R. Long-term impact of no-till conservation agriculture and N-fertilizer on soil aggregate stability, infiltration and distribution of C in different size fractions. Soil Tillage Res. 2019, 190, 147–156. [Google Scholar] [CrossRef]
  72. Neugschwandtner, R.; Liebhard, P.; Kaul, H.; Wagentristl, H. Soil chemical properties as affected by tillage and crop rotation in a long-term field experiment. J. Plant Soil Environ. 2014, 60, 57–62. [Google Scholar] [CrossRef] [Green Version]
  73. Turmel, M.-S.; Speratti, A.; Baudron, F.; Verhulst, N.; Govaerts, B. Crop residue management and soil health: A systems analysis. J. Agric. Syst. 2015, 134, 6–16. [Google Scholar] [CrossRef]
  74. Noack, S.R.; McBeath, T.M.; McLaughlin, M.J.; Smernik, R.J.; Armstrong, R.D. Management of crop residues affects the transfer of phosphorus to plant and soil pools: Results from a dual-labelling experiment. J. Soil Biol. Biochem. 2014, 71, 31–39. [Google Scholar] [CrossRef]
  75. Ojha, S.; Sourabh, S.; Dasgupta, S.; Das, D.; Sarkar, A. Influence of different organic amendments on Fe, Mn, Cu and Zn availability in Indian soils. Int. J. Curr. Microbiol. Appl. Sci. 2018, 7, 2435–2445. [Google Scholar] [CrossRef]
  76. Richards, J.R.; Zhang, H.; Schroder, J.L.; Hattey, J.A.; Raun, W.R.; Payton, M.E. Micronutrient availability as affected by the long-term application of phosphorus fertilizer and organic amendments. Soil Sci. Soc. Am. J. 2011, 75, 927–939. [Google Scholar] [CrossRef]
  77. Monreal, C.; DeRosa, M.; Mallubhotla, S.; Bindraban, P.; Dimkpa, C. Nanotechnologies for increasing the crop use efficiency of fertilizer-micronutrients. J. Biol. Fertil. Soils 2016, 52, 423–437. [Google Scholar] [CrossRef]
  78. Blanco-Canqui, H.; Lal, R. No-tillage and soil-profile carbon sequestration: An on-farm assessment. Soil Sci. Soc. Am. J. 2008, 72, 693–701. [Google Scholar] [CrossRef] [Green Version]
  79. Puget, P.; Lal, R. Soil organic carbon and nitrogen in a Mollisol in central Ohio as affected by tillage and land use. Soil Tillage Res. 2005, 80, 201–213. [Google Scholar] [CrossRef]
  80. McLauchlan, K.K. Effects of soil texture on soil carbon and nitrogen dynamics after cessation of agriculture. Geoderma 2006, 136, 289–299. [Google Scholar] [CrossRef]
  81. Côté, L.; Brown, S.; Paré, D.; Fyles, J.; Bauhus, J. Dynamics of carbon and nitrogen mineralization in relation to stand type, stand age and soil texture in the boreal mixedwood. Soil Biol. Biochem. 2000, 32, 1079–1090. [Google Scholar] [CrossRef]
  82. Lichter, K.; Govaerts, B.; Six, J.; Sayre, K.D.; Deckers, J.; Dendooven, L. Aggregation and C and N contents of soil organic matter fractions in a permanent raised-bed planting system in the Highlands of Central Mexico. Plant Soil 2008, 305, 237–252. [Google Scholar] [CrossRef]
  83. Verhulst, N.; Govaerts, B.; Verachtert, E.; Kienle, F.; Limon-Ortega, A.; Deckers, J.; Raes, D.; Sayre, K.D. The importance of crop residue management in maintaining soil quality in zero tillage systems ‘A comparison between long-term trials in rainfed and irrigated wheat systems. In Proceedings of the 4th World Congress on Conservation Agriculture, New Delhi, India, 4–7 February 2009; pp. 71–79. [Google Scholar]
  84. Malhi, S.S.; Lemke, R.; Wang, Z.H.; Chhabra, B.S. Tillage, nitrogen and crop residue effects on crop yield, nutrient uptake, soil quality, and greenhouse gas emissions. Soil Tillage Res. 2006, 90, 171–183. [Google Scholar] [CrossRef]
  85. Six, J.; Elliott, E.T.; Paustian, K.; Doran, J.W. Aggregation and soil organic matter accumulation in cultivated and native grassland soils. Soil Sci. Soc. Am. J. 1998, 62, 1367–1377. [Google Scholar] [CrossRef] [Green Version]
  86. Chatterjee, S.; Bandyopadhyay, K.K.; Pradhan, S.; Singh, R.; Datta, S.P. Influence of irrigation, crop residue mulch and nitrogen management practices on soil physical quality. J. Indian Soc. Soil Sci. 2016, 64, 351–367. [Google Scholar] [CrossRef]
  87. Islam, K.R.; Weil, R.R. Land use effects on soil quality in a tropical forest ecosystem of Bangladesh. J. Agri. Ecosys. Environ. 2000, 79, 9–16. [Google Scholar] [CrossRef]
  88. Li, Y.; Li, Z.; Cui, S.; Jagadamma, S.; Zhang, Q. Residue retention and minimum tillage improve physical environment of the soil in croplands: A global meta-analysis. J. Soil Tillage Res. 2019, 194, 104292. [Google Scholar] [CrossRef]
  89. Shaver, T.M.; Peterson, G.A.; Sherrod, L.A. Cropping intensification in dryland systems improves soil physical properties: Regression relations. Geoderma 2003, 116, 149–164. [Google Scholar] [CrossRef]
  90. Zhang, P.; Wei, T.; Jia, Z.; Han, Q.; Ren, X. Soil aggregate and crop yield changes with different rates of straw incorporation in semiarid areas of northwest China. Geoderma 2014, 230, 41–49. [Google Scholar] [CrossRef]
  91. Blanco-Canqui, H.; Lal, R.; Post, W.; Izaurralde, R.; Owens, L. Soil structural parameters and organic carbon in no-till corn with variable stover retention rates. Soil Sci. 2006, 171, 468–482. [Google Scholar] [CrossRef]
  92. Singh, B.; Malhi, S. Response of soil physical properties to tillage and residue management on two soils in a cool temperate environment. Soil Tillage Res. 2006, 85, 143–153. [Google Scholar] [CrossRef]
  93. Kladivko, E.J.; Unger, P. Residue effects on soil physical properties. In Managing Agricultural Residues; Lewis Publishers: Boca Raton, FL, USA, 1994; pp. 123–141. [Google Scholar]
  94. Wegner, B.R.; Kumar, S.; Osborne, S.L.; Schumacher, T.E.; Vahyala, I.E.; Eynard, A. Soil response to corn residue removal and cover crops in eastern South Dakota. Soil Sci. Soc. Am. J. 2015, 79, 1179–1187. [Google Scholar] [CrossRef]
  95. Six, J.; Elliott, E.; Paustian, K. Soil macroaggregate turnover and microaggregate formation: A mechanism for C sequestration under no-tillage agriculture. J. Soil Biol. Biochem. 2000, 32, 2099–2103. [Google Scholar] [CrossRef]
  96. Smith, P.; Lutfalla, S.; Riley, W.J.; Torn, M.S.; Schmidt, M.W.; Soussana, J.F. The changing faces of soil organic matter research. Eur. J. Soil Sci. 2018, 69, 23–30. [Google Scholar] [CrossRef] [Green Version]
  97. Bronick, C.J.; Lal, R. Manuring and rotation effects on soil organic carbon concentration for different aggregate size fractions on two soils in northeastern Ohio, USA. J. Soil Tillage Res. 2005, 81, 239–252. [Google Scholar] [CrossRef]
  98. Sindelar, M.; Blanco-Canqui, H.; Jin, V.L.; Ferguson, R. Cover crops and corn residue removal: Impacts on soil hydraulic properties and their relationships with carbon. Soil Sci. Soc. Am. J. 2019, 83, 221–231. [Google Scholar] [CrossRef] [Green Version]
  99. Singh, A.; Kaur, J. Impact of conservation tillage on soil properties in rice-wheat cropping system. Agric. Sci. Res. J. 2012, 2, 30–41. [Google Scholar]
  100. Reynolds, W.; Drury, C.; Yang, X.; Fox, C.; Tan, C.; Zhang, T. Land management effects on the near-surface physical quality of a clay loam soil. J.Soil Tillage Res. 2007, 96, 316–330. [Google Scholar] [CrossRef]
  101. Jemai, I.; Aissa, N.B.; Guirat, S.B.; Ben-Hammouda, M.; Gallali, T. Impact of three and seven years of no-tillage on the soil water storage, in the plant root zone, under a dry subhumid Tunisian climate. J. Soil Tillage Res. 2013, 126, 26–33. [Google Scholar] [CrossRef]
  102. Cai, T.; Zhang, C.; Huang, Y.; Huang, H.; Yang, B.; Zhao, Z.; Jia, Z. Effects of different straw mulch modes on soil water storage and water use efficiency of spring maize (Zea mays L.) in the Loess Plateau of China. Plant Soil Environ. 2015, 61, 253–259. [Google Scholar] [CrossRef] [Green Version]
  103. De Moraes Sa, J.C.; Lal, R. Stratification ratio of soil organic matter pools as an indicator of carbon sequestration in a tillage chronosequence on a Brazilian Oxisol. J. Soil Tillage Res. 2009, 103, 46–56. [Google Scholar] [CrossRef]
  104. Lou, Y.; Xu, M.; Chen, X.; He, X.; Zhao, K. Stratification of soil organic C, N and C: N ratio as affected by conservation tillage in two maize fields of China. Catena 2012, 95, 124–130. [Google Scholar] [CrossRef]
  105. Moreno, F.; Murillo, J.M.; Pelegrín, F.; Girón, I.F. Long-term impact of conservation tillage on stratification ratio of soil organic carbon and loss of total and active CaCO3. J. Soil Tillage Res. 2006, 85, 86–93. [Google Scholar] [CrossRef]
  106. Wright, A.L.; Hons, F.M.; Lemon, R.G.; McFarland, M.L.; Nichols, R.L. Stratification of nutrients in soil for different tillage regimes and cotton rotations. J. Soil Tillage Res. 2007, 96, 19–27. [Google Scholar] [CrossRef]
  107. Johnson, J.M.; Strock, J.S.; Tallaksen, J.E.; Reese, M. Corn stover harvest changes soil hydrology and soil aggregation. J. Soil Tillage Res. 2016, 161, 106–115. [Google Scholar] [CrossRef] [Green Version]
  108. Li, S.; Wang, Z.; Li, S.; Gao, Y.; Tian, X. Effect of plastic sheet mulch, wheat straw mulch, and maize growth on water loss by evaporation in dryland areas of China. J. Agric. Water Manag. 2013, 116, 39–49. [Google Scholar] [CrossRef]
  109. Choudhury, S.G.; Srivastava, S.; Singh, R.; Chaudhari, S.; Sharma, D.; Singh, S.; Sarkar, D. Tillage and residue management effects on soil aggregation, organic carbon dynamics and yield attribute in rice–wheat cropping system under reclaimed sodic soil. J. Soil Tillage Res. 2014, 136, 76–83. [Google Scholar] [CrossRef]
  110. Mu, X.; Zhao, Y.; Liu, K.; Ji, B.; Guo, H.; Xue, Z.; Li, C. Responses of soil properties, root growth and crop yield to tillage and crop residue management in a wheat–maize cropping system on the North China Plain. Eur. J. Agron. 2016, 78, 32–43. [Google Scholar] [CrossRef]
  111. Pant, P.K.; Ram, S.; Singh, V. Yield and soil organic matter dynamics as affected by the long-term use of organic and inorganic fertilizers under rice–wheat cropping system in subtropical mollisols. J. Agric. Res. 2017, 6, 399–409. [Google Scholar] [CrossRef]
  112. Mohammad, W.; Shah, S.M.; Shehzadi, S.; Shah, S.A. Effect of tillage, rotation and crop residues on wheat crop productivity, fertilizer nitrogen and water use efficiency and soil organic carbon status in dry area (rainfed) of north-west Pakistan. J. Soil Sci. Plant Nutrit. 2012, 12, 715–727. [Google Scholar] [CrossRef] [Green Version]
  113. Birrell, S.J.; Karlen, D.L.; Wirt, A. Development of sustainable corn stover harvest strategies for cellulosic ethanol production. BioEnerg. Res. 2014, 7, 509–516. [Google Scholar] [CrossRef] [Green Version]
  114. Ulmer, K.M.; Rasby, R.J.; MacDonald, J.C.; Blanco-Canqui, H.; Rakkar, M.K.; Cox, J.L.; Drewnoski, M.E. Baling or grazing of corn residue does not reduce crop production in Central United States. Agron. J. 2019, 111, 122–127. [Google Scholar] [CrossRef]
  115. Novara, A.; Cerda, A.; Barone, E.; Gristina, L. Cover crop management and water conservation in vineyard and olive orchards. J. Soil Tillage Res. 2021, 208, 104896. [Google Scholar] [CrossRef]
  116. Rodrigo-Comino, J.; Terol, E.; Mora, G.; Gimenez-Morera, A.; Cerdà, A. Vicia sativa Roth. can reduce soil and water losses in recently planted vineyards (Vitis vinifera L.). Earth Syst. Environ. 2020, 4, 827–842. [Google Scholar] [CrossRef]
Figure 1. View of the experimental site.
Agronomy 11 00302 g001
Figure 2. Monthly rainfall (mm, lines) and mean air temperature (°C, bars) during the experimental period (2018–2019) (a) and in the long term (2005–2017) (b) in the study site.
Agronomy 11 00302 g002
Figure 3. The effect of residue rates on soil pH (a), EC (b), organic carbon (c), total nitrogen (d), available P (e), and available K (f) in conventional (CT) and no‒tillage (NT) systems. Means with the same letter in each tillage system are not significantly different. Bars represent standard deviation, n = 4.
Agronomy 11 00302 g003
Figure 4. The effect of soil depth on soil pH (a), EC (b), organic carbon (c), total nitrogen (d), available P (e), and available K (f) in conventional (CT) and no‒tillage (NT) systems. Means with the same letter in each tillage system are not significantly different. Bars represent standard deviation, n = 4.
Agronomy 11 00302 g004
Figure 5. The effect of residue rates on soil micronutrients in conventional (CT) and no‒tillage (NT) systems. Means with the same letter in each tillage system are not significantly different. Bars represent standard deviation, n = 4.
Agronomy 11 00302 g005
Figure 6. The effect of soil depth on soil micronutrients in conventional (CT) and no‒tillage (NT) systems. Means with the same letter in each tillage system are not significantly different. Bars represent standard deviation, n = 4.
Agronomy 11 00302 g006
Figure 7. Soil organic carbon (SOC) stock (a) and total nitrogen (TN) stock (b) at 0–10 and 10–20 cm soil depths under conventional tillage (CT), and no‒tillage (NT) systems.
Agronomy 11 00302 g007
Figure 8. Stratification ratios (SR) of studied soil properties under conventional tillage (CT) and no‒tillage (NT) system. Means with the same letter are not significantly different. Bars represent standard deviation, n = 4.
Agronomy 11 00302 g008
Figure 9. The effect of residue rates on soil infiltration in conventional (CT) and no‒tillage (NT) systems. Means with the same letter in each tillage system are not significantly different. Bars represent standard deviation, n = 4.
Agronomy 11 00302 g009
Figure 10. The interaction effect of residue rates and soil tillage on soil infiltration. Means with the same letter are not significantly different. Bars represent standard deviation, n = 4.
Agronomy 11 00302 g010
Figure 11. The effect of residue rates on wheat yield in conventional (CT) and no‒tillage (NT) systems. Means with the same letter in each tillage system are not significantly different. Bars represent standard deviation, n = 4.
Agronomy 11 00302 g011
Figure 12. The interaction effect of residue rates and soil tillage on wheat yield. Means with the same letter are not significantly different. Bars represent standard deviation, n = 4.
Agronomy 11 00302 g012
Figure 13. The effect of residue rates on dry corn biomass yield in conventional (CT) (a) and no‒tillage (NT) (b) systems. Means with the same letter in each tillage system are not significantly different. Bars represent standard deviation, n = 4.
Agronomy 11 00302 g013
Figure 14. The interaction effect of residue rates and soil tillage on dry corn biomass yield. Means with the same letter are not significantly different. Bars represent standard deviation, n = 4.
Agronomy 11 00302 g014
Table 1. Soil properties of 0–10 and 10–20 cm soil depths in the fields at the start of the experiment.
Soil PropertiesConventional Tillage (CT)No-Tillage (NT)
0–10 cm10–20 cm0–10 cm10–20 cm
pH 7.83 ± 0.117.78 ± 0.137.85 ± 0.077.6 ± 0.11
EC (ds m−1)0.91 ± 0.010.75 ± 0.251.06 ± 0.060.73 ± 0.16
OC (mg/g)0.92 ± 0.130.86 ± 0.161.25 ± 0.051.01 ± 0.11
TN (mg/g)0.09 ± 0.010.07 ± 0.010.11 ± 0.020.08 ± 0.01
Avail. K (mg kg−1)167 ± 4.46134.23 ± 3.12279.04 ± 5.19237.42 ± 6.04
Ava P (mg kg−1)8.72 ± 0.209.54 ± 0.6515.05 ± 1.4215.34 ± 0.73
Ava Fe (mg kg−1)13 ± 0.5013.94 ± 0.169.26 ± 0.898.51 ± 0.50
Ava Zn (mg kg−1)2.57 ± 0.512.64 ± 0.362.84 ± 0.261.75 ± 0.21
Ava Cu (mg kg−1)1 ± 0.191.32 ± 0.061.65 ± 0.141.53 ± 0.16
Ava Mn (mg kg−1)12.4 ± 0.6411.68 ± 0.9616.25 ± 0.7015 ± 1.27
Bulk density (mg m−3)1.21 ± 0.041.27 ± 0.081.38 ± 0.011.45 ± 0.08
Total Porosity (%)54.7 ± 2.1652.07 ± 1.0647.92 ± 1.8645.28 ± 0.91
Sand (%)56.9 ± 1.3352.5 ± 0.7927.9 ± 0.3527.3 ± 0.72
Silt (%)24.4 ± 1.4628.08 ± 1.3542.09 ± 0.1841.64 ± 0.60
Clay (%)18.6 ± 1.2719.42 ± 2.1030 ± 0.3531.03 ± 0.72
Soil textureSandy LoamSandy LoamClay LoamClay Loam
Value ± standard deviation, n = 3. EC, Electrical conductivity; OC, Organic carbon; TN, Total nitrogen; Ava, Available.
Table 2. Elemental composition of plant residue.
Plant ResidueNPKCC/NFeMnCuZn
%-mg kg−1 Dry Matter
Wheat 0.84 ± 0.120.09 ± 0.011.75 ± 0.0755.4 ± 1.8066 ± 2.56119 ± 2.8727 ± 1.6317 ± 1.6332 ± 2.16
Corn0.92 ± 0.060.25 ± 0.021.08 ± 0.0153.65 ± 1.3058 ± 1.63144.59 ± 4.3033.64 ± 2.4914.52 ± 0.8826.12 ± 1.67
Value ± standard deviation (SD), n = 3.
Table 3. The interaction effect of residue rates and tillage system on soil chemical properties.
TillageResidue RatepHECOCTNC:NPK
CTR100 8.08 ± 09 a0.98 ± 0.08 abc1.17 ± 06 cd0.13± 0.01 ab9.14 ± 1.41 b12.99 ± 0.83 e238.7± 8.79 6 e
R758.00 ± 0.09 ab0.97 ± 0.13 abc1.11 ± 0.05 de0.12 ± 0.01 ab8.83 ± 0.56 b11.32 ± 0.76 f224.37 ± 19.16 ef
R508.01 ± 0.03 ab0.88 ± 0.26 bc1.07 ± 0.07 ef0.13 ± 0.01 a8.08 ± 1.43 b10.93 ± 0.82 fg213.44 ± 17.66 f
R257.98 ± 0.08 ab0.84 ± 0.16 c1.02 ± 0.06 f0.11 ± 0.01 cde9.29 ± 1.22 b10.10 ± 0.53 fg179.70 ± 11 g
R07.94 ± 0.06 ab1.04 ± 0.13 a0.84 ± 0.06 g0.09 ± 0.00 e8.52 ± 0.86 b9.72 ± 0.47 g161.76 ± 19.86 h
NTR1007.70 ± 0.07 c1.10 ± 0.05 a1.41 ± 0.16 a0.12 ± 0.03 bc12.27 ± 2.19 a25.08 ± 3.86 a373.28 ± 62.81 bc
R757.73 ± 0.12 c1.05 ± 0.05 a1.35 ± 0.15 ab0.11 ± 0.03 c11.92 ± 1.86 a23.47 ± 2.71 b396.34 ± 60.43 a
R507.72 ± 0.05 c1.01 ± 0.04 ab1.32 ± 0.14 b0.11 ± 0.03 bcd12.13 ± 2.69 a20.59 ± 4.63 c382.70 ± 55.07 ab
R257.74 ± 0.09 c1.01 ± 0.03 ab1.23 ± 0.1 c0.10 ± 0.02 de12.28 ± 1.93 a20.50 ± 3.24 c364.6 ± 23.1 c
R07.73 ± 0.11 c1.01 ± 0.09 ab1.09 ± 0.06 e0.09 ± 0.01 e11.35 ± 1.26 a17.91 ± 1.77 d296.89 ± 35.29 d
Mean ± standard deviation, n = 4. Means with the same letter in each column are not significantly different.
Table 4. The interaction effect of residue rates and tillage system on soil micronutrients.
TillageResidue RateFeMnCuZn
CTR100 16.77 ± 3.08 a15.57 ± 1.4 de1.82 ± 0.13 a4.02 ± 0.5 a
R7515.40 ± 1.62 ab13.90 ± 0.92 f1.61 ± 0.14 bc3.00 ± 0.34 bc
R5014.30 ± 1.93 bc12.98 ± 1.19 fg1.55 ± 0.1 bc3.54 ± 0.43 ab
R2513.72 ± 1.76 c11.81 ± 1.16 gh1.46 ± 0.11 cd3.28 ± 0.64 b
R013.17 ± 1.45 c10.85 ± 0.87 h1.30 ± 0.16 d2.48 ± 0.37 cd
NTR1008.24 ± 0.63 d21.83 ± 1.67 a1.90 ± 0.21 a4.06 ± 1.11 a
R758.02 ± 0.7 d19.81 ± 2.25 b1.84 ± 0.21 a3.65 ± 1.04 ab
R507.57 ± 0.46 d17.67 ± 2.56 c1.82 ± 0.2 a2.57 ± 0.6 cd
R257.42 ± 0.52 d16.29 ± 2.46 cd1.65 ± 0.1 b2.50 ± 0.59 cd
R07.35 ± 0.74 d14.2 ± 1.76 ef1.48 ± 0.1 c2.22 ± 0.65 d
Mean ± standard deviation, n = 4. Means with the same letter in each column are not significantly different.
Table 5. The effect of residue rates, soil depth and their interaction on soil physical properties in the CT system.
TreatmentsMWDwWSAMWDdDSAAw
Residue rateR100 1.55 ± 0.11 a62.56 ± 3.66 a1.67 ± 0.15 a60.94 ± 4.12 a20.95 ± 0.97 a
R751.55 ± 0.13 a55.91 ± 3.99 b1.58 ± 0.12 a56.54 ± 3.87 b19.27 ± 1.10 b
R501.37 ± 0.11 b55.06 ± 6.12 b1.64 ± 0.10 a60.56 ± 3.48 a18.27 ± 1.30 b
R251.26 ± 0.09 c47.48 ± 5.32 c1.43 ± 0.04 b51.00 ± 2.11 c16.97 ± 1.61 c
R01.20 ± 0.08 c46.61 ± 5.63 c1.36 ± 0.08 b45.20 ± 4.07 d14.87 ± 1.63 d
Soil depth0 – 101.39 ± 0.20 a56.42 ± 5.6 a1.59 ± 0.17 a55.25 ± 7.74 a18.33 ± 2.25 a
10 – 201.38 ± 0.16 a50.63 ± 8.43 b1.48 ± 0.13 b54.44 ± 6.30 a17.80 ± 2.67 a
Mean ± standard deviation, n = 4. Means with the same letter in each column are not significantly different. Abbreviations: MWDw, Mean weight diameter of soil aggregates in wet condition; WSA, Water-stable aggregates; MWDd, Mean weight diameter of soil aggregates in dry condition; DSA, Dry-stable aggregates; Aw, Available water.
Table 6. The effect of residue rates, soil depth and their interaction on soil physical properties in the no-tillage (NT) system.
TreatmentsMWDwWSAMWDdDSAAw
Residue rateR100 1.59 ± 0.21 a66.17 ± 13.3 a1.75 ± 0.33 a73.41 ± 10.43 a26.96 ± 2.69 a
R751.52 ± 0.18 ab64.72 ± 13.47 a1.73 ± 0.11 a72.29 ± 8.62 a24.29 ± 1.30 b
R501.53 ± 0.13 ab60.85 ± 10.34 a1.67 ± 0.13 a67.52 ± 7.57 ab22.37 ± 0.82 c
R251.45 ± 0.18 bc54.72 ± 6.26 b1.58 ± 0.10 ab61.48 ± 5.15 b20.72 ± 1.64 d
R01.33 ± 0.13 c48.34 ± 5.36 c1.47 ± 0.09 b51.01 ± 5.40 c17.73 ± 2.27 e
Soil depth0 – 101.61 ± 0.15 a67.03 ± 11.47 a1.72 ± 0.17 a69.01 ± 12.3 a22.93 ± 3.72 a
10 – 201.36 ± 0.12 b50.89 ± 4.63 b1.56 ± 0.19 b61.28 ± 8.29 b21.90 ± 3.55 b
Mean ± standard deviation, n = 4. Means with the same letter in each column are not significantly different. Abbreviations: MWDw, Mean weight diameter of soil aggregates in wet condition; WSA, Water-stable aggregates; MWDd, Mean weight diameter of soil aggregates in dry condition; DSA, Dry-stable aggregates; Aw, Available water.
Table 7. The interaction effect of residue rates and tillage system on soil physical properties.
TillageResidue RateMWDwWSAMWDdDSAAw
CTR100 1.55 ± 0.1 ab62.564 ± 3.42 bc1.67 ± 0.14 ab60.93 ± 3.86 cd20.95 ± 0.9 cd
R751.54 ± 0.11 ab55.91 ± 3.73 d1.57 ± 0.11 bc56.53 ± 3.62 d19.27 ± 1.03 de
R501.36 ± 0.1 cd55.06 ± 5.72 d1.64 ± 0.09 ab60.56 ± 3.25 cd18.27 ± 1.21 ef
R251.26 ± 0.08 de47.48 ± 4.97 e1.42 ± 0.03 d50.99 ± 1.97 e16.96 ± 1.5 f
R01.12 ± 0.07 e46.61 ± 5.26 e1.36 ± 0.07 d45.19 ± 3.8 f14.86 ± 1.52 g
NTR1001.59 ± 0.19 a66.17 ± 12.56 a1.74 ± 0.3 a73.41 ± 9.76 a26.95 ± 2.51 a
R751.52 ± 0.16 ab64.71 ± 12.59 ab1.72 ± 0.1 a72.28 ± 8.06 ab24.29 ± 1.22 b
R501.52 ± 0.11 ab60.85 ± 9.67 c1.67 ± 0.12 ab67.51 ± 7.08 b22.36 ± 0.76 bc
R251.44 ± 0.17 bc54.71 ± 5.85 d1.58 ± 0.08 bc61.47 ± 4.82 c20.71 ± 1.53 cd
R01.32 ± 0.12 cd48.34 ± 5.01 e1.46 ± 0.08 cd51.01 ± 5.05 e17.72 ± 2.11 ef
Mean ± standard deviation, n = 4. Means with the same letter in each column are not significantly different.
Publisher’s Note: MDPI stays neutral with regard to jurisdictional claims in published maps and institutional affiliations.

