Article

Influence of Soil Properties and Initial Concentration on the Fractionation of Nickel, Zinc, Copper and Lead in Soils Derived from Different Parent Materials

by
Claudia Campillo-Cora
1,2,
Laura Rodríguez-González
1,2,
Manuel Arias-Estévez
1,2,
David Fernández-Calviño
1,2,* and
Diego Soto-Gómez
1,2
1
Área de Edafoloxía e Química Agrícola, Departamento de Bioloxía Vexetal e Ciencia do Solo, Facultade de Ciencias, Universidade de Vigo, Campus As Lagoas, s/n 32004 Ourense, Spain
2
CITACA-Clúster de Investigación y Transferencia Agroalimentaria del Campus Auga, Universidad de Vigo, 32004 Ourense, Spain
*
Author to whom correspondence should be addressed.
Agronomy 2021, 11(2), 301; https://doi.org/10.3390/agronomy11020301
Submission received: 23 December 2020 / Revised: 30 January 2021 / Accepted: 4 February 2021 / Published: 9 February 2021

Abstract

:
Different fractions of Ni, Zn, Cu and Pb were determined in metal-spiked forest soils derived from four parent materials using three extractants (H2O, CaCl2 and diethylenetriaminepentaacetic acid (DTPA)). It is important to determine how parent materials and soil properties affect the retention of these metals in order to predict their behavior and act accordingly in the event of accidental spillage, for example. The extraction of fractions was not sequential (before carrying out the extractions, the soil samples were divided into three parts), so the CaCl2 fraction also included the H2O one, and the DTPA fraction contained the other two. With the results, we developed models to predict the extraction of each fraction employing the physicochemical characteristics of the soil (e.g., pH, organic matter content and texture values) and the amount of metal added. The objective of this work was to determine how the properties of the soil would influence the fractioning of the metals considered, and through these characteristics create models to predict the behavior of each metal fraction. We found correlations between the different fractions of Ni and Zn, suggesting that there are soil properties that condition the retention of both metals. Pb and Cu showed different behavior than Zn or Ni, since the proportions extracted by H2O and CaCl2 were much lower. Regarding the DTPA fraction, unlike the case of Ni or Zn, the extraction of Cu and Pb was more homogeneous; they did not show great variation in different soils, even when considering the results of extraction in limestone soils. This may be due to the fact that the soil properties do not exert an important effect on their availability, or these two metals are considerably sensitive to the effect of pH, and no differences were observed because the extraction of the DTPA fraction was conducted with a buffered solution. For each fraction of metal used, we obtained a model with R2 always greater than 0.65. Considering these results, we can conclude that it is possible to predict Zn, Ni, Cu and Pb availability in soils developed on different parent materials. This can be achieved by identifying some basic soil characteristics and applying the developed equations.

1. Introduction

Soil contamination by heavy metals can be produced by natural geological sources, given the presence of certain metals in some rocks, or caused by human activities [1,2]. Increasing industrialization has turned the issue of metal contamination into a global problem. Soil pollution by heavy metals affects the growth of crops, since it reduces the uptake of nutrients and water by plants and inhibits the mitosis of root meristems [3]. Therefore, it affects productivity and constitutes a risk for human health and food security [4].
Soil has the capacity to filter metal contaminants and can buffer their effects, but above a certain concentration, retained metal has a toxic effect on organisms that inhabit the soil. The latter is conditioned by the chemical form of the metal. For this reason, the total amount of pollutants that soil has or can store is not as important as the chemical forms of these pollutants, as well as their mobility and availability. Endogenous metals, which come from the alteration of rocks and minerals present in the soil, usually appear in solid form, while metals that come from anthropogenic sources appear mostly in reactive species [4].
Bioavailability is the capacity of a pollutant to reach the receptors of a living organism [5]. This feature, in the case of metals, will be conditioned by the characteristics of the metal itself, the type of vegetation and the physicochemical properties of the soil in which it is found, including pH, organic matter and electrical conductivity, among others [6]. A fundamental part of the characterization of soils is identifying the parent material from which the soil was developed, since it will determine the types of clay that form the soil, its characteristics and its cation exchange capacity, as well as the way that heavy metals are retained in the soil [7].
When studying the fractions of metals present in soil, extractants of increasing reactivity are usually used to obtain increasingly stable fractions [1]. To study the bioavailability of metals, researchers try to reproduce the characteristics of the rhizosphere. To achieve this aim, it is common to use extractants formed by weak organic acids with low molecular weight, similar to those produced by roots in the form of exudates or those generated by the action of bacteria and fungi [8,9]. Diethylenetriaminepentaacetic acid (DTPA) and ethylene-diamine tetra-acetic acid (EDTA) are synthetic chelates widely used for this purpose because of their capacity to form very stable soluble metal complexes [10,11]. Both chelates are widely used to determine plant availability, but their use is conditioned by the environment: EDTA offers more precision in acidic media, while DTPA is used for more alkaline soils.
Another way to obtain the amount of bioavailable metals is to use water to determine soluble metals or to carry out ion exchange extractions. Exchangeable fractions of metals remain in the soil adsorbed to particles, such as clays or organic matter residue, so salt solutions such as CaCl2 or NaNO3 [12] are used to replace adsorbed ions and make them pass to the solution [11].
The effectiveness of the extraction methods mentioned above depends on the characteristics of the soil. Therefore, modifying some of the properties can make it possible for soil to store and immobilize a greater quantity of metals and prevent them from reaching plants or other ecosystems [4]. In recent years, methods based on the physicochemical modification of soil have been developed in order to immobilize a greater quantity of metals, for example, adding livestock manure or biochar to the soil [13].
Therefore, to properly apply remediation methods, i.e., to identify when the metals reach toxic levels and the amount that should be extracted so that it does not constitute a problem, it is essential to determine the properties of the soil and the natural availability of contaminants in it. In this work, we analyzed the ability of a series of soils to immobilize Cu, Ni, Pb and Zn after a spiking procedure performed under laboratory conditions, with the following objectives: (i) to determine how the properties of the soil affect the bioavailability of the mentioned metals; (ii) to look for patterns and relationships that would allow us to develop models and predict the behavior of these metals in the soil, and to detect contamination problems or carry out remediation tasks after spillage.

2. Materials and Methods

2.1. Soil Sampling and Analyses

The sampling was carried out in soils from 10 forests in the north-west of Spain. The soils were located in areas not contaminated by heavy metals (with natural levels, i.e., background values or geochemical baseline concentrations (GBCs), of these compounds) and developed over different parent materials: granite, limestone, schist and amphibolite. We determined their parent materials using geological maps of the area for their location [14]. These materials were selected because they present different levels of heavy metals in their crystalline structure, and at the same time, the soils developed over them present different physicochemical characteristics. The sampling was performed to obtain great variability, especially in terms of pH and organic matter. The characteristics of the parent materials of the area can be found in Paz-González et al. [15].
At the selected locations, surface soil samples (0–20 cm) were taken with an Edelman probe. Subsequently, the samples were homogenized, air-dried, sieved (<2 mm) and stored in polypropylene jars.
The samples were analyzed using a series of techniques to determine, among other properties, the distribution of particle size (sand, silt and clay); the amounts of organic matter (OM), dissolved organic carbon (DOC), total carbon and total nitrogen; pH (in water and KCl); available phosphorus; exchangeable cations (Ca, Mg, Na, K and Al); and different species of Fe and Al (associated with organic matter, non-crystalline inorganic oxy-hydroxides and crystalline forms). A summary of the characteristics obtained for each soil sample is shown in Table 1 and Table 2. For more information about the soil characterization methodology, see Campillo-Cora et al. [16,17] or the Supplementary Materials.

2.2. Spiking Procedure

Each dry soil sample was distributed in 8 centrifuge tubes, and we used 8 spiking concentrations. These soil samples were moistened to reach the 50–70% of their water-holding capacity with a series of salt solutions of the metals considered in the study. The following salts were used: Cu(NO3)2·3 H2O (for copper); Zn(NO3)2·6 H2O (for zinc); Ni(NO3)2·6H2O (for nickel); and Pb(NO3)2 (for lead). The final concentration of each metal in the soil, in mg kg−1 of soil, was 2000, 1000, 500, 250, 125, 62.5, 31.25 and 0. The salt solutions were added to the soil and mixed manually with a spatula to achieve a homogeneous mixture. The concentrations used ranged from natural values in soils to extreme values in contaminated areas [18]. After spiking, the resulting soil samples were incubated at 22 °C in the dark for 50–60 days.
Table includes parent material, effective cation exchange capacity (eCEC), amount of iron and aluminum forms associated with organic matter (FeOM and AlOM, respectively), amount of amorphous inorganic iron and aluminum forms (FeIA and AlIA, respectively), and amount of crystalline iron and aluminum forms (FeC and AlC, respectively). On the left side are soil ID numbers assigned (randomly) to each soil sample. <d.l., below detection limit.

2.3. Metal Extraction

After the incubation time, three subsamples of 1 g each were weighted. A one-step single extraction procedure was used with three extracting agents: H2O, CaCl2 and DTPA. The H2O fraction is the most labile and the DTPA is the most recalcitrant, while the CaCl2 fraction usually shows intermediate values [19]. Similar procedures were used by Kashem et al. [20].
To extract the H2O fraction, 10 mL of distilled water was added to 1 g of spiked soil [21]. The mixture was stirred for 2 h on a mechanical shaker (0.73 g) and centrifuged at 2000× g for 15 min, and then the supernatant was filtered through acid-washed paper.
To extract the CaCl2 fraction, 10 mL of CaCl2 0.01 M was added to each gram of soil [22]. The same shaking, centrifugation and filtering procedure used for the H2O fraction was followed.
For extraction of the DTPA fraction, an extractant solution composed of DTPA 0.005 M, triethanolamine 0.1 M and CaCl2 0.01 M was prepared [23], with a pH of 7.3 adjusted with HCl 6 M (1:10 soil/solution ratio). The same shaking, centrifugation and filtering procedure used for the other two fractions was followed.
The metal concentration in each extract was measured through atomic absorption spectrophotometry (AAnalyst 200, PerkinElmer, Boston, MA, USA).

2.4. Data Processing and Statistical Analysis

For each soil sample, we obtained data from 3 extractions of 4 metals using 7 concentrations and 1 control sample (unspiked). The control data were used to discuss the presence of metal naturally in the soil (background level). This control value (for each metallic fraction) was subtracted from the quantity extracted so that only the added and extracted proportions were taken into account in the final results. Throughout the paper, all correlations between variables were analyzed using the Pearson method.
The data in milligrams of metal per kilogram of soil were converted to proportions with regard to the added dose. These proportions were used to discuss the extracted fractions; through this method, it is easier to see the effect of the added concentration, and we can easily compare the results obtained for different metals in different soils. Moreover, to easily represent the results, the average of the proportions obtained for each soil sample was calculated, reducing each metal to 3 variables (1 per fraction) of 10 data points each (1 per soil).
To facilitate the method development, these proportions were transformed by using standard scaling [24]. With standard scaling, each individual value of a variable is transformed by subtracting the average value (of that variable) and dividing the result by the standard deviation (of that variable). As a result, the mean of the transformed variable will be equal to zero and the standard deviation will be equal to one. That is, values below zero are below the mean, and values above zero are over the mean. However, scaling will not influence the interpretation of models. The parent materials were also included in the models in the form of dummy variables, which were also transformed by standard scaling using the same procedure [25].
Model development was conducted using the Python 3.0 language [26], employing the Numpy [27], Pandas [28], Matplotlib [29] and ScikitLearn [24] libraries. With these tools, we tried to develop multiple linear regression models (using backward stepwise regression) for each fraction of each metal. To develop the models, we used 75% of the data, and the remaining 25% was used for validation. In addition, since we included the added concentration as a variable, we added a stratification step, selecting (for model development) 75% of the data from each concentration. It is important to note that in some models we only considered part of the data, since for low added concentrations (usually below 250–500 mg kg−1), the extracted amounts of some metals, such as H2O lead and H2O copper, were below the detection limits. These values (below the detection limit) appear in soils where the immobilization of metals is very efficient and do not present toxicity problems and are not of interest in the present study.
The developed models have a predictive purpose, but they were also developed in order to analyze the properties of soil and its effect on metal availability. When applying these models, we have to consider some important points: first, it is necessary to apply standard scaling to the samples (before entering the data in the models); second, in some cases, it is important to know the parent material, since some materials, such as granite or schist, will condition the fractionation of certain fractions; and third, it is important to know the amount of total metal that is in the soil or has reached it (in the event of a spill, for example, it is essential to know the amounts of Zn, Ni, Cu and Pb that have ended up in the soil).

3. Results and Discussion

3.1. Background Levels

Most of the studied metallic fractions presented levels below the detection limit. There are only two exceptions: in most of the soil samples, we were able to extract copper and lead with DTPA. The values of background DTPA copper range from 0.8 to 3.9 mg kg−1, slightly lower than those obtained in other works [30]. The average extracted amounts of DTPA Cu, regarding the different parent materials, were 2.3 ± 0.3 mg kg−1 for limestone soils, 1.9 ± 2.0 mg kg−1 for granite soils, 1.9 ± 0.8 mg kg−1 for amphibolite soils and 1.3 mg kg−1 for schist soil. Regarding background DTPA lead, in studies carried out in the same region, Paz-González et al. [15] detected between 0 and 23.2 mg kg−1 of Pb by using EDTA. They also found that soil with more lead had high levels of organic matter and had developed on granite and near urban areas, which suggests that anthropogenic contamination is one of the major sources of this metal. The average extracted amounts of DTPA Pb, regarding the different parent materials, were 1.7 ± 0.2 mg kg−1 for limestone soils, 1.1 ± 1.2 mg kg−1 for granite soils and 1.1 ± 0.5 mg kg−1 for amphibolite soils. We could not extract any DTPA Pb from the schist soil.
The metals Cu and Pb are more difficult to extract in natural conditions; since they are less bioavailable (as will be seen in the following sections), they seem to be less susceptible to being washed, and that is why they are found in higher proportions.

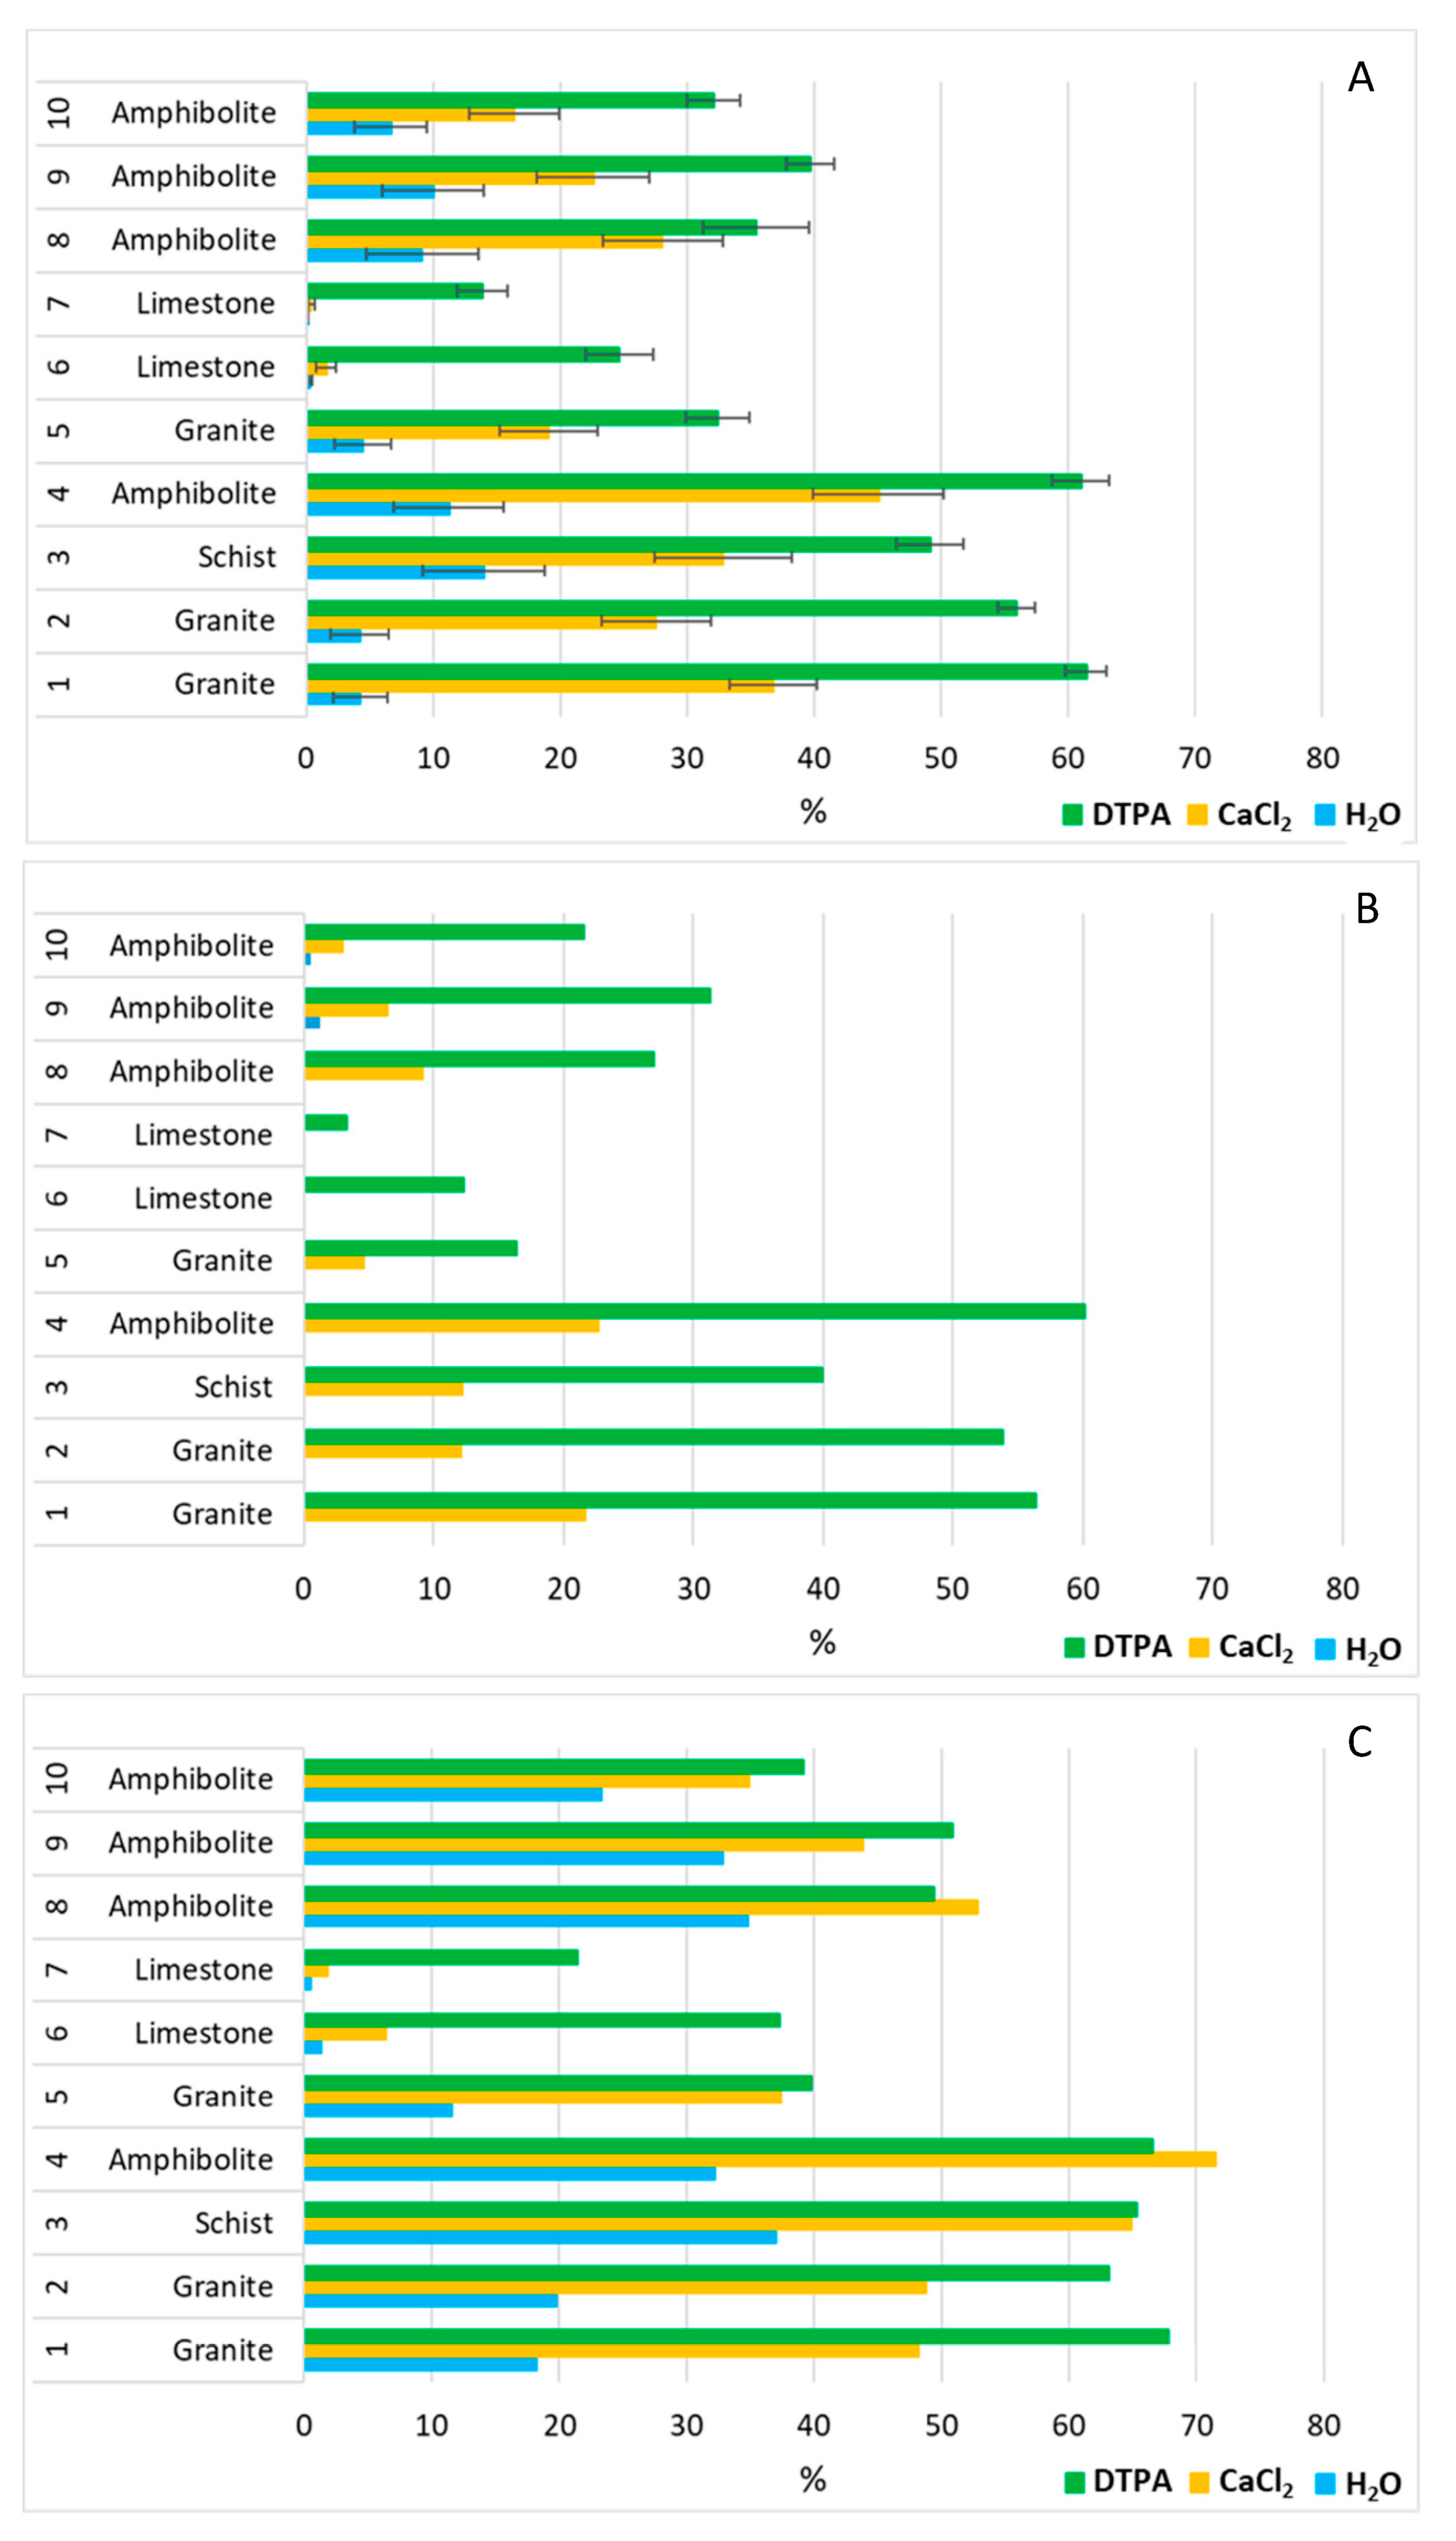
3.2. Zinc: Extraction Results and Model Development

All data obtained from the extraction of zinc are shown in Supplementary Table S1. Considering the average proportions of all concentrations, H2O Zn was extracted in a smaller proportion (compared with the other two fractions), reaching its maximum in schist soil (#3, 10.94 ± 5.81%) and amphibolite soils (between 4.50 ± 2.29% and 9.02 ± 4.55%) (Figure 1A). In granite soils, the proportion was slightly lower, and in limestone soils extraction of this fraction was minimal (below 0.14%). CaCl2 Zn was extracted in a bigger proportion from granite soils, reaching its maximum (41.94 ± 2.47%) (Figure 1A). The amounts of DTPA-extracted Zn were lower in limestone and in schist soil (between 24.75 ± 5.30% and 32.75 ± 6.77%) compared to amphibolite or granite soils, in which the average extraction reached 79.97 ± 3.13% (#1) (Figure 1A). This order was maintained for the rest of the metals studied: the H2O fraction was extracted in the smallest proportion, followed by CaCl2 (since it included the H2O fraction), and finally the DTPA fraction was extracted in the greatest proportion [31]. This trend was maintained considering only the lower (31.25 mg kg−1) and higher (2000 mg kg−1) spiking concentrations (Figure 1B,C).
In some cases, the usual extraction trend (for Zn, Ni and Cu) can be modified by the extraction conditions or the soil properties. For example, in some soils, we extracted more Zn with H2O than with CaCl2. This may be because CaCl2, despite being a widely used non-buffered extractant, is not very efficient and there is slight re-absorption [32]. In our case, this occurred, above all, in those soils that presented a greater amount of clay and silt (clay is included in the CaCl2 Cu and Zn models). On the other hand, in some soils, extraction with DTPA and CaCl2 is quite similar, or even more efficient with CaCl2, which may be because of experimental error (not more than 5% of metal is extracted with CaCl2), or because DTPA has a slightly basic pH and favors metal precipitation.
When modelling, we tried to use a sample size of 70 (considering all soils and all metal concentrations), but in the case of H2O Zn, we had to reduce it to 30, which corresponded to samples that were enriched with more than 500 mg kg−1. At that level, the extracted H2O Zn values were below the detection limit, and the metal has less importance from a contamination point of view.
The model obtained, with an adjusted R2 of 0.77 (F-value = 15.02, sig. = 0.00), was the following:
H2O Zn=(0.87 ± 0.15)ZnT+(0.32 ± 0.16)Schist−(0.67 ± 0.16)pH
(p < 0.01)(p = 0.07)(p < 0.01)
−(0.52 ± 0.18)Granite−(0.39 ± 0.16)K(1)
(p = 0.01)(p = 0.02)
where ZnT is the Zn concentration added to the soil, Schist and Granite are dummy variables for the parent materials, pH is the pH measured in water and K is the amount of exchangeable potassium.
ZnT is an essential variable in this model, since the amount of added zinc will condition the availability of all zinc fractions. This is because the soil has a limited capacity to store metals, and since the same amount of soil is always used in all experiments, the more zinc added, the more it will be in solution. The second variable that has great importance in the solubility of Zn is pH. As discussed above, at low pH, Zn remains in ionic form in solution, while at high pH, this element precipitates and becomes insoluble [17,33]. Regarding the parent material, if we compare granitic soils with soils developed on schist, we see that they have similar characteristics (pH, OM, eCEC, etc.) (Table 1 and Table 2), but the schist soil has a greater amount of iron and aluminum associated with organic matter. Therefore, in the schist soil, organic matter has a greater facility to form organometallic complexes, thereby increasing the solubility of Zn. As for the amount of potassium, this element has a negative relationship with the H2O zinc, since it is a metal that appears in great quantity in limestone soils, whose characteristics favor the precipitation of Zn. Potassium is also associated with higher eCEC, and the solubility of Zn is conditioned by the ability of soil to adsorb substances [17,34].
The model obtained for the CaCl2 zinc (n = 70, adjusted R2 = 0.68, F-value = 28.39, sig. = 0.00) is the following:
CaCl2 Zn=(0.29 ± 0.08)ZnT−(0.52 ± 0.09)pH−(0.32 ± 0.09)Clay
(p < 0.01)(p < 0.01)(p < 0.01)
−(0.38 ± 0.09)K (2)
(p < 0.01)
where ZnT is the Zn concentration added to the soil, pH is the pH measured in water, Clay is the percentage of clays and K is the amount of exchangeable potassium.
This model is quite similar to the one obtained for H2O Zn, but according to a previous study, extraction carried out with non-aggressive extractants, such as CaCl2, better represents the bioavailable Zn and is most sensitive to the effects of soil properties, such as pH, texture and organic matter [35]. CaCl2 Zn is more retained in clayey soils; therefore, the relationship we obtained between the CaCl2 Zn and the amount of clay has a negative slope [35]. Since CaCl2 zinc also includes H2O zinc, parameters such as pH and K will have some weight in its modelling.
The model obtained for the diethylenetriaminepentaacetic acid (DTPA) zinc (n = 70, adjusted R2 = 0.72, F-value = 27.70, sig. = 0.00) is the following:
DTPA Zn=(0.31 ± 0.07)ZnT+ (0.83 ± 0.12)Mg+ (0.47 ± 0.11)Amphibolite
(p < 0.01)(p < 0.01)(p < 0.01)
−(0.59 ± 0.08)pH−(0.58 ± 0.09)K(3)
(p < 0.01)(p < 0.01)
where ZnT is the Zn concentration added to the soil, Mg is the amount of exchangeable magnesium, Amphibolite is the parent material, pH is the pH measured in water and K is the amount of exchangeable potassium.
The predictor variables ZnT, pH and K can be explained in the same way as for H2O and CaCl2 zinc, since the DTPA fraction includes both. Concerning the amount of magnesium, this element competes with zinc for exchange sites, so a greater quantity of Mg will favor the availability of Zn [36]. As for amphibolite soils, these present average DTPA Zn values (compared to the other soils), since they have a low pH that favors availability, but a higher amount of organic matter that enhances retention. This is seen more clearly if we compare the different amphibolite soils: soils 4 and 8 show greater DTPA Zn release, since they have 10 and 12% OM, respectively, lower than the 20 and 29% presented by soils 9 and 10.

3.3. Nickel: Extraction Results and Model Development

All the data obtained from the extraction of nickel are shown in Supplementary Table S2. As with the previous metal (Zn), it was found that limestone soils best stored all fractions of Ni (Figure 2A–C). In all soils, DTPA Ni was extracted in a bigger proportion, with average values ranging from 13.88 ± 2.33% to 61.41 ± 1.88%, followed by CaCl2 Ni (0.38 ± 0.27% to 45.08 ± 6.15%) and, to a lesser extent, H2O Ni (0.08 ± 0.08% to 14.02 ± 5.73%). H2O and CaCl2 Ni were extracted slightly better than the same fractions of Zn, but DTPA showed the opposite behavior, and only in the schist soil was the bioavailability of Ni greater.
To model H2O Ni, we used only those data with added Ni (NiT) concentration greater than 125 mg kg−1. Thus, with n = 40 we obtained an adjusted R2 of 0.72 (F-value = 19.95, sig. = 0.00) with the following model:
H2O Ni=(0.71 ± 0.11)NiT+ (0.95 ± 0.28)Sand+ (0.38 ± 0.23)FeOM
(p < 0.01)(p < 0.01)(p = 0.11)
−(0.73 ± 0.34)Granite (4)
(p = 0.05)
where NiT is the total amount of Ni added to the soil, Sand is the proportion of sand in the samples, FeOM is the amount of iron associated with organic matter and Granite is the parent material.
The influence of NiT and granite in the H2O Ni is very similar to that found for Zn: the first variable directly influences the amount of available Ni in the soil, while granite has a large amount of organic matter but little AlOM and FeOM, which means it is likely to contribute little to the formation of soluble complexes with Zn, but does have a high capacity to retain it. The latter is reinforced by the inclusion in the model of FeOM. Finally, the influence of the amount of sand is explained by its small specific surface area and low capacity to retain cations [37]. Sand is a variable that has the same (positive) relationship with the three Ni fractions.
The model obtained for the CaCl2 Ni (n = 70, adjusted R2 = 0.84, F-value = 90.57, sig. = 0.00) is the following:
CaCl2 Ni=(0.62 ± 0.02)NiT+ (0.34 ± 0.06)AlC−(0.64 ± 0.06)pH(5)
(p < 0.01)(p < 0.01)(p < 0.01)
where NiT is the total amount of Ni added to the soil, AlC is the amount of crystalline aluminum forms and pH is the pH measured in water.
When developing models to predict CaCl2 Ni, there is a crucial parameter: the amount of crystalline aluminum (AlC). AlC is usually related to the amount of exchangeable Al extracted with CaCl2, since those exchangeable metals can be adsorbed to the crystalline forms of aluminum [38]. This is not the case here (considering the scaled proportions, r = 0.16; p < 0.05), but AlC has an influence when modelling CaCl2 nickel. These forms of Al are capable of adsorbing and releasing large amounts of trace metals, conditioning their concentration and mobility [39,40], and are considered important Ni deposits [41]. This variable has some importance in the case of DTPA Ni, as well as in the modelling of some fractions of copper and lead.
The model obtained for the DTPA nickel (n = 70, adjusted R2 = 0.81, F-value = 54.45, sig. = 0.00) is the following:
DTPA Ni=(0.26 ± 0.06)NiT+ (0.62 ± 0.06)AlC+ (0.69 ± 0.06)Al
(p < 0.01)(p < 0.01)(p < 0.01)
−(0.28 ± 0.06)Clay (6)
(p < 0.01)
where NiT is the total amount of Ni added to the soil, AlC is the amount of crystalline aluminum forms, Al is the amount of exchangeable aluminum and Clay is the percentage of clays.
The first part of the equation is similar to that obtained for CaCl2 Ni, since DTPA Ni also includes CaCl2 Ni (there is a significant correlation between the two fractions, r = 0.76; p < 0.05), and its retention is conditioned by similar variables. However, in modelling the fractionation of this element, it is clearly seen how the weight of the total added concentration (NiT) decreases as the extractant used is more aggressive: the coefficient is 0.73 for H2O Ni, 0.54 for CaCl2 Ni and 0.29 for DTPA Ni, indicating that other factors are gaining weight. This happens to a greater or lesser extent with the other metals studied. Texture is also included in this model, since the amount of clay favors the retention of cations. It also must be taken into account that the sand content presents a positive relationship with the extracted DTPA Ni (considering the scaled proportions, r = 0.72; p < 0.05). Exchangeable aluminum is more present in limestone and amphibolite soils, which have more clayey and loamy textures that favor nickel retention. In a previous work, Campillo-Cora et al. [17] found positive relationships between the CaCl2 amount of nickel and parameters that determine eCEC, such as Mg and Al. Related to this, Burachevskaya et al. [42] determined that the Al+3 that remains in exchange positions is an element that can be replaced by metal cations.

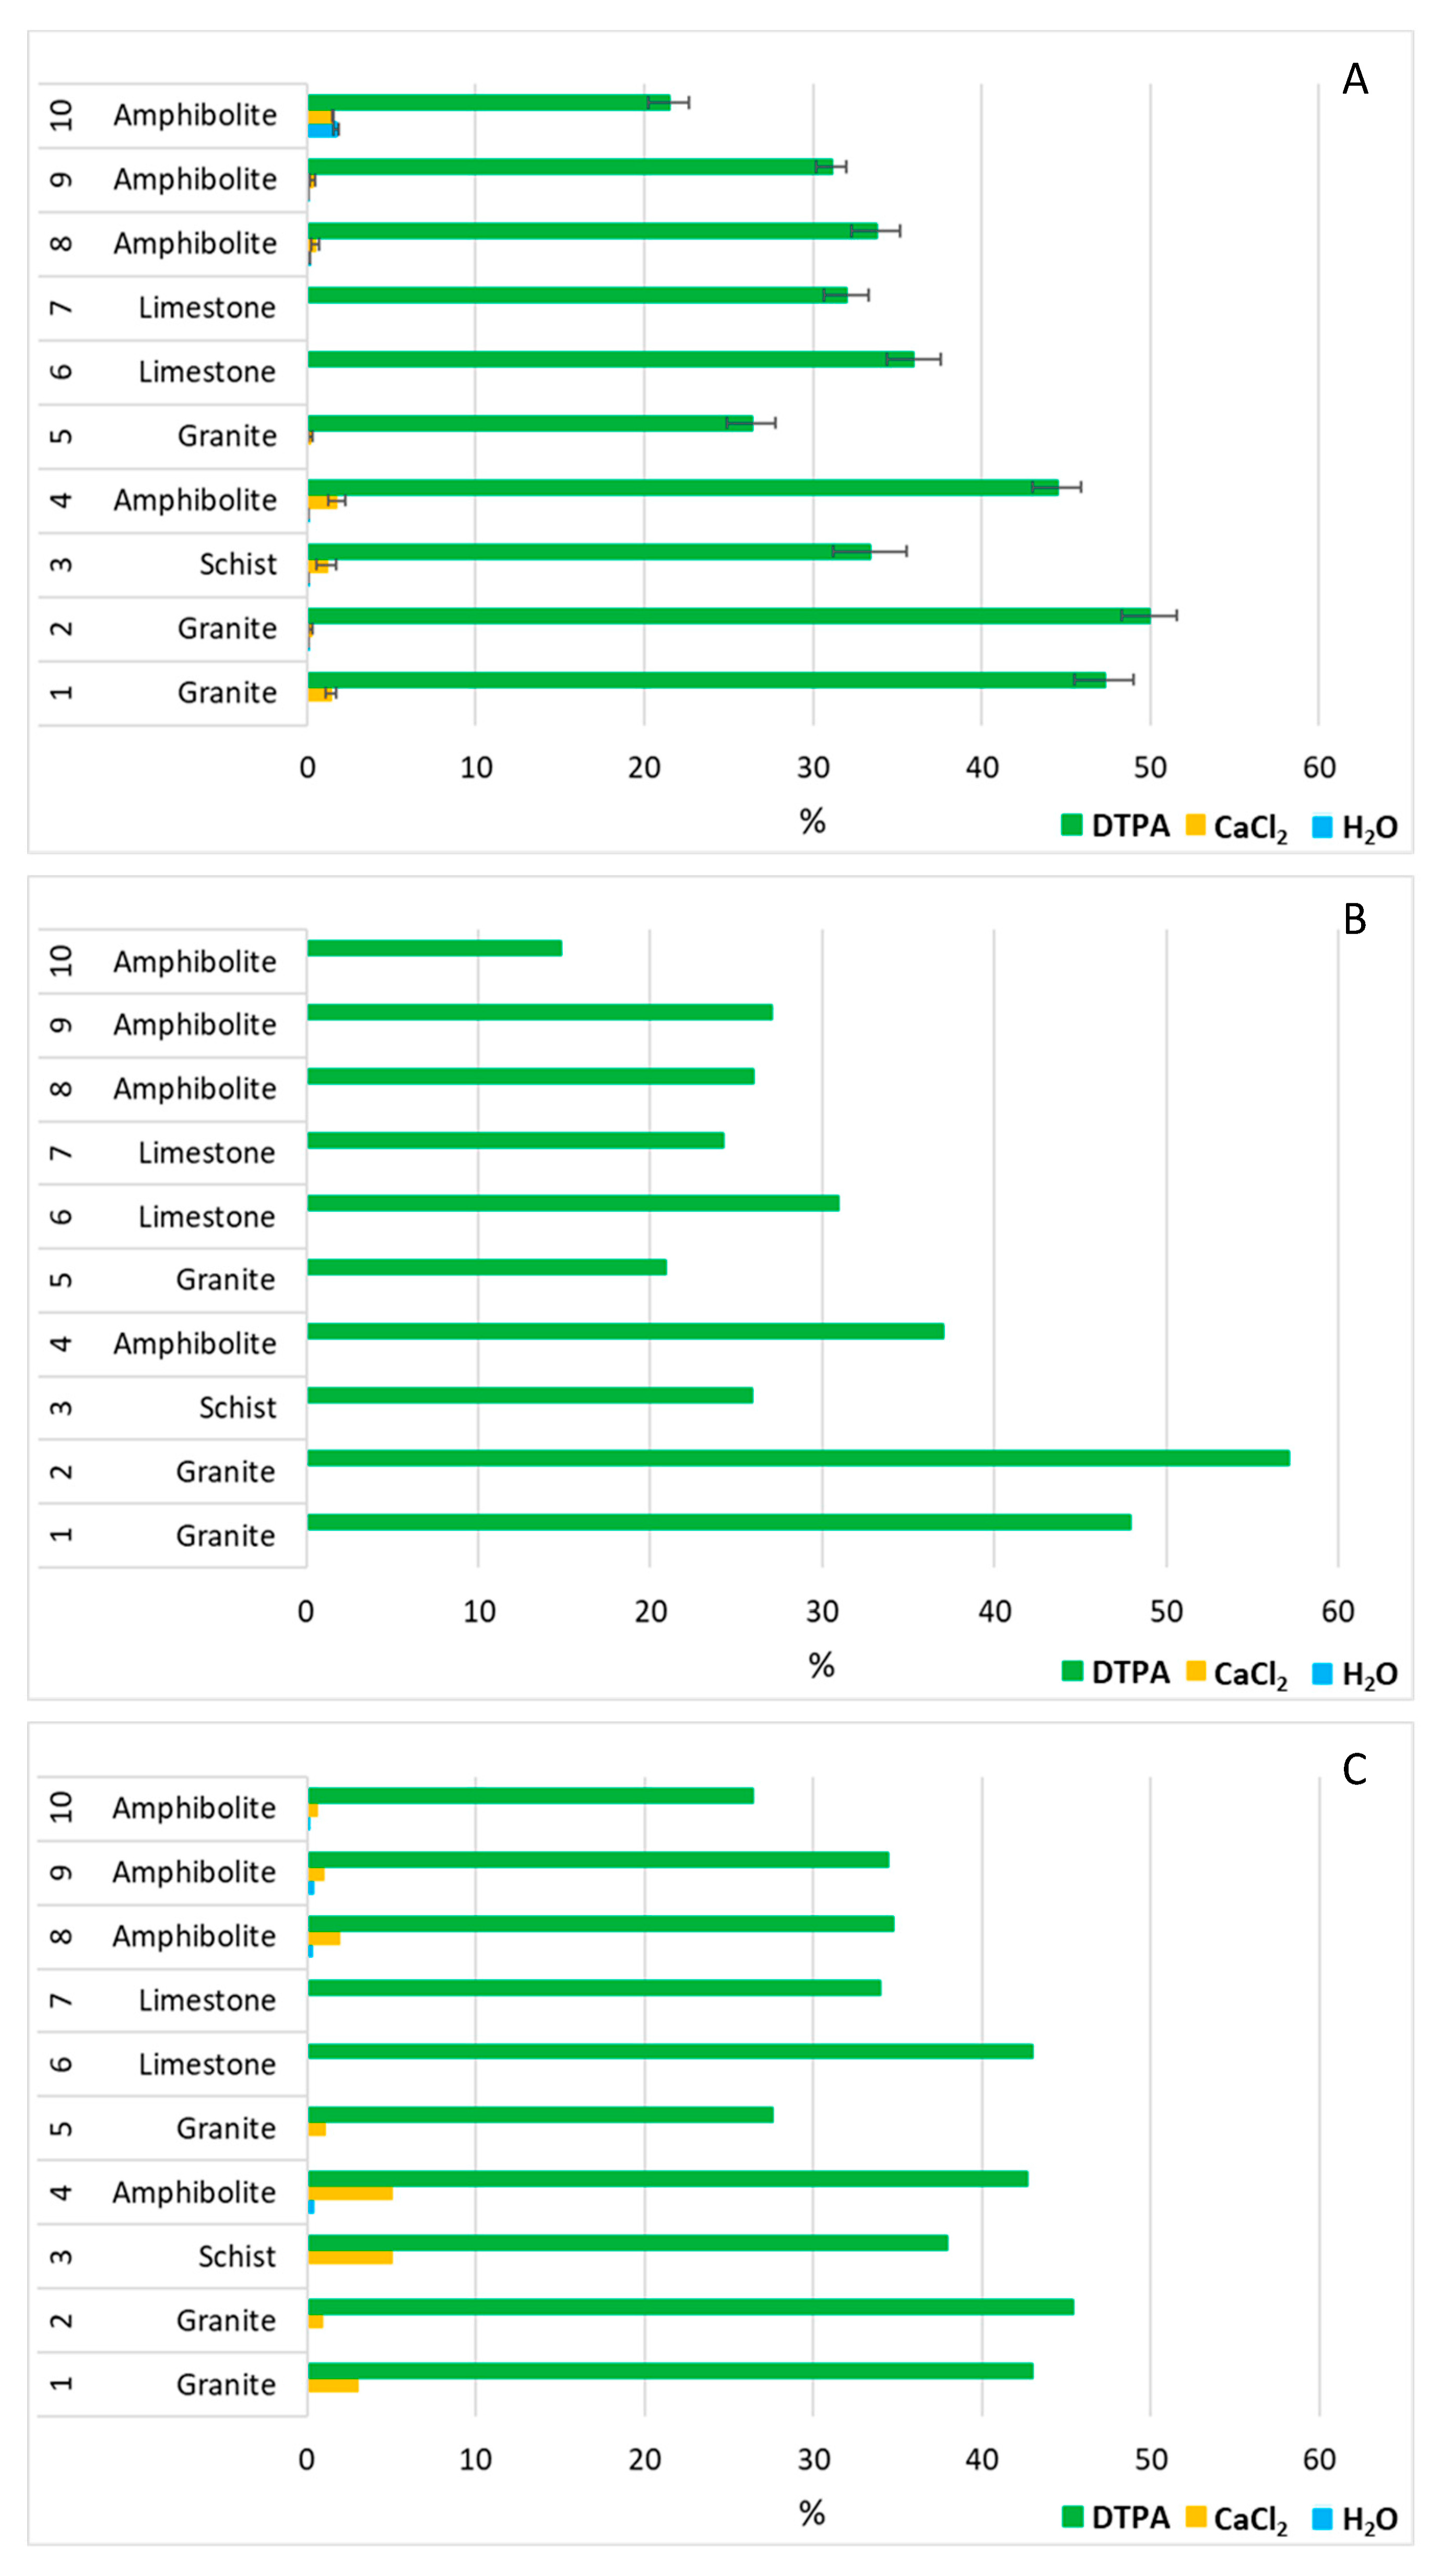
3.4. Copper: Extraction Results and Model Development

All the data obtained from the extraction of copper are shown in Supplementary Table S3. The average amount of H2O Cu extracted was less than 5% of the Cu added in all cases (Figure 3A). In the limestone soils, no amount of H2O copper was extracted, and the highest percentage of this fraction (4.53 ± 2.75%) was obtained in schist soil (Figure 3A). For the lowest added concentration of Cu (32.25 mg Cu kg−1 of soil), we were unable to extract any of the soluble fraction of this metal (Figure 3B). However, when using a spiking concentration of 2000 mg Cu kg−1 of soil, we extracted more than 10% in some samples (Figure 3C).
Average CaCl2 Cu presented a similar trend to H2O Cu, but the extraction percentages were slightly higher (Figure 3A). DTPA Cu was easily extracted (compared to the other two fractions), and the average values do not present a lot of variation depending on the parent material. The lowest average value extracted from this fraction was found in an amphibolite soil (#10, 21.86 ± 1.19%), and the highest in a granite soil (#1, 40.07 ± 3.07%) (Figure 3A). However, as can be seen in Figure 3C, when using the highest spiking concentration, the percentage extracted in soil 1 reached 50%.
As can be seen in Supplementary Table S3, in most soils, the proportions of H2O and CaCl2 copper remained below the detection limit for added Cu concentrations of 1000 and 500 mg kg−1, respectively. As with the previous metals, these values are not of interest since they do not cause contamination problems. The H2O copper model was developed with n = 20, and we obtained an adjusted R2 of 0.80 (F-value = 11.90, sig. = 0.00). The model is as follows:
H2O Cu=(0.67 ± 0.20)CuT+ (0.52 ± 0.21)AlC+ (0.40 ± 0.19)Schist
(p < 0.01)(p = 0.04)(p = 0.07)
−(0.48 ± 0.16)FeC−(0.49 ± 0.20)DOC(7)
(p = 0.01)(p = 0.04)
where CuT is the total amount of copper added, AlC is the amount of crystalline aluminum forms, Schist is the parent material, FeC is the amount of iron in crystalline form and DOC is the amount of dissolved organic carbon.
The amount of added copper will determine the amount of H2O, CaCl2 and DTPA, as happened with all metals studied. As with H2O Zn, schist as a parent material influences the amount H2O Cu and the explanation is the same: it is a parent material whose properties favor the availability of metals, and it also has a significant number of iron and aluminum forms associated with organic matter. AlC also plays an important role in the retention and release of metals, which was already seen in the case of nickel. The case of iron was explained by Bibak [43]: crystalline iron has significant weight in the retention of copper by acting as a sorbent of this element. FeC has a strong affinity for copper [44], which explains its relation with H2O Cu and DTPA Cu. Regarding the amount of carbon, its effect depends a lot on the soil conditions: texture, pH and iron, manganese and aluminum oxides, among others [45]. In the formula, it presents a negative value because the conditions of soils with more carbon favor immobilization. Furthermore, DOC, which could form organic–copper complexes, appears inversely related to the amount of AlOM and FeOM, because the affinity of aluminum and iron for dissolved organic carbon limits the amount of this material, preventing the formation of organic–copper complexes.
To model CaCl2 copper, we used n = 30, and we obtained an adjusted R2 of 0.77 (F-value = 15.38 sig. = 0.00) with the following model:
CaCl2 Cu=(0.66 ± 0.14)CuT+ (0.75 ± 0.16)AlC+ (0.64 ± 0.14)Al
(p < 0.01)(p < 0.01)(p < 0.01)
−(0.19 ± 0.15)Clay−(0.17 ± 0.16)C(8)
(p = 0.22)(p = 0.33)
where CuT is the total amount of copper added, AlC is the amount of crystalline aluminum forms, Al is the amount of exchangeable aluminum, Clay is the proportion of clays and C is the proportion of carbon in the samples.
A higher copper concentration contributes to the release of CaCl2 Cu, as does AlC, a material that, as seen, stores large amounts of cations and releases them depending on the soil conditions (moisture, pH and OM content, among others). However, exchangeable Al has a greater weight, since it is a cation that can displace and be displaced by zinc and copper cations [42]. The relationship of metal and texture follows what Harter [46] demonstrated: loamy and clayey soils retain cations more strongly than sandy soils. As for the proportion of carbon, it is a reflection of the amount of organic matter in the soil, a material that shows a great affinity for copper [47].
Cu extracted by DTPA involves H2O and CaCl2 Cu, and also Cu bound to carbonates and oxides and part of it bound to organic matter [48]. The DTPA copper model was made using all of the samples (n = 70), and an adjusted R2 of 0.65 (F-value = 20.00, sig. = 0.00) was obtained.
DTPA Cu=(0.52 ± 0.10)CuT−(0.57 ± 0.14)FeC−(0.49 ± 0.13)P
(p < 0.01)(p < 0.01)(p < 0.01)
−(0.52 ± 0.10)Schist−(0.35 ± 0.11)O.M.(9)
(p < 0.01)(p < 0.01)
where CuT is the total amount of copper added, FeC is the amount of iron in crystalline form, P is the amount of available phosphorus, Schist is a parent material and OM is the proportion of organic matter in the samples.
This model, in addition to presenting a slightly worse adjustment, introduces a variable that has not been used until now. CuT and FeC have the same effect as in H2O Cu, and OM favors retention, causing an effect similar to that produced by carbon on the availability of CaCl2 Cu. The case of schist soil can be explained by the pH: it is a soil with little organic matter that usually presents H2O and CaCl2 Cu fractions in great proportions (compared with other soils studied) (Figure 3C), but since the extraction is performed with a DTPA solution (pH = 7), Cu can precipitate or be retained in the large amount of AlC present in this soil. Regarding phosphorus, Ali et al. [49] pointed out interactions between this element and copper, perhaps due to the appearance of insoluble forms of this metal as copper phosphates.

3.5. Lead: Extraction Results and Model Development

Of all the metals studied, lead was extracted to a lesser extent with H2O and CaCl2 (Figure 4A–C). All of the data obtained from the extraction of lead are shown in Supplementary Table S4. H2O Pb is extracted in a small proportion in all amphibolite soils, and in a very small proportion, in schist soil and in some granite soils (Figure 4A,C). In soil 10, the maximum average extraction of this fraction was obtained (1.71 ± 0.16%), which was much higher than that found in the other soils (Figure 4A). In limestone soils, the extraction of H2O lead was below the detection limit. Kabala and Singh [45] pointed out that even in contaminated soils, the proportion of H2O lead is below 0.5 mg kg−1 of soil. CaCl2 Pb had slightly higher values than H2O Pb, although far from DTPA Pb, especially considering the highest spiking concentration (Figure 4C). As in the case of H2O Pb, we could not extract any amount from limestone soils (Figure 4A–C). In the other soils, the average values for this fraction ranged from 0.23 ± 0.13% to 1.76 ± 0.64%. DTPA Pb was the fraction extracted in the highest proportion, with average values ranging from 21.46 ± 1.45% of soil 10 (amphibolite) to 49.96 ± 1.95% of soil 1 (granite).
H2O Pb could not be modelled, since there were too many soils from which we were not able to extract this fraction and considering that the amount of H2O Pb in soil 10 was very high (two standard deviations over the average). This soil has also a much larger amount of organic matter. If we do not consider these data, we see that H2O lead is directly related to the amount of FeOM and AlOM and inversely related to DOM, which seems to indicate the formation of organometallic compounds that hinder the precipitation of this element [50].
To model the extraction of CaCl2 lead, we used the values of those soils spiked with more than 250 mg kg−1. With n = 30 we obtained an adjusted R2 of 0.69 (F-value = 10.31, sig. = 0.00) using the following model:
CaCl2 Pb=(0.52 ± 0.15)PbT+ (0.40 ± 0.21)AlC−(0.40 ± 0.15)pH
(p < 0.01)(p = 0.08)(p = 0.02)
−(0.70 ± 0.22)FeC−(0.74 ± 0.24)P(10)
(p < 0.01)(p < 0.01)
where PbT is the total amount of lead added, AlC is the amount of crystalline aluminum forms, pH is the pH measured in water, P is the amount of available phosphorus and FeC is the amount of iron in crystalline form.
The added lead, as with the previous metals, had an important effect on both CaCl2 and DTPA fractions (as we will see below), and the pH had a negative value since it favors precipitation. In addition, the rest of the variables that explain CaCl2 Pb behaved similar to what was observed in the copper fractions. For example, phosphorous presented the same sign when modelling DTPA Cu, since it favors the appearance of insoluble phosphates. On the other hand, it has been shown that phosphorus acts as a bonding element between some metals and organic matter, and also slows down the desorption of metals such as Zn [51]. AlC and FeC showed the same signs for H2O Cu, since both metals have similar behaviors. This seems a little contradictory, but those forms of aluminum and iron are sorbents that have different effects depending on the pH, the type of oxide, and the type of bond that is formed [40]. The effect of crystalline aluminum has been widely studied [52], and it has been determined that there are multiple mechanisms that condition lead retention, including diffusion into micropores before sorption and surface precipitation. Therefore, it seems that the FeC forms managed to store the Pb cations more strongly. This theory is reinforced by the fact that crystalline forms of iron have a strong affinity for Pb [44].
We were able to extract DTPA lead in all soils, so n = 70 was used. An adjusted R2 of 0.79 (F-value = 32.74, sig. = 0.00) was obtained with the following model:
DTPA Pb=(0.19 ± 0.07)PbT+(0.39 ± 0.09)AlC+(0.65 ± 0.09)Na
(p < 0.01)(p < 0.01)(p < 0.01)
−(0.95 ± 0.09)AlOM−(0.51 ± 0.11)P−(0.46 ± 0.08)pH(11)
(p < 0.01)(p < 0.01)(p < 0.01)
where PbT is the total amount of lead added, AlC is the amount of crystalline aluminum forms, Na is the amount of exchangeable sodium, AlOM is the amount of aluminum associated with organic matter, P is the amount of available phosphorus and pH is the pH measured in water.
In this case, the added lead did not have as much weight as the AlC or the Na, a variable that did not appear in any of the previous models. The amount of exchangeable sodium is a value that contributes to the eCEC of the soil, and Campillo-Cora et al. [17] found relationships between the amounts of Na, Mg and Ca, and CaCl2 Pb. In this model, as in the previous one, the amount of phosphorus and the pH had a negative sign [53] for the same reasons, but the AlOM also contributed in the modelling. However, this variable can be closely related to pH, since, if we exclude limestone soils, pH and amount of AlOM present a fairly good relationship (considering the scaled proportions, r = 0.67; p < 0.05).

3.6. Relations between Metal Fractions

Nickel and zinc showed similar behavior in the studied soils. Considering the scaled proportion obtained for each sample, there are significant correlations between the H2O (r = 0.92; p < 0.001), CaCl2 (r = 0.48; p < 0.001) and DTPA (r = 0.78; p < 0.001) fractions extracted from both elements (Table 3). This agrees with what was stated in previous works [54,55], affirming that the two elements have similar mobility, maybe because they are both divalent metals that occupy similar exchange positions [55]. Furthermore, it was found that both metals share the same absorption pattern in some plants [56]. We found that this relation was maintained even in soils developed over different parent materials.
On the other hand, the amount of CaCl2 copper recovered was much less than the amount of zinc or nickel, which is in agreement with what was found by Hodgson et al. [57]. However, there are some relationships between these three elements. For example, H2O Cu is directly related to H2O Zn and H2O Ni (Table 3).
A small amount of lead was extracted with H2O and CaCl2, and we were able to extract more DTPA Pb than DTPA Cu. H2O Pb correlates with H2O Cu and Zn, and CaCl2 Pb shows a significant linear correlation with almost all fractions of the other metals. Moreover, DTPA Pb correlates quite well with DTPA Cu, Ni and Zn fractions. This indicates that soil properties, such as pH, eCEC, texture and amount of aluminum and iron forms, determine the bioavailability of the four elements [58], even when considering soils developed over different parent materials.

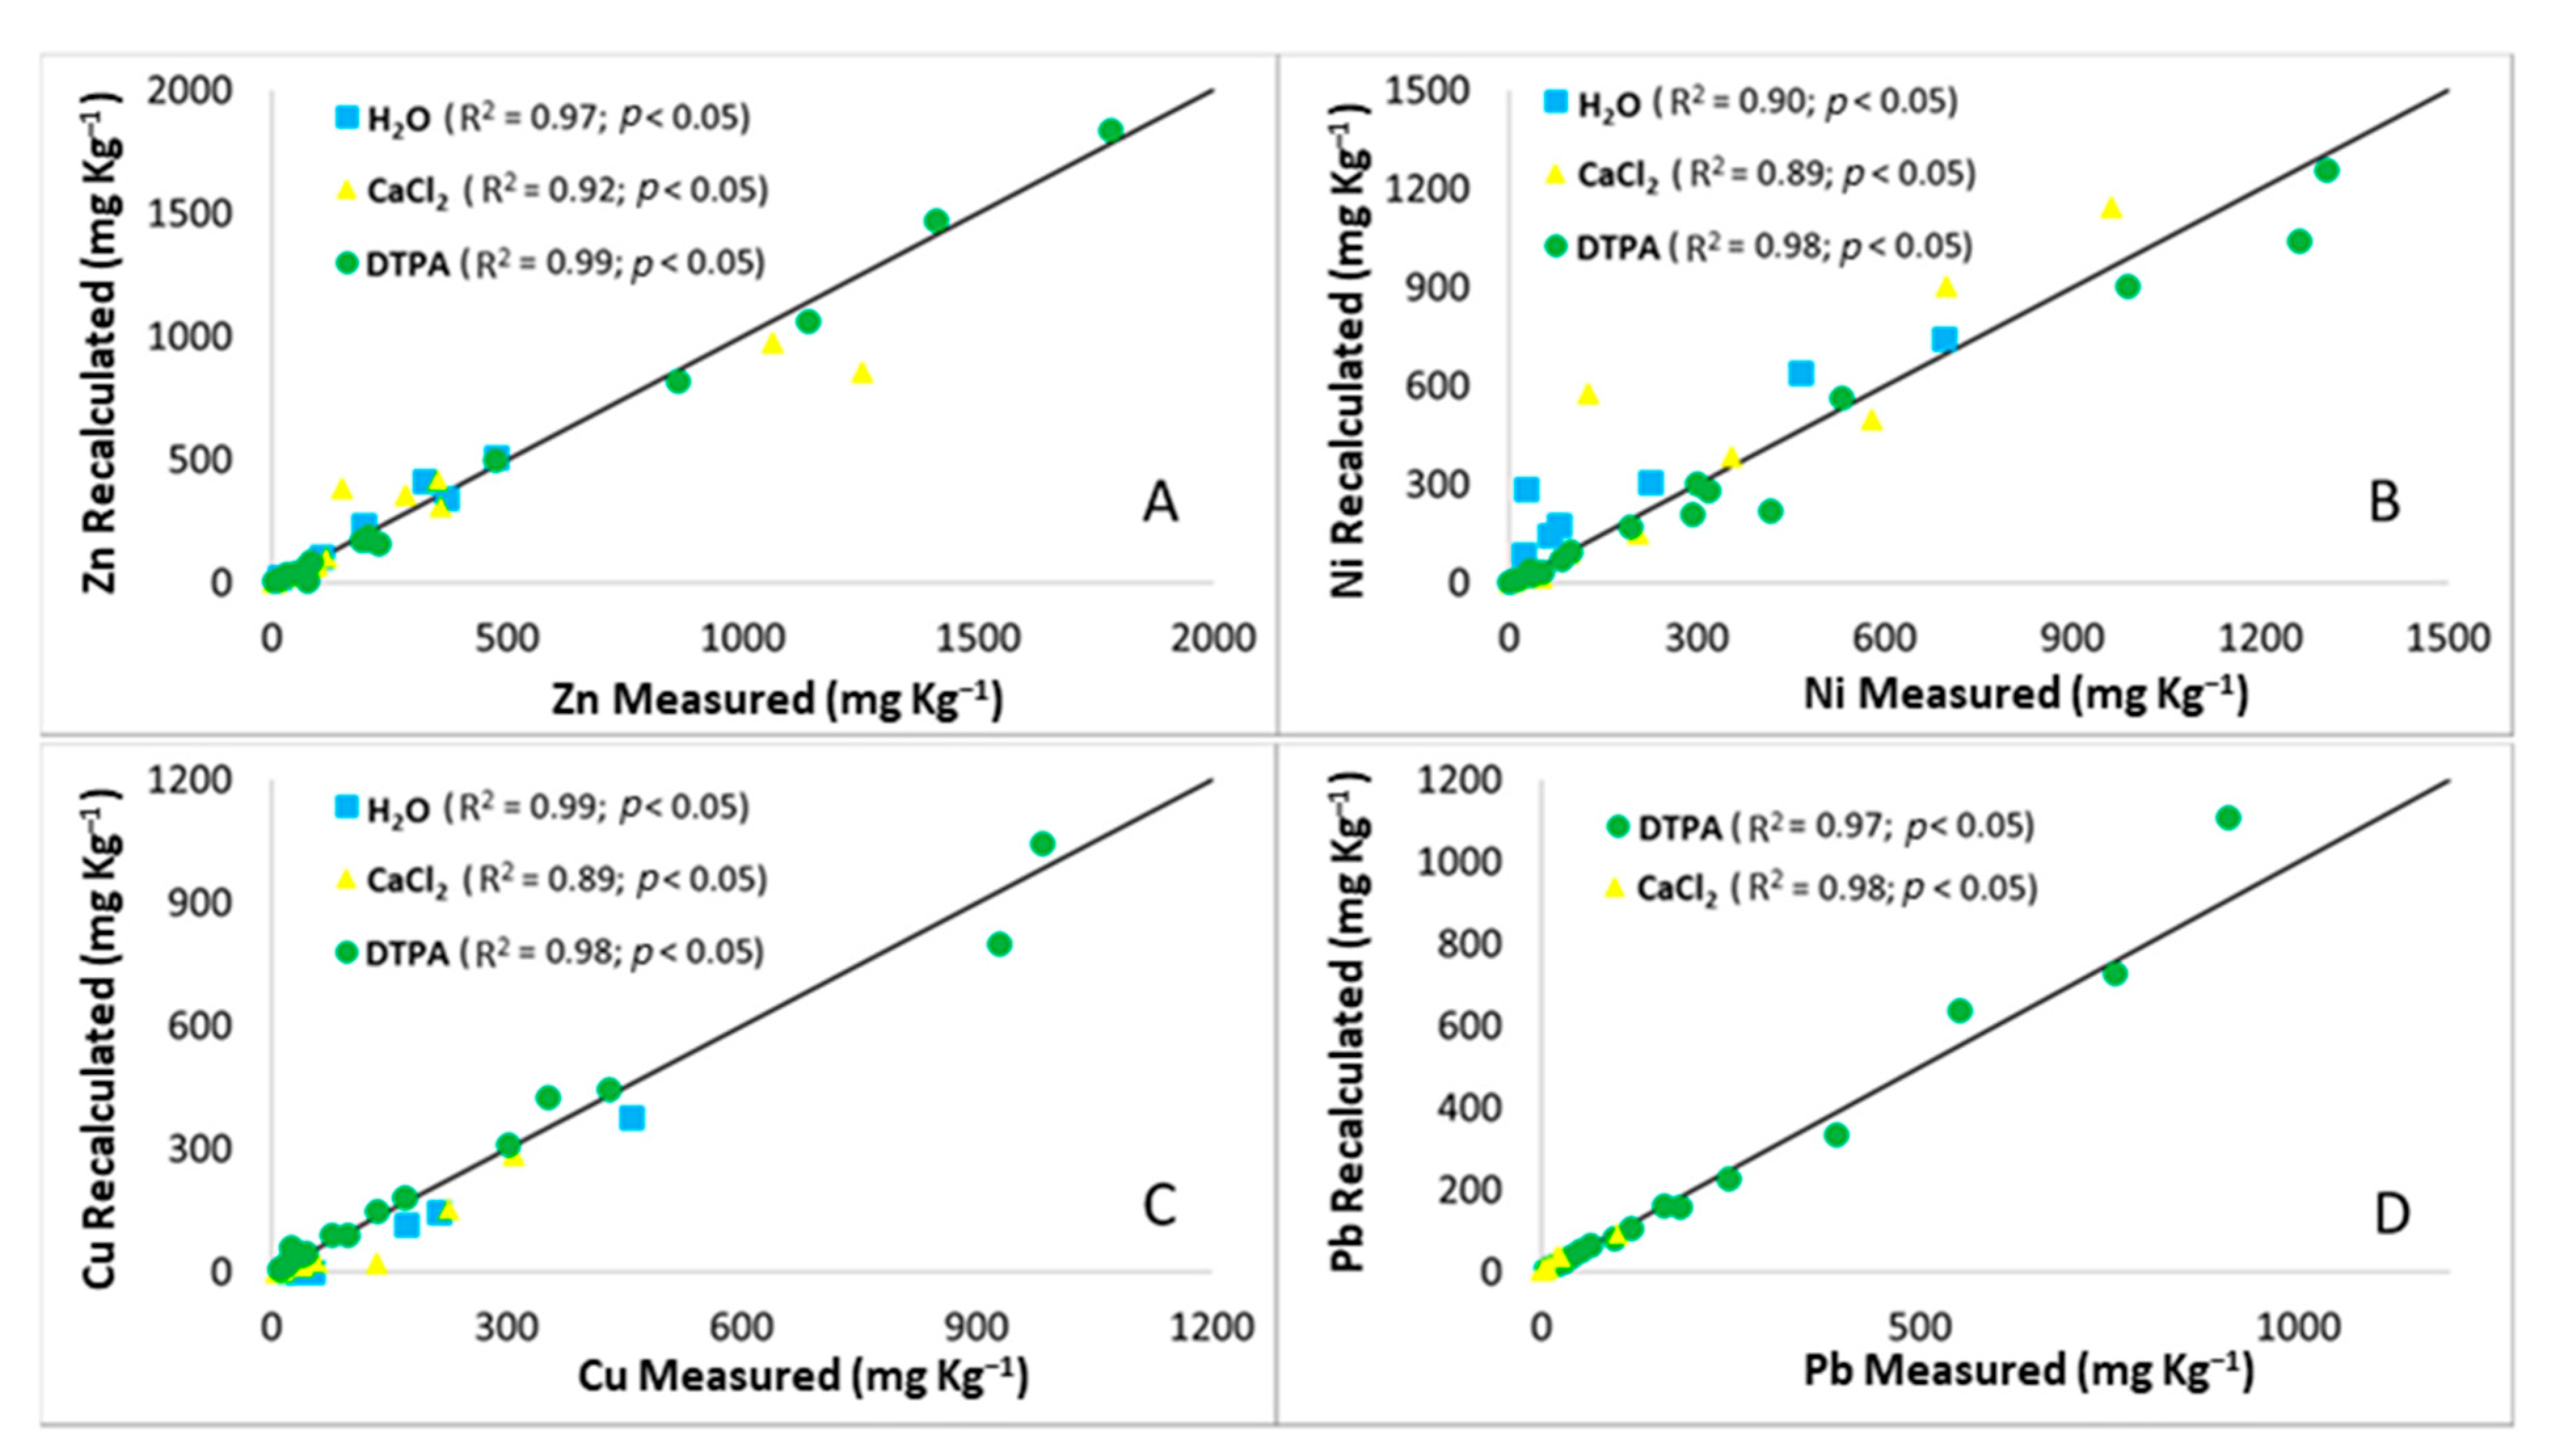
3.7. Models: Usage and Goodness of Fit

When using the models, it is necessary to make a standard scale of the variables considered beforehand, as indicated in the Materials and Methods section. This way, the variables are independent of the units. It is also possible to make an inverse conversion from the scaled data; for this, it is necessary to multiply each scaled value by the standard deviation (of the non-scaled variable) and add the mean (of the non-scaled variable). Through this method, we were able to recalculate the amount of each fraction extracted (Figure 5).
Regarding the goodness of fit of the models, in Figure 5, we can see a comparison between real and estimated values (in mg kg−1 of soil). In the case of Zn, both H2O Zn and DTPA Zn fit the model quite well (Figure 4A); however, CaCl2 Zn presents some values (for high concentrations) that deviate a bit from the model. Regarding Ni, the data do not fit the model so well, particularly the two values of H2O and CaCl2. Both were obtained from the same amphibolite soil, which appears to have a greater capacity to retain nickel than what was predicted by the model. It is important to consider that the Ni models were developed from few variables, and organic matter was not included. OM is a factor that varies greatly in amphibolite soils and could have an important weight in the retention. As for Cu (Figure 5C), the DTPA fraction fits the model quite precisely, but the model slightly underestimates H2O and CaCl2 Cu. Finally, the Pb fractions (Figure 5D) can be predicted quite accurately using the developed models.

4. Conclusions

Fractionation of metals present in the soil will condition their toxicity to organisms that live in the soil. To achieve this aim, it is essential to determine how the soil properties affect fractionation and to develop models that allow making predictions so that we know how to proceed with remediation tasks in case of accidental spillage.
We can divide the metals studied into two groups: Zn and Ni on the one hand, and Cu and Pb on the other. Extraction of the first two metals was much more heterogeneous than that of the others, that is, the soil characteristics greatly conditioned the fractionation. On the other hand, the extraction of Pb and Cu was more homogeneous in all soils.
When developing models for different fractions, the concentration added to the soil is a fundamental parameter. This variable appears in all models and has greater weight for H2O fractions than for CaCl2 or DTPA fractions. pH also has great importance and presents a negative correlation with all metal fractions. The amount of crystalline forms of aluminum has a lot of weight in the availability of the metals studied and is always included in the models with a positive sign, indicating that it favors the mobilization of metals in the studied soils, especially the CaCl2 and DTPA fractions. Something different happens with the amount of crystalline forms of iron, which seem to favor immobilization, especially of metal fractions for which it shows affinity, such as copper or lead. Texture also has weight in the models, since fine particles (clays) favor immobilization, a similar effect to that caused by phosphorus or organic matter.
In this study, we concluded that it is possible to contribute to the prediction of heavy metal behavior in the context of pollution problems, i.e., toxicity issues caused by high levels of certain metals (generated by incorrect fertilization or spillage, for example) through models such as those presented in this work, based on knowledge from a very manageable number of physicochemical properties. Additionally, this is applicable to soils developed on different parent materials. For example, in the case of zinc, if spillage occurs, we can know how much of this material will be available to plant organisms (DTPA Zn) by determining the magnitude of the spill, the soil pH, the amount of magnesium and potassium, and the parent material. This knowledge can then be used in remediation works: we can determine how much zinc has to be extracted so that it does not present a problem for plants in the area.

Supplementary Materials

The following are available online at https://www.mdpi.com/2073-4395/11/2/301/s1, Table S1: Percentage of (A) H2O, (B) CaCl2, and (C) DTPA Zn extracted with respect to the concentration added in each soil, Table S2: Percentage of (A) H2O, (B) CaCl2, and (C) DTPA Ni extracted with respect to the concentration added in each soil, Table S3: Percentage of (A) H2O, (B) CaCl2, and (C) DTPA Cu extracted with respect to the concentration added in each soil, Table S4: Percentage of (A) H2O, (B) CaCl2, and (C) DTPA Pb extracted bioavailable with respect to the concentration added in each soil.

Author Contributions

Conceptualization, M.A.-E. and D.F.-C.; methodology, M.A.-E. and D.F.-C.; formal analysis, C.C.-C., D.S.-G. and D.F.-C.; investigation, C.C.-C., D.S.-G. and D.F.-C.; writing—original draft preparation, C.C.-C. and D.S.-G.; writing—review and editing, D.S.-G., D.F.-C. and L.R.-G.; funding acquisition, M.A.-E., and D.F.-C.; data curation: D.S.-G., C.C.-C. and L.R.-G.; supervision: M.A.-E. and D.F.-C.; project administration: D.F.-C. All authors have read and agreed to the published version of the manuscript.

Funding

This work was supported by the Spanish Ministry of Economy and Competitiveness and Xunta de Galicia through the projects CTM2015-73422-JIN and ED431F 2018/06. It was also supported by Xunta de Galicia via the CITACA Strategic Partnership (ED431E 2018/07) and funding for research groups (ED431C 2017/62-GRC). D. Fernández-Calviño holds a Ramón y Cajal contract (Ministry of Economy, Industry and Competitiveness). C. Campillo-Cora received a pre-doctoral fellowship funded by the University of Vigo.

Institutional Review Board Statement

Not applicable.

Informed Consent Statement

Not applicable.

Conflicts of Interest

The authors declare no conflict of interest. The funders had no role in the design of the study, in the collection, analyses, or interpretation of data; in the writing of the manuscript, or in the decision to publish the results.

References

  1. Ramos, L.; Hernandez, L.M.; Gonzalez, M.J. Sequential Fractionation of Copper, Lead, Cadmium and Zinc in Soils from or near Doñana National Park. J. Environ. Qual. 1994, 23, 50–57. [Google Scholar] [CrossRef]
  2. Wang, Y.-L.; Tsou, M.-C.; Liao, H.-T.; Hseu, Z.-Y.; Dang, W.; Hsi, H.-C.; Chien, L.-C. Influence of soil properties on the bioaccessibility of Cr and Ni in geologic serpentine and anthropogenically contaminated non-serpentine soils in Taiwan. Sci. Total Environ. 2020, 714, 136761. [Google Scholar] [CrossRef]
  3. Vega, F.A.; Covelo, E.F.; Andrade, M.L.; Marcet, P. Relationships between heavy metals content and soil properties in minesoils. Anal. Chim. Acta 2004, 524, 141–150. [Google Scholar] [CrossRef]
  4. Wan, Y.; Huang, Q.; Wang, Q.; Yu, Y.; Su, D.; Qiao, Y.; Li, H. Accumulation and bioavailability of heavy metals in an acid soil and their uptake by paddy rice under continuous application of chicken and swine manure. J. Hazard. Mater. 2020, 384, 121293. [Google Scholar] [CrossRef]
  5. Ehlers, L.J.; Luthy, R.G. Contaminant bioavailability in soil and sediment. Environ. Sci. Technol. 2003, 37, 295A–302A. [Google Scholar] [CrossRef] [PubMed] [Green Version]
  6. Sauvé, S.; McBride, M.B.; Norvell, W.A.; Hendershot, W.H. Copper solubility and speciation of in situ contaminated soils: Effects of copper level, pH and organic matter. Water. Air. Soil Pollut. 1997, 100, 133–149. [Google Scholar] [CrossRef]
  7. Kabata-Pendias, A. Trace Elements in Soils and Plants; CRC Press: Boca Raton, FL, USA, 2000. [Google Scholar] [CrossRef]
  8. Fox, T.R.; Comerford, N.B. Low-Molecular-Weight Organic Acids in Selected Forest Soils of the Southeastern USA. Soil Sci. Soc. Am. J. 1990, 54, 1139–1144. [Google Scholar] [CrossRef]
  9. Ma, L.Q.; Rao, G.N. Chemical Fractionation of Cadmium, Copper, Nickel, and Zinc in Contaminated Soils. J. Environ. Qual. 1997, 26, 259–264. [Google Scholar] [CrossRef] [Green Version]
  10. Feng, M.-H.; Shan, X.-Q.; Zhang, S.; Wen, B. A comparison of the rhizosphere-based method with DTPA, EDTA, CaCl2, and NaNO3 extraction methods for prediction of bioavailability of metals in soil to barley. Environ. Pollut. 2005, 137, 231–240. [Google Scholar] [CrossRef] [PubMed]
  11. Kwon-Rae, K.; Owens, G.; Ravi, N.; Kye-Hoon, K. Assessment Techniques of Heavy Metal Bioavailability in Soil—A critical Review. Korean J. Soil Sci. Fertil. 2007, 40, 311–325. [Google Scholar]
  12. Nolan, A.L.; Zhang, H.; McLaughlin, M.J. Prediction of Zinc, Cadmium, Lead, and Copper Availability to Wheat in Contaminated Soils Using Chemical Speciation, Diffusive Gradients in Thin Films, Extraction, and Isotopic Dilution Techniques. J. Environ. Qual. 2005, 34, 496–507. [Google Scholar] [CrossRef]
  13. Rinklebe, J.; Shaheen, S.M.; Frohne, T. Amendment of biochar reduces the release of toxic elements under dynamic redox conditions in a contaminated floodplain soil. Chemosphere 2016, 142, 41–47. [Google Scholar] [CrossRef] [PubMed]
  14. Macías Vázquez, F.; Calvo de Anta, R. Niveles Genéricos de Referencia de Metales Pesados y Otros Elementos Traza en Suelos de Galicia; Consellería de Medio Ambiente e Desenvolvemento Sostible: Santiago de Compostela, Spain, 2009; ISBN 9788445346648. [Google Scholar]
  15. Paz-González, A.; Taboada-Castro, T.; Taboada-Castro, M. Levels of Heavy metals (Co, Cu, Cr, Ni, Pb, and Zn) in agricultural soils of Northwest Spain. Commun. Soil Sci. Plant Anal. 2000, 31, 1773–1783. [Google Scholar] [CrossRef]
  16. Campillo-Cora, C.; Soto-Gómez, D.; Arias-Estévez, M.; Bååth, E.; Fernández-Calviño, D. Bacterial community tolerance to Cu in soils with geochemical baseline concentrations (GBCs) of heavy metals: Importance for Pollution Induced Community Tolerance (PICT) determinations using the leucine incorporation method. Soil Biol. Biochem. 2021, 108157. [Google Scholar] [CrossRef]
  17. Campillo-Cora, C.; Conde-Cid, M.; Arias-Estévez, M.; Fernández-Calviño, D.; Alonso-Vega, F. Specific Adsorption of Heavy Metals in Soils: Individual and Competitive Experiments. Agronomy 2020, 10, 1113. [Google Scholar] [CrossRef]
  18. Wuana, R.A.; Okieimen, F.E. Heavy Metals in Contaminated Soils: A Review of Sources, Chemistry, Risks and Best Available Strategies for Remediation. ISRN Ecol. 2011, 2011, 1–20. [Google Scholar] [CrossRef] [Green Version]
  19. Hosseinpur, A.R.; Motaghian, H. Evaluating of many chemical extractants for assessment of Zn and Pb uptake by bean in polluted soils. J. Soil Sci. Plant Nutr. 2015, 15, 24–34. [Google Scholar] [CrossRef] [Green Version]
  20. Kashem, M.A.; Singh, B.R.; Kondo, T.; Imamul Huq, S.M.; Kawai, S. Comparison of extractability of Cd, Cu, Pb and Zn with sequential extraction in contaminated and non-contaminated soils. Int. J. Environ. Sci. Technol. 2007, 4, 169–176. [Google Scholar] [CrossRef] [Green Version]
  21. Néel, C.; Soubrand-Colin, M.; Piquet-Pissaloux, A.; Bril, H. Mobility and bioavailability of Cr, Cu, Ni, Pb and Zn in a basaltic grassland: Comparison of selective extractions with quantitative approaches at different scales. Appl. Geochem. 2007, 22, 724–735. [Google Scholar] [CrossRef]
  22. Houba, V.J.G.; Van der Lee, J.J.; Novozamsky, I.; Walinga, I. Soil and Plant Analysis, a series of syllabi, Part 5. In Soil Analysis Procedures; Wageningen Agricultural University: Wageningen, The Netherlands, 1989. [Google Scholar] [CrossRef]
  23. Lindsay, W.L.; Norvell, W.A. Development of a DTPA Soil Test for Zinc, Iron, Manganese, and Copper. Soil Sci. Soc. Am. J. 1978, 42, 421–428. [Google Scholar] [CrossRef]
  24. Pedregosa, F.; Varoquaux, G.; Gramfort, A.; Michel, V.; Thirion, B.; Grisel, O.; Blondel, M.; Müller, A.; Nothman, J.; Louppe, G.; et al. Scikit-learn: Machine Learning in Python. J. Mach. Learn. Res. 2012, 12, 2825–2830. [Google Scholar]
  25. Tibshirani, R. The lasso method for variable selection in the cox model. Stat. Med. 1997, 16, 385–395. [Google Scholar] [CrossRef] [Green Version]
  26. Python Core Team. Python: A Dynamic, Open Source Programming Language [WWW Document]. 2015. Available online: https://www.python.org/psf/ (accessed on 8 February 2021).
  27. Oliphant, T.E. Python for Scientific Computing. Comput. Sci. Eng. 2007, 9, 10–20. [Google Scholar] [CrossRef] [Green Version]
  28. McKinney, W. Data Structures for Statistical Computing in Python. In Proceedings of the 9th Python in Science Conference, Austin, TA, USA, 9–15 July 2010; pp. 51–56. [Google Scholar]
  29. Hunter, J.D. Matplotlib: A 2D Graphics Environment. Comput. Sci. Eng. 2007, 9, 90–95. [Google Scholar] [CrossRef]
  30. Fernández-Calviño, D.; Pérez-Novo, C.; Nóvoa-Muñoz, J.C.; Arias-Estévez, M. Copper fractionation and release from soils devoted to different crops. J. Hazard. Mater. 2009, 167, 797–802. [Google Scholar] [CrossRef] [PubMed]
  31. Luo, X.; Yu, S.; Li, X. The mobility, bioavailability, and human bioaccessibility of trace metals in urban soils of Hong Kong. Appl. Geochem. 2012, 27, 995–1004. [Google Scholar] [CrossRef]
  32. Yu, S.; He, Z.L.; Huang, C.Y.; Chen, G.C.; Calvert, D.V. Copper fractionation and extractability in two contaminated variable charge soils. Geoderma 2004, 123, 163–175. [Google Scholar] [CrossRef]
  33. Sanders, J.R.; El Kherbawy, M.I. The effect of pH on zinc adsorption equilibria and exchangeable zinc pools in soils. Environ. Pollut. 1987, 44, 165–176. [Google Scholar] [CrossRef]
  34. Chukwuma, M.C.; Eshett, E.T.; Onweremadu, E.U.; Okon, M.A. Zinc availability in relation to selected soil properties in a crude oil polluted eutric tropofluvent. Int. J. Environ. Sci. Technol. 2010, 7, 261–270. [Google Scholar] [CrossRef] [Green Version]
  35. McBride, M.B.; Pitiranggon, M.; Kim, B. A comparison of tests for extractable copper and zinc in metal-spiked and field-contaminated soil. Soil Sci. 2009, 174, 439–444. [Google Scholar] [CrossRef]
  36. Zhu, B.; Alva, A.K. Differential adsorption of trace metals by soils as influenced by exchangeable cations and ionic strength. Soil Sci. 1993, 155, 61–66. [Google Scholar] [CrossRef]
  37. Weng, L.P.; Wolthoorn, A.; Lexmond, T.M.; Temminghoff, E.J.M.; van Riemsdijk, W.H. Understanding the Effects of Soil Characteristics on Phytotoxicity and Bioavailability of Nickel Using Speciation Models. Environ. Sci. Technol. 2004, 38, 156–162. [Google Scholar] [CrossRef]
  38. Shuman, L.M. Comparison of exchangeable Al, extractable Al, and Al in soil fractions. Can. J. Soil Sci. 1990, 70, 263–275. [Google Scholar] [CrossRef] [Green Version]
  39. Zhang, M.; Li, Y.C.; Calvert, D.V.; Alva, A.K. Fractionation of Iron, Managanese, Aluminum, and Phosphorus in Selected Sandy Soils under Citrus Production. Soil Sci. Soc. Am. J. 1997, 61, 794–801. [Google Scholar] [CrossRef]
  40. Smith, K.S. Metal Sorption on Mineral Surfaces. In The Environmental Geochemistry of Mineral Deposits; Society of Economic Geologists: Littleton, CO, USA, 1997; pp. 161–182. ISBN 1-887483-50-0. [Google Scholar]
  41. Trivedi, P.; Axe, L. Ni and Zn Sorption to Amorphous versus Crystalline Iron Oxides: Macroscopic Studies. J. Colloid Interface Sci. 2001, 244, 221–229. [Google Scholar] [CrossRef]
  42. Burachevskaya, M. Copper and zinc fractional distribution in chernozem haplic under model experimental conditions. In Proceedings of the International Multidisciplinary Scientific GeoConference Surveying Geology and Mining Ecology Management, Albena, Bulgaria, 2–8 July 2018; pp. 87–94. [Google Scholar]
  43. Bibak, A. Copper retention by Danish Spodosols in relation to contents of organic matter and aluminum, iron, and manganese oxides. Commun. Soil Sci. Plant Anal. 1997, 28, 939–948. [Google Scholar] [CrossRef]
  44. Yin, H.; Tan, N.; Liu, C.; Wang, J.; Liang, X.; Qu, M.; Feng, X.; Qiu, G.; Tan, W.; Liu, F. The associations of heavy metals with crystalline iron oxides in the polluted soils around the mining areas in Guangdong Province, China. Chemosphere 2016, 161, 181–189. [Google Scholar] [CrossRef]
  45. Kabala, C.; Singh, B.R. Fractionation and Mobility of Copper, Lead, and Zinc in Soil Profiles in the Vicinity of a Copper Smelter. J. Environ. Qual. 2001, 30, 485–492. [Google Scholar] [CrossRef] [Green Version]
  46. Harter, R.D. Effect of Soil pH on Adsorption of Lead, Copper, Zinc, and Nickel. Soil Sci. Soc. Am. J. 1983, 47, 47–51. [Google Scholar] [CrossRef]
  47. Mengel, K.; Kirkby, E.A.; Kosegarten, H.; Appel, T. Soil Copper. In Principles of Plant Nutrition; Springer: Dordrecht, The Netherlands, 2001; pp. 599–611. [Google Scholar]
  48. Guan, T.X.; He, H.B.; Zhang, X.D.; Bai, Z. Cu fractions, mobility and bioavailability in soil-wheat system after Cu-enriched livestock manure applications. Chemosphere 2011, 82, 215–222. [Google Scholar] [CrossRef]
  49. Ali, F.; Sadiq, A.; Ali, I.; Amin, M.; Amir, M. Effect of Applied Phosphorus on the Availability of Micronutrients in Alkaline-Calcareous Soil. J. Environ. Earth Sci. 2014, 4, 143–147. [Google Scholar]
  50. Lang, F.; Kaupenjohann, M. Effect of dissolved organic matter on the precipitation and mobility of the lead compound chloropyromorphite in solution. Eur. J. Soil Sci. 2003, 54, 139–148. [Google Scholar] [CrossRef]
  51. Pérez-Novo, C.; Fernández-Calviño, D.; Bermúdez-Couso, A.; López-Periago, J.E.; Arias-Estévez, M. Phosphorus effect on Zn adsorption–desorption kinetics in acid soils. Chemosphere 2011, 83, 1028–1034. [Google Scholar] [CrossRef] [PubMed]
  52. Strawn, D.G.; Scheidegger, A.M.; Sparks, D.L. Kinetics and Mechanisms of Pb(II) Sorption and Desorption at the Aluminum Oxide−Water Interface. Environ. Sci. Technol. 1998, 32, 2596–2601. [Google Scholar] [CrossRef]
  53. Xian, X.; In Shokohifard, G. Effect of pH on chemical forms and plant availability of cadmium, zinc, and lead in polluted soils. Water. Air. Soil Pollut. 1989, 45, 265–273. [Google Scholar] [CrossRef]
  54. Ashworth, D.; Alloway, B. Soil mobility of sewage sludge-derived dissolved organic matter, copper, nickel and zinc. Environ. Pollut. 2004, 127, 137–144. [Google Scholar] [CrossRef]
  55. Larios Bayona, M. Niveles de Cd, Co, Cr, Cu, Ni, Pb y Zn en los Suelos de Ribera de la Cuenca del rio Turia, Universidad de Lleida. CSIC-GV-UV—Centro de Investigaciones sobre Desertificación (CIDE). 2014. Available online: http://hdl.handle.net/10459.1/69296 (accessed on 8 February 2021).
  56. Sanders, J.R.; McGrath, S.P.; Adams, T.M. Zinc, copper and nickel concentrations in soil extracts and crops grown on four soils treated with metalloaded sewage sludges. Environ. Pollut. 1987, 44, 193–210. [Google Scholar] [CrossRef]
  57. Hodgson, J.F.; Lindsay, W.L.; Trierweiler, J.F. Micronutrient Cation Complexing in Soil Solution: II. Complexing of Zinc and Copper in Displaced Solution from Calcareous Soils. Soil Sci. Soc. Am. J. 1966, 30, 723–726. [Google Scholar] [CrossRef]
  58. Dinić, Z.; Maksimović, J.; Stanojković-Sebić, A.; Pivić, R. Prediction Models for Bioavailability of Mn, Cu, Zn, Ni and Pb in Soils of Republic of Serbia. Agronomy 2019, 9, 856. [Google Scholar] [CrossRef] [Green Version]
Figure 1. (A) Average proportion of Zn fractions extracted in different soils; (B) proportions extracted using spiking concentration of 31.25 mg Zn kg−1 of soil (with H2O, amount extracted remained below detection limit in all samples); and (C) proportions extracted using spiking concentration of 2000 mg Zn kg−1 of soil. Numbers on the left represent IDs of soil samples and parent materials. Black bars represent standard error, calculated considering values of proportions extracted at different concentrations using same soil. All data are shown in Supplementary Table S1.
Agronomy 11 00301 g001
Figure 2. (A) Average proportion of Ni fractions extracted in different soils; (B) proportions extracted using spiking concentration of 31.25 mg Ni kg−1 of soil (with H2O, amount extracted remained below detection limit in almost all samples); and (C) proportions extracted using spiking concentration of 2000 mg Ni kg−1 of soil. Numbers on the left represent IDs of soils and parent materials. Black bars represent standard error, calculated considering values of proportions extracted at different concentrations using same soil. All data are shown in Supplementary Table S2.
Agronomy 11 00301 g002
Figure 3. (A) Average proportion of Cu fractions extracted in different soils; (B) proportions extracted using spiking concentration of 31.25 mg Cu kg−1 of soil (with H2O and CaCl2, amount extracted remained below detection limit in almost all samples); and (C) proportions extracted using spiking concentration of 2000 mg Cu kg−1 of soil. Numbers on the left represent IDs of soils and parent materials. Black bars represent standard error, calculated considering values of proportions extracted at different concentrations using same soil. All data are shown in Supplementary Table S3.
Agronomy 11 00301 g003
Figure 4. (A) Average proportion of Pb fractions extracted in different soils; (B) proportions extracted using spiking concentration of 31.25 mg Pb kg−1 of soil (with H2O and CaCl2, amount extracted remained below detection limit in all samples); and (C) proportions extracted using spiking concentration of 2000 mg Pb kg−1 of soil. Numbers on the left represent IDs of soils and parent materials. Black bars represent standard error, calculated considering values of proportions extracted at different concentrations using same soil. All data are shown in Supplementary Table S4.
Agronomy 11 00301 g004
Figure 5. Goodness of fit for measured and recalculated fractions of (A) Zn, (B) Ni, (C) Cu and (D) Pb. H2O fraction in blue, CaCl2 in yellow and DTPA in green. Values expressed as mg kg−1 of soil.
Agronomy 11 00301 g005
Table 1. Summary of main characteristics of soils used in this study [17].
SAND
(%)
SILT
(%)
CLAY
(%)
USDA TEXTUREPHPHKP
(MG KG−1)
OM
(%)
C
(%)
N
(%)
DOC
(G KG−1)
171.112.616.3Sandy Loam3.962.9718.713.67.00.50.62
261.919.019.1Sandy Loam4.633.80105.514.16.70.40.70
350.224.725.1Sandy Clay Loam4.794.236.511.68.20.60.33
447.335.317.4Loam4.854.472.012.03.70.30.14
568.216.215.7Sandy Loam4.854.24101.111.25.00.40.30
619.167.113.8Silt Loam6.355.7611.714.46.50.50.56
720.451.927.7Clay Loam7.476.852.914.85.50.40.53
831.536.831.7Clay Loam5.044.543.010.06.70.40.27
945.535.119.4Loam4.704.325.219.610.30.80.25
1031.045.423.7Loam4.934.446.229.114.31.00.44
Table includes particle size distribution analysis, texture, determination of pH in water and KCl, amount of phosphorus, proportion of organic matter (OM), amount of carbon, nitrogen, and dissolved organic carbon (DOC). On the left side are soil ID numbers assigned (randomly) to each soil sample.
Table 2. Summary of other characteristics of soils used in this study [17].
PARENT MATERIALECEC
(CMOLC KG−1)
FEOM
(MG KG−1)
FEIA
(MG KG−1)
FEC
(MG KG−1)
ALOM
(MG KG−1)
ALIA
(MG KG−1)
ALC
(MG KG−1)
1Granite8.0799475261186225391
2Granite9.02086<d.l.5442937<d.l.396
3Schist5.84343212317,59211,440<d.l.5037
4Amphibolite3.04631205224,5568993114112,239
5Granite1.8927485884239<d.l.936
6Limestone23.4907255537,39733235268<d.l.
7Limestone29.01531367032,20915302954<d.l.
8Amphibolite4.06567216145,89310,72435066503
9Amphibolite6.75559275750,22911,0273787<d.l.
10Amphibolite6.84359136747,50116,9667224<d.l.
Table includes parent material, effective cation exchange capacity (eCEC), amount of iron and aluminum forms associated with organic matter (FeOM and AlOM, respectively), amount of amorphous inorganic iron and aluminum forms (FeIA and AlIA, respectively), and amount of crystalline iron and aluminum forms (FeC and AlC, respectively). On the left side are soil ID numbers assigned (randomly) to each soil sample. <d.l., below detection limit.
Table 3. Pearson correlation coefficients for fractions of metals analyzed (n between 20 and 70). Correlations were obtained using transformed data (by using standard scaling method). CaCl2 Pb and DTPA Pb columns were removed since they did not provide any information.
H2O ZNCaCl2 ZnDTPA ZnH2O NiCaCl2 NiDTPA NiH2O CuCaCl2 CuDTPA CuH2O Pb
H2O ZN1
CACL2 ZN0.201
DTPA ZN0.38 *0.57 ***1
H2O NI0.92 ***0.160.281
CACL2 NI0.76 ***0.48 ***0.62 ***0.76 ***1
DTPA NI0.46 **0.46 ***0.78 ***0.45 **0.76 ***1
H2O CU0.90 ***0.040.240.74 ***0.66 **0.421
CACL2 CU0.83 ***0.38 **0.49 ***0.71 ***0.81 ***0.59 ***0.79 ***1
DTPA CU0.150.42 **0.48 ***0.240.45 ***0.39 **0.010.51 ***1
H2O PB0.51 *−0.300.04−0.11−0.130.210.84 ***−0.06−0.21
CACL2 PB0.76 ***−0.010.250.57 ***0.87 ***0.56 **0.81 ***0.78 ***0.250.58 *
DTPA PB0.030.37 **0.74 ***0.070.45 ***0.64 ***0.030.31 *0.55 ***−0.16
*, **, *** Correlation significant at the 0.05, 0.01 and 0.001 level, respectively.
Publisher’s Note: MDPI stays neutral with regard to jurisdictional claims in published maps and institutional affiliations.

