Abstract
The short- and medium—long-term effects of management and hillside position on soil organic carbon (SOC) changes were studied in a centenary Mediterranean rainfed olive grove. One way to measure these changes is to analyze the soil quality, as it assesses soil degradation degree and attempts to identify management practices for sustainable soil use. In this context, the SOC stratification index (SR-COS) is one of the best indicators of soil quality to assess the degradation degree from SOC content without analyzing other soil properties. The SR-SOC was calculated in soil profiles (horizon-by-horizon) to identify the best soil management practices for sustainable use. The following time periods and soil management combinations were tested: (i) in the medium‒long-term (17 years) from conventional tillage (CT) to no-tillage (NT), (ii) in the short-term (2 years) from CT to no-tillage with cover crops (NT-CC), and (iii) the effect in the short-term (from CT to NT-CC) of different topographic positions along a hillside. The results indicate that the SR-SOC increased with depth for all management practices. The SR-SOC ranged from 1.21 to 1.73 in CT0, from 1.48 to 3.01 in CT1, from 1.15 to 2.48 in CT2, from 1.22 to 2.39 in NT-CC and from 0.98 to 4.16 in NT; therefore, the soil quality from the SR-SOC index was not directly linked to the increase or loss of SOC along the soil profile. This demonstrates the time-variability of SR-SOC and that NT improves soil quality in the long-term.
1. Introduction
The soil is the most superficial layer of the earth’s crust, altered by weathering and conditioned by soil physicochemical properties [1]. It is a basic constituent of terrestrial ecosystems and an essential component for the sustainable development of life on earth [2], being fundamental for food production [3]. Furthermore, it constitutes the most diverse and important ecosystem on the planet, characterized by its biological biodiversity [4] and conditioned by the soil biota, with direct and indirect effects on crop growth, the sustainability of soil productivity, and the nutrient cycle quality [5]. For all these reasons, the soil is the foundation of all terrestrial ecosystems, and most of the ecosystem services necessary for human survival arise from it [6]. Moreover, soil ecosystem services depend on soil health and soil biota biodiversity [7], influenced by the physicochemical soil properties and the interactions between land use and management. In this sense, some researchers [8] have indicated that the “soil health” definition is close to the “soil quality” concept [9]. Therefore, soil quality is a primary topic of study to evaluate the soil degradation degree and to identify management practices for sustainable land use, considering physical, chemical, and biological parameters [10]. In this context, the soil quality concept is related to the soil degradation problem, which implies a decrease in soil quality with a reduction in its functions and ecosystem services [1].
The major indicators linked to soil quality are the erosion process and the reduction of soil organic carbon (SOC)—soil organic matter (SOM) [11]. The SOC-SOM content is the most important indicator in soil degradation processes [12] since erosion processes depend on the SOC-SOM content. In addition, a SOM reduction normally implies a SOC loss in mineral soils, affecting salinization, biodiversity, erosion, desertification, floods, landslides, biomass production, soil filtering, and so on [13]. Although we should not generalize, there are authors [12,14,15] who provide specific data (e.g., a reduction of 1% of SOM content implies a 10‒40% decrease in aggregate stability, a reduction from 4% to 2% of SOM implies a 50% increase of predicted soil loss by water erosion, a reduction of 1% of SOM content implies a 1–2% decrease in macroporosity, a reduction from 7% to 3% of SOM implies a > 10% reduction of water retention and a reduction from 5% to 2% of SOM implies a 90% decrease of microbial biomass). Therefore, the SOC analysis in different land uses and management practices constitutes a valuable indicator of soil quality [16].
In this context, soil depth is a very important aspect [17]. SOC studies are normally limited to 1 m in depth, although there are authors who have conducted studies at greater depths [18]. In this sense, it is important to note that in the scientific community, there is no consensus on the soil depth when the SOC distribution is studied [19]. Therefore, there are uncertainties when comparing data at different scales [20]. Hence, when studies of soil evolution are carried out over the medium term (10–30 years) [21] or longer periods, we should use soil profile (if it is possible). In this line, some researchers [22] have shown that the SOC accumulation in surface (topsoil) is important for soil quality improvement (erosion control, water infiltration, conservation, and nutrient supplementation) without forgetting the SOC at depth. Consequently, we can differentiate two SOC levels (topsoil and subsoil), and the relationship between the surface and depth of SOC content could be used as a soil quality indicator in agricultural soils under different land management methods [23,24]. This relationship is called the SOC stratification ratio (SR-SOC). The SR-SOC is based on the idea that the SOC content at depth is used as a baseline to normalize the SOC evaluation. Therefore, the SR-SOC is common in many natural, and managed ecosystems depend on the C inputs and decreases with soil depth [23].
In Mediterranean areas, the olive grove (OG) is the main land use [25], and Spain is the country with the highest production of olive oil in the world (producing around 47% of the world’s total olive oil) [26]. The OG expansion in the Mediterranean Basin is due to the climatic conditions, but its development has adverse effects on the soil, like a reduction in soil infiltration rate [27], low soil aggregate stability [28], OM depletion, soil structure degradation, and high soil loss [29]. Therefore, it is necessary to improve the soil’s physical quality [30] in order to increase sustainable land use and reduce land degradation processes [31]. In fact, soils with good physical quality have the ability to support crops properly and reduce land degradation [32].
Traditional management in Mediterranean OG is marked by (i) low SOM content (<2%) [33] due to high temperatures and low rainfall that allow the SOM mineralization, (ii) low plant density, which facilitates the soil loss [34], (iii) intense tillage—heavily machined [35], and (iv) the landscape, formed by steep hillsides with slight changes in concavity and convexity [36]. These four factors, acting synergistically, can cause losses in soil quality, with significant environmental implications [37]. Given this scenario, conventional OG is associated with soil degradation problems [38]. Consequently, reducing tillage and acting in the vegetation cover can increase soil quality [39]. Moreover, the hillside position can affect the temperature and humidity of the soil due to the insolation differences influencing soil microclimate [40], conditioning the plant community’s distribution and the soil formation processes [41]. Therefore, the temperature regime, vegetation, and soil water content can affect the microorganisms’ activity, either delaying or accelerating the SOC decomposition [42].
One of the most accepted management techniques to reverse soil degradation processes in traditional Mediterranean OG is the use of cover crops [43,44] in the middle of the OG street so that the cover crops can act as a physical barrier, reducing sediment delivery runoff and nutrient losses and increasing infiltration rates [45,46]. Therefore, by combining minimum or no-tillage operations with cover crops and plant residues, the SOM input can be facilitated, improving soil structure and reducing soil degradation and soil loss [47]. In addition, cover crops can improve the biological activities involved in soil health, nutrient cycling, and crop production [48], without forgetting that crop residues being used as mulch can favor surface aggregates formation and prevent crust formation and pore sealing. Reducing tillage, the use of cover crops, and the plant residues generated can increase the SOM content through crop diversification, improving the soil properties. These agricultural practices are a key factor in improving soil quality [49,50].
The principal objective of this research was to study the soil quality from the soil organic carbon content and the carbon stratification index in soil profiles of traditional Mediterranean olive groves (centenary) in different scenarios: (i) analyzing land management change effects (conventional tillage to no-tillage) in the medium-term (17 years), (ii) studying the land management change effects (conventional tillage to no-tillage with cover crops) in the short-term (2 years), and (iii) assessing the effect of cover crops in three topographic positions of a hillside in the short-term (2 years) in a Mediterranean rainfed olive grove.
2. Materials and Methods
2.1. Description of the Study Area and Experimental Design
The study area is located on an experimental farm with OG in Garcíez (Torredelcampo, Jaén) in the south of Spain (37°50′20″ N—3°52′32″ W) (Figure 1). The main characteristics of the study area are described in Table 1. The experimental farm was a centenary rainfed OG of the Picual variety (Olea Europaea) with traditional management—conventional tillage (CT) strongly mechanized (an average density of 90 trees ha−1—each tree had two trunks; tree spacing 12 m × 12 m; tree size—3 m high × 6 m canopy diameter), in a hillside with the same topographic orientation (northeast). The study was conducted on soil profiles (horizon by horizon) [26]. The different land managements and land operations at the experimental farm are described in Table 2.
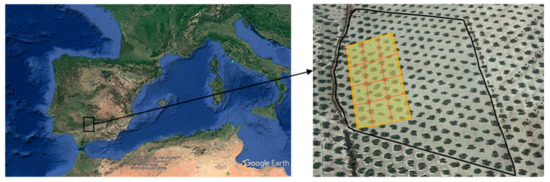
Figure 1.
Study area. Garcíez-Torredelcampo (Jaén-Spain)—(37°50′20″ N—3°52′32″ W). Source: author elaboration; folder © 2020 Google. https://www.google.es/maps/@37.8499263,-3.8650632,162m/data=!3m1!1e3 (accessed on 1 September 2020).

Table 1.
Main characteristics of the study area.
Table 2.
Land management, periods, and duration on the experimental farm.
At the beginning of the 20th-century, the studied farm was planted with olive trees. Between 1950 and 2003, soil management was conventional tillage (Table 2). The research began in January 2003, and the latest data were obtained in September 2019. In 2003, the study farm was divided into two parts, with two land managements: conventional tillage (CT0) and no-tillage (NT0) (2003–2019) (medium‒long-term, 17 years). In 2017, the farm with CT0 was divided in two, and another land management change (LMC) took place: CT1 and no-tillage with cover crops (NT-CC) (2017–2019) (short-term, two years) (Figure 2).
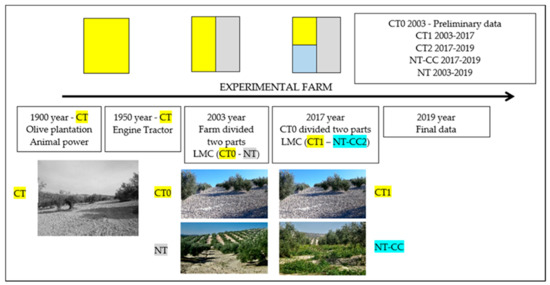
Figure 2.
Period of the study farm. LMN: land management change; CT: conventional tillage; CT0: conventional tillage 2003; NT: no tillage; CT1: conventional tillage 2017; and NT-CC: no tillage with cover crops 2017.
In addition, between 2017 and 2019, three vegetation cover types were used in OG to study crop diversification, its effect on the soil, and the productivity ratio in Mediterranean rainfed OG (one of the objectives of the Diverfarming project—European Commission Horizon 2020—grant agreement 728,003). The cover crops on the OG streets were oats (Avena sativa), saffron (Crocus sativus), and lavender (Lavandula × intermedia), and the seed quantities used were 140 kg ha−1, 2000 kg ha−1, and 12,000 plants ha−1 for oats, saffron, and lavender, respectively. The three crop diversifications (saffron, oats, and lavender) were initially planted between the OG streets, but due to external factors like low rainfall, high temperatures, and high rabbit (Oryctolagus cuniculus) numbers, these diversifications were not fully developed and were not profitable during the period considered (two years); therefore, these cover crops were colonized by spontaneous vegetation (Conyza canadensis, Arenaria hispanica, Sonchus oleraceus, Capsella bursapastoris, Diplotaxis virgata, Raphanus raphanistrum, etc.) and the result was a mixed cover formed of saffron, oats, and lavender with the intercropping of spontaneous vegetation.
These LMCs allowed us to establish comparisons between the soil quality in four senses: (a) first, the soil quality evolution under conventional tillage (CT) between 2003 and 2019 (medium‒long-term: CT0-2003; CT2-2019), (b) second, LMC from CT to NT between 2003 and 2019 (medium-long-term: CT0-2003; NT0-2019), (c) third, between 2017 and 2019 (short-term) in CT (CT1-2017; CT2-2019), and (d) finally, the soil quality evolution between 2017 and 2019 (short-term) after the LMC from CT to NT-CC (2017-CT1; 2019-NT-CC). In addition, as the study surface was not fully horizontal (characteristic of Mediterranean areas), it was decided to analyze the physical and chemical soil changes along the hillside (< 5% slope) in different topographical positions: summit (S), backslope (B), and toeslope (T).
2.2. Soil Sampling and Analytical Methods
Samples from 33 soil profiles were collected: three from CT0 at the beginning of the experiment (January 2003), nine from CT1 at the intermediate situation of the experiment (September 2017), nine from CT2, nine from NT-CC, respectively at the end of the experiment (September 2019) (three from each topographical position (S—B—T) in both cases (CT2 and NT-CC)) and three in NT0 (September 2019).
In the short-term comparison (2017–2019), 12 plots from different topographical positions (four from S, four from B, and four from T) on the hillside were selected for the study: three plots with CT and nine plots with NT-CC (three plots in S, three in B and three in T position). In each topographic position, the observation area was 400 m2 (20 m × 20 m). At each sampling point, the main topographic variables (altitude and slope) were measured.
Soil samples were collected along the different soil horizons for each profile, thus avoiding mixing the pedogenic horizons and allowing for a proper determination of physical and chemical soil properties [56,57,58]. A random sampling scheme was adopted, pits were dug with a mini-excavator, and samples were collected. Soil samples were transferred to the laboratory and air-dried. Once dried, the samples were sieved with a 2000 µm sieve, separating the thick fragments and roots from the rest of the material. Three repetitions were carried out for each sample. The analytical methods, laboratory analysis, and other parameters calculated used in this study to determine different soil properties are reported in Table 3, according to the Handbook of Plant and Soil Analysis for Agricultural Systems [59].
Table 3.
Analytical methods used in this study (field measurements, laboratory analysis, and parameters calculated).
2.3. Statistical Analyses
The effect of land management, topographical position and depth on soil properties was analyzed using ANOVA (SPSS 13.0 for Windows). Data were tested for normality to verify the model assumptions, and differences of p < 0.05 were considered statistically significant.
3. Results and Discussion
3.1. General Properties of the Studied Soil
The soils in the study area can be characterized as Calcaric Cambisols (CMca), quite clayey with a silty clay loam texture [18], which in certain circumstances give a vertic character [54], with some differences in physicochemical properties according to the management (CT, NT, or NT-CC) and topographic position (S, B, or T) [67]. These soils are formed from the bedrock (marl and marlaceous lime), and their development is conditioned by limestone genesis (conditioned by the Ca2+ ions) [68], although the hillside position can also affect their development, especially when the land management is very aggressive (strongly mechanized). They are young soils, developed on corrugated hillsides, well-drained on the surface due to the high gravels and stone content, with little chemical fertility, physically poor, and a low capacity for agricultural use [18,37,55].
The gravel content was very homogeneous, ranging from 12.6% (C horizon) to 17.7% (Bw/C horizon), and the tendency was to increase in depth, except for the C horizon, which decreased (Table 4). In this line, various interpretations can justify this abnormal behavior: (i) by a stone line presence [69] on the Bw/C horizon due to plowing depth, (ii) the tillage used (CT) does not remove large stones and boulders [70] at depth (C horizon), and (iii) a combination of both. Texturally, the soils were silty clay loam, with few differences in silt and clay content at depth (Table 4); this particle distribution increases the surface runoff, reduces the infiltration rates, and increases the runoff discharge, sediment concentrations, and erosion rates, worsening the water percolation and increasing the erosion by curbing erodibility and runoff [71]—processes especially important when the topography is not flat (undulating hillsides, as happens in the study area).
Table 4.
Principal soil properties evaluated (average ± SD) in the soil profile by horizons in the study area. Preoperational stage, CT0 (January 2003). Data are means ± SD (n = 3).
With regard to bulk density (BD) and pH, these increased along with depth. It is important to highlight that soil pH is conditioned by topography, climate, and lithology; therefore, in hillsides with calcareous lithology and semiarid conditions, the pH should increase with depth [72] due to the alteration processes of the bedrock.
With respect to SOM concentrations, they are very low, decreasing with depth and ranging from 1.22% (A horizon) to 0.71% (C horizon). These low SOM concentrations can be explained by the climatic conditions [73], the high OM mineralization, the lack of crop residues after periods of drought [24], and degradation processes due to the vegetation loss and unsustainable soil management causing an impoverishment of the SOM content. The most important consequence of this low SOM content is the reduction of soil physical protection, favoring erosion and accelerating the SOM decomposition due to CT [74,75]. However, apart from these negative effects, the SOC content and SOC stock (SOC-S) concentrations may be affected, too. On average, the SOC-S in the study soils is 67.2 Mg ha−1 (for 115.7 cm depth), far below the values obtained at World level [76] in CMca (71 Mg ha−1 for 1 m depth), at the European scale [77] in cropland (106 Mg ha−1 for 30 cm depth), for Spain in CM [78] with OG (71.4 Mg ha−1 for 1 m depth), for Andalusia in CM [79] with permanent crops (59.9 Mg ha−1 for 75 cm depth), and for OG with CT [80] in Jaén (61.53 Mg ha−1 for 30 cm depth). The situation in Mediterranean areas is considered high-risk [81,82], so regions like Andalusia are classified as “high erosion risk zones” with a mean annual soil loss of 23.2 Mg ha−1, causing a significant impact on SOM and SOC levels [44], affecting SOC-S, and inducing decarbonization processes in the soil [83].
3.2. Soil Depth Conceptualization: Soil Profile Is Required when SR Is Used as a Soil Quality Indicator in OG
The studied soils were not very deep (115.7 cm on average) (Table 4); similar results have been found [84] in other CM in rainfed OG in Jaen province, with no significant difference (p < 0.05) regarding the soil depth in the range 119.7–128.7 cm and limited by rock fragments.
It is reasonable that the SR-SOC should not be measured only superficially because deeper roots can be found at lower depths [85] and because the management practices and land use can affect the SOC in depth [86]. Some studies show that, by six years of age, olive trees develop roots with a 1 m depth and maximum diameters of 27 mm, covering areas of 13.8 m2 per tree [87]. In this sense, when measuring the SOC sequestration, stock, and loss, it is necessary to integrate all the SOC in the root zone (1 or 2 m deep) [85]. Consequently, it is necessary to study the soil profile [38] so that the SOC variability at lower depths is influenced by vertical processes [88,89], especially in temperate climates, where large amounts of SOC can accumulate below depths of 30 cm [90]. Most studies tend to focus on the top 30 cm or 1 m of soils and, therefore, underestimate the total SOC, affecting the SR calculation. In this respect, it is evident that the sampling approach used can affect the SOC quantification [91]. Hence, the SOC should be inventoried by genetic horizon using the soil profile approach, assuming that the term soil profile refers to “a vertical section of the soil through all its horizons and extending into the C horizon” [92].
3.3. Stratification Ratio of SOC and N at the Beginning of the Research (January 2003)
The starting point research was January 2003 in a Mediterranean rainfed OG with CT (heavily mechanized). A detailed analysis of the SOC content in the study area tells us (Figure 3) that there is: (i) a SOC reduction at depth due to the deeper horizons being conditioned by the OM entry in topsoil and because the greatest OM contributions are in the form of fine roots, root exudates, and dissolved organic carbon [93], (ii) low SOC content, due to the climatic conditions [73] caused by high OM mineralization [24], and (iii) land degradation due to intensive management (CT) [94]. In this line, in Mediterranean rainfed OG under CT, there is an interannual decrease of 1.3% of SOC-S in the first 40 cm deep for long-term studies (15 years) that can reach −12.9 Mg C ha−1 y−1 [83].
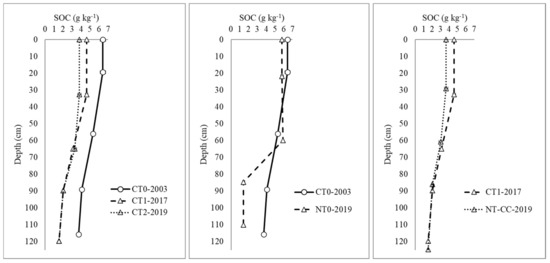
Figure 3.
Soil organic carbon distribution in the study area. CT0: conventional tillage 2003, CT1: conventional tillage 2017, CT2: conventional tillage 2019, NT: conventional tillage 2019, NT-CC: no tillage with cover crops.
Usually, the soil quality, as a function of the SR-SOC, was poor (degraded soil) since the SR-SOC values were <2 in absolute values [23,27]. The SR-SOC increased in depth, ranging from 1.21 to 1.73 for SR1-CT0 and SR3-CT0 (Table 5). In this line, in OG soil in CM near the study area, but applying oil mill byproducts to the soil, similar results were found [95], showing that the addition of residues (pruning remains) can increase the SR index, improve the soil quality, and produce changes in the chemical and physical soil properties [70].
Table 5.
Stratification ratio of soil organic carbon and nitrogen (average ± SD) in a Mediterranean olive grove. Initial situation (January 2003), intermediate situation (September 2017), and final situation (September 2019).
It is important to note that, at different depths (SR2-CT0 and SR3-CT0), no significant differences were found (p < 0.05) with respect to SR-SOC. This could indicate greater SOC stabilization at depth (SR2-CT0:1.58; SR3-CT0:1.73) than at the surface (SR1:1.21) (Table 5). In this sense, the binding of SOC to fine mineral particles is one of the most important stabilization mechanisms of SOC for mineral soils [96]. This is justified by the high concentrations of fine particles in the soils studied (87.2% and 81.9% for Bw/C and C horizons, respectively) (Table 4). In this sense, it is accepted [97,98] that the greatest SOC content is found in the fine fraction (<20 μ, clay and fine silt) and that SOC is also much more stable in the fine fraction than in the coarse fraction [99]. Based on this premise, the SOC of the studied soils could be stabilized at depth [100] since land use, management, and climatic conditions for more than 50 years (long-time) were stable [21]. Therefore, the SR-SOC is a good indicator of soil quality [23] and an effective technique for monitoring SOC in responses to climate, land use, tillage, and other management effects. In addition, changes in the SR can show changes in the rate of SOC sequestration [101], so high SR-SOC (> 2) indicates undisturbed soil and the high soil quality of the surface layer.
In the case of SR-TN, the values were low, ranging from 1.01 (SR1-CT0) to 1.21 (SR2-CT0) (Table 5). In this case, no significant differences were found (p < 0.05) superficially (SR1-CT0 and SR2-CT0). TN concentrations were low in all horizons, ranging from 0.93 g kg−1 (topsoil) to 0.77 g kg−1 (subsoil) (Table 4). Therefore, the N mineralization decreased when the clay content increased; hence, the SR-TN was low [102]. In addition, the aggregate size and clay content affected TN, decreasing N mineralization [55].
3.4. Management Effects on SR-SOC for Medium‒Long-Term and Short-Term
The SR-SOC analysis was carried out in the short and medium-term, assuming that for the SOC, long-term stabilization is necessary (> 30 years), since the SOC is conditioned by land use, management, and climatic variables [21], as happens in the preoperational analysis (period: 1950–2003) (Table 2). Accordingly, from 2003 to the present, different scenarios were studied to analyze the SOC content and the SR-SOC evolution as a soil quality indicator, highlighting:
3.4.1. Medium-Term SR-SOC in Conventional Tillage (from 2003-SR-CT0 to 2017-SR-CT1)
The CT effects (Table 2) on SOC content over 15 years (CT0-2003: CT1-2017) have been very negative, with a SOC loss of between 28% (in surface) and 58% (in depth) (Figure 3). This reduction in the SOC content can be explained by a continuous degradation process due to vegetation loss caused by herbicide use and unsustainable soil management (Table 2). This causes continuous SOM impoverishment, favoring soil erodibility processes and increasing the OM decomposition as a consequence of tillage [74]. In this context, CT contributes to the soil loss due to water erosion [103] and accelerates the OM decomposition due to the breakdown of soil aggregates [104]; furthermore, this process increases with the years of cultivation [105], as we saw with the studied soils. This degradation process has been corroborated in these soils [44], predicting soil losses of 6.6 Mg ha−1 yr−1 according to the RUSLE model (5% slope) using the quadratic equation (y = −0.0076x2 + 1.4042x; where y = soil loss (Mg ha−1 y−1) and x = slope (%)), with high correlation rates (R2 = 0.9911). From these results, we may assume that the soil quality from the SR-SOC due to land management would be lower; however, after 15 years, the management effect (CT0 to CT1) was not negative—on the contrary, the soil quality according to SR-SOC increased, varying by +22.3%, +44.9%, and +73.9% for SR1-CT1, SR2-CT1, and SR3-CT1, respectively (Table 5).
In the case of SR-TN, the trend was similar to SR-SOC, reaching increases of 84.1% (SR2-CT1), with significant differences (p < 0.05) for both SR-SOC and SR-TN. In this sense, it is important to note that, at depth, values > 2 (good soil quality) are reached (SR2-CT1-SOC = 2.29; SR3-CT1-SOC = 3.01). However, on the surface, the SR1-CT1-SOC was 1.48 (< 2.0). In this sense, lower SR-SOC can be related to less input of OM into the soil [106]. In addition, the SR-SOC < 2 under different land uses may be related to high oxidative conditions [107].
As we can see in Table 5 and Figure 3, SR-SOC increased with soil depth due to the decrease in SOC content along the soil profile. The increase in SR-SOC despite SOC loss from land management (CT) may be due to a process that we can summarize as a high erosion rate due to CT [44] with SOC depletion [104]. As a consequence of this process, the SOC incorporation at depth is reduced, favoring the formation of SOM stable compartments due to the soil aeration by management (removing the soil annually) [108], conditioned by climatic conditions under the olive trees (temperature, shade effect, and differences in the incidence of rain) that produce slower mineralization and more intense humification processes [95], reducing the SOC at depth and increasing the SR-SOC. However, in addition, CT causes a high decomposition of the OC labile fraction by breaking down the macroaggregates [109], together with better soil aeration, increasing the oxygen content and favoring the OM decomposition by microbial activity [110]. Therefore, CT favors aggregate destruction, reducing the OC content of large macroaggregates [111]. In addition, the vegetation and climate determine the SOC vertical distribution along the profile; however, the climate and clay content may be more decisive in the SOC accumulation [112].
3.4.2. Short-Term SR-SOC in Conventional Tillage (2017-SR-CT1 to 2019-SR-CT2)
CT in the short-term between 2017 (TC1) and 2019 (TC2) caused a SOC reduction of ‒17.5% in the Ap-horizon (CT1:4.63 g kg−1; CT2:3.82 g kg−1) equivalent at 0.40 g kg−1 y−1. In the case of the Bw-horizon, there was a slight increase of +6.4% (CT1:3.12 g kg−1; CT2:3.32 g kg−1), equivalent to 0.1 g kg−1 y−1; however, at depth, there were no changes (Figure 3).
CT (highly mechanized) (Table 2) in OG cultivation has environmental consequences due to the soil quality loss [101]; this degradation is related to the use of wrong agricultural techniques that lead to continuous soil erosion and rapid SOM depletion [113], favoring a high-risk of water erosion [114] and affecting the physicochemical soil properties [115]. In addition, the CaCO3 loss (parental material: loam and marlaceous lime) in CT due to erosion processes can reduce the soil structure stability, increasing the soil structure degradation [101]. In this sense, Ca2+ is the most important cementing agent (for OM and clay) to maintain the soil structure [116], a very relevant issue in the soils studied due to the high Ca2+ content [68]. Regarding the SOC increase in the Bw-horizon, it may be due to two mechanisms: first, clayey soils can undergo carbon translocation due to their solubility, soil fauna activity, and the presence of roots [117]; and second, by management (CT), due to the intense tillage mixing the topsoil with the subsurface, which increases the SOC content in the subsurface [118]. However, at depth, there are no changes in the SOC content in the short-term, which could be due to the organic compounds’ stabilization by the clays [119].
In two years, the management effects (CT1 to CT2) were negative, producing a reduction in SR-SOC indices of 22.3%, 17.5%, and 17.6%, respectively, for SR1-CT2 SR2-CT2, and SR3-CT2. With respect to the SR-TN, the trend was like that for the SR-SOC (Table 5), producing a loss in soil quality according to the SR-SOC. This behavior—reduction in the SR-SOC by tillage—is normal since if the SOC content is reduced on the surface and the depth remains constant, the SR-SOC decreases. In soils under semiarid conditions and with poor aggregate stability, the SR-SOC could change in the short-term [120,121]. In addition, the CT that characterizes the study soils could exacerbate degradation processes, affecting the soil quality [95] in the following ways: A reduction of soil wettability [122], decreased fertility [123], reduced microbiological‒enzymatic activity [34], sorption, persistence, and mobility of herbicides [124], and favoring high soil erosion rates [44].
3.4.3. Land Management Change Effect (CT to NT-CC) in the Short-Term (2017–2019) on SR-SOC
LMC (from CT to NT-CC) in the short-term (two years) had a negative effect on the soil, causing a SOC reduction of −20% and −3.3% for the Ap and Bw-horizons, respectively (Ap: CT1-4.63 g kg−1/Ap: NT-CC-3.67 g kg−1; Bw: CT1-3.12 g kg−1/Bw: NT-CC-3.02 g kg−1); however, there were no changes at depth (Figure 3). Before conducting any analysis, we must consider that, in the short-term, the SOC analysis can offer contradictory results with respect to LMC in semiarid conditions, since climatic variables (low soil moisture and high-temperature) limit the SOC content, delaying the effects of sustainable management practices on SOC content for several years [125]. In this sense, permanent cover use in semiarid environments leads to problems related to competition for water and nutrients between crops, affecting the productivity of the main crop [42]. In our case, we have observed that OG covers did not develop satisfactorily, and the cover also affected the OG production, reducing the average olive production by 40%. This SOC reduction in NT-CC in the short-term due to LMC could be explained by several reasons: first, soil texture and management can affect the SOC content, since soluble organic compounds can leach into deeper horizons, reducing the SOC content superficially [126]; second, this reduction in SOC content could be the result of very intense erosive processes [127] derived from LMC. In this sense, the authors of [43] indicated that NT could negatively affect the soil conservation compared to CT due to a decrease in OM, macroaggregates, and infiltration rates and increased soil consolidation with NT compared to CT in the short-term. In the same way, in the short-term (1–2 years), in semiarid rainfed Mediterranean areas, rainfall is the main limiting factor [128] due to its scarcity and erratic distribution, causing high erosion in agricultural soils during periods of strong storms, also causing high mineralization rates of the SOM due to high temperatures during humid periods, and a lack of residues to cover the soil surface after periods of drought [129], thereby reducing SOC concentrations. Starting from these premises in dry Mediterranean OG and considering the geographical characteristics (low or moderate slope with continuous changes of concavity and convexity), the effect on the SOC using covert is not the desired one, leading to important disagreements about the real impact of the different management options [130,131].
As shown in Table 5, LMC does not cause important changes within two years, and we only saw a slight increase in SR1 (1.15 SR1-CT2; 1.22 SR1-NT-CC). However, LMC affected SR, producing an SR reduction in all cases (from CT1-2017 to NT-CC-2019). In this sense, it is important to highlight that, although the SR-NT-CC was less than the SR-CT1 when compared with CT2, the SR on the surface improved the soil quality (SR-SOC increased by 9.9%). Therefore, we could assume that a turning point in the soil degradation process was beginning. However, the changes with depth were not significant. The C decomposition rates were lower in deeper horizons than in higher horizons [132]. In addition, SR-SOC, considering deeper horizons in Mediterranean soils, are affected by the C incorporation, as the residues are accumulated in the subsurface horizon [90]. This would suggest that the management system influences soil C accumulation. Furthermore, the supply of OM from the surface to deeper horizons is ensured under NT, which led to an accumulation of C in soils under this system, which will affect the SR-SOC.
3.4.4. Land Management Change Effects (from CT0 to NT) on SR-SOC for the Medium to Long Term (2003–2019)
The LMC from CT0 to NT in the medium‒long-term (2003–2019) showed variations in the SOC content of −9.6%, +11.3%, −65.2%, and −61.8% for the Ap, Bw, Bw/C, and C horizons, respectively (Ap: CT0 6.44 g kg−1/Ap: NT 5.82 g kg−1; Bw: CT0 5.32 g kg−1/Bw: NT 5.94 g kg−1; Bw/C: CT0 4.08 g kg−1/Bw/C: NT 1.42 g kg−1; C: CT0 3.73 g kg−1/C: NT 1.42 g kg−1) (Figure 3), with significant differences (p < 0.05) in all horizons in relation to management.
Regarding the SOC reduction after the LMC, although most studies in semiarid areas in Spain show SOC increases at the surface [133,134], our results were the opposite, with a SOC reduction in the topsoil (−9.6%). This reduction in the SOC content in the study area may be due to the absence of vegetation cover due to herbicide application (Table 2) and the maintenance of bare soil. In this sense, vegetation cover absence and the long-term maintenance of bare soil due to herbicide use cause a crust formation and accelerates the erosion processes, reducing the SOC content in rainfed OG [18]. In addition, this process can be accelerated by periods of intense rainfall [128]. However, LMC produced an increase of +11.3% in the SOC content in the Bw-horizon. Similar results have been obtained by other authors [126], indicating that soil texture and land management can affect the SOC dynamics, which can be reduced on the surface and increased in deeper layers due to the organic compounds’ solubility. At depth, the SOC contents were drastically reduced (−65.2%: Bw/C-horizon and −61.8% C-horizon) with respect to CT0. Hence, the SOC content at depth depends on the superficial SOC since OM contributions are received in the form of fine roots, root exudates, and dissolved OC [93]. Given these results, it is important to note that, at depth, all the scenarios show very similar values for SOC content, regardless of the management used (CT, NT-CC, and NT); therefore, we can assume that the SOC stabilization mechanisms associated with the soil fine fraction at depth were taking place [96]. These results are corroborated by other researchers [55], who found that the aggregates’ stability increases along with a decrease in the total SOC-S associated with the aggregate fractions and an increase in the percentage of SOC-S in the macroaggregate fractions at depth, indicating the importance of studying the soil in-depth and not only superficially (topsoil).
The SR-SOC was highly variable, ranging between 0.98 (SR1-NT) and 4.16 (SR3-NT), although in both cases (CT0 and NT), the SR-SOC decreased in depth. LMC from CT0 to NT for 17 years caused significant differences (p < 0.05) in the SR-SOC at the surface and at depth, being more important at depth than at the surface (Table 5). On the surface (SR1), the LMC caused a loss of soil quality, reducing the SR by 19% (from 1.21 SR1-CT0 to 0.98 SR1-NT); however, at depth, the SR-SOC increased by 140.5% (from 1.73 SR3-CT0 to 4.16 SR3-NT1), improving the soil quality.
The SR-SOC increased at depth due to LMC in NT. This may be due to several continuous processes over time: (i) a first stage produced a SOC reduction due to the herbicide application and the OM reduction, favoring water erosion processes and therefore, a continuous SOC loss on the surface [18]; (ii) second, there is a SOC loss and intense microbial decomposition due to climatic factors, so high temperatures can affect the microorganisms’ activity, accelerating the SOC decomposition [135] and affecting to SOC content at depth; and (iii) in a third stage where the SOC remains stabilized, linked to the fine fraction (<20 μ, clay and fine silt) [99], the SOC of the studied soils could be stabilized at depth [100], as we can observe for all the management processes studied. Although there was a SOC reduction in NT, the factors mentioned above cause an increase in the SR-SOC (SR > 2); therefore, they increased the soil quality with respect to other management. It is important to highlight that it would be necessary to carry out studies of the soil’s physical properties to provide more information on this matter.
3.5. Influence of Topographic Position in Land Management Change (from CT1 to NT-CC) on SR-SOC for the Short Term (2017–2019)
The analysis of SOC content in all the studied situations (managements and hillside positions) showed three important characteristics: (i) low SOC concentrations due to climatic conditions [73], (ii) a SOC reduction at depth due to high OM mineralization and the lack of crop residues after dry periods [24], which affects the SOC content at depth [18], and (iii) an increase of SOC content as we descend along the hillside due to degradation process associated with water erosion processes [44] in the highest topographic positions and soil accumulation processes in the hillside’s lower parts [18] (Figure 4). These factors, acting synergistically, can cause decarbonization processes in the soil [56].
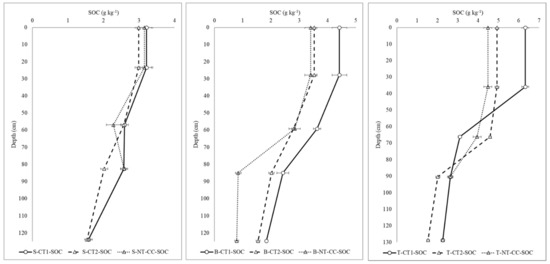
Figure 4.
Soil organic carbon content in the hillside position. Conventional tillage and no tillage with cover crops. S: summit, B: backslope, T: toeslope; CT1: conventional tillage 2017, CT2: conventional tillage 2019, NT-CC: no tillage with cover crops.
A detailed analysis regarding the OM, SOC, and SOC-S distribution of these soils has been carried out [18,83], concluding that LMC from CT1 to NT-CC for the short-term (two years) had a positive effect on SOC in S and T position; however, in the B position, this effect was negative. LMC caused a SOC reduction in the Ap horizon and an increase in the Bw horizon due to slight textural changes (clay content), and the soluble organic compounds’ presence can be filtered by depth; in addition, the SOC concentrations due to LMC from CT1 to NT-CC in the short-term caused carbonization (position S and T) and decarbonization (position B) of the soil.
The topographic position effect to SR-SOC showed that the SR-SOC was highly variable (Table 6), ranging between 1.07 and 4.30 for the CT2 Ap/Bw T-position and NT-CC Ap/C B-position, respectively. Despite this variability, we can say that the S topographic position had the lowest SR-SOC values, being higher in the two remaining topographic positions (T and S). One of the important features was that the SR-SOC increased with depth, except for the CT1 B-position, which decreased with depth (CT1: sR1:2.51, SR2:1.88 and SR3:1.87). Another very important issue to highlight was that, on the surface (SR1), the SR-SOC in all situations was <2, except for the CT1 Ap/Bw backslope (SR1:2.51) (Table 6).
Table 6.
Stratification ratio of soil organic carbon (average ± SD) in a Mediterranean olive grove. Initial situation (September 2017) and final situation (September 2019) in three topographic positions (toeslope, backslope, and summit) with two types of management (conventional tillage or no-tillage with cover crops).
The starting point CT1 (2017) showed a preferential increase of the SR-SOC as we went down along the hillside and, therefore, the highest values were found in T-position. Likewise, we can affirm that the highest soil quality as a function of the SR-SOC was in the hillside’s lower parts (T-position), ranging from 1.66 (SR1) to 2.87 (SR3) in CT1 (Table 6). This increase in SR-SOC along the hillside in the lower parts could be due to water erosion processes. In this sense, the SR-SOC reduction superficially (Ap-horizon) could be due to soil erosion [136], so that CT with intensive tillage contributes to soil loss [103] due to water erosion accelerating the OM decomposition rates and causing structural aggregates’ degradation in topsoil, thereby increasing the SR-SOC at depth [137].
Regarding the final situation (CT2), a clear and defined trend was not observed, but a slight increase in the SR-SOC could be seen at depth, and a slight reduction in the SR at the surface, except for the S position where this relationship was reversed. Some authors [138] have pointed out that the SR-SOC is favored by large soil OM inputs, high soil clay content, and a saturated soil calcium matrix. However, this phenomenon could be explained by soil management and texture since the SR-SOC can be reduced in the soil surface due to soluble organic compounds that can filter into the soil at depth, increasing the soil aggregates [126].
However, the LMC from CT1 to NT-CC for two years (short-term) causes two very important effects. First, there is a soil loss quality in the T position, with an SR-SOC reduction that could reach −40% in SR2 NT-CC. NT can negatively affect the soil quality compared to CT [43] due to infiltration rates, macroaggregates, OM decrease, and an increase in soil compaction and consolidation with NT compared to CT in the short-term. This reduction could be the result of very intense erosive processes [127] derived from LMC.
Second, an opposite effect we can observe is an SR-SOC increase in the B position, which can reach up to +130%, with SR-SOC values of 4.30 (SR3-NT-CC). In the case of the S position, no changes were observed due to the LMC. In this sense, in CM, similar results were obtained in the toposequences of traditional OG [139], indicating an increase in SOM and fine particles on hillsides due to water erosion. Other researchers [136] have highlighted the contribution, especially in semiarid areas, of the erosion process to SR-SOC loss. The absence of tillage in NT improves the formation of stable aggregates and the microbial and fauna communities of the soil [140], which provides protection against OM decomposition [141]. In the case of the S position, no changes were observed due to the LMC.
4. Conclusions
The main conclusions emerging from this research are: (i) CT (strongly mechanized) in rainfed OG over time (from CT-1950 to CT0-2003: long-term) under semiarid conditions leads land degradation processes, low SR-SOC (1.21–1.73: poor soil quality) and low capacity for agricultural use, inducing soil decarbonization by erosion processes, (ii) CT over time (from CT0-2003 to CT1-2017: medium long-term) involved a SOC reduction, however, the SR-SOC increased (2.29 and 3.01: good soil quality) due tillage, affecting to less OM input into the soil, accelerating the erosion processes, favoring the formation of SOM stable compartments by soil aeration, reducing the SOC at depth and increasing the SR-SOC, (iii) CT in the short-term (from CT1-2017 to CT2-2019) caused a SOC reduction in topsoil and slight increases in sub soil, with a SR-SOC reduction (loss of soil quality) due to wrong agricultural management techniques (if the SOC content is reduced at the surface and the concentrations at depth remain constant, the SR-SOC decreases), (iv) LMC in the short-term (from CT1-2017 to NT-CC-2019) caused a SOC reduction (−20% and −3.3% for the Ap and Bw-horizon, respectively; unchanged at depth) due to low soil moisture and high-temperature, increasing in surface the SR-SOC (+9.9%), so a turning point in the soil degradation process may be beginning, (v) LUC in the medium long-term (from CT0-2003 to NT-2019) showed variations in the SOC content (−9.6%, +11.3%, −65.2%, and −61.8% for the Ap, Bw, Bw/C, and C horizons, respectively), causing a loss of soil quality in topsoil (SR −19%) and an increase in depth (SR +140.5%) improving the soil quality, this increase was due to a SOC reduction by herbicide application, favoring water erosion processes with SOC loss on surface, a SOC loss due to intense microbial decomposition due to the climate factors, and by SOC stabilized processes linked to the fine fraction, and (vi) the hillside position also affected the LMC (from CT1-2017 to NT-CC-2019: short-term), so that the SOC content increased as we descended along the hillside due to erosion with soil accumulation processes in the hillside’s lower parts, LMC produced a soil loss quality in the T position (SR-SOC: −40% in SR2 NT-CC) due to SOM decreasing by soil compaction and consolidation with intense erosive processes derived from LMC, in the case of the B position, the SR-SOC increased (+130%: sR3-NT-CC, 4.30) due to NT-CC improve the formation of stable aggregates and the microbial and fauna communities of the soil, which provide protection against OM decomposition, in the case of the S position no changes were observed due to the LMC.
Author Contributions
Conceptualization, L.P.-A. and B.L.-G.; methodology, L.P.-A., B.L.-G., J.A.-H. and M.G.-R.; validation, L.P.-A. and B.L.-G.; formal analysis, L.P.-A. and B.L.-G.; investigation, L.P.-A., B.L.-G., J.A.-H. and M.G.-R.; resources, L.P.-A. and B.L.-G.; data curation, J.A.-H. and M.G.-R.; writing—original draft preparation, L.P.-A. and B.L.-G.; writing—review and editing, L.P.-A. and B.L.-G.; visualization, L.P.-A. and B.L.-G.; supervision, L.P.-A. and B.L.-G.; project administration, L.P.-A. and B.L.-G.; funding acquisition, L.P.-A. and B.L.-G. All authors have read and agreed to the published version of the manuscript.
Funding
This research was funded by the European Commission Horizon 2020 project Diverfarming (“Crop diversification and low-input farming across Europe: from practitioners’ engagement and ecosystems services to increased revenues and value chain organization”), grant no. 728003.
Institutional Review Board Statement
Not applicable.
Informed Consent Statement
Informed consent was obtained from all subjects involved in the study.
Data Availability Statement
Data sharing not applicable.
Acknowledgments
This work was supported by the European Commission Horizon 2020 project Diverfarming (grant no. 728003). We are grateful for the help of farmer Antonio Parras Rosa with the fieldwork and in the transfer of the experimental farm.
Conflicts of Interest
The authors declare no conflict of interest. The authors declare that they have no known competing financial interests or personal relationships that could have appeared to influence the work reported in this paper.
References
- Food and Agriculture Organization of the United Nations; Intergovernmental Technical Panel on Soils. Status of the World’s Soil Resources (SWSR)—Main Report; Food and Agriculture Organization of the United Nations: Rome, Italy, 2015. [Google Scholar]
- Dumanski, J.; Peiretti, R. Modern concepts of soil conservation. Int. Soil Water Conserv. Res. 2013, 1, 19–23. [Google Scholar] [CrossRef]
- Lehmann, J.; Bossio, D.A.; Kögel-Knabner, I.; Rillig, M.C. The concept and future prospects of soil health. Nat. Rev. Earth Environ. 2020, 1, 544–553. [Google Scholar] [CrossRef] [PubMed]
- Young, I.M.; Crawford, J.W. Interaction and self-organization on the soil–microbe complex. Science 2004, 304, 1634–1637. [Google Scholar] [CrossRef] [PubMed]
- Roger-Estrade, J.; Anger, C.; Bertrand, M.; Richard, G. Tillage and soil ecology: Partners for sustainable agriculture. Soils Tillage Res. 2010, 111, 33–40. [Google Scholar] [CrossRef]
- Kibblewhite, M.G.; Ritz, K.; Swift, M.J. Soil health in agricultural systems. Philos. Trans. R. Soc. 2008, B363, 685–701. [Google Scholar] [CrossRef]
- Brussaard, L. Ecosystem Services Provided by the Soil Biota. In Soil Ecology and Ecosystem Services, 1st ed.; Wall, D.H., Bardgett, R.D., Eds.; Oxford University Press: Oxford, UK, 2012; pp. 45–58. ISBN 9780199575923. [Google Scholar]
- Bünemann, E.K.; Bongiorno, G.; Bai, Z.; Creamer, R.E.; De Deyn, G.; de Goede, R.; Fleskens, L.; Geissen, V.; Kuyper, T.W.; Mäder, P.; et al. Soil quality—A critical review. Soil Biol. Biochem. 2018, 120, 105–125. [Google Scholar] [CrossRef]
- Doran, W.J.; Zeiss, M.R. Soil health and sustainability: Managing the biotic component of soil quality. Appl. Soil Ecol. 2000, 15, 3–11. [Google Scholar] [CrossRef]
- Wander, M.M.; Cihacek, L.J.; Coyne, M.; Drijber, R.A.; Grossman, J.M.; Gutknecht, J.L.M.; Horwath, W.R.; Jagadamma, S.; Olk, D.C.; Ruark, M.; et al. Developments in Agricultural Soil Quality and Health: Reflections by the Research Committee on Soil Organic Matter Management. Front. Environ. Sci. 2019, 7, 109. [Google Scholar] [CrossRef]
- Karlen, D.L.; Rice, C.W. Soil degradation: Will humankind ever learn? Sustainability 2015, 7, 12490–12501. [Google Scholar] [CrossRef]
- Lorenz, K.; Lal, R. Soil Organic Carbon—An Appropriate Indicator to Monitor Trends of Land and Soil Degradation within the SDG Framework? Rural Development, Agriculture and International Soil Protection; Starke, S.M., Ehlers, K., Eds.; Germany Environment Agency, 2016; Available online: http://www.umweltbundesamt.de/publikationen (accessed on 15 December 2020).
- Stolte, J.; Tesfai, M.; Øygarden, L.; Kværnø, S.; Keizer, J.; Verheijen, F.; Panagos, P.; Ballabio, C.; Hessel, R. Soil Threats in Europe; Publications Office: Luxembourg, 2016. [Google Scholar]
- Gregory, A.S.; Ritz, K.; McGrath, S.P.; Quinton, J.N.; Goulding, K.W.T.; Jones, R.J.A.; Harris, J.A.; Bol, R.; Wallace, P.; Pilgrim, E.S.; et al. A review of the impacts of degradation threats on soil properties in the UK. Soil Use Manag. 2015, 31, 1–15. [Google Scholar] [CrossRef] [PubMed]
- Whitmore, A.; Whalley, R.; McGrath, S. Investigating the Impacts of Soil Degradation Processes on Soil Functions—A Scoping Study. In Sub-Project B of Defra Project SP1601: Soil Functions, Quality and Degradation—Studies in Support of the Implementation of Soil Policy; Department for Environment, Food and Rural Affairs: London, UK, 2010. [Google Scholar]
- Xu, M.; Wang, Z.; Zhao, Y. Stratification ratio of soil organic carbon as an indicator of carbon sequestration and soil quality in ecological restoration. Restor. Ecol. 2018, 555–562. [Google Scholar] [CrossRef]
- Federica, L.; Gabriele, B.; Gaetano, R.; Malafronte, A. Spatial modelling and uncertainty assessment of pyroclastic cover thickness in the Sorrento Peninsula. Environ. Earth Sci. 2014, 72, 3353–3367. [Google Scholar] [CrossRef]
- González-Rosado, M.; Lozano-García, B.; Aguilera-Huertas, J.; Parras-Alcántara, L. Short-term effects of land management change linked to cover crop on soil organic carbon in Mediterranean olive grove hillsides. Sci. Total Environ. 2020, 744, 140683. [Google Scholar] [CrossRef]
- Scharlemann, J.P.W.; Tanner, E.V.J.; Hiederer, R.; Kapos, V. Global soil carbon: Understanding and managing the largest terrestrial carbon pool. Carbon Manag. 2014, 5, 81–91. [Google Scholar] [CrossRef]
- Batjes, N.H. Harmonized soil property values for broad-scale modelling (WISE30sec) with estimates of global soil carbon stocks. Geoderma 2016, 269, 61–68. [Google Scholar] [CrossRef]
- Barré, P.; Angers, D.A.; Basile-Doelsch, I.; Bispo, A.; Cécillon, L.; Chenu, C.; Chevallier, T.; Derrien, D.; Eglin, T.K.; Pellerin, S. Ideas and perspectives: Can we use the soil carbon saturation deficit to quantitatively assess the soil carbon storage potential, or should we explore other strategies? Biogeosci. Discuss. 2017, 1–12. [Google Scholar] [CrossRef]
- Lal, R. Soil carbon sequestration impacts on global climate change and food security. Science 2004, 304, 1623–1627. [Google Scholar] [CrossRef]
- Franzluebbers, A.J. Soil organic matter stratification ratio as an indicator of soil quality. Soil Tillage Res. 2002, 66, 95–106. [Google Scholar] [CrossRef]
- Hernanz, J.L.; Sanchez-Giron, V.; Navarrete, L. Soil carbon sequestration and stratification in a cereal/leguminous crop rotation with three tillage systems in semiarid conditions. Agric. Ecosyst. Environ. 2009, 133, 114–122. [Google Scholar] [CrossRef]
- FAOSTAT. Food and Agriculture Organization of the United Nations—FAOSTAT Database; FAOSTAT: Rome, Italy, 2020. [Google Scholar]
- Parras-Alcántara, L.; Díaz-Jaimes, L.; Lozano-García, B. Organic farming affects C and N in soils under olive groves in mediterranean areas. Land Degrad. Dev. 2015, 26–28, 800–806. [Google Scholar] [CrossRef]
- Franzluebbers, A.J. Water infiltration and soil structure related to organic matter and its stratification with depth. Soil Tillage Res. 2002, 66, 197–205. [Google Scholar] [CrossRef]
- Castro-Filho, C.; Henklain, J.C.; Vieira, M.J.; Casão, J.R. Tillage methods and soil and water conservation in southern Brazil. Soil Tillage Res. 1991, 20, 271–283. [Google Scholar] [CrossRef]
- Iovino, M.; Castellini, M.; Bagarello, V.; Giordano, G. Using static and dynamic indicators to evaluate soil physical quality in a Sicilian area. Land Degrad. Dev. 2016, 27, 200–210. [Google Scholar] [CrossRef]
- Lal, R. Tillage effects on soil degradation, soil resilience, soil quality, and sustainability. Soil Tillage Res. 1993, 27, 1–8. [Google Scholar] [CrossRef]
- Dexter, A.R. Soil physical quality: Part I. Theory, effects of soil texture, density, and organic matter, and effects on root growth. Geoderma 2004, 120, 201–214. [Google Scholar] [CrossRef]
- Reynolds, W.D.; Drury, C.F.; Yang, X.M.; Fox, C.A.; Tan, C.S.; Zhang, T.Q. Land management effects on the near surface physical quality of a clay loam soil. Soil Tillage Res. 2007, 96, 316–330. [Google Scholar] [CrossRef]
- Trigo, C.; Celis, R.; Hermosín, M.C.; Cornejo, J. Organoclay-based formulations to reduce the environmental impact of the herbicide diuron in olive groves. Soil Sci. Soc. Am. J. 2009, 73, 1652–1657. [Google Scholar] [CrossRef]
- García-Ruiz, R.; Ochoa, M.V.; Hinojosa, M.B.; Gómez-Muñoz, B. Improved soil quality after 16 years of olive mill pomace application in olive oil groves. Agron. Sustain. Dev. 2012, 32, 803–810. [Google Scholar] [CrossRef]
- Cerdà, A.; Lavee, H.; Romero-Díaz, A.; Hooke, J.; Montanarella, L. Soil erosion and degradation on Mediterranean type ecosystems. Land Degrad. Dev. 2010, 21, 71–74. [Google Scholar] [CrossRef]
- Conforti, M.; Lucà, F.; Scarciglia, F.; Matteucci, G.; Buttafuoco, G. Soil carbon stock in relation to soil properties and landscape position in a forest ecosystem of southern Italy (Calabria region). Catena 2016, 144, 23–33. [Google Scholar] [CrossRef]
- Parras-Alcántara, L.; Lozano-García, B. Conventional tillage versus organic farming in relation to soil organic carbon stock in olive groves in Mediterranean rangelands (southern Spain). Solid Earth 2015, 5, 299–311. [Google Scholar] [CrossRef]
- Fernández-Romero, M.L.; Parras-Alcántara, L.; Lozano-García, B.; Clark, J.M.; Collins, C.D. Soil quality assessment based on carbon stratification index in different olive grove management practices in Mediterranean areas. Catena 2016, 137, 449–458. [Google Scholar] [CrossRef]
- Lal, R.; Smith, P.; Jungkunst, H.F.; Mitsch, W.J.; Lehmann, J.; Nair, P.K.R.; McBratney, A.B.; de Moraes, J.C.; Schneider, J.; Zinn, Y.L.; et al. The carbon sequestration potential of terrestrial ecosystems. J. Soil Water Conserv. 2018, 73–76, 145A–152A. [Google Scholar] [CrossRef]
- Griffiths, R.P.; Madritch, M.D.; Swanson, A.K. The effects of topography on forest soil characteristics in the Oregon Cascademountains (USA): Implications for the effects of climate change on soil properties. For. Ecol. Manag. 2009, 257, 1–7. [Google Scholar] [CrossRef]
- Bochet, E. The fate of seeds in the soil: A review of the influence of overland flow on seed removal and its consequences for the vegetation of arid and semiarid patchy ecosystems. Soil 2015, 1, 131–146. [Google Scholar] [CrossRef]
- Novara, A.; Catania, V.; Tolone, M.; Gristina, L.; Laudicina, V.A.; Quatrini, P. Cover Crop Impact on Soil Organic Carbon, Nitrogen Dynamics and Microbial Diversity in a Mediterranean Semiarid Vineyard. Sustainability 2020, 12, 3256. [Google Scholar] [CrossRef]
- Gómez, J.A.; Sobrinho, T.A.; Giráldez, J.V.; Fereres, E. Soil management effects on runoff, erosion and soil properties in an olive grove of Southern Spain. Soil Tillage Res. 2009, 102, 5–13. [Google Scholar] [CrossRef]
- Parras-Alcántara, L.; Lozano-García, B.; Keesstra, S.; Cerdà, A.; Brevik, E.C. Long term effects of soil management on ecosystem services and soil loss estimation in olive grove top-soils. Sci. Total Environ. 2016, 571, 498–506. [Google Scholar] [CrossRef]
- Marchamalo, M.; Hooke, J.M.; Sandercock, P.J. Flow and sediment connectivity in semi-arid landscapes in SE Spain: Patterns and controls. Land Degrad. Dev. 2016, 27, 1032–1044. [Google Scholar] [CrossRef]
- Gómez, J.A.; Campos, M.; Guzmán, G.; Castillo-Llanque, F.; Vanwalleghem, T.; Lora, Á.; Giráldez, J.V. Soil erosion control, plant diversity, and arthropod communities under heterogeneous cover crops in an olive orchard. Environ. Sci. Pollut. Res. 2018, 25, 977–989. [Google Scholar] [CrossRef] [PubMed]
- Pastor, M.; Castro, J.; Humanes, M.D.; Muñoz, J. Sistemas de manejo del suelo en olivar de Andalucía. Edafología 2001, 8, 75–98. [Google Scholar]
- Castellano-Hinojosa, A.; Strauss, S.L. Impact of cover crops on the soil microbiome of tree crops. Microorganisms 2020, 8, 328. [Google Scholar] [CrossRef]
- Loveland, P.; Webb, J. Is there a critical level of organic matter in the agricultural soils of temperate regions: A review. Soil Tillage Res. 2003, 70, 1–18. [Google Scholar] [CrossRef]
- Sastre, B.; Barbero-Sierra, C.; Bienes, R.; Marques, M.J.; García-Díaz, A. Soil loss in an olive grove in Central Spain under cover crops and tillage treatments, and farmer perceptions. J. Soils Sediments 2017, 17, 873–888. [Google Scholar] [CrossRef]
- De la Rosa, D.; Moreira, J.M. Evaluación Agroecológica de Recursos Naturales de Andalucía; Agencia de Medio Ambiente, Junta de Andalucía: Sevilla, Spain, 1987. [Google Scholar]
- Kottek, M.; Grieser, J.; Beck, C.; Rudolf, B.; Rubel, F. World map of the Köppen-Geiger climate classification updated. Meteorol. Z. 2006, 15, 259–263. [Google Scholar] [CrossRef]
- AEMET—Agencia Estatal de Meteorología, 541 2020. Standard Climate Values—Period: 1983–2010. Available online: http://www.aemet.es/en/serviciosclimaticos/datosclimatologicos/valoresclimatologicos?l=5270B&k=and (accessed on 16 March 2020).
- IUSS Working Group WRB. World Reference Base for Soil Resources 2014, update 2015. In International Soil Classification System for Naming Soils and Creating Legends for Soil Maps; World Soil Resources Reports No. 106; FAO: Rome, Italy, 2015. [Google Scholar]
- González-Rosado, M.; Parras-Alcántara, L.; Aguilera-Huertas, J.; Benítez, C.; Lozano-García, B. Effects of land management change on soil aggregates and organic carbon in Mediterranean olive groves. Catena 2020, 195. [Google Scholar] [CrossRef]
- Lal, R. Forest soils and carbon sequestration. Forest Ecol. Manag. 2005, 220, 242–258. [Google Scholar] [CrossRef]
- Parras-Alcántara, L.; Lozano-García, B.; Brevik, E.C.; Cerdà, A. Soil organic carbon stocks assessment in Mediterranean natural areas: A comparison of entire soil profiles and soil control sections. J. Environ. Manag. 2015, 155, 219–228. [Google Scholar] [CrossRef]
- Francaviglia, R.; Renzi, G.; Doro, L.; Parras-Alcántara, L.; Lozano-García, B.; Ledda, L. Soil sampling approaches in Mediterranean agro-ecosystems. Influence on soil organic carbon stocks. Catena 2017, 158, 113–120. [Google Scholar] [CrossRef]
- Álvaro-Fuentes, J.; Lóczy, D.; Thiele-Bruhn, S.; Zornoza, R. Handbook of Plant and Soil Analysis for Agricultural Systems; Crai UPTC Editions: Cartagena, Spain, 2019; 389p. [Google Scholar]
- Blake, G.R.; Hartge, K.H. Bulk density. In Methods of Soil Analysis, Part 1: Physical and Mineralogical Methods, 2nd ed.; Klute, Ed.; ASA, SSSA: Madison, WI, USA, 1986; pp. 377–382. [Google Scholar]
- USDA. Soil Survey Laboratory Methods Manual, Soil Survey Investigation Report No. 42; Version 4.0; USDA-NCRS: Lincoln, NE, USA, 2004. [Google Scholar]
- Guitián, F.; Carballas, T. Técnicas de Análisis de Suelos; Picro Sacro: Santiago de Compostela, Spain, 1976. [Google Scholar]
- Nelson, D.W.; Sommers, L.E. Total carbon, organic carbon and organic matter. In Methods of Soil Analysis, Part 2. Chemical and Microbiological Properties. Agronomy Monograph; Page, A.L., Miller, R.H., Keeney, D., Eds.; ASA and SSSA: Madison, WI, USA, 1982; Volume 9, pp. 539–579. [Google Scholar]
- Bremner, J.M. Total nitrogen. In Methods of Soil Analysis. Part 3. Chemical Methods; Sparks, D.L., Ed.; SSSA Book Series No 5; Soil Science Society of America: Madison, WI, USA, 1996; pp. 1085–1086. [Google Scholar]
- Stolbovoy, V.; Montanarella, L.; Filippi, N.; Jones, A.; Gallego, J.; Grassi, G. Soil Sampling Protocol to Certify the Changes of Organic Carbon Stock in Mineral Soil of the European Union; Version 2. EUR 21576 EN/2. 56; Office for Official Publications of the European Communities: Luxembourg, 2007; ISBN 978-92-79-05379. [Google Scholar]
- Intergovernmental Panel on Climate Change. Good Practice Guidance for Land Use, Land Use Change and Forestry; Penman, J., Gytarsky, M., Hiraishi, T., Krug, T., Kruger, D., Pipatti, R., Buendia, L., Miwa, K., Ngara, T., Tanabe, K., et al., Eds.; IPCC/OECD/IEA/IGES: Hayama, Japan, 2003. [Google Scholar]
- Aguilera-Huertas, J. Efecto del Laboreo y la Posición Topográfica en la Calidad del Suelo. Master’s Thesis, Instituto de Estudios de Postgrado; Máster en Gestión Ambiental y Biodiversidad, Universidad de Córdoba, Cordoba, Spain, 2020. [Google Scholar]
- Alcaide, R. Estudio de Suelos Sobre Olitostromas en la Campiña de Torredelcampo, Jaén. Bachelor’s Thesis, Universidad de Córdoba, Córdoba, Spain, 2013. [Google Scholar]
- Symith, A.J.; Montgomery, R.F. Soil and Land Use in Central Western Nigeria; The Government of Western Nigeria: Ibadan, Nigeria, 1962.
- Fernández-Romero, M.L.; Lozano-García, B.; Parras-Alcántara, L. Topography and land use change effects on the soil organic carbon stock of forest soils in Mediterranean natural areas. Agric. Ecosyst. Environ. 2014, 195, 1–9. [Google Scholar] [CrossRef]
- Cerdà, A. Effects of rock fragment cover on soil infiltration, interrill runoff and erosion. Eur. J. Soil Sci. 2001, 52, 59–68. [Google Scholar] [CrossRef]
- Zhang, Y.Y.; Wu, W.; Liu, H. Factors affecting variations of soil pH in different horizons in hilly regions. PLoS ONE 2019, 14, e0218563. [Google Scholar] [CrossRef]
- Gallardo, A.; Rodríguez-Saucedo, J.; Covelo, F.; Fernández-Ales, R. Soil Nitrogen heterogeneity in dehesa ecosystem. Plant Soil 2000, 222, 71–82. [Google Scholar] [CrossRef]
- Jordán, A.; Zavala, L.M.; Gil, J. Effects of mulching on soil physical properties and runoff under semi-arid conditions. Catena 2010, 81, 77–85. [Google Scholar] [CrossRef]
- Moscatelli, M.C.; Di Tizio, A.; Marinari, S.; Grego, S. Microbial indicators related to soil carbon in Mediterranean land use systems. Soil Tillage Res. 2007, 97, 51–59. [Google Scholar] [CrossRef]
- Batjes, N.H. Total carbon and nitrogen in the soils of the world. Eur. J. Soil Sci. 2014, 65, 10–25. [Google Scholar] [CrossRef]
- Zomer, R.J.; Bossio, D.A.; Sommer, R.; Verchot, L.V. Global Sequestration Potential of Increased Organic Carbon in Cropland Soils. Sci. Rep. 2017, 7, 15554. [Google Scholar] [CrossRef]
- Rodriguez-Murillo, J.C. Organic carbon content under different types of land use and soil in peninsular Spain. Biol. Fert. Soils 2001, 33, 53–61. [Google Scholar] [CrossRef]
- Muñoz-Rojas, M.; Jordán, A.; Zavala, L.M.; De la Rosa, D.; Abd-Elmabod, S.K.; Anaya-Romero, M. Organic carbon stocks in Mediterranean soil types under different land uses (Southern Spain). Solid Earth 2012, 3, 375–386. [Google Scholar] [CrossRef]
- Castro, J.; Fernández-Ondono, E.; Rodríguez, C.; Lallena, A.M.; Sierra, M.; Aguilar, J. Effects of different olive-grove management systems on the organic carbon and nitrogen content of the soil in Jaen (Spain). Soil Tillage Res. 2008, 98, 56–67. [Google Scholar] [CrossRef]
- Álvaro-Fuentes, J.; Easter, M.; Cantero-Martínez, C.; Paustian, K. Modelling soil organic carbon stocks and their changes in the northeast of Spain. Eur. J. Soil Sci. 2011, 62, 685–695. [Google Scholar] [CrossRef][Green Version]
- Rodríguez, J.A.; Álvaro-Fuentes, J.; Gonzalo, J.; Gil, C.; Ramos-Miras, J.J.; Grau, J.M.; Boluda, R. Assessment of the soil organic carbon stock in Spain. Geoderma 2016, 264, 117–125. [Google Scholar] [CrossRef]
- González-Rosado, M.; Parras-Alcántara, L.; Aguilera-Huertas, J.; Lozano-García, B. Long-term evaluation of the initiative 4‰ under different soil managements in Mediterranean olive groves. Sci. Total Environ. 2020, 143591. [Google Scholar] [CrossRef]
- Fernández-Romero, M.L.; Lozano-García, B.; Parras-Alcántara, L.; Collins, C.D.; Clark, J.M. Effects of land management on different forms of soil carbon in olive groves in Mediterranean areas. Land Degrad. Dev. 2016, 27, 1186–1195. [Google Scholar] [CrossRef]
- Olson, K.R.; Al-Kaisi, M.M. The importance of soil sampling depth for accurate account of soil organic carbon sequestration, storage, retention and loss. Catena 2015, 125, 33–37. [Google Scholar] [CrossRef]
- Chatterjee, A.; Lal, R. On farm assessment of tillage impact on soil carbon and associated soil quality parameters. Soil Tillage Res. 2009, 104, 270–277. [Google Scholar] [CrossRef]
- Masmoudi-Charfi, C.; Masmoudi, M.; Ben Mechlia, N. Root distribution in young Chétoui olive trees (Olea europaea L.) and agronomic applications. Adv. Hortic. Sci. 2011, 25, 112–122. [Google Scholar] [CrossRef]
- VandenBygaart, A.J. Monitoring soil organic carbon stock changes in agricultural landscapes: Issues and a proposed approach. Can. J. Soil Sci. 2006, 86, 451–463. [Google Scholar] [CrossRef]
- Sombrero, A.; De Benito, A. Carbon accumulation in soil. Ten year study of conservation tillage and crop rotation in a semi-arid area of Castile-Leon, Spain. Soil Tillage Res. 2010, 107, 64–70. [Google Scholar] [CrossRef]
- Lorenz, K.; Lal, R. The depth distribution of organic soil carbon in relation to land use and management and the potential of carbon sequestration in subsoil horizons. Adv. Agron. 2005, 88, 35–66. [Google Scholar] [CrossRef]
- Grüneberg, E.; Schöning, I.; Kalko, E.K.V.; Weisser, W.W. Regional organic carbon stock variability: A comparison between depth increments and soil horizons. Geoderma 2010, 155, 426–433. [Google Scholar] [CrossRef]
- SSSA. Soil Science Society of America 2008. Glossary of Soil Science Terms; SSSA: Madison, WI, USA, 2016; Available online: http://blogs.upm.es/techenglish/wp-content/uploads/sites/53/2015/05/Soil-Science-glossary.pdf (accessed on 1 September 2020).
- Angst, G.; Messinger, J.; Greiner, M.; Häusler, W.; Hertel, D.; Kirfel, K.; Kögel-Knabner, I.; Leuschner, C.; Rethemeyer, J.; Mueller, C.W. Soil organic carbon stocks in topsoil and subsoil controlled by parent material, carbon input in the rhizosphere, and microbial-derived compounds. Soil Biol. Biochem. 2018, 122, 19–30. [Google Scholar] [CrossRef]
- Morugán-Coronado, A.; Linares, C.; Gómez-López, M.D.; Faz, Á.; Zornoza, R. The impact of intercropping, tillage and fertilizer type on soil and crop yield in fruit orchards under Mediterranean conditions: A meta-analysis of field studies. Agric. Syst. 2020, 178, 102736. [Google Scholar] [CrossRef]
- Lozano-García, B.; Parras-Alcántara, L. Short-term effects of olive mill by-products on soil organic carbon, total N, C:N ratio and stratification ratios in a Mediterranean olive grove. Agric. Ecosyst. Environ. 2013, 165, 68–73. [Google Scholar] [CrossRef]
- Six, J.; Conant, R.; Paul, E.A.; Paustian, K. Stabilization mechanisms of soil organic matter: Implications for c-saturation of soils. Plant Soil 2002, 241, 155–176. [Google Scholar] [CrossRef]
- Stewart, C.E.; Paustian, K.; Conant, R.T.; Plante, A.F.; Six, J. Soil carbon saturation: Concept, evidence and evaluation. Biogeochemistry 2007, 86, 19–31. [Google Scholar] [CrossRef]
- Dignac, M.F.; Derrien, D.; Barré, P.; Barot, S.; Cécillon, L.; Chenu, C.; Chevallier, T.; Freschet, G.T.; Garnier, P.; Guenet, B.; et al. Increasing soil carbon storage: Mechanisms, effects of agricultural practices and proxies. A review. Agron. Sustain. Dev. 2017, 37, 14. [Google Scholar] [CrossRef]
- Hassink, J. The capacity of soils to preserve organic c and n by their association with clay and silt particles. Plant Soil 1997, 191, 77–87. [Google Scholar] [CrossRef]
- Chenu, C.; Angers, D.A.; Barré, P.; Derrien, D.; Arrouays, D.; Balesdent, J. Increasing organic stocks in agricultural soils: Knowledge gaps and potential innovations. Soil Tillage Res. 2018, 188, 41–52. [Google Scholar] [CrossRef]
- Moreno, F.; Murillo, J.M.; Pelegrín, F.; Girón, I.F. Long term impact of conservation tillage on stratification ratio of soil organic carbon and loss of total and active CaCO3. Soil Tillage Res. 2006, 85, 86–93. [Google Scholar] [CrossRef]
- Côté, L.; Brown, S.; Paré, D.; Fyles, J.; Bauhus, J. Dynamics of carbon and nitrogen mineralization in relation to stand type, stand age and soil texture in the boreal mixed wood. Soil Biol. Biochem. 2000, 32, 1079–1090. [Google Scholar] [CrossRef]
- Rodríguez-Lizana, A.; Espejo-Pérez, A.J.; González-Fernández, P.; Ordóñez-Fernández, R. Pruning residues as an alternative to traditional tillage to reduce erosion and pollutant dispersion in olive groves. Water Air Soil Pollut. 2008, 193, 165–173. [Google Scholar] [CrossRef]
- Balesdent, J.; Chenu, C.; Balabane, M. Relationship of soil organic matter dynamics to physical protection and tillage. Soil Tillage Res. 2000, 53, 215–230. [Google Scholar] [CrossRef]
- Gregorich, E.G.; Greer, K.J.; Anderson, D.W.; Liang, B.C. Carbon distribution and losses: Erosion and deposition effects. Soil Tillage Res. 1998, 47, 291–302. [Google Scholar] [CrossRef]
- Gmach, M.R.; Dias, B.O.; Silva, C.A.; Nóbrega, J.C.A.; Lustosa-Filho, J.F.; Siqueira-Neto, M. Soil organic matter dynamics and land-use change on Oxisols in the Cerrado, Brazil. Geoderma Region. 2018, 14, e00178. [Google Scholar] [CrossRef]
- Ferreira, A.D.; Amado, T.J.C.; Sá Nicoloso, R.D.; Fiorin, J.C.D.; Hansel, J.E. Soil carbon stratification affected by long-term tillage and cropping systems in southern Brazil. Soil Tillage Res. 2013, 133, 65–74. [Google Scholar] [CrossRef]
- Figueiredo, C.C.; Resck, D.V.S.; Carneiro, M.A.C.; Ramos, M.L.G.; Sá, J.C.M. Stratification ratio of organic matter pools influenced by management systems in a weathered Oxisol from a tropical agro-ecoregion in Brazil. Soil Res. 2013, 51, 133–141. [Google Scholar] [CrossRef]
- Six, J.; Elliott, E.T.; Paustian, K. Soil macroaggregate turnover and microaggregate formation: A mechanism for C sequestration under no-tillage agriculture. Soil Biol. Biochem. 2000, 2, 2099–2103. [Google Scholar] [CrossRef]
- Wright, S.F.; Green, V.S.; Cavigelli, M.A. Glomalin in aggregate size classes from three different farming systems. Soil Tillage Res. 2007, 94, 546–549. [Google Scholar] [CrossRef]
- Yoo, G.; Wander, M.M. Tillage Effects on Aggregate Turnover and Sequestration of Particulate and Humified Soil Organic Carbon. Soil Sci. Soc. Am. J. 2008, 72, 670–676. [Google Scholar] [CrossRef]
- Jobbágy, E.G.; Jackson, R.B. The vertical distribution of soil organic carbon and its relation to climate and vegetation. Ecol. Appl. 2000, 104, 423–436. [Google Scholar] [CrossRef]
- Barbera, V.; Poma, I.; Gristina, L.; Novara, A.; Egli, M. Long-term cropping systems and tillage management effects on soil organic carbon stock and steady state level of C sequestration rates in a semiarid environment. Land Degrad. Dev. 2012, 23, 82–91. [Google Scholar] [CrossRef]
- Cerdà, A.; Doerr, S.H. Soil wettability, runoff and erodibility of major dry-Mediterranean land use types on calcareous soils. Hydrol. Process. 2007, 21, 2325–2336. [Google Scholar] [CrossRef]
- García-Orenes, F.; Cerdà, A.; Mataix-Solera, J.; Guerrero, C.; Bodí, M.B.; Arcenegui, V.; Zornoza, R.; Sempere, J.G. Effects of agricultural management on surface soil properties and soil-water losses in eastern Spain. Soil Tillage Res. 2009, 106, 117–123. [Google Scholar] [CrossRef]
- Wallace, A. Soil organic matter must be restored to near original levels. Commun. Soil Sci. Plant Anal. 1994, 25, 29–35. [Google Scholar] [CrossRef]
- Shrestha, B.M.; Sitaula, B.K.; Singh, B.R.; Bajracharya, R.M. Soil organic carbon stocks in soil aggregates under different land use systems in Nepal. Nutr. Cycl. Agroecosys. 2004, 70, 201–213. [Google Scholar] [CrossRef]
- Sá, J.C.M.; Lal, R. Stratification ratio of soil organic matter pools as an indicator of carbon sequestration in a tillage chronosequence on a Brazilian Oxisol. Soil Tillage Res. 2009, 103, 46–56. [Google Scholar] [CrossRef]
- Noellemeyer, E.; Quiroga, A.R.; Estelrich, D. Soil quality in three range soils of the semi-arid Pampa of Argentina. J. Arid Environ. 2006, 65, 142–155. [Google Scholar] [CrossRef]
- Novara, A.; Rülh, J.; La Mantia, J.; Gristina, L.; La Bella, S.; Tuttolomondo, T. Litter contribution to soil organic carbon in the process of agriculture abandon. Solid Earth 2015, 6, 425–432. [Google Scholar] [CrossRef]
- Saygin, S.D.; Erpul, G.; Basaran, M. Comparison of aggregate stability measurement methods for clay-rich soils in Asartepe catchment of Turkey. Land Degrad. Dev. 2015, 28, 199–206. [Google Scholar] [CrossRef]
- Aranda, V.; Calero, J.; Plaza, I.; Ontiveros-Ortega, A. Long-term effects of olive mill pomace co-compost on wettability and soil quality in olive groves. Geoderma 2016, 267, 185–195. [Google Scholar] [CrossRef]
- López-Piñeiro, A.; Albarrán, A.; Rato, J.M.; Peña, D.; Cabrera, D. Long-term impacts of de-oiled two-phase olive mill waste on soil chemical properties, enzyme activities and productivity in an olive grove. Soil Tillage Res. 2011, 114, 175–182. [Google Scholar] [CrossRef]
- Gámiz, B.; Celis, R.; Cox, L.; Hermosín, M.C.; Cornejo, J. Effect of olive-mill waste addition to soil on sorption, persistence, and mobility of herbicides used in Mediterranean olive groves. Sci. Total Environ. 2012, 429, 292–299. [Google Scholar] [CrossRef] [PubMed]
- Blanco-Moure, N.; Gracia, R.; Bielsa, A.C.; López, M.V. Long-term no-tillage effects on particulate and mineral-associated soil organic matter under rainfed Mediterranean conditions. Soil Use Manag. 2013, 29, 250–259. [Google Scholar] [CrossRef]
- Diekow, J.; Mielniczuk, J.; Knicker, H.; Bayer, C.; Dick, D.P.; Kögel-Knabner, I. Soil C and N stocks as affected by cropping systems and nitrogen fertilisation in a southern Brazil acrisol managed under no-tillage for 17 years. Soil Tillage Res. 2005, 81, 87–95. [Google Scholar] [CrossRef]
- Gollany, H.T.; Elnaggar, A.A. Simulating soil organic carbon changes across toposequences under dryland agriculture using CQESTR. Ecol. Model. 2017, 355, 97–104. [Google Scholar] [CrossRef]
- Mrabet, R.; Saber, N.; El-Brahli, A.; Lahlou, S.; Bessam, F. Total, particulate organic matter and structural stability of a Calcixeroll soil under different wheat rotations and tillage systems in a semiarid area of Morocco. Soil Tillage Res. 2001, 57, 225–235. [Google Scholar] [CrossRef]
- López-Fando, C.; Almendros, G. Interactive effects of tillage and crop rotations on yield and chemical properties of soils in semi-arid central Spain. Soil Tillage Res. 1995, 36, 45–57. [Google Scholar] [CrossRef]
- Fleskens, L.; Stroosnijder, L. Is soil erosion in olive groves as bad as often claimed? Geoderma 2007, 141, 3–4. [Google Scholar] [CrossRef]
- Gómez, J.A.; Giráldez, J.V.; Vanwalleghem, T. Comment on “Is soil erosion in olive groves as bad as often claimed?” by L. Fleskens and L. Stroosnijder. Geoderma 2008, 147, 93–95. [Google Scholar] [CrossRef]
- Franzluebbers, A.J. Soil organic carbon sequestration and agricultural greenhouse gas emissions in the southeastern USA. Soil Tillage Res. 2005, 83, 120–147. [Google Scholar] [CrossRef]
- Virto, I.; Imaz, M.; Enrique, A.; Hoogmoed, W.; Bescansa, P. Burning crop residues under no-till in semi-arid land, northern Spain-effects on soil organic matter, aggregation, and earthworm populations. Aust. J. Soil Res. 2007, 45, 414–421. [Google Scholar] [CrossRef]
- Álvaro-Fuentes, J.; López, M.; Cantero-Martínez, C.; Arrúe, J. Tillage effects on soil organic carbon fractions in Mediterranean Dryland Agroecosystems. Soil Water Manag. Conserv. 2008, 72, 541–547. [Google Scholar] [CrossRef]
- Scowcroft, P.G.; Turner, D.R.; Vitousek, P.M. Decomposition of Metrosideros polymorpha leaf litter along elevational gradients in Hawaii. Glob. Chang. Biol. 2000, 6, 73–85. [Google Scholar] [CrossRef]
- Martínez-Mena, M.; López, J.; Almagro, M.; Boix-Fayos, C.; Albadalejo, J. Effect of water erosion and cultivation on the soil carbon stock in a semiarid area of South-East Spain. Soil Tillage Res. 2008, 99, 119–129. [Google Scholar] [CrossRef]
- Paustian, K.; Six, J.; Elliot, E.T.; Hunt, H.Q. Management options for reducing CO2 emissions from agricultural soils. Biogeochemistry 2000, 48, 147–163. [Google Scholar] [CrossRef]
- González, I.; Grau, J.M.; Fernández, A.; Jiménez, R.; González, M.R. Soil carbon stocks and soil solution chemistry in Quercus ilex stands in Mainland Spain. Eur. J. For. Res. 2012, 131, 1653–1667. [Google Scholar] [CrossRef]
- Lozano-García, B.; Parras-Alcántara, L. Variation in soil organic carbon and nitrogen stocks along a toposequence in a traditional Mediterranean olive grove. Land Degrad. Dev. 2014, 25, 297–304. [Google Scholar] [CrossRef]
- Jégou, D.; Cluzeau, D.; Hallaire, V.; Balesdent, J.; Tréhen, P. Burrowing activity of the earthworms Lumbricus terrestris and Aporrectodea giardi and consequences on C transfers in soil. Eur. J. Soil Biol. 2000, 36, 27–34. [Google Scholar] [CrossRef]
- Del Galdo, I.; Six, J.; Peressotti, A.; Cotrufo, M.F. Assessing the impact of land-use change on soil C sequestration in agricultural soils by means of organic matter fractionation and stable C isotopes. Glob. Chang. Biol. 2003, 9, 1204–1213. [Google Scholar] [CrossRef]
Publisher’s Note: MDPI stays neutral with regard to jurisdictional claims in published maps and institutional affiliations. |
© 2021 by the authors. Licensee MDPI, Basel, Switzerland. This article is an open access article distributed under the terms and conditions of the Creative Commons Attribution (CC BY) license (http://creativecommons.org/licenses/by/4.0/).