Article

Qualitative and Nutraceutical Characteristics after Storage of New Pear Selections in Emilia-Romagna Region

CREA Centro di Ricerca Olivicoltura, Frutticoltura e Agrumicoltura, via La Canapona 1 bis, 47121 Forlì, Italy
*
Author to whom correspondence should be addressed.
Agronomy 2021, 11(12), 2515; https://doi.org/10.3390/agronomy11122515
Submission received: 12 November 2021 / Revised: 6 December 2021 / Accepted: 7 December 2021 / Published: 10 December 2021

Abstract

:
The Emilia-Romagna region is excellent in European pear production. CREA Centro di Ricerca Olivicoltura, Frutticoltura e Agrumicoltura leads a breeding project co-founded by New Plant (a consortium of three growers’associations Apofruit, Apoconerpo, and Orogel Fresco) whose main objective is to improve fruit quality and nutraceutical parameters. The purpose of this study is to describe the qualitative characteristics of some new genotypes obtained by this breeding activity after cold storage, in comparison with the main cultivated varieties, ‘Abbé Fétel’, ‘William’s B.C’ and ‘Doyenne du Comice’. In 2013, 2014, and 2015, fruit samples, stored in a normal refrigeration room and after 100 dd, reaching the consumption ripening (2.5–3 kg/0.5 cm2), were analyzed to quantify the qualitative parameters: average weight, caliber, titratable acidity, soluble solids contents, skin color and overcolor, sugar and organic acids content, the antioxidant capacity, the total polyphenols, and ascorbic acid content. The results showed that the selection ‘CREA 171’, with red skin and yellow-cream flesh, outstood for the high antioxidant capacity due to the high content of polyphenols and ascorbic acid.

1. Introduction

Pear (Pyrus spp.) is one of the most important fruit species worldwide. In Europe, the main cultivated species is Pyrus communis and, in 2018, its production reached 2,495,218 tons [1]. Italian production is concentrated in the Emilia-Romagna region, which is excellent for pear production in Europe and the main grown cultivars are ‘Abbé Fétel’ and ‘William’s B.C’, covering 73% (50% and 23%, respectively) of the total production [2].
The high suitability of the Emilia-Romagna environment allowed to obtain the PGI (protection of geographical indication). ‘Abbé Fétel’, obtained in the late 19th century, is still the most cultivated pear variety in Italy. Since 1980, although many breeding activities have been carried out all around the world and the nearly 400 new varieties obtained, only the pear cv ‘Carmen’, obtained by CREA of Forlì in 2000, raised some interest from regional producers because of its earlier production of quality pears [3].
The pear breeding programs in progress all around the world differ in objectives related to the environment, soil, weather conditions, and the consumers’ taste. Adapting to environmental factors, climate change, and disease resistance/tolerance to disease (fire blight and brown spot) and pests (Cacopsilla pyri), those programs have raised increasing interest in recent years, with the aim of reducing the costs of production and environmental impact. Obtaining new disease-resistant cultivars producing quality fruit with appealing traits, such as red peel, is the challenge for pear breeders [4]. Pear fruit quality is defined by some physical properties such as color, size, texture, taste, and aroma and by chemical parameters such as sugar and organic acids, vitamins, and minerals [5]. Pears are a source of sugars, minerals, various biologically active compounds, and phenolics compounds known as natural antioxidants. Today, consumers search for fruits with specific quality characteristics and, at the same time, being safe and healthy. Phenolics, important bioactive compounds, have a strong antioxidant power [6]. Vegetables and fruits are suitable sources of phenolic compounds [7]. It is widely believed that ingestion of fresh fruits and vegetables is related to the reduction in cardiovascular and cancer diseases [8]. Galvis Sànchez et al. [9] evaluated polyphenols composition and antioxidant capacity of different pear varieties (one red, one green-red, one yellow-red, and three green), pointing out the higher presence of polyphenols in the peel than in the flesh; therefore, the consumption of unpeeled pears is recommended to maximize the intake of antioxidant compounds. The market needs new varieties able to diversify the product (almost 70% of regional production is now covered by the variety ‘Abbé Fétel’) and ensure high market shares [10]. Pear fruit quality tends to decline in the postharvest, and the right maturity stage at harvest is essential for suitable storage and suitable fruit ripening [11,12,13]. Pear storage strictly depends on the cultivar, maturity level at harvest, and storage conditions [14]. Elgar et al. [11] showed how differently pear cultivars express their best qualitative characteristics in relation to storage duration and harvest date. Fruit firmness and starch are frequently used in regression studies as indicators of ripening [15]. Harvest maturity level is critical for decay [16,17]. Weight loss and firmness decrease are higher in late-ripening pears [18].
The purpose of this study is to describe the characteristics of some new genotypes obtained by the breeding activity of CREA Centro di Ricerca, Olivicoltura, Frutticoltura e Agrumicoltura co-founded by New Plant (consortium of three growers’associations Apofruit, Apoconerpo, and Orogel Fresco), in comparison with the reference varieties Abbé Fétel, William and Doyenne du Comice. In 2013, 2014, and 2015, samples of fruits were picked and stored in normal refrigeration (NR) with −1 °C and and 85% RH and after 100 days, after reaching the consumption ripening (2.5–3 kg), were analyzed to quantify qualitative and nutraceutical parameters.

2. Materials and Methods

The study was carried out in 2013, 2014, and 2015. Fruits were picked in an orchard located in the Emilia-Romagna region (Campogalliano—MO). The selections ‘CREA 171’, and ‘CREA 179’ and ‘CREA 125’, grafted on Ba 29, were cultivated in comparison with ‘Abbé Fétel’, ‘Doyenne du Comice’, ‘Williams B.C’ and ‘Falstaff’ (Table 1), as reference cultivars, and stored at −1 °C and 95% relative humidity (RH). Cultivars and selections were cultivated following the traditional cultivation technique of that area [19]; the canopy system is the spindle, and tree spacing is 3.7 × 1.5 m. The orchard was irrigated with grassing in the inter-row, processing/weeding along the row, and covered with an anti-hail net.

2.1. Plant Material

Pear fruits from the three red selections, ‘CREA 171’, ‘CREA 179’ and ‘CREA 125’, were compared with those from the cultivars ‘Doyenne du Comice’, ‘Abbé Fétel’, ‘William’, and ‘Falstaff’ (Figure 1).
This latter is a variety released by CREA in 2012, with red skin, shape like ‘Abbé Fétel’, very suitable taste and picking date in late August to early September.
In Table 1, pomological description and average parameters of the cultivar and selections in trial at harvest time are reported.
During the 2013, 2014, and 2015 harvest seasons (August-September), marketable ripe fruits from each plot were picked, and representative fruit samples for each variety/selection (forty fruits in four plots) were placed in normal refrigeration (NR), −1 °C and 85% RH, to assess their cold storage aptitude during wintertime.
After 100 days of NR and 3 days at 20 °C, simulating a consumption ripening, four replicates of ten fruits were analyzed, and for each cultivar, qualitative parameters, acids, and sugar content, total antioxidant activity (TAC), total polyphenols (PHT), and ascorbic acid (AA) were determined.

2.2. Qualitative Parameters

Fruit flesh firmness, weight, total soluble solids content (TSS), titratable acidity (TA), and pH were evaluated as quality traits. Flesh firmness was recorded using a fruit texture analyzer (FTA-GUSS) using an 8 mm-diameter probe tip; the measure was taken at 6 mm depth and expressed in kg. A scale and an electronic fruit size measure were connected to FTA to record the fruit weight in grams and its diameter in millimeters. Fruits were squeezed by a manual fruit squeezer, four replicates for each thesis were considered, collected juices were used to evaluate the SS content, measured by an automatic refractometer (AtagoTM Smart-1, Tokyo, Japan) and expressed as °Brix. TA values were determined by titrating juice samples, up to pH 7.0, with 0.1 M NaOH solution using an automatic titration system (702 SM Titrino-Metrohm, Milan, Italy), which was also used as a pH meter. TA was expressed as milliequivalent of NaOH per 100 g of fresh weight.

2.3. HPLC Analysis for Sugars and Organic Acids Content

The acid compounds were detected using an Agilent 1100 HPLC equipped with a binary pump, an autosampler, a column oven, and a DA detector. The sugar compounds were detected using an HPLC system composed of a pump mod. K 501 (Knauer), a degasser, an autosampler basicMarathon (Spark Holland, Emmen, The Netherlands), a column oven, a refractive index detector K 2301 (Knauer, Berlin, Germany).
The organic acids were isocratically separated using a Waters Atlantis® (Milford, MA, USA) dC18 5 µm—4.6 × 250 mm column. The flow rate was 0.7 mL min−1. The injection volume was 10 µL. The column oven temperature was set at 35 °C. The detection wavelength was 210 nm. The mobile phase was a 20 mM solution of sodium phosphate monobasic NaH2PO4 (pH 2.7).
The sugars were isocratically separated using a Phenomenex® Rezex RCM—Monosaccharide Ca+2 (8%) 7.8 × 300 mm (Phenomenex, Torrance, ON, Canada). The flow rate was 0.6 mL min−1. The injection volume was 10 µL. The column oven temperature was set at 85 °C. Water for HPLC was used as a mobile phase.
Standard solutions of citric acid, malic acid, fructose, glucose, sucrose, and sorbitol were prepared in a volumetric flask by dissolving the required amount of each component in 100 mL of water for HPLC. The standard ranges of concentration were 0.1%–0.5% for citric and malic acids, 0.16%–0.8% for fructose, glucose, and sucrose, 0.6%–0.12% for sorbitol. Four standard solutions of each component were prepared, each standard solution was injected three times for the chromatographic run.
For each date and accession, ten fruits were selected and chopped, and four replicates were prepared. Using a manual fruit squeezer, the juice of each replicate was collected. Diluted juice (1:4–v:v) was filtered using a 0.22 µm Minisart® syringe filter (NY-25) (Sartorius AG, Göttingen, Germany). The replicates were kept at −20 °C until the analysis time.
The chromatographic peaks of the sample were identified by comparing the retention times of separated components in the standard chromatograms. The concentration of organic acids and sugars was calculated using the external standard method. Quantification data were obtained by integrating their peak areas with those of the calibration curve. Results were expressed as grams of compound per liter of fruit juice.

2.4. Total Phenolic Content

For each date and accession, four fruits were selected and freeze-dried without the peel. They were powdered using an analytical IKA® A11 basic mill (Ika Werke, Staufen im Breisgau, Germany). The extraction was carried out following the method described by Proteggente et al. [6]. Four replicates were prepared for each thesis.
TPH in pear extract was evaluated using Folin–Ciocalteu reagent according to the method of Slinkard and Singleton [20]. The gallic acid was used as standard. The calibration curve was calculated using standard solutions ranging from 10 to 200 mg of gallic acid per liter. A spectrophotometer GenesysTM 10 (Thermo Fisher Scientific, Waltham, MA, USA), was used as a detector. The detection wavelength was 750 nm. The results were expressed as milligrams of gallic acid per gram of dry weight.

2.5. Ascorbic Acid Content and Total Antioxidant Activity

AA was determined by the Reflectoquant® System using the RQflex® instrument (Merck Millipores, Burlington, MA, USA). The ascorbic acid content was assessed on pure juice from peeled fruits. The amount was expressed in milligram per 100 g of fresh weight.
For each date and accession, four fruits were selected and freeze-dried without the peel. They were powdered using an analytical IKA® A11 basic mill. Four replicates were prepared for each thesis. For the extraction, 500 mg of powder were combined with 20 mL of a methanol 60% solution, centrifuged at 3000× g rpm for 15 min at 0 °C. The supernatant was collected in a tube and kept at −20 °C until the analysis time.
TAA was determined according to the method of Re et al. [21], based on the oxidation of ABTS by potassium persulfate to form a radical cation ABTS●+. Trolox® (Sigma-Aldrich, St. Louis, MA, USA) was used as standard. The calibration curve was calculated on the inhibition percentage of standard solutions ranging from 1.8 to 18 µM. A spectrophotometer GenesysTM 10 (Thermo) was used as a detector. The detection wavelength was 734 nm. The results were expressed as Trolox®equivalent per gram of dry weight.

2.6. Chemicals and Reagents

D-fructose, D-glucose, sucrose, sorbitol, potassium persulfate, sodium hydroxide solution 0.1 M, and methanol were provided by Merck (Darmstadt, Germany). D-malic acid, Folin–Ciocalteu reagent, and Trolox® (6-Hydroxy-2,5,7,8-tetramethylchroman-2-carboxylic acid) were provided by Sigma-Aldrich (St. Louis, MO, USA). Citric acid and sodium phosphate monobasic were provided by Carlo Erba Reagents (Milan, Italy). Gallic acid was provided by Alfa Aesar (Karlsruhe, Germany), ABTS salt was provided by Applichem (Gatersleben, Germany). Water for HPLC was provided by BDH Middle East LLC (Dubai, UAE).

2.7. Statistical Analysis

Data are expressed as the mean ± standard deviation (SD). Differences among pear cultivars and selections were evaluated by one-way ANOVA, and the Duncan (LSD) test for mean comparisons was used. Statistical comparisons were made within each year’s study. Differences at p < 0.05 were considered significant and are indicated with different letters. All analyses were performed using the free software PAST (version 2.12, Øyvind Hammer Natural History Museum, University of Oslo, Oslo, Norway).

3. Results

3.1. Fruit Qualitative Traits

During the three-year study, ‘Falstaff’ and ‘Abbé Fétel’ fruits reached the highest average weight. In 2013, ‘Falstaff’ (297.7 ± 19.8 g) produced the largest fruits, followed by ‘Doyenne du Comice’ (279.7 ± 19.8 g) and ‘Abbé Fétel’ (278.9 ± 22.8 g), this latter one had the largest-sized fruit in 2014 (343.5 ± 71.8 g) and 2015 (316.8 ± 48.6 g). In the three-year study, the smallest fruit size was that of ‘CREA 125’ (on average 175 g). For this selection thinning is required (Table 2). The highest TSS was registered by ‘CREA 171’fruits in all the three years (respectively, 16.7 ± 0.5, 15.3 ± 0.5 and 16,5 ± 1.0 °brix), with no statistical difference from ‘Falstaff’ in 2013 (17.3 ± 0.8 °brix); in 2014 and 2015, from Falstaff (respectively 14.9 ± 0.7 and 14.5 ± 0.6 °brix) and ‘Abbé Fétel’ (15.9 ± 1.3 and 16.3 ± 1.3°brix). TSS lowest content was registered in 2013 and 2015 by ‘CREA 125’ (respectively, 13.9 ± 0.5 and 13.5 ± 0.5 °brix) and in 2014 by ‘William’s B.C.’ (12.4 ± 0.7°brix) (Table 2). Regarding the TA, in 2013 and 2014, the lowest acidity was detected in Abbé Fétel (1.2 ± 0.27 and 1.3 ± 0.2 g malic acid g−1) and ‘Falstaff’ (1.2 ± 0.27 and 1.0 ± 0.3 g malic acid g−1. ‘In 2015, ‘William’s B.C’ and ‘CRE 179’ registered the lowest TA (respectively 0.9 ± 0.2 and 1.1 g ± 0.2 malic acid g−1), while ‘Falstaff’ fruits the highest (2.2 ± 0.2 g malic acid g−1), with no statistical difference from ‘Abbé Fétel’ and ‘Doyenne du Comice’ fruits (1.9 g ± 0.2 g and 2.2 ± 0.3 malic acid g−1). Instead, in 2013 and 2014, the highest TA was detected in ‘William’s B.C’ fruits (3.0 ± 0.27 and 2.6 ± 0.6 g malic acid g−1) (Table 1). The highest pH in the three years was detected in ‘Falstaff’ fruits (on average 5), and the lowest one in ‘William’s B.C’ fruits in the first two years (on average 4.24) and in ‘CREA171’ in 2015 (4.1) (Table 2).

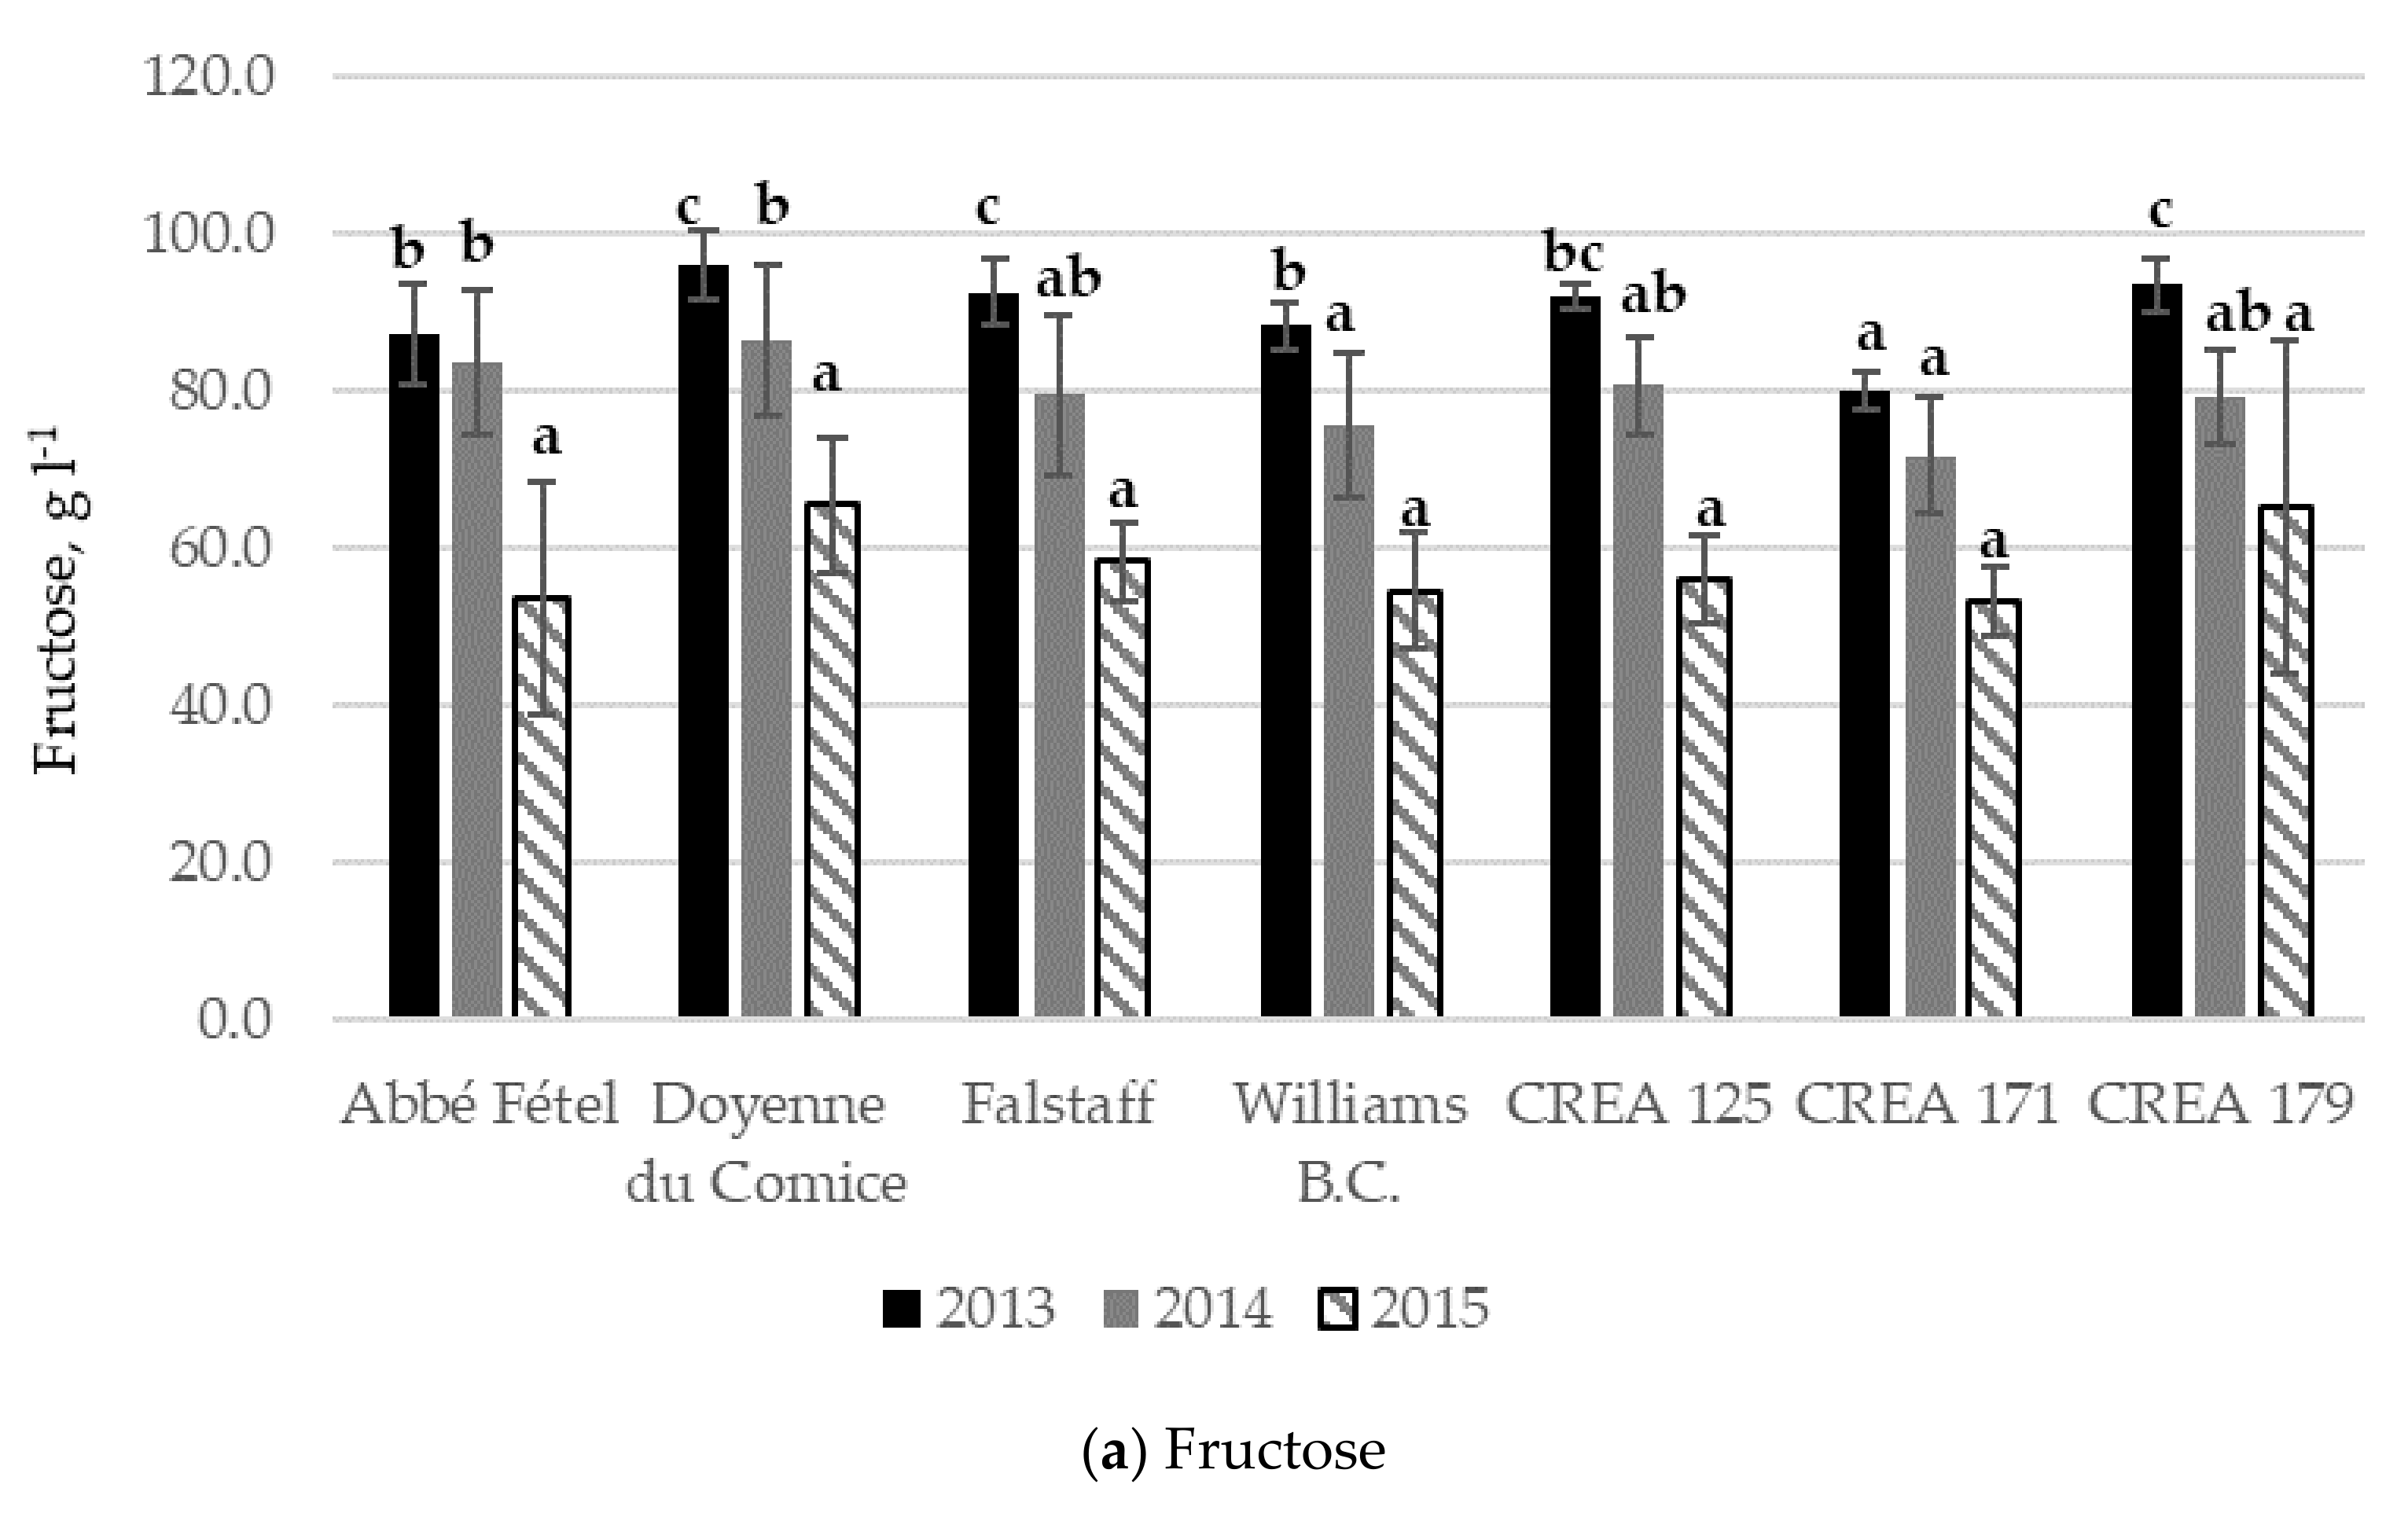
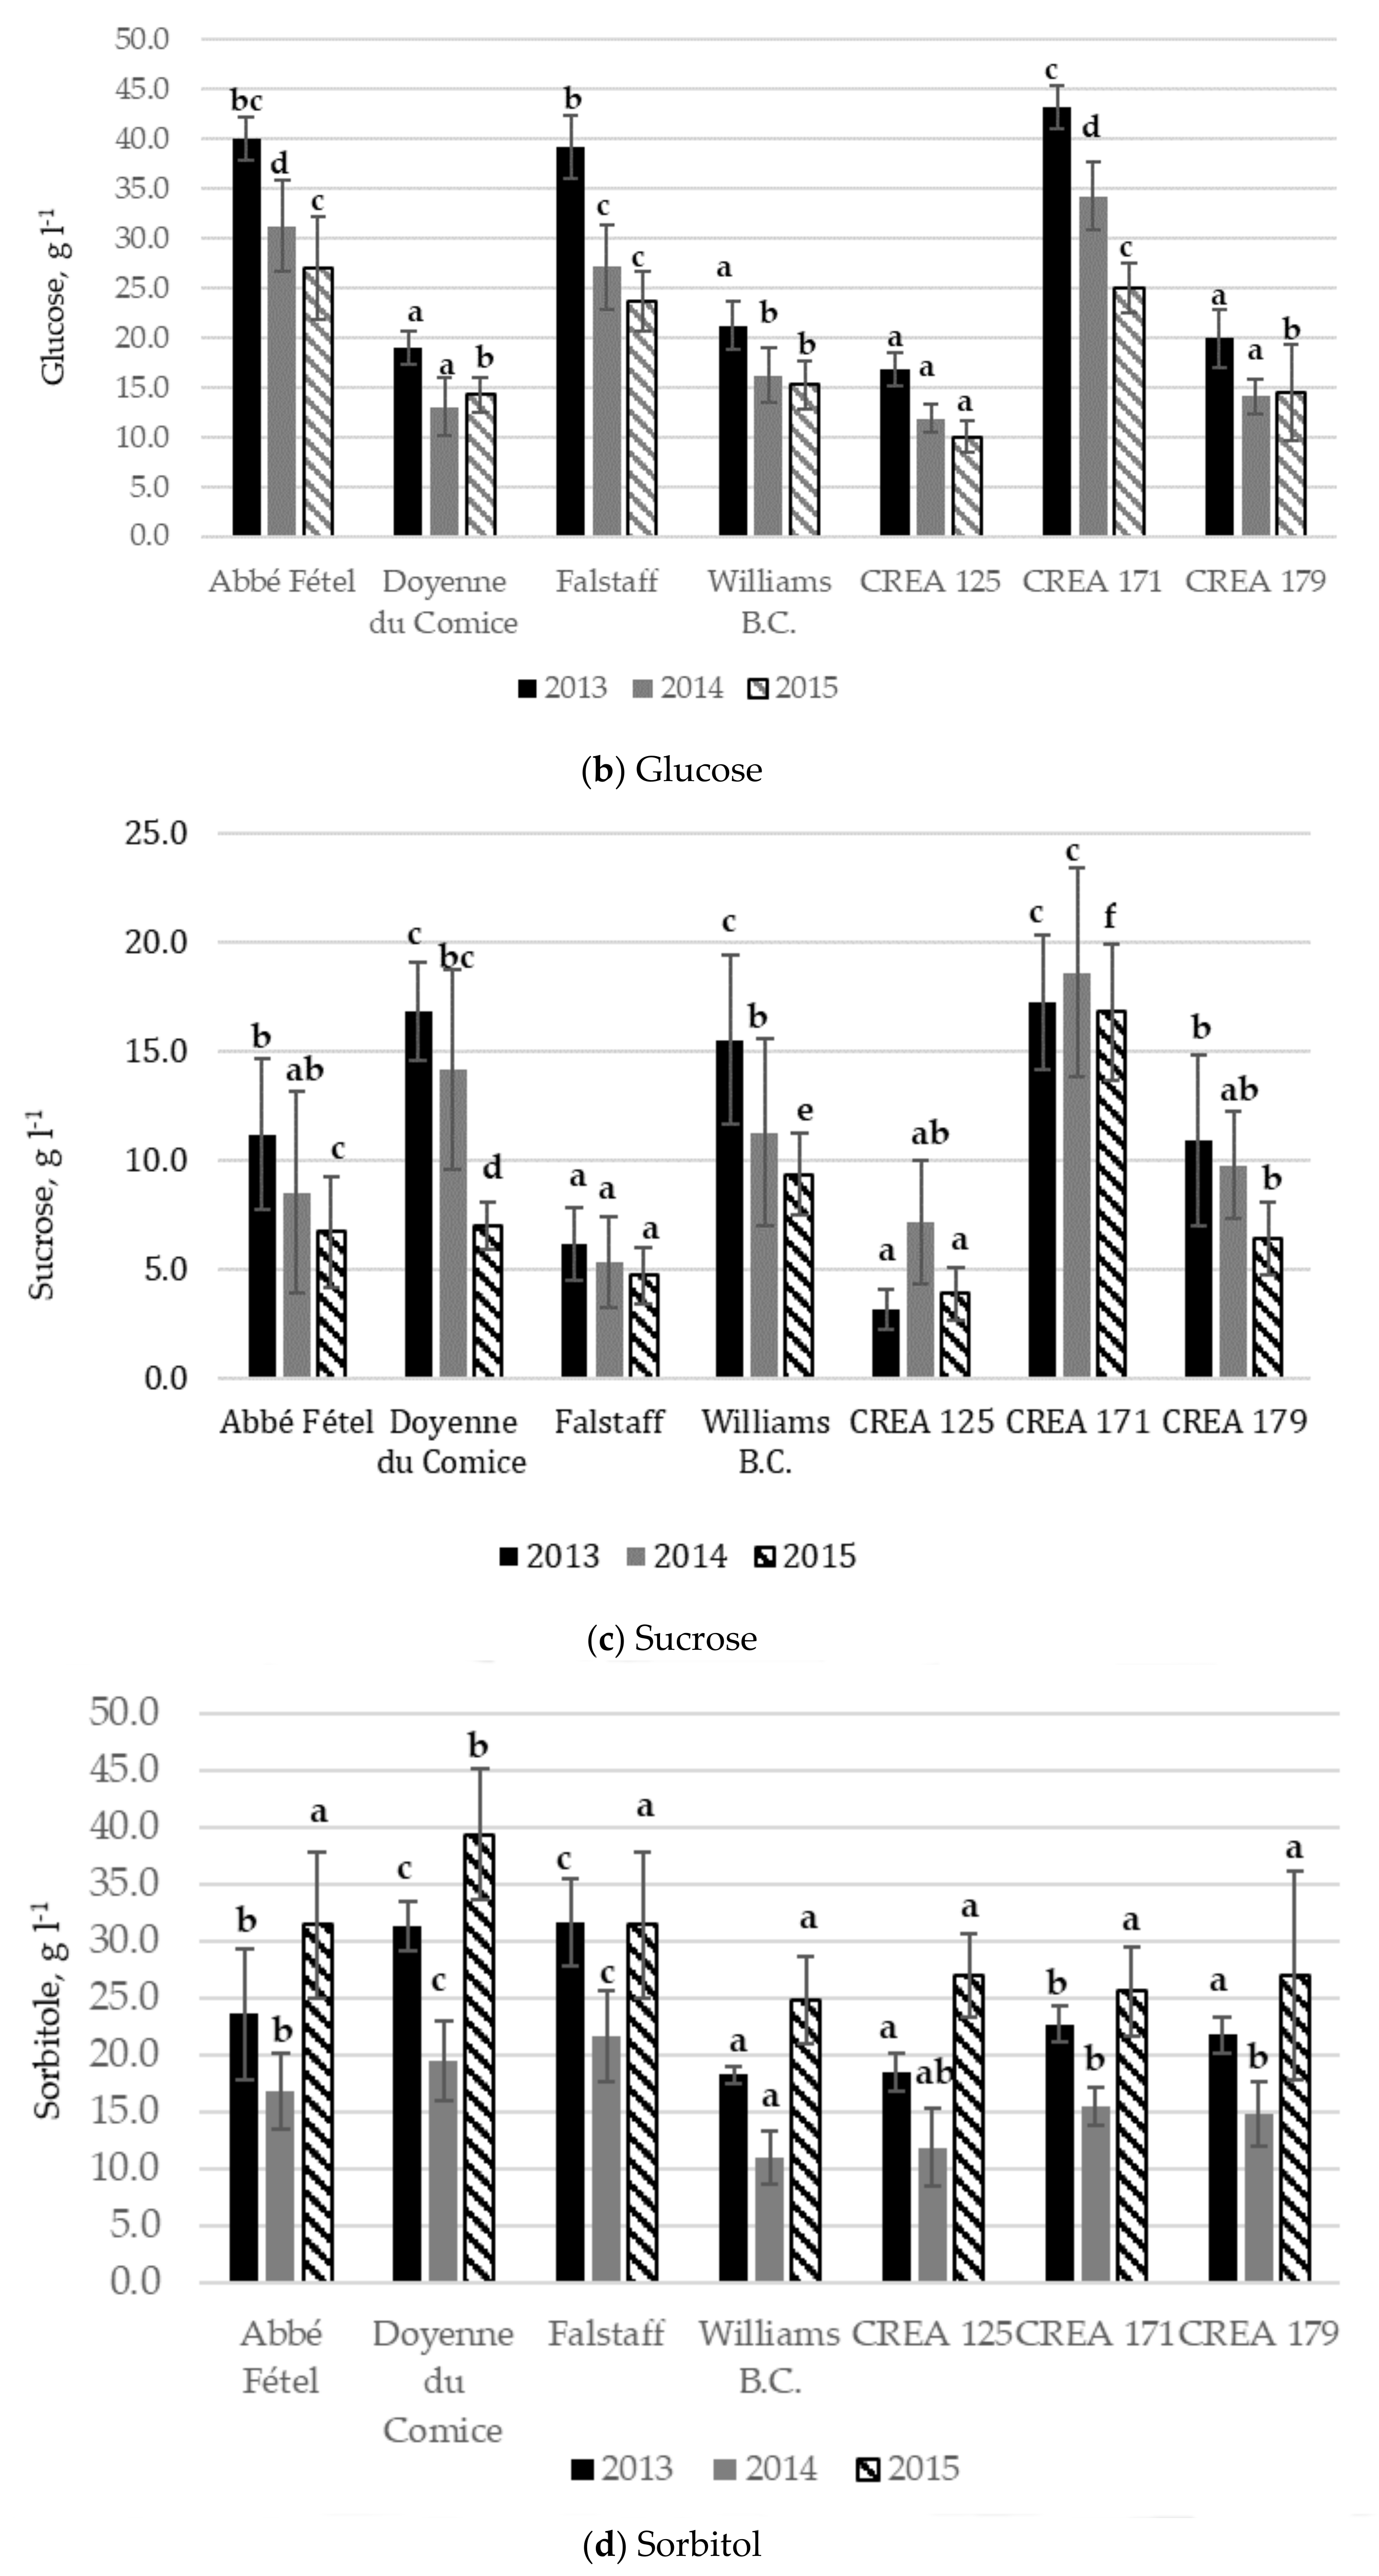
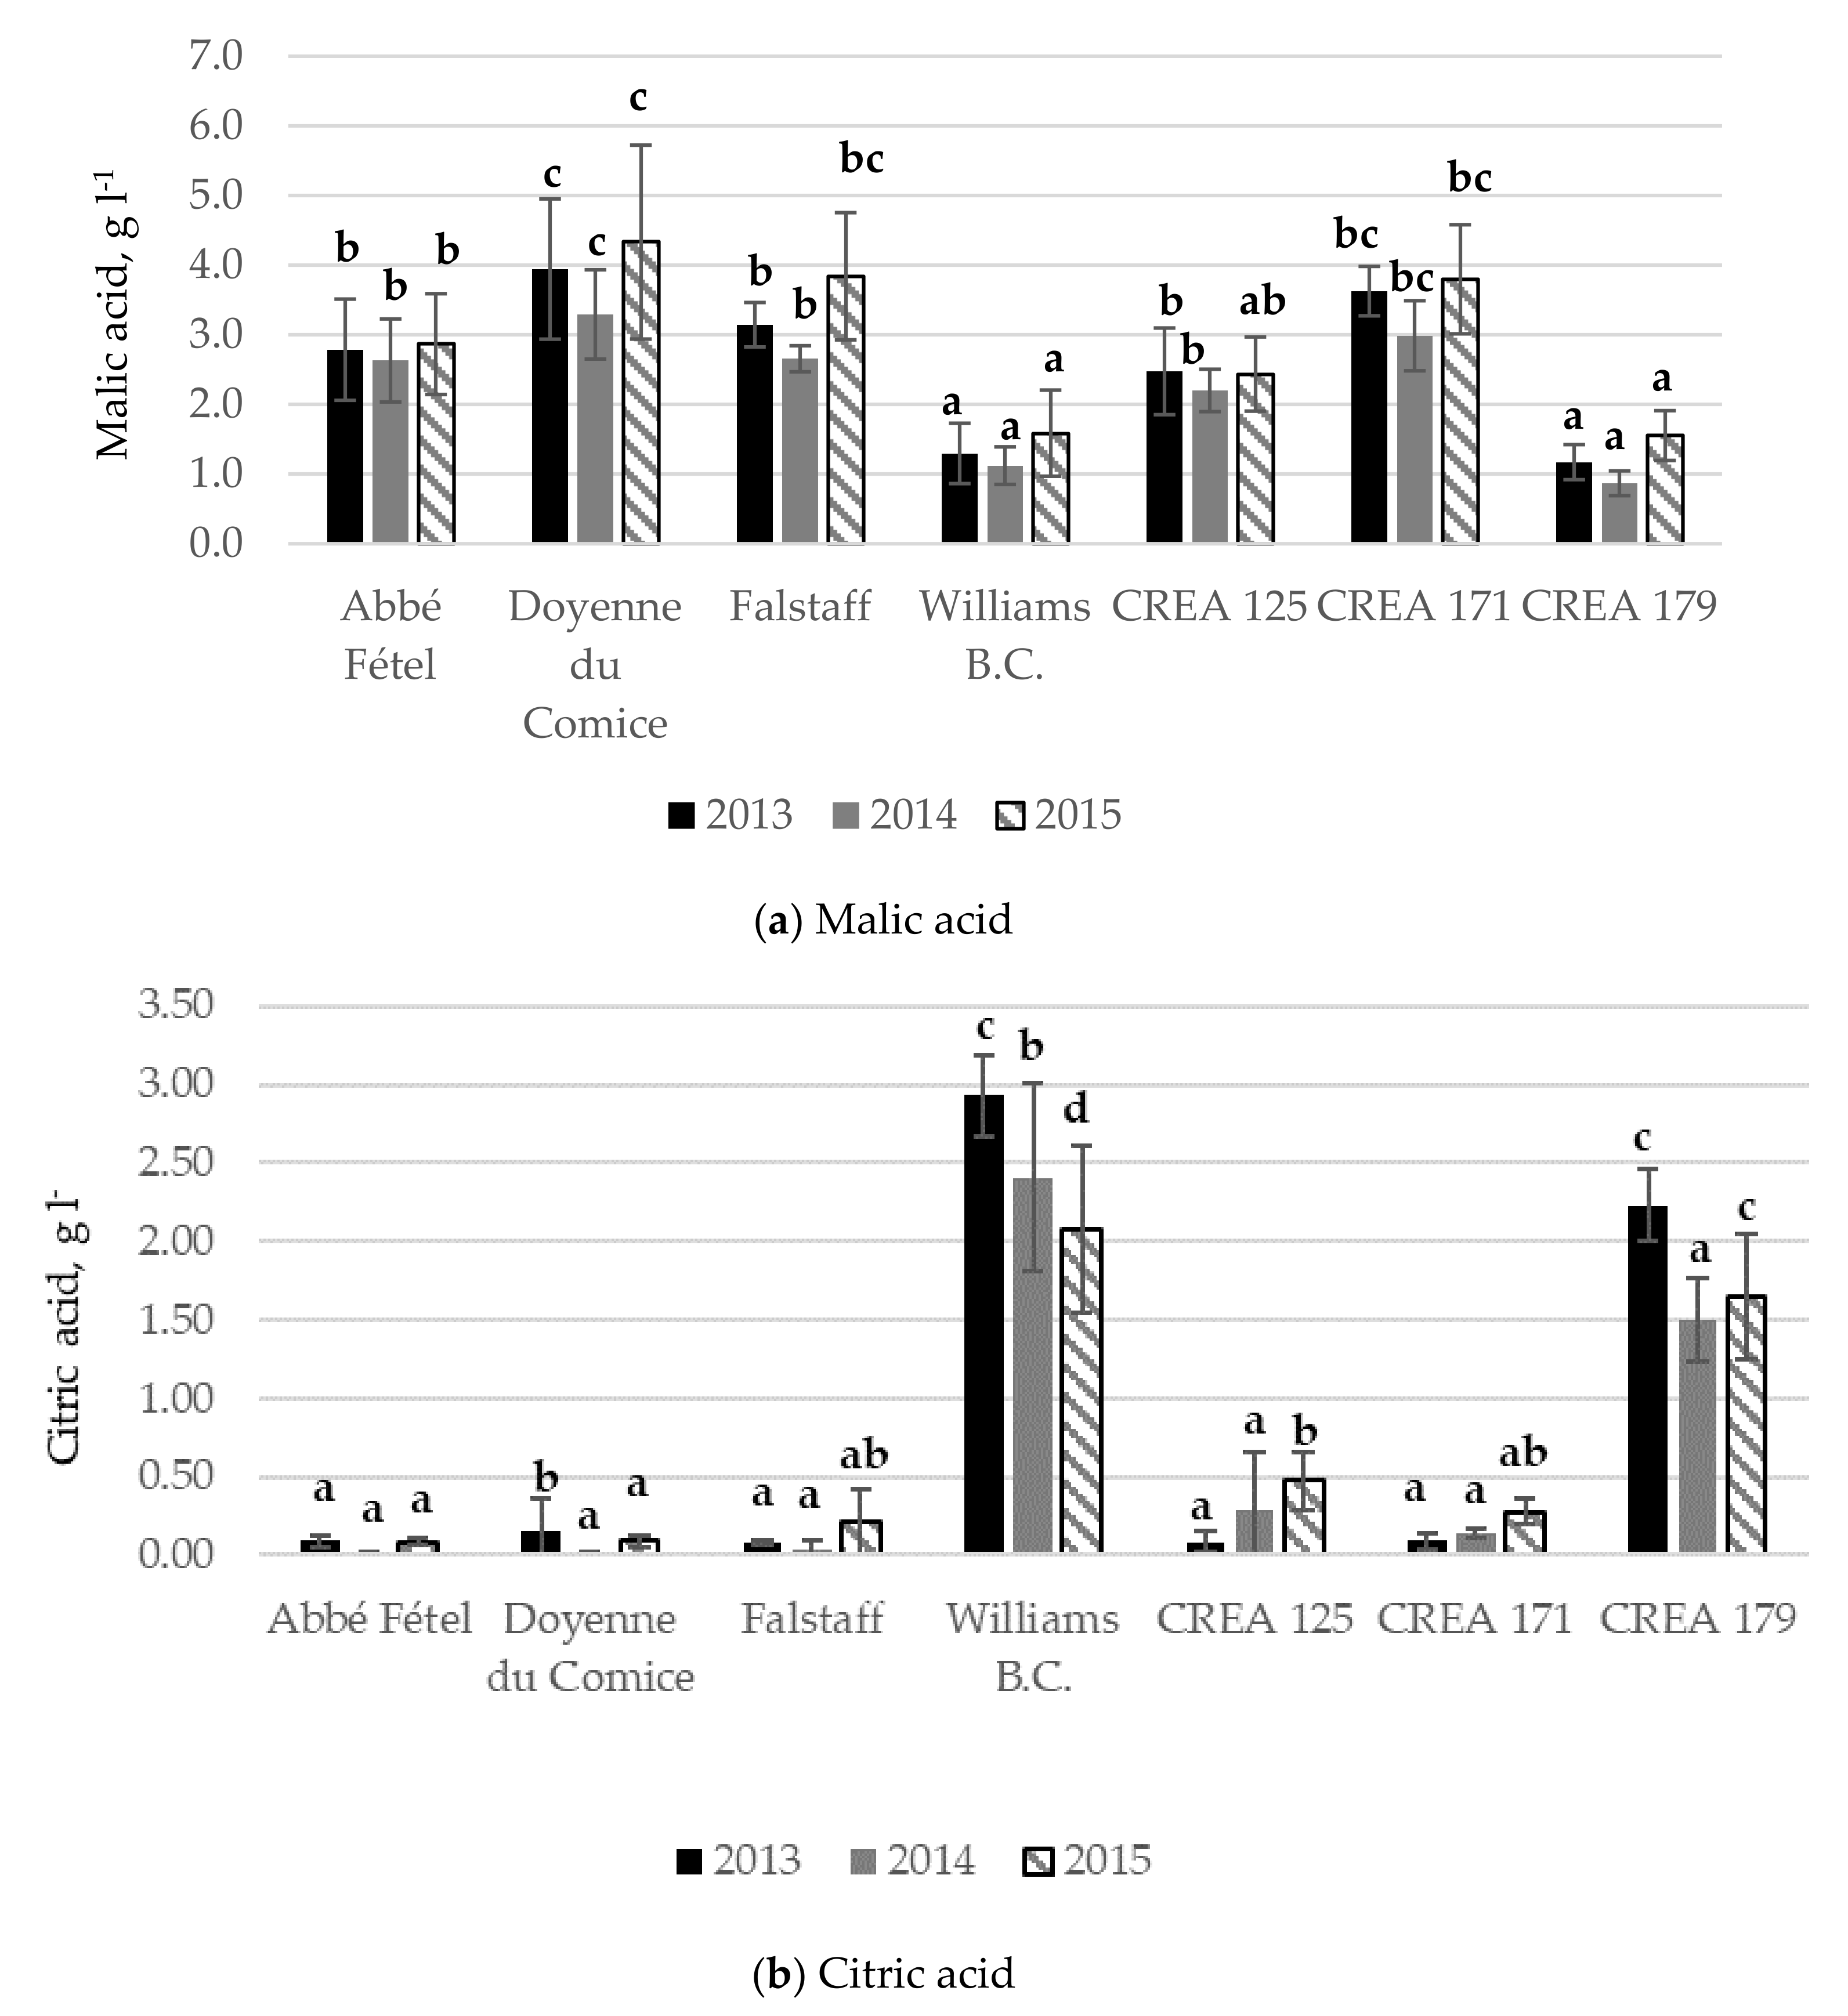
3.2. Sugar and Organic Acid Content

The amount of the different sugars differs in each cultivar and selection. In pears, the most significant sugar is fructose, followed by glucose, sorbitole, and sucrose [22,23]. The sugar content was the highest in 2015 for all evaluated varieties and selections, followed by 2014, except for sorbitole resulting from being the highest in 2015. (Figure 2). Fructose content was higher in 2013 and lower in 2015, and this also influenced the di-saccharide content. The amount of fructose varied from 53.3 g L−1 of ‘CREA 171’ in 2015 to 96.1 g L−1 of ‘Doyenne du Comice’ in 2013. During the three-year study, the variety with the highest content in fructose was ‘Doyenne du Comice’ (respectively 96.1 ± 4.5, 86.5 ± 9.5 and 65.6 ± 8.5 g L−1); ‘CREA 171’ showed instead the lowest content (respectively, 80.2 ± 2.4, 71.7 ± 7.4; 53.3 ± 4.3 g L−1) (Figure 2a). Glucose content varies from 10.0 ± 1,6 g of ‘CREA 125′ in 2015 to 43.1 ± 2.2 g L−1 of ‘CREA 171’in 2013 (Figure 2b). In 2013, Falstaff registered the highest content (39.2 ± 3.1 g L−1); in 2014 ‘CREA 171’ and ‘Abbè Fétel’ (34.2 ± 3.4 and 31.2 ± 4.6 g L−1) and in 2015 ‘Abbé Fétel’, ‘CREA 171’ and ‘Falstaff’ (27.5 ± 5.2, 25 ± 2.5 and 23.7 ± 3 g L−1). In all the study years, ‘Doyenne du Comice’ registered the lowest glucose content. Sucrose content varies from 3.8 ± 1.2 g of CREA 125 in 2015 to 18.6 ± 4.8 of ‘CREA 171’ in 2014 (Figure 2c). In 2013 the highest content of sucrose was observed in ‘CREA 171‘, without significative differences from ‘Doyenne du Comice ‘and ‘William’s B.C’ and ‘CREA 171’ (respectively, 17.3 ± 3.1, 16.8 ± 2.2 and 15.5 ± 3.9 g L−1). In 2014 and 2015 stood out ‘CREA 171’ (18.6 ± 4.8 and 16.8 ± 3.1 g L−1). In ‘CREA 125’ and ‘Falstaff’, during the three years, were registered the lowest sucrose values. Sorbitole content varies from 11.0 g L−1 of ‘Williams B.C’ in 2014 to 39.4 g L−1 of ‘Doyenne du Comice’ in 2015. In 2013 and 2014, the highest content of sorbitol was registered in ‘Doyenne du Comice’ (31.3 ± 2.2 and 19.5 ± 3.5 g L−1) and ‘Falstaff’ (31.7 ± 3.8 and 21.7 ± 4 g L−1). In 2015, the highest content in sorbitole was registered in ‘Doyenne du Comice’ fruits (39.4 ± 5.8 g L−1) and the lowest one in William’s B.C. in 2014 (11.0 ± 2.3) (Figure 2d). The lowest content of sorbitole was shown in 2013 and 2014, in ‘Williams B.C.’ and ‘CREA 125’ fruits (on average 18.4 g L−1 in 2013 and 11.5 g L−1 in 2014); in 2015, in ‘William’s B.C.’ fruits 24.8 g L−1 but without significant differences from all other cultivars and selections except ‘Doyenne du Comice’.
In pear, the dominant organic acid is malic acid, followed by citric. ‘Doyenne du Comice’ and ‘CREA 171’ had the highest content of malic acid in the three years of study, while ‘CREA 179’ and ‘William B.C.’ fruits had the lowest one (Figure 3a). In 2013 malic acid content varied from 4 g L−1 in ‘Doyenne du Comice’ to 1.1 g L−1 in ‘CREA 179’; in 2014, it varied from 3.3 g L−1 in ‘Doyenne du Comice’ to 0.8 in ‘CREA 179’ g L−1, while in 2015, from 3.9 g L−1 in ‘Doyenne du Comice’ to 1.5 g L−1 in ‘CREA 179’ and ‘William’s B.C’(Figure 3a). Citric acid was detected in low quantity in all the selections and cultivar except for ‘William’s B.C.’ and ‘CREA 179’ where the content was on average 2.5 gl−1 in 2013, 2 g L−1 in 2014, and 1.9 g L−1 in 2015 (Figure 3b).

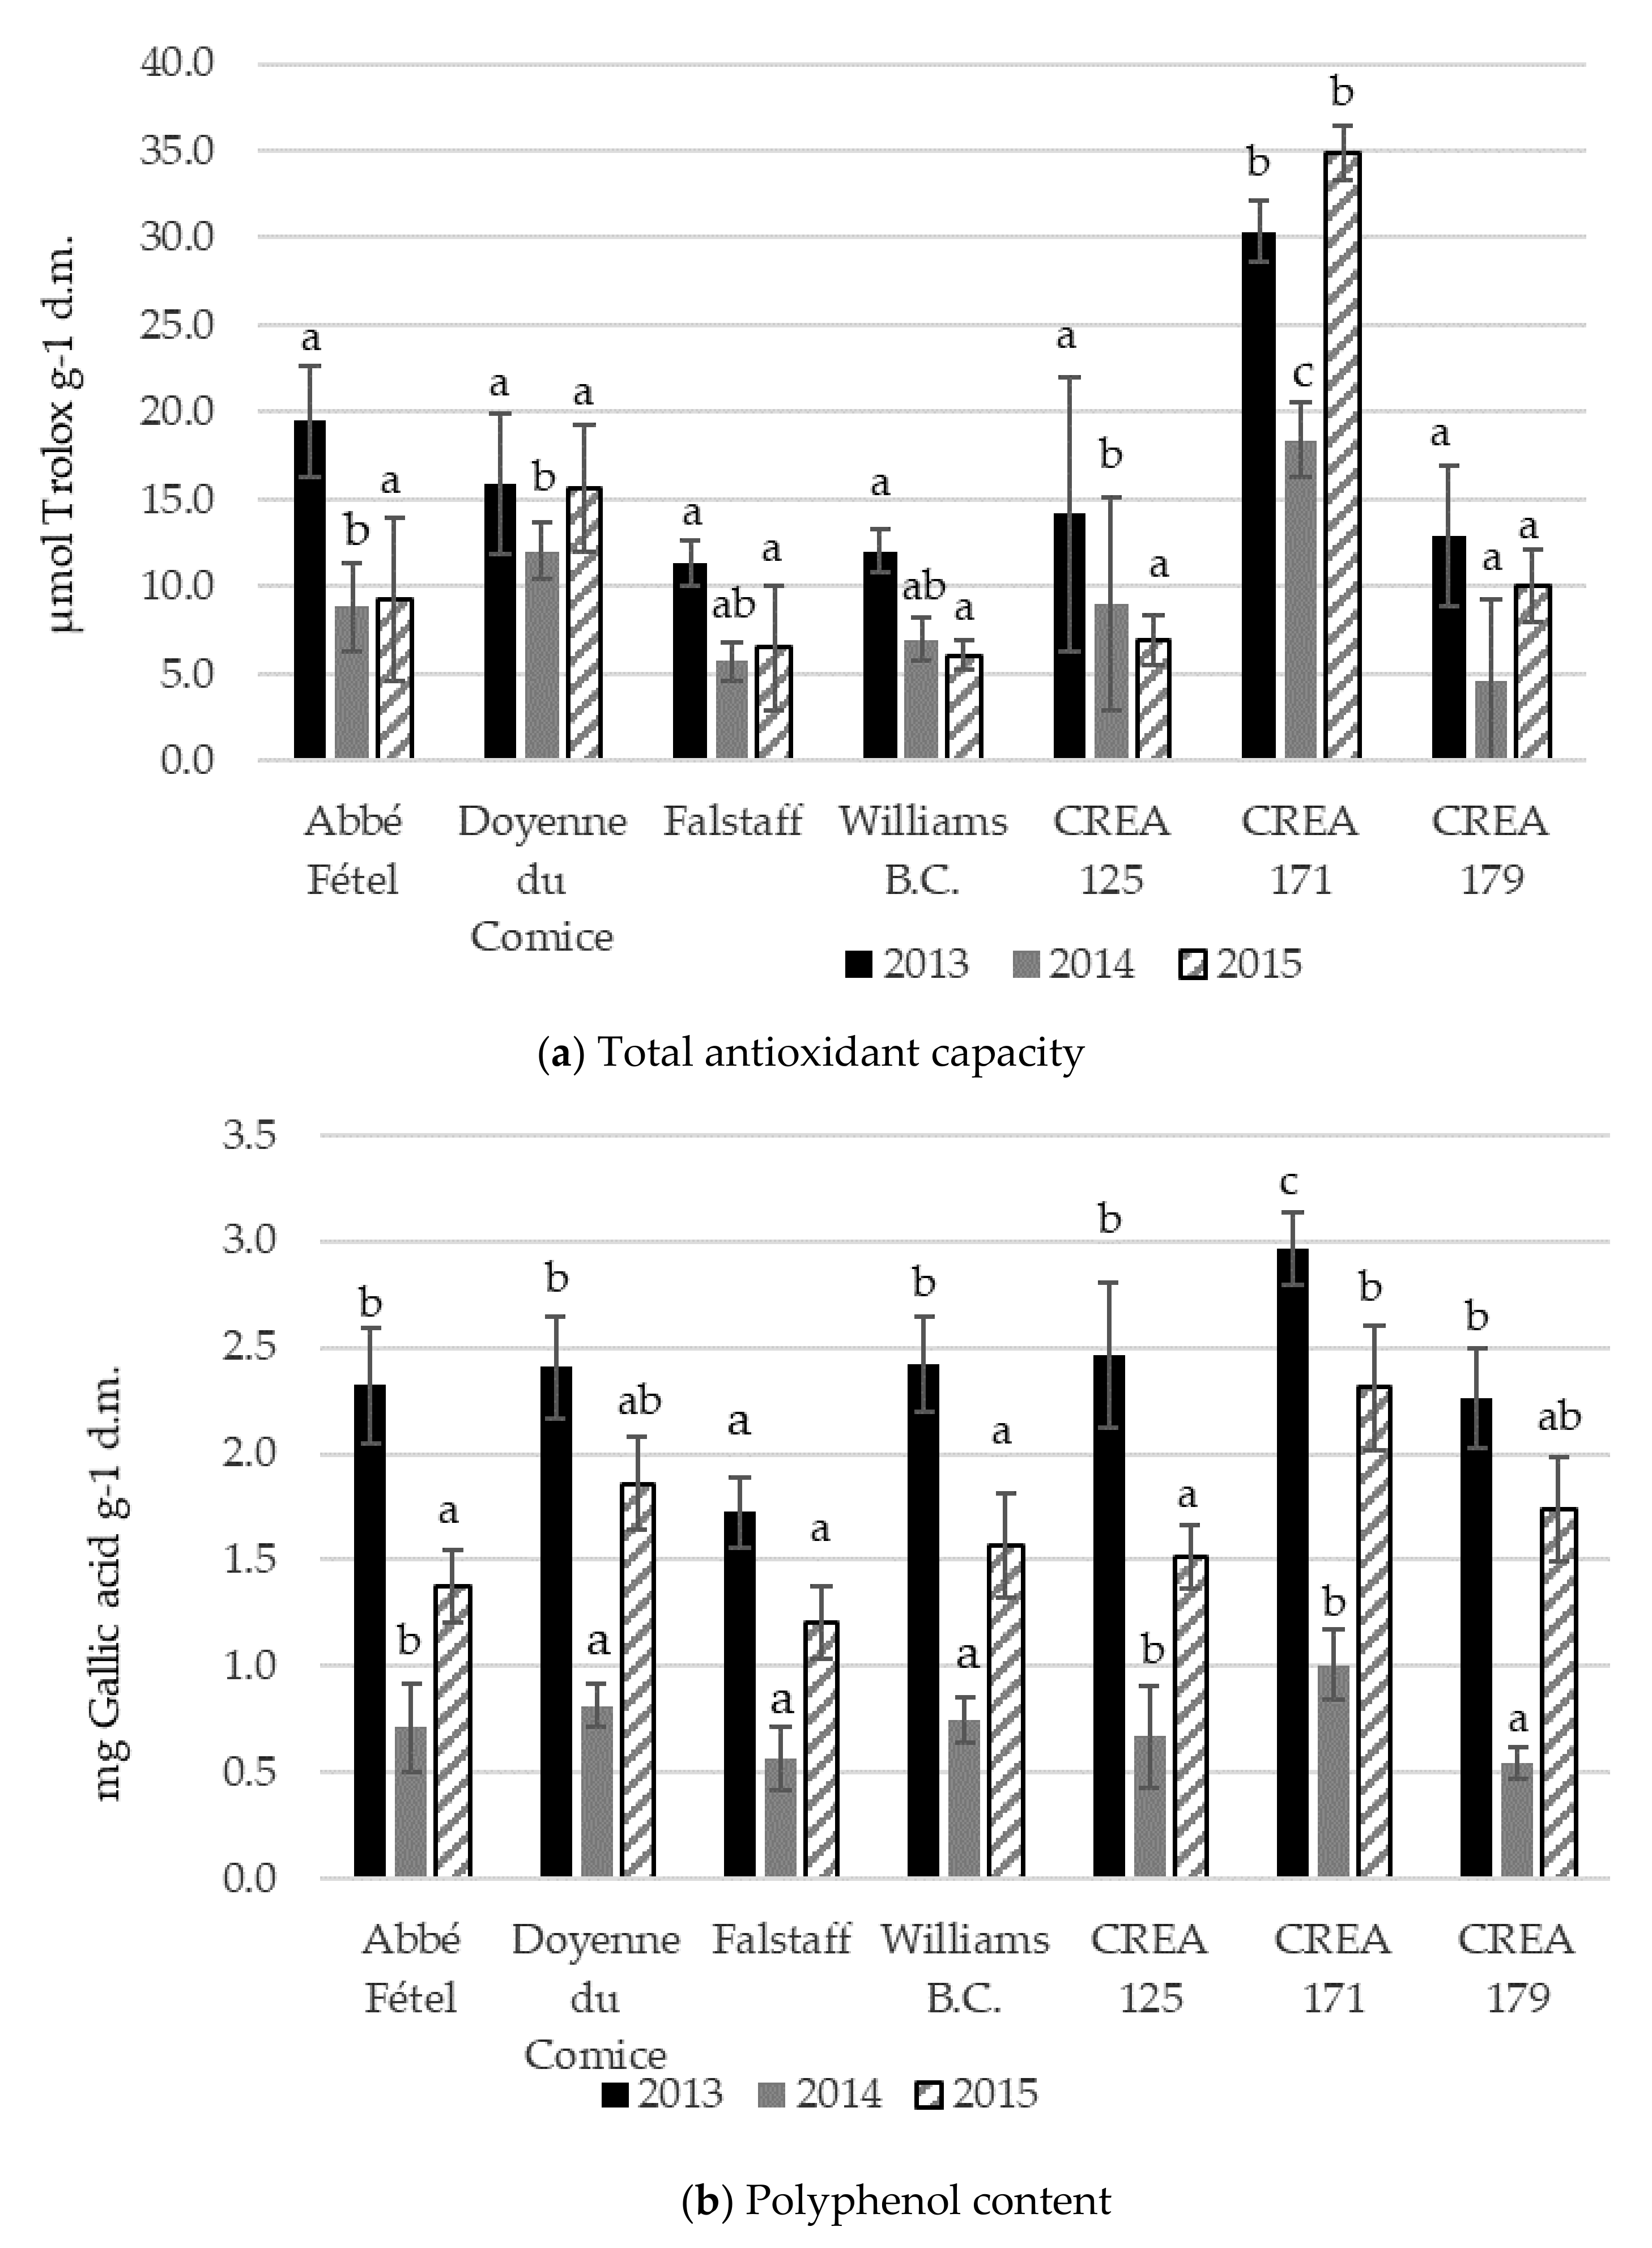
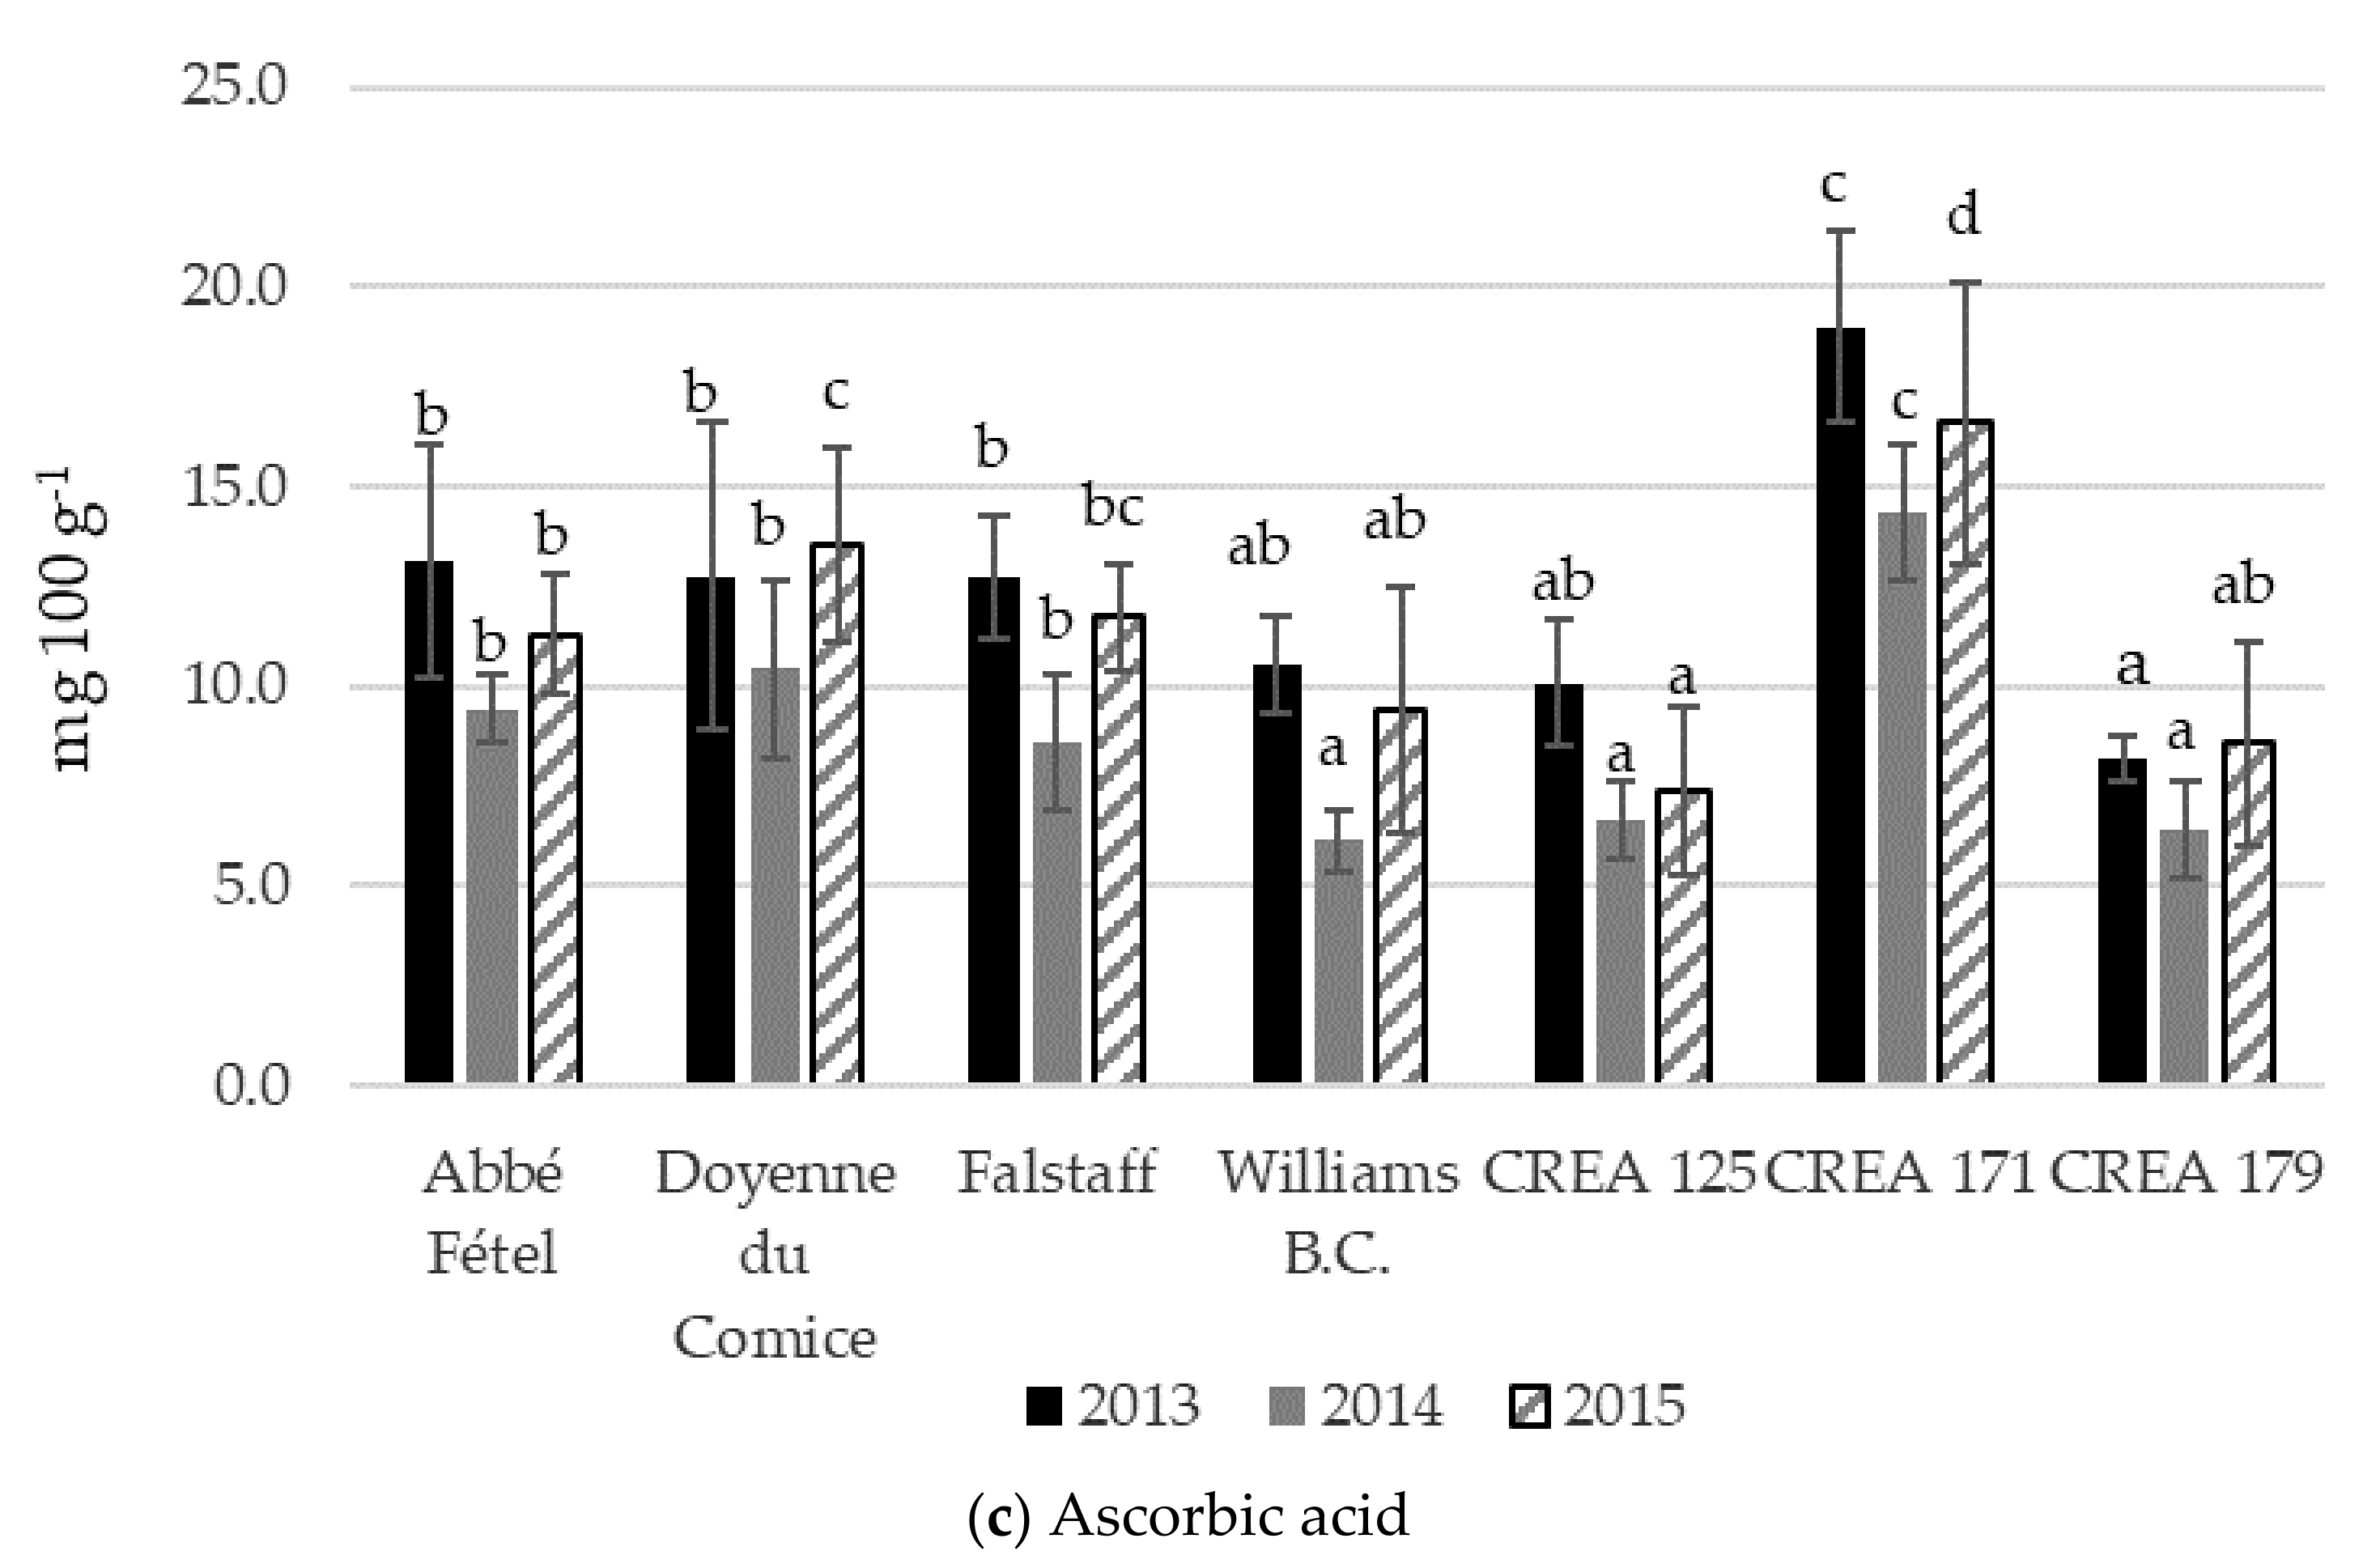
3.3. Total Antioxidant Capacity, Total Polyphenols, and Ascorbic Acid

The antioxidant activity of pears selections and cultivars was determined by ABTS assays. During the three-year study, ‘CREA 171’ registered the highest TAA, respectively 30, 17, and 35 µmolTROLOX g−1 (Figure 4a). The flesh extracts showed large differences in antioxidant capacity, with ‘CREA 179’ having the lowest antioxidant capacity among the studied cultivars (Figure 4a). TPH content in 2013 was very high in ‘CREA 171’, 2.95 mg gallic acid g−1 d. m. (Figure 4b). In 2014, the highest TPH content was registered in ‘CREA 171’ (1 mg gallic acid g−1) and in ‘CREA 125’ and ‘Abbé Fétel’; in 2015 in ‘CREA 171’ (2.3 mg gallic acid g−1), ‘CREA 179’ (1.7 mg gallic acid g−1) and ‘Doyenne du Comice’ (1.85 mg gallic acid g−1) (Figure 4b). The AA content in the flesh was variable among the varieties and selections, and the highest content was detected in ‘CREA 171’ fruits in the three-year study (18, 14, and 16.5 mg 100 g−1). ‘CREA 179’ resulted in having the lowest content in AA, regardless of the year. AA content in the studied pear cultivars ranged between 4.1 and 22.7 mg per 100 g (Figure 4c). Among various fruits and vegetables, pears were classified in the group with low antioxidant capacity by Prior and Cao [24].

4. Discussion

In this study, the chemical properties, bio-compounds, and antioxidant capacity of new pears were evaluated after cold storage. Sugars and organic acids played an important role in the sensorial quality and fruit nutritional value. The concentration of organic acids and sugars is one of the factors influencing fruit quality.
Among organic sugars, fructose and glucose were the main monosaccharides in pear fruit. The results of the present study showed that fructose was the main sugar in all the studied varieties and selections, and its levels were higher than glucose ones in all pear fruits in trial, confirming the study of Chen et al. [23]. The varieties ‘Falstaff’ and ‘Doyenne du Comice’ and the selection ‘CREA 179’ revealed the highest content of this sugar. ‘CREA 171’ showed the highest content of glucose and sucrose during all the three-year studies.
In pear fruits, besides fructose and glucose, there is also a large amount of sorbitol. Sorbitol is the main product of photosynthesis, it represents 60%–80% of all carbohydrates being transported from leaves to other parts of the plant, and it is also a translocation substance, as it can be converted into fructose in tissues [25]. ‘Doyenne du Comice’ was the variety that showed the highest content of this organic acid, followed by ‘Falstaff’ and ‘Abbé Fétel’ while pear selections revealed the lowest contents.
About organic acid, malic and citric acid are predominant in pear pulp [23,26], especially malic acid. ‘CREA 171’ and ‘Doyenne du Comice’ had the highest concentration of malic acid during the three-year study; Citric acid, present in a small concentration in pear, is mostly present in ‘CREA 179’ and ‘William’s B.C.’. These results agree with other data reported in the literature [22,23,26].
Pears are a source of phytochemicals, especially phenolics and ascorbic acid. Galvis Sanchez et al. [9] evaluated total phenolics in peel and flesh: phenolics in the flesh were represented by hydroxycinnamics, and only chlorogenic acid was present in enough amounts to be quantified. Results of Kolniak-Ostek et al. [27] suggest that antioxidant capacity was related to the presence of phenolic compounds. The value of the DPPH test was mostly influenced by the catechin and procyanidin polymers, while quercetin, apigenin derivatives, and arbutin had smaller impacts.
Comparing the antioxidant capacities, the cultivars studied showed similar values, except ‘CREA 171’, which had the highest antioxidant capacity. Larger antioxidant activities have been reported in pigmented fruits such as prunes, berries, pomegranates, and plums [28]. In these fruits, the antioxidant capacity is mainly correlated with the presence of anthocyanins and other phenolics. These data confirmed the previous underling that the total antioxidant activity of pears is closely related to the cultivar [29,30]. The contribution of phenolic compounds to the antioxidant capacity in pears was much higher than that of vitamin C.
The higher content in this bioactive compound could be related to the browning susceptibility of some cultivars and the ability to avoid browning during postharvest handling and storage. Previous studies carried out by Veltman et al. [31] showed lower AA contents than those found in this paper and suggested that browning starts in a cultivar when a certain AA level threshold is passed. They explained that the threshold value depends on the cultivar, picking date, and growing area. AA content varied from 5 to 18 mg 100 g-1, and ‘CREA 171’ stood out for its highest content in the three years of study.
Total phenolic content and antioxidant capacity in pulp are lower than the other anatomic plant part, as reported by the authors of [32]. Phenolic compounds are very important for our body’s resistance to biological and mechanical stress. Furthermore, they have great relevance for pharmacological characteristics and for the presence of factors that provide the quality to the fruit, such as color, flavor, acidity, and sourness [33].
Value of polyphenols content varied from 3 to 0.5 mg gallic acid g−1 D.M. and are in line with data of Macheix et al. [33], Saltaa et al. [34] and Li et al. [35]; the highest content was shown in ‘CREA 171’ fruits.

5. Conclusions

The main objectives of the CREA pear breeding program are producing high-quality fruit with long shelf-life; extending the harvest calendar in early and late harvest time; obtaining new cultivars being resistant and/or tolerant to diseases; producing fruits with high nutraceutical and suitable aesthetic characteristics, such as red skin and flesh; interspecific hybrids.
Fruit quality is one of the main objectives of this breeding program. Consumers’ choice is increasingly focused on the nutritional and nutraceutical quality of fruit and vegetables. In the three-year study, the new genotypes are very interesting for red peel and for well-balanced sugar and organic acid content. ‘CREA 171’ registered the highest content in glucose, sucrose, and malic acid. This selection stood up also for the highest TAC, AA, and TPH content. ‘CREA 179’ registered a high content in fructose and citric acid. The TAC was medium, while the TPH content was high. ‘CREA 125’ showed a high content in fructose and in malic acid. The TAC and the TPH were high.
In the aim of a more sustainable fruit growing, future studies will be focused on identifying resistance or tolerance of these new selections to pathogens and insects (such as fire blight, brown spot, and Cacopsylla pyri).

Author Contributions

Conceptualization, G.C. and G.B.; methodology, M.L.M., G.C., S.S., and G.B.; validation, G.C. and S.S.; formal analysis, M.L.M. and G.C.; investigation, G.C. and G.B.; resources, G.C.; M.L.M., and G.B.; data curation, G.C., S.S., and M.L.M.; visualization, G.C. and G.F.; writing—original draft preparation, G.C. and G.F.; writing—review and editing, G.C., M.L.M., G.F., S.S., and G.B.; funding acquisition, G.C. and G.B. All authors have read and agreed to the published version of the manuscript.

Funding

Pear and apple breeding activity by CREA and New Plant Consortium.

Acknowledgments

The authors wish to thank the “New Plant Consortium” for co-founding the above-mentioned project.

Conflicts of Interest

The authors declare no conflict of interest.

References

  1. Food and Agriculture Organization of the United Nations. FAOSTAT Statistical Database; FAO: Rome, Italy, 2020. [Google Scholar]
  2. Centro Servizi Ortofrutticoli. Italia Consuntivo 2018 Pere; CSO Italy: Ferrara, Italy, 2019. [Google Scholar]
  3. Faedi, W.; Castagnoli, M.; Baruzzi, G.; Sirri, S. La creazione di nuove varietà presso il CRA-Frf di Forlì. Frutticoltura 2012, 10, 18–24. [Google Scholar]
  4. Brewer, L.; Volz, R. Genetics and Breeding of Pear. In The Pear Genome. Compendium of Plant Genomes; Korban, S., Ed.; Springer: Cham, Switzerland, 2019; Volume 4, pp. 63–101. [Google Scholar] [CrossRef]
  5. EccherZerbini, P. The quality of pear fruit. Acta Hortic. 2002, 596, 805–810. [Google Scholar] [CrossRef]
  6. Proteggente, A.; Pannala, A.; Paganga, G.; Van Buren, L.; Wagner, E.; Wiseman, S.; Van De Put, F.; Dacombe, C.; Rice-Evans, C. The antioxidant activity of regularly consumed fruit and vegetables reflects their phenolic and vitamin C composition. Free Radic. Res. 2002, 36, 217–233. [Google Scholar] [CrossRef] [PubMed]
  7. Ignat, I.; Volf, I.; Popa, V.I. Critical review of methods for characterization of polyphenolic compounds in fruits and vegetables. Food Chemistry 2011, 126, 1821–1835. [Google Scholar] [CrossRef]
  8. Jaramillo, S.; Lopez, S.; Varela, L.M.; Rodriguez-Arcos, R.; Jimenez, A.; Abia, R.; Guillen, R.; Muriana, F.J.G. The flavonol isorhamnetin exhibits cytotoxic effects on human colon cancer cells. J. Agr. Food Chem. 2010, 58, 10869–10875. [Google Scholar] [CrossRef]
  9. Galvis Sànchez, A.C.; Gil-Izquierdo, A.; Gil, M.I. Comparative study of six pear cultivars in terms of their phenolic and vitamin C contents and antioxidant capacity. J. Sci. Food Agric. 2003, 83, 995–1003. [Google Scholar] [CrossRef]
  10. Caracciolo, G.; Sirri, S.; Baruzzi, G. Update on CREA Centro di Ricerca Olivicoltura, Frutticoltura e Agrumicoltura pear breeding program. Acta Hortic. 2021, 1303, 29–36. [Google Scholar] [CrossRef]
  11. Elgar, H.J.; Watkins, C.B.; Murray, S.H.; Gunson, F.A. “Quality of Buerre Bosc” and “Doyenne du Comice” pears in relation to harvest date and storage period. Postharvast Biol. Technol. 1997, 10, 29–37. [Google Scholar] [CrossRef]
  12. Sugar, D.; Richardson, D.G.; Chen, P.M.; Spotts, R.A.; Roberts, R.G.; Chand-Goya, T. Advances in improving the postharvest quality of pears. Acta Hortic. 1998, 475, 513–526. [Google Scholar] [CrossRef]
  13. Streif, J. Ripening management and postharvest fruit quality. Acta Hortic. 2010, 858, 121–129. [Google Scholar] [CrossRef]
  14. Saquet, A.A. Storage of pears. Sci. Hortic 2019, 246, 1009–1016. [Google Scholar] [CrossRef]
  15. Kupferman, E. Observations on harvest maturity and storage of apples and pears. Postharvest Inf. Netw. 2002, 1–7. [Google Scholar]
  16. Kupferman, E.; Spotts, R.; Sugar, D. Practices to reduce postharvest pear diseases. Postharvest Pomol. Newsl. 1985, 3, 11. [Google Scholar]
  17. Willett, M.; Kupferman, G.; Roberts, R.; Spotts, R.; Sugar, D.; Apel, G.; Ewart, H.W.; Bryant, B. Integrated management of postharvest diseases and disorders of apples, pears and cherries. Postharvest Pomol. Newsl. 1989, 7, 5–7. [Google Scholar]
  18. De Belie, N.; Hallett, I.C.; Harker, F.R.; De Baerdemaeker, J. Influence of Ripening and Turgor on the Tensile Properties of Pears: A Microscopic Study of Cellular and Tissue Changes. J. Am. Soc. Hortic. Sci. 2000, 125, 350–356. [Google Scholar] [CrossRef] [Green Version]
  19. Pallotti, G.; Baruzzi, G.; Caracciolo, G.; Sirri, S. Nuovo interesse per le pere rosse, prime osservazioni sui cloni del Crea. Frutticoltura 2016, 10, 12–17. [Google Scholar]
  20. Slinkard, K.; Singleton, V.L. Total phenol analysis: Automation and comparison with manual method. Am. J. Enol. Vitic. 1977, 28, 49–55. [Google Scholar]
  21. Re, R.; Pellegrini, N.; Proteggente, A.; Pannala, A.; Yang, M.; Rice-Evans, C. Antioxidant activity applying an improved ABTS radical cation decolorization assay. Free Radic. Biol. Med. 1999, 26, 1231–1237. [Google Scholar] [CrossRef]
  22. Arzani, K.; Khoshghalb, H.; Malakouti, M.J.; Barzegar, M. Postaharvest Fruit Physicochemical changes and properties of Asia (Pyrus serotina Rehd.) and European (Pyrus communis L.) pear cultivars. Hort. Environ. Biotechnol. 2008, 49, 244–252. [Google Scholar]
  23. Chen, J.; Wang, Z.; Wu, J.; Wang, Q.; Hu, X. Chemical compositional characterization of eight pear cultivars grown in China. Food Chem. 2007, 104, 268–275. [Google Scholar] [CrossRef]
  24. Prior, R.L.; Cao, G. Analysis of Botanicals and Dietary Supplements for Antioxidant Capacity: A Review. J. AOAC Int. 2000, 83, 950–956. [Google Scholar] [CrossRef] [Green Version]
  25. Kolniak-Ostek, J. Chemical composition, and antioxidant capacity of different anatomical parts of pear (Pyrus communis). Food Chem. 2016, 203, 491–497. [Google Scholar] [CrossRef] [PubMed]
  26. Hudina, M.; Stampa, F. Effect of Fruit Bagging on Quality of ‘Conference’ Pear (Pyrus communis L.). Europ. J. Hort. Sci. 2011, 76, 176–181. [Google Scholar]
  27. Kolniak-Ostek, J.; Kłopotowska, D.; Rutkowski, K.P.; Skorupinska, A. Bioactive Compounds and Health-Promoting Properties of Pear (Pyrus communis L.). Molecules 2020, 25, 4444. [Google Scholar] [CrossRef]
  28. Premi, M.; Khan, K.A. Nutritional Values of Fruits and Vegetables: Macronutrients, Micronutrients, and Composition. In Technological Interventions in the Processing of Fruits and Vegetables; Sehrawat, R., Khan, K.A., Goyal, M.R., Paul, P.K., Eds.; CRC Press: Boca Raton, FL, USA, 2018. [Google Scholar]
  29. Silva, F.J.P.; Gomes, M.H.; Fidalgo, F.; Rodrigue, J.A.; Almeida, D.P.F. Antioxidant properties and fruit quality during long-term storage of ‘Rocha’ pear: Effects of maturity and storage conditions. J. Food Qual. 2010, 33, 1–20. [Google Scholar] [CrossRef]
  30. Wang, Z.; Barrow, C.J.; Dunshea, F.R.; Hafiz, A.R.; Suleria, A. Comparative Investigation on Phenolic Composition, Characterization and Antioxidant Potentials of Five Different Australian Grown Pear Varieties. Antioxidant 2021, 10, 151. [Google Scholar] [CrossRef] [PubMed]
  31. Veltman, R.H.; Lentheric, I.; Van Der Plas, L.H.W.W.; Peppelenboss, H.W. Internal browning in pear fruit (Pyrus communis L. cv Conference) may be a result of a limited availability of energy and antioxidants. Postharvest Biol. Technol. 2003, 28, 295–302. [Google Scholar] [CrossRef]
  32. Kolniak-Ostek, J. Content of bioactive compounds and antioxidant capacity in skin tissues of pear. J. Funct. Foods 2016, 23, 40–51. [Google Scholar] [CrossRef]
  33. Macheix, J.J.; Fleuriet, A.; Billot, J. Fruit Phenolics; CRC Press: Boca Raton, FL, USA, 1990. [Google Scholar]
  34. Saltaa, J.; Martinsa, A.; Santosa, R.G.; Nenga, R.N.; Nogueiraa, M.F.; Justinob, J.; Rautera, A.P. Phenolic composition and antioxidant activity of Rocha pear and other pear cultivars—A comparative study. J. Funct. Foods 2010, 2, 153–157. [Google Scholar] [CrossRef]
  35. Li, X.; Wang, T.; Zhou, B.; Gao, W.; Cao, J.; Huang, L. Chemical composition and antioxidant and anti-inflammatory potential of peel and flesh from 10 different pear varieties (Pyrus spp.). Food. Chem. 2014, 152, 531–538. [Google Scholar] [CrossRef]
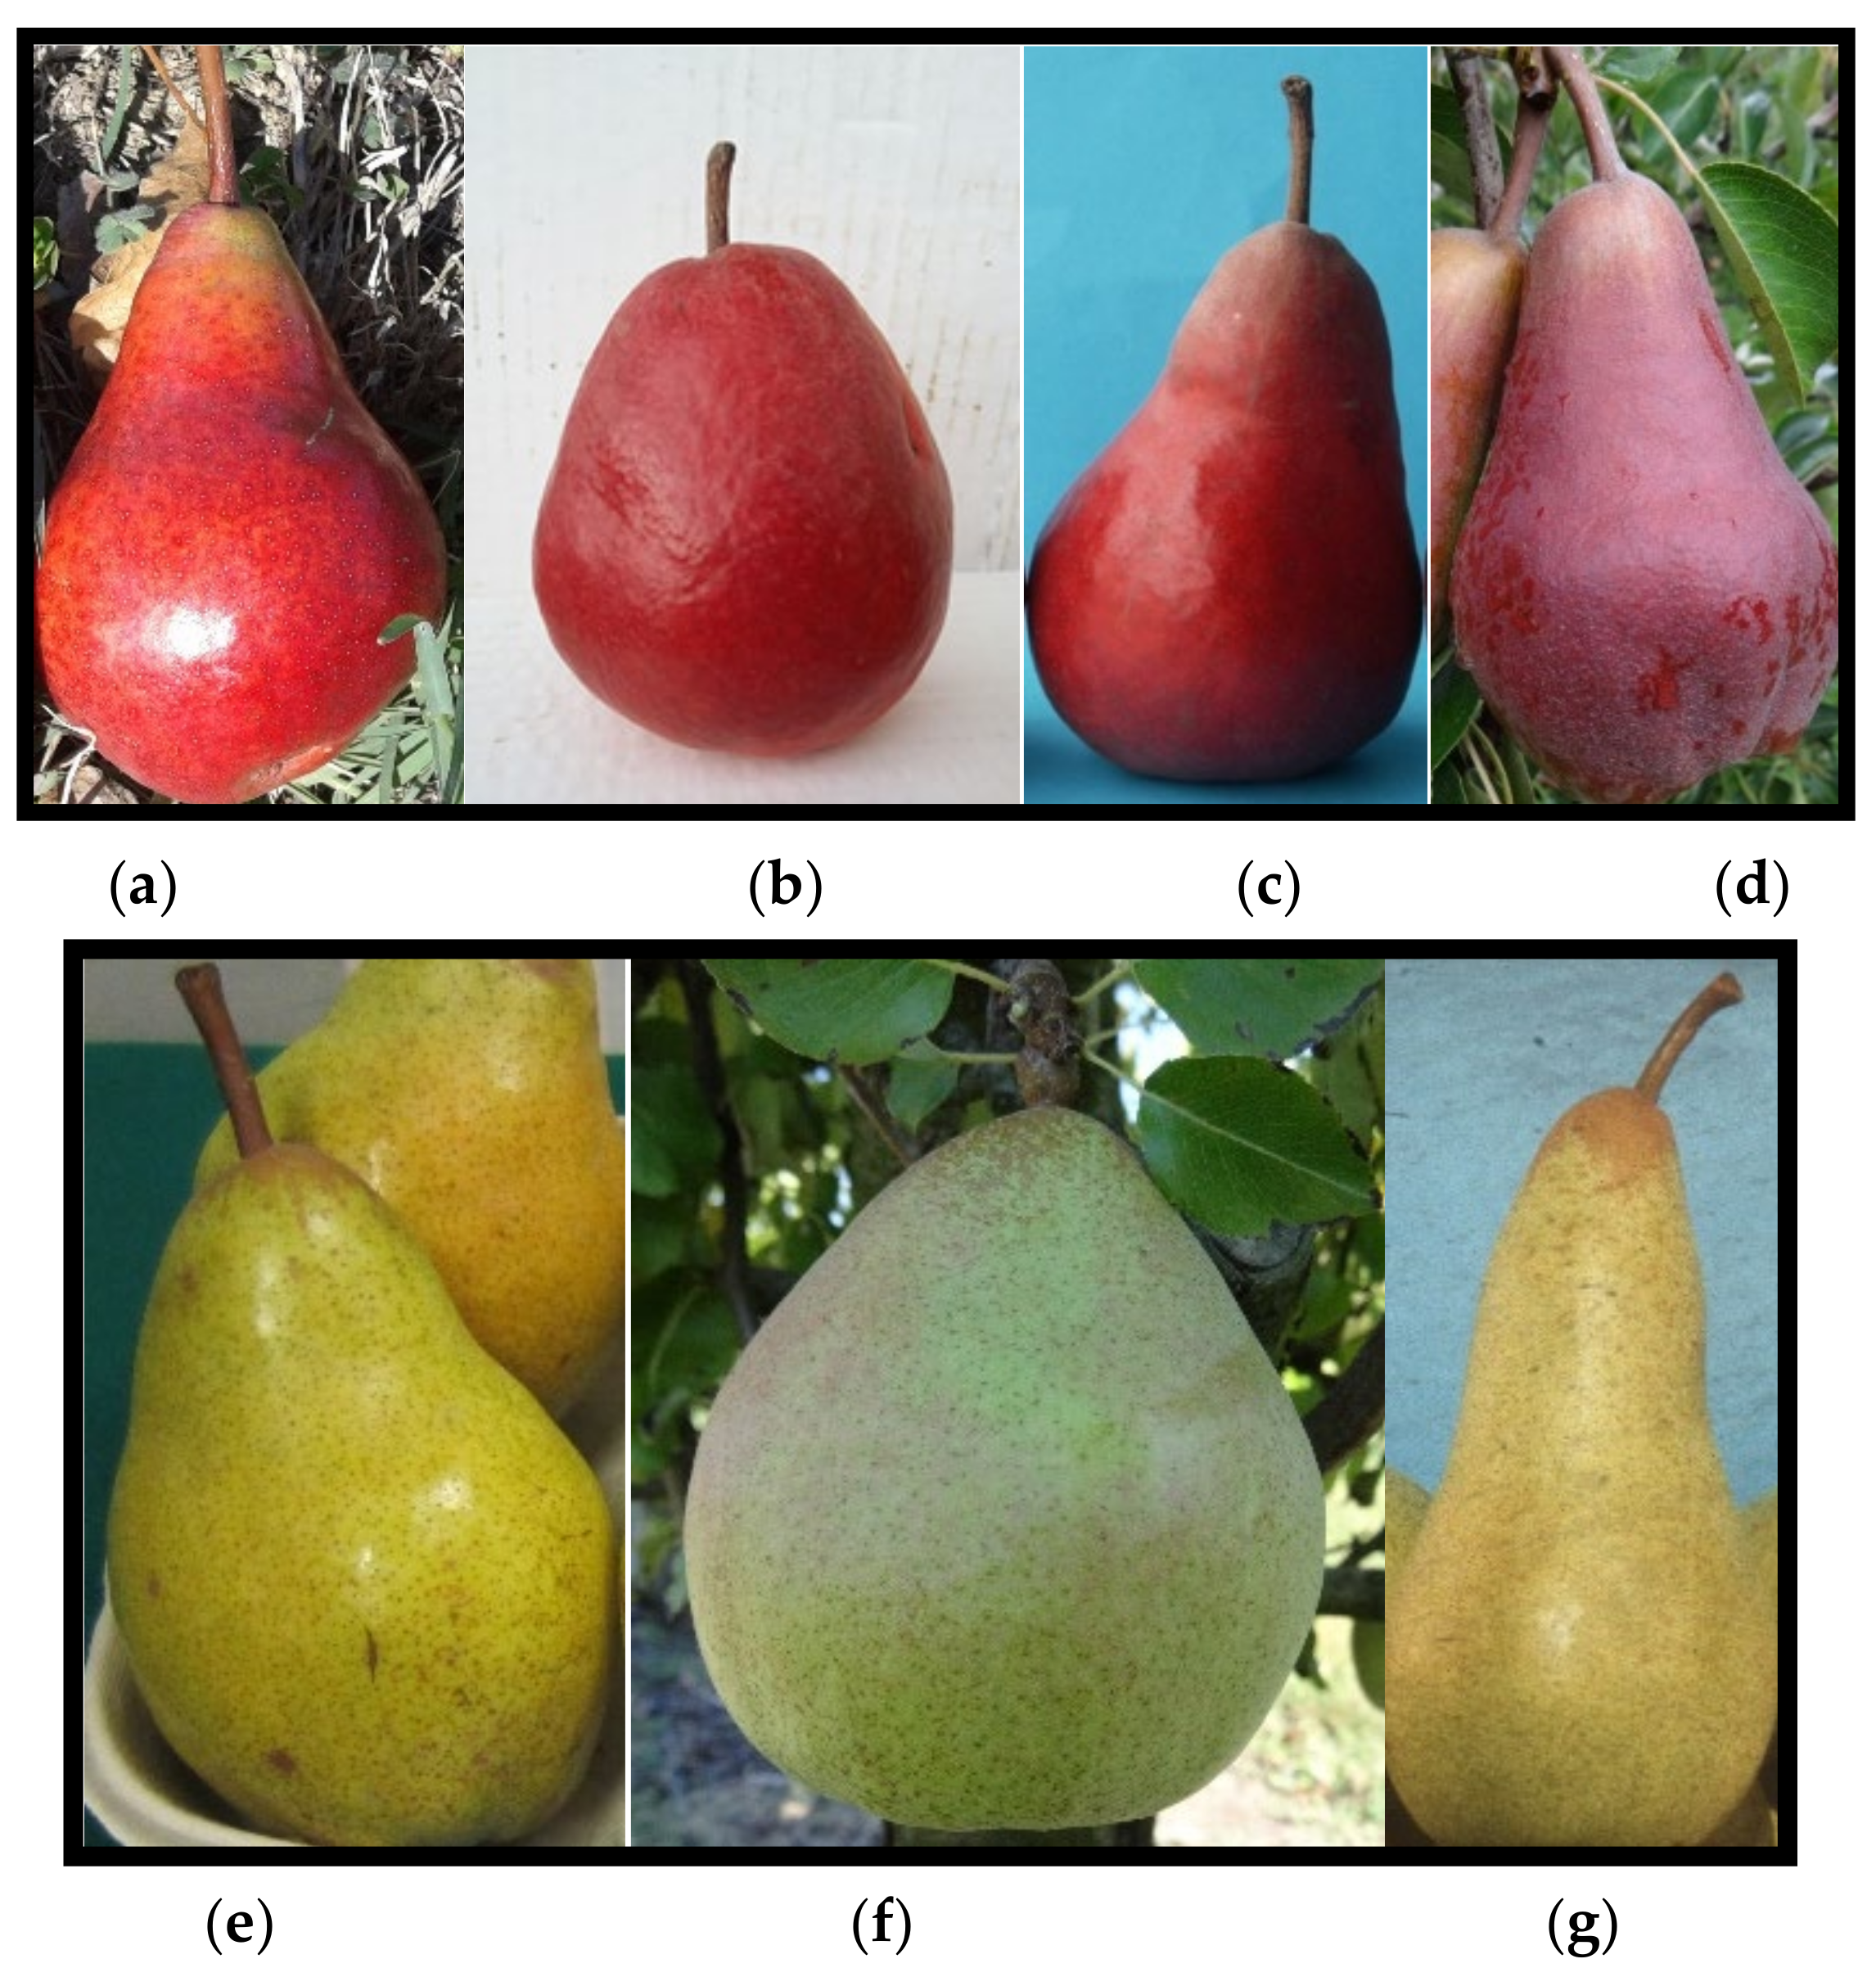
Figure 1. Evaluated pear varieties, (a) CREA 125, (b) CREA 179, (c) CREA 171, (d) Falstaff, (e) William’s B.C., (f) Doyenne du Comice, and (g) Abbé Fétel.
Agronomy 11 02515 g001
Figure 2. Sugar content sucrose (a), glucose (b), fructose (c), sorbitole (d), in different pear cultivars/selections in 2013, 2014, and 2015. Statistical comparisons were made using data from 2013, 2014, and 2015. Means followed by the same letter do not differ significantly at p = 0.05 (Duncan test). Statistical comparisons were made within each year.
Agronomy 11 02515 g002aAgronomy 11 02515 g002b
Figure 3. Organic acid content, malic acid (a), citric acid (b) in different pear cultivars/selections in 2013, 2014, and 2015 after 100 days of storage at −1 ± 0.5 °C. Statistical comparisons were made using data from 2013, 2014, and 2015. Means followed by the same letter do not differ significantly at p = 0.05 (Duncan test). Statistical comparisons were made within each year.
Agronomy 11 02515 g003
Figure 4. Total antioxidant activity (a) and nutraceutical compounds (polyphenol content—(b) and ascorbic acid—(c)) in different pear cultivars and selections after 100 days of storage at −1 ± 0.5 °C. Statistical comparisons were made using data from three different years, 2013, 2014, and 2015. Means followed by the same letter do not differ significantly at p = 0.05 (Duncan test). Statistical comparisons were made within each year.
Agronomy 11 02515 g004aAgronomy 11 02515 g004b
Table 1. Pomological description and average parameters of the cultivar and selections in trial at harvest time, during the three-year study.
Harvest DateFirmness at Harvest, kg cm−2Average Weight,
g
Size, mmColourRed Over Colour, %Rustiness, %
Abbé Fétel28-Aug5.0±0.5310±4670–75green/yellow1920
Doyenne du Comice01-Sep4.5±0.3260±1875–80green/yellow05
Falstaff23-Aug5.2±0.3290±5270–75yellow855
William10-Aug6.5±0.5220±2970–75green/yellow100
CREA 12512-Aug5.6±0.8180±2665–70yellow900
CREA 17117-Sep6.6±0.6240±4970–75Red040
CREA 17927-Aug5.2±0.4220±3170–75yellow750
Table 2. Qualitative traits of the studied cultivars and selections, during 2013, 2014, and 2015 after 100 days of storage at −1 ± 0.5 °C.
Variety/SelectionAverage Fruit Weight, gTSS, °brixTA, g Malic acid L-1pH
2013
Abbé Fétel278.9±22.8c15.8±1.0c1.2±0.27a4.9±0.1bc
Doyenne du Comice279.7±19.8c16.1±0.5c1.8±0.43b4.7±0.1b
Falstaff315.5±53.4d17.3±0.8d1.2±0.11a5.1±0.1c
Williams B.C.233.2±13.7b14.8±0.2b3.0±0.27d4.3±0.1a
CREA 125177.4±23.9a13.9±0.5a1.7±0.18b4.6±0.3b
CREA 171213.2±37.8b16.7±0.5d2.2±0.34c4.5±0.2ab
CREA 179224.1±19.8b15.1±0.5b2.3±0.1c4.4±0.2ab
2014
Abbé Fétel343.5±71.8c14.5±0.6bc1.3±0.2ab4.6±0.3ab
Doyenne du Comice270.9±22.1b14.1±1.5b1.6±0.2bc4.5±0.4a
Falstaff286.7±56.8b14.9±0.7bc1.0±0.3a5.0±0.4b
Williams B.C.225.3±35.1a12.4±0.7a2.6±0.6d4.1±0.4a
CREA 125194.7±36.9a13.4±0.8ab1.8±0.3c4.2±0.2a
CREA 171294.1±68.2b15.3±0.5c2.0±0.3c4.4±0.2a
CREA 179206.2±31.9a13.5±1.0b1.8±0.2c4.3±0.2a
2015
Abbé Fétel316.8±48.6d16.3±1.3c1.9±0.2c4.7±0.1cd
Doyenne du Comice228.1±12.4c14.9±0.7b2.2±0.3c4.6±0.1c
Falstaff250.4±39.8c15.9±1.3bc2.2±0.2c4.8±0.1d
Williams B.C.184.6±36.8b14.3±0.5ab0.9±0.2a4.2±0.1b
CREA 125153.3±19.0a13.5±0.5a1.3±0.2b4.5±0.1c
CREA 171218.5±45.9c16.5±1.0c1.4±0.3b4.1±0.2a
CREA 179228.7±39.0c14.5±0.6ab1.1±0.2ab4.3±0.1b
Different letters in the same column refer to statistical differences (p < 0.05). Statistical comparisons were made within each year.
Publisher’s Note: MDPI stays neutral with regard to jurisdictional claims in published maps and institutional affiliations.

