Article

Rootstock Genotypes Shape the Response of cv. Pinot gris to Water Deficit

by
Michele Faralli
1,*,
Pier Lugi Bianchedi
2,
Massimo Bertamini
3 and
Claudio Varotto
1,*
1
Department of Biodiversity and Molecular Ecology, Research and Innovation Centre, Fondazione Edmund Mach, via Mach 1, 38098 San Michele all’Adige (TN), Italy
2
Technology Transfer Centre, Fondazione Edmund Mach, via Mach 1, 38098 San Michele all’Adige (TN), Italy
3
Center Agriculture Food Environment, University of Trento, via Mach 1, 38098 San Michele all’Adige (TN), Italy
*
Authors to whom correspondence should be addressed.
Agronomy 2021, 11(1), 75; https://doi.org/10.3390/agronomy11010075
Submission received: 20 November 2020 / Revised: 21 December 2020 / Accepted: 28 December 2020 / Published: 31 December 2020

Abstract

:
Understanding the physiological basis underlying the water stress responses in grapevine is becoming increasingly topical owing to the challenges that climate change will impose to grapevine agriculture. Here we used cv. Pinot gris (clone H1), grafted on a series of tolerant (1103Paulsen; P), sensitive (SO4) and recently selected (Georgikon28; G28, Georgikon121; G121, Zamor17; Z17) rootstocks. Plants were either subjected to reduced water availability (WS) or maintained at pot capacity (WW). Photosynthetic (light response curves), stomatal and in vivo gas exchange analysis were carried out as well as dynamics of daily water use (WU), leaf area accumulation with affordable RGB imaging pipelines and leaf water potential. Significant genotypic variation was recorded between rootstocks for most of the traits analyzed under optimal conditions with P and SO4 showing a more vigorous growth, higher CO2 assimilation rate, stomatal conductance and stomatal density per unit of leaf area than G28, G121, Z17 (p < 0.001). Under WS, rootstocks induced different water stress response in Pinot gris, with G28 and G121 showing a higher sensitivity of water use to reduced water availability (WS) (p = 0.021) and no variation for midday leaf water potential until severe WS. P, Z17 and to some extent SO4 induced a pronounced near-anisohydric response with a general WU maintenance followed by reduction in leaf water potential even at high levels of soil water content. In addition, G28 and G121 showed a less marked slope in the linear relationship between daily water use and VPD (p = 0.008) suggesting elevated sensitivity of transpiration to evaporative demand. This led to an insensitivity for total dry weight biomass of G28 and G121 under WS conditions (p < 0.001). This work provides: (i) an in-depth analysis for a series of preferable traits under WS in Pinot gris; (ii) a characterization of Pinot gris × rootstock interaction and a series of desirable traits under WS induced by several rootstocks; (iii) the potential benefit for the use a series of affordable methods (e.g., RGB imaging) to easily detect dynamic changes in biomass in grapevine and quickly phenotype genotypes with superior responses under WS. In conclusion, the near-isohydric and conservative behavior observed for G28 and G121 coupled with their low vigor suggest them as potential Pinot gris rootstock candidates for sustaining grapevine productivity in shallow soils likely to develop terminal stress conditions.

1. Introduction

Climate changes will increase the pressure to select new grape varieties with improved characteristics to disadvantageous environmental conditions [1,2]. Although Vitis vinifera L. is considered well adapted to warm and dry environments [3], extreme environmental conditions can significantly reduce yield and quality of commercial varieties [4,5]. Grapevines are generally grown as a scion grafted onto a rootstock and rootstock selection is considered the most promising method for achieving higher levels of stress tolerance [2,6,7]. As a matter of fact, breeding tolerant scion without influencing quality characteristics has been shown to be challenging [6,8]. Conversely, grapevine rootstocks have been previously proposed to play an important role in adaptation to water deficit in several studies [2,9,10]. Intensive rootstock breeding programs began as a result of the invasion and spread of grape phylloxera in Europe during the late 1800s leading to numerous successful rootstock cultivars. Nowadays, choosing a rootstock is an important decision not only because of the potential benefit that farmers expect (e.g., pest and pathogen resistance), but also because establishing a vineyard is a long-term investment. Therefore, further advances on the physiological basis of stress adaptation in different rootstocks genotypes and hybrids are required.
Gas exchange maintenance [7], pronounced water-saving strategy [10], enhanced osmotic adjustment [11] and deep root system [12] are some of the most important examples of rootstock-induced stress tolerance. The term drought tolerance, however, is an intricate concept [13] and grapevine can thrive in several different macro areas with different climatic conditions [3]. Indeed, drought is a combination of several stresses such as low water availability, high evaporative demand and heat stress, and the magnitude of stress damage is dependent on the phenological stage at which it appears suggesting that different strategies are requested for distinct areas [13]. For instance, the same trait (e.g., avoidance through early stomatal closure under water stress) can be beneficial for particular environmental scenarios such as terminal severe stress by maintaining soil moisture, but detrimental under mild stress conditions due to reduced photosynthesis and increased heat stress sensitivity via limited leaf evaporative cooling [14]. Similarly, “risk taking” genotypes that maximize water use can suffer severe stress conditions at the end of the life cycle, although higher assimilates allocation to root growth might buffer terminal stress conditions allowing higher deep-water uptake but only in the presence of deep soil [14]. In addition, biomass accumulation intrinsically determines transpiration since stomatal density and stomatal size along with the leaf area determine the total whole-plant water-use [15] and low-vigor rootstocks have been suggested as “drought tolerant” following a more cautionary use of available water [16]. In grapevine, distinct classes of stomatal responses to stress conditions have been hypothesized, with isohydric cultivars maintaining a fairly constant leaf water potential while reducing stomatal conductance whereas anisohydric ones have a generally low stomatal control and therefore pronounced fluctuations in leaf water potential [17,18]. Recently, this classification have been questioned [19] and a physiological screening of up to 17 cultivars revealed (i) a continuum in the iso-anisohydric response to stress in the genotypes analyzed and that (ii) the same cultivar can express both strategies, depending on the stress intensity [20]. Since there is evidence that the rootstock can strongly influence the scion response to stress as well as the water use strategy of the scion [2,9,10], physiological characterizations of new rootstocks with potential contrasting behavior and biomass under stress conditions is key to guide breeders and farmers towards the best rootstock/scion choice.
Commercially available rootstocks have been extensively characterized for their stress adaptation. A consistent stress sensitivity of the SO4 (Vitis berlandieri Planch. × Vitis riparia Michx.) rootstock has been often proposed, while Paulsen1103 (Vitis berlandieri × Vitis rupestris Scheele) is considered a more tolerant genotype to stresses [21,22]. For example, Paulsen1103 induced higher stress tolerance than the 101-14 Mgt trough deep root proliferation during the warm and dry season followed by minimal stomatal regulation [23] in cv. Merlot. However, in Frioni et al. [7], a conservative behavior was observed when Grechetto gentile was grafted on the drought-tolerant rootstock M4 and 1103P. This suggest that rootstock behavior could be influenced even by scion genotypes, and under either optimal and sub-optimal environmental conditions [24]. In a recent study, however, 36 commercially available rootstocks revealed a very narrow genetic diversity, suggesting the need of enhancing the genetic array of species to produce material with improved resistance to pests and tolerance to environmental stresses [25]. A series of hybrids rootstocks with different parental background have been recently released and tested in agronomic trials for soil pH tolerance [26] and chlorosis. The Georgikon lineage is a group of rootstocks [(Vitis berlandieri × Vitis riparia) × Vitis vinifera] that showed elevated tolerance to limestone, therefore worth of further characterization under different stress conditions. Zamor 17 [(Vitis berlandieri × Vitis riparia) × Vitis rupestris], by having V. rupestris as a parent might display significant degrees of water stress tolerance and early characterizations under limestone conditions provided evidence of mild tolerance. Therefore, in this work we phenotyped pot-grown Pinot gris (clone H1), an economically important cultivar with scant literature on water stress response, grafted on five rootstocks (SO4, Paulsen1103, Georgikon 28, Georgikon 121 and Zamor 17) under optimal and water stress conditions. We hypothesized that the response of Pinot gris to water stress will be shaped when grafted on the selected rootstocks characterized by a different genetic background. Therefore, the main objectives were to (i) characterize water use behavior of Pinot gris under reduced water availability, (ii) assess scion/rootstock interaction in Pinot gris, thus evaluating the preferable rootstock under stress conditions and (iii) identify the physiological mechanisms underlying the different responses induced by the rootstocks. We also provided for the first time a dynamic leaf area accumulation assessment using affordable RGB pipelines [27] as well as gravimetric evaluation of whole-plant water use, water status and gas exchange.

2. Materials and Methods

2.1. Plant Material and Experimental Design

The experiments were carried out inside a polytunnel at Fondazione Edmund Mach. Rooted cuttings from plant nursery were potted in 9.3 L pots (Teraplast, Castelgomberto, Italy) all containing the same amount of growing substrate (~3000 g of TerCompost ExtraQuality Professional, Tercomposti Spa, Calvisano, Italy—a mixture of peat, perlite and pumice) on May 2020 and kept in a fully randomized design inside atemperature-controlled greenhouse under natural light conditions. Plants were left in the greenhouse until early July 2020 and fertilized on two occasions (27 May and 15 July 2020) with 5g of Fe EDTA per pot (Valagro Ferrilene Trium, Valagro, Italy) and 10 g of an NPK fertilizer (Valagro Master 15 − 5 − 30 + 2, Valagro, Italy). The plant material consisted in Pinot gris (clone H1) scions all grafted on either SO4, Paulsen1103 (P), Georgikon28 (G28), Georgikon121 (G121) or Zamor17 (Z17) rootstocks (n = 25, 100 pots in total). In June, plants were pruned and one primary shoot was maintained while keeping a secondary shoot with two vegetative buds. In early June, pots containing plants with uniform growth were moved into a polytunnel under natural environmental conditions and treated with fungicides (1 gr L−1 Syngenta Switch, 0.5 mL L−1 Syngenta Topas 10EC, Syngenta, Basel, Switzerland and 1 mL L−1 of Vertimec EC, Syngenta, Basel, Switzerland). The experimental design consisted in a split-plot design with Watering factor (well-watered, WW—water-stressed, WS) as a main plot and Rootstock as sub-plot in n = 8 (80 pots in total). All the vines were watered to saturation daily until stress application as described below. On July 10, aluminum foil was placed on top of each pot and sealed around the pot to minimize soil evaporation. A data logger (TinyTag) was placed inside the polytunnel and temperature and relative humidity were recorded every 15 min. Vapor pressure deficit (VPD) was then derived from the two variables.

2.2. Leaf Gas Exchange and Stomatal Characterization under Optimal Conditions

Between 13th and 17th of July, vines were subjected to a series of photosynthetic light response curves and stomatal analysis. Light response curve (A/Q) were carried out in n = 4 for all the rootstocks. A mid-canopy fully developed leaf was tagged in all the plants and used for all the analysis. Leaves were placed in the leaf cuvette of an integrated open gas exchange system Li-Cor 6400 (Li-Cor, Lincoln, NE, USA) equipped with an integrated fluorescence leaf cuvette (LI-640040; Li-Cor, Lincoln, NE, USA).Leaves were adapted to an incident light intensity (PPFD) of 2000 μmol m−2 s−1 prior to measurements with an ambient CO2 concentration of 400 μmoL moL−1 and 25 °C leaf temperature. The VPD of the air entering the gas exchange system was maintained between 1 and 1.5 kPa. PPFD was varied in a step-wise manner starting from the acclimation level (2000 μmol m−2 s−1). Light levels were 2000, 1500, 1200, 1000, 800, 600, 500, 400, 300, 150, 75, 50 and 25 μmol m−2 s−1. At each light level, once a new steady-state was reached, gas exchange data were logged. Leaf CO2 assimilation (A), stomatal conductance (gs), sub-stomatal CO2 concentration (Ci) and transpiration (E) were recorded.
Stomatal impressions were subsequently collected from mid-canopy fully expanded leaves (n = 6). Nail polish was used to create an impression of the abaxial and adaxial surfaces. Impressions were then placed on microscope slides and viewed with a light microscope (20 × magnification). Stomatal density (SD) was carried out on three fields of view per impression and standardized to mm2.

2.3. Treatment Application and Stress Conditions

The progressive soil drying treatment started on the 21st of July 2020 by removing watering to the selected water stress pots (WS) and recorded as “days after treatment” 0 (DAT 0). Well-watered (WW) pots were maintained at ~4300 g (pot capacity according to water retention curve carried out in soil-only pots) throughout the experiment. Pot weight and watering (WW only) was carried out every morning between 7:00 and 8:00 and for each pot (n = 7–9) by using a balance (Ohaus defender 3000, Parsippany, NJ, USA). At DAT14, WS pots were re-watered to WW conditions and recovery was maintained for five days.
Water content in the pot was then expressed as the fraction of transpirable soil water (FTSW) [28]. Total transpirable soil water (TTSW) was calculated as the difference between the weight of the pot at 100% available water content and the average weight measured when the transpiration of the plants was ~10% of the control plants (~1300 g). The FTSW value for each DAT was then calculated as FTSW = (WTn − WTf)/TTSW, where WTn represents the pot weight on a given DAT and WTf the pot weight of a stressed plant showing ~10% of the transpiration of the control plants. Daily water use was calculated as WU (mL) = pot weight DATn−pot weightDATn1.

2.4. Non-Destructive Estimation of Dynamic Leaf Area

The dynamic changes in leaf area during the experiment were assessed with an RGB app and pipeline analysis as provided by [27]. After gravimetric assessments on DAT 1, 6, 8, 10, 13 and 17, pots (n = 6–9) were moved outside the polytunnel. A tripod was used and placed on the same position and distance from the plant for each DAT. The app Plant Screen Mobile (Institute of Plant Sciences, Forschungszentrum Juelich GmbH, Juelich, Germany) was used to take RGB images and segmentation was carried out with the RGB ratio filter. The projected leaf area (PLA, pixels) was recorded for each vine as number of green pixels. A calibration curve between PLA (RGB imaging) and destructive estimation of leaf area (cm2) was constructed by using an imaging software (Easy Leaf Area, University of California, One Shields Avenue, Davis, CA, USA).

2.5. Gas Exchange and Chlorophyll Fluorescence

In vivo gas exchange measurements (n = 4–5) were carried out on DAT 0, 3, 6, 8, 10, 13 and 15. Analyses were done with a Li-Cor 6400 (Li-Cor, Lincoln, NE, USA) with an integrated fluorescence leaf cuvette (LI-640040; Li-Cor) between 0900 and 1200 h. To minimize potential leaf position and developmental age effects, all the gas exchange measurements were taken on a tagged leaf of the mid-canopy in five randomly selected plants for each treatment and rootstock. In the Li-Cor cuvette, all the parameters (leaf CO2 assimilation at saturating light—A and stomatal conductance—gs) were collected at an ambient (CO2) of 400 μmol mol−1 and 25 °C block temperature. PPFD was maintained at 1500 μmol m−2 s−1 with a 10:90 blue:red light and a flow rate of 300 mol s−1. Intrinsic water-use efficiency was calculated as iWUE = A/gs. Measurements of chlorophyll fluorescence were carried out on the same leaves used for gas exchange via the field-portable pulse-modulated fluorimeter Handy-PEA (Hansatech Instruments, Norfolk, UK) on DAT 8. Dark adaptation through leaf clip started at 7:00 and lasted for 45 minutes (n = 5). The same analysis was repeated in the afternoon (15:00). Minimum fluorescence (Fo) and maximum fluorescence (Fm) were recorded by ensuring a light-saturating pulse of 4000 μmol m−2 s−1. The maximum quantum yield of photosystem II (Fv/Fm) was calculated as Fv/Fm = (FmFo)/Fm.

2.6. Midday Leaf Water Potential

Leaf water status was monitored through analysis of midday leaf water potential (LWP). Briefly, on DAT 3, 6, 8, 10, 13 and 15 leaves (n = 3) were sampled between 12:00 and 14:00 after gas exchange analysis, placed into a plastic bag and quickly positioned inside a Scholander pressure chamber (Model 3000 Scholander Plant Water Status Console, ICT International, Armidale, Australia). Readings of LWP were taken and expressed as MPa. Data are shown for WS plants as differences (%) compared with the respective WW replicate.

2.7. Shoot Destructive Analysis

On DAT 17 (7th August 2020), the above ground biomass of each vine was harvested (n = 6–9). The material was then dried for 48 h at 80 °C and then weighed with a balance (Ohaus defender 3000, Parsippany, NJ, USA) to get total biomass dry weight (DW, g). The percentage of DW loss in WS plants was calculated as the % difference compared with WW plants.

2.8. Statistical Analysis

All the analyses were carried out with Rstudio (R Core Team 2018) by using either the stats, agricolae or ggplot2 packages. The response of WU (normalized between 0 and1) to FTSW was characterized by a sigmoidal fitting:
WU normalized = WU max 1 +   e [ FTSW 50   FTSW b ]
where FTSW is the soil water status, WUmax is the asymptote that represents a theoretical maximum of WU, FTSW50 is the inflection point of the curve which represents the FTSW value at which WU is half of WUmax and b represent the transition width of the function. The slope of the fitted logistic curve was calculated as the first derivative of the function at the inflection point and was taken as a measure of the maximum sensitivity of stomatal closure. The rest of curve fitting (relathionship between WU and VPD) was carried out through linear regression. All the estimated traits (WU, A/Q, stomatal density, PLA, LWP, gas exchange traits and biomass) were subjected to two-way ANOVA and one-way ANOVA depending on factor number. A three-way analysis was carried out for Fv/Fm as temperature was included as factor. All data were check for normality and equality of variance through visual assessment of distribution and residuals versus fitted values. When appropriate, data were subjected to repeated measurements analysis. Means separation (p < 0.05) was carried out via Fisher’s test.

3. Results

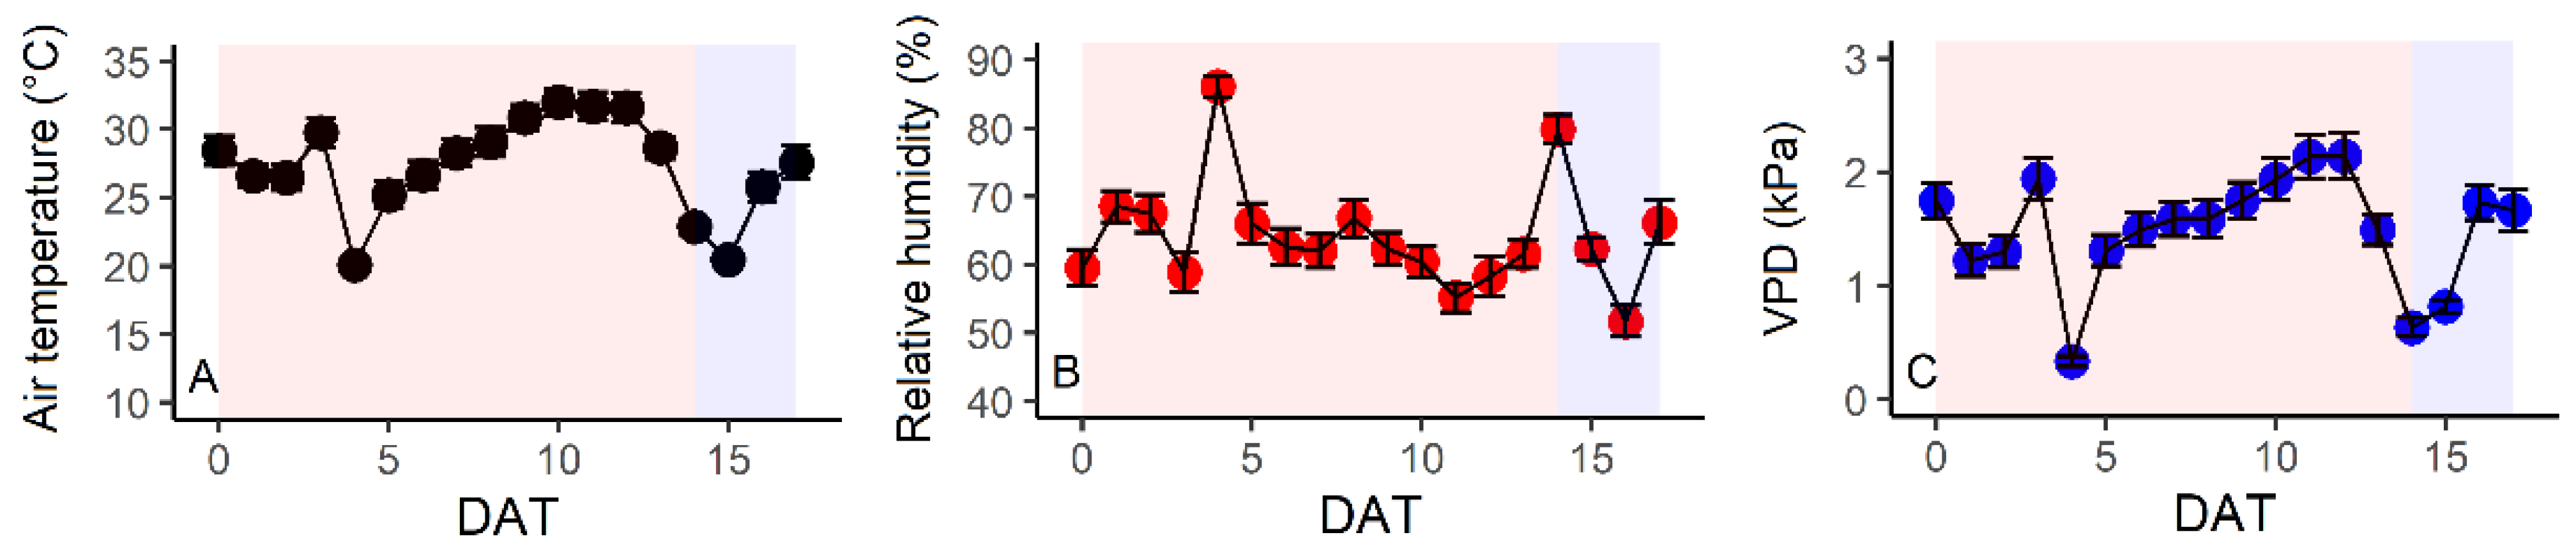
3.1. Environmental Conditions

The experiment was carried out under relatively stable summer conditions (Figure 1). However, there were two days when temperature dropped significantly (DAT 4 and DAT14-15), accompanied by a significant increase on average daily relative humidity and subsequent reduction in VPD.

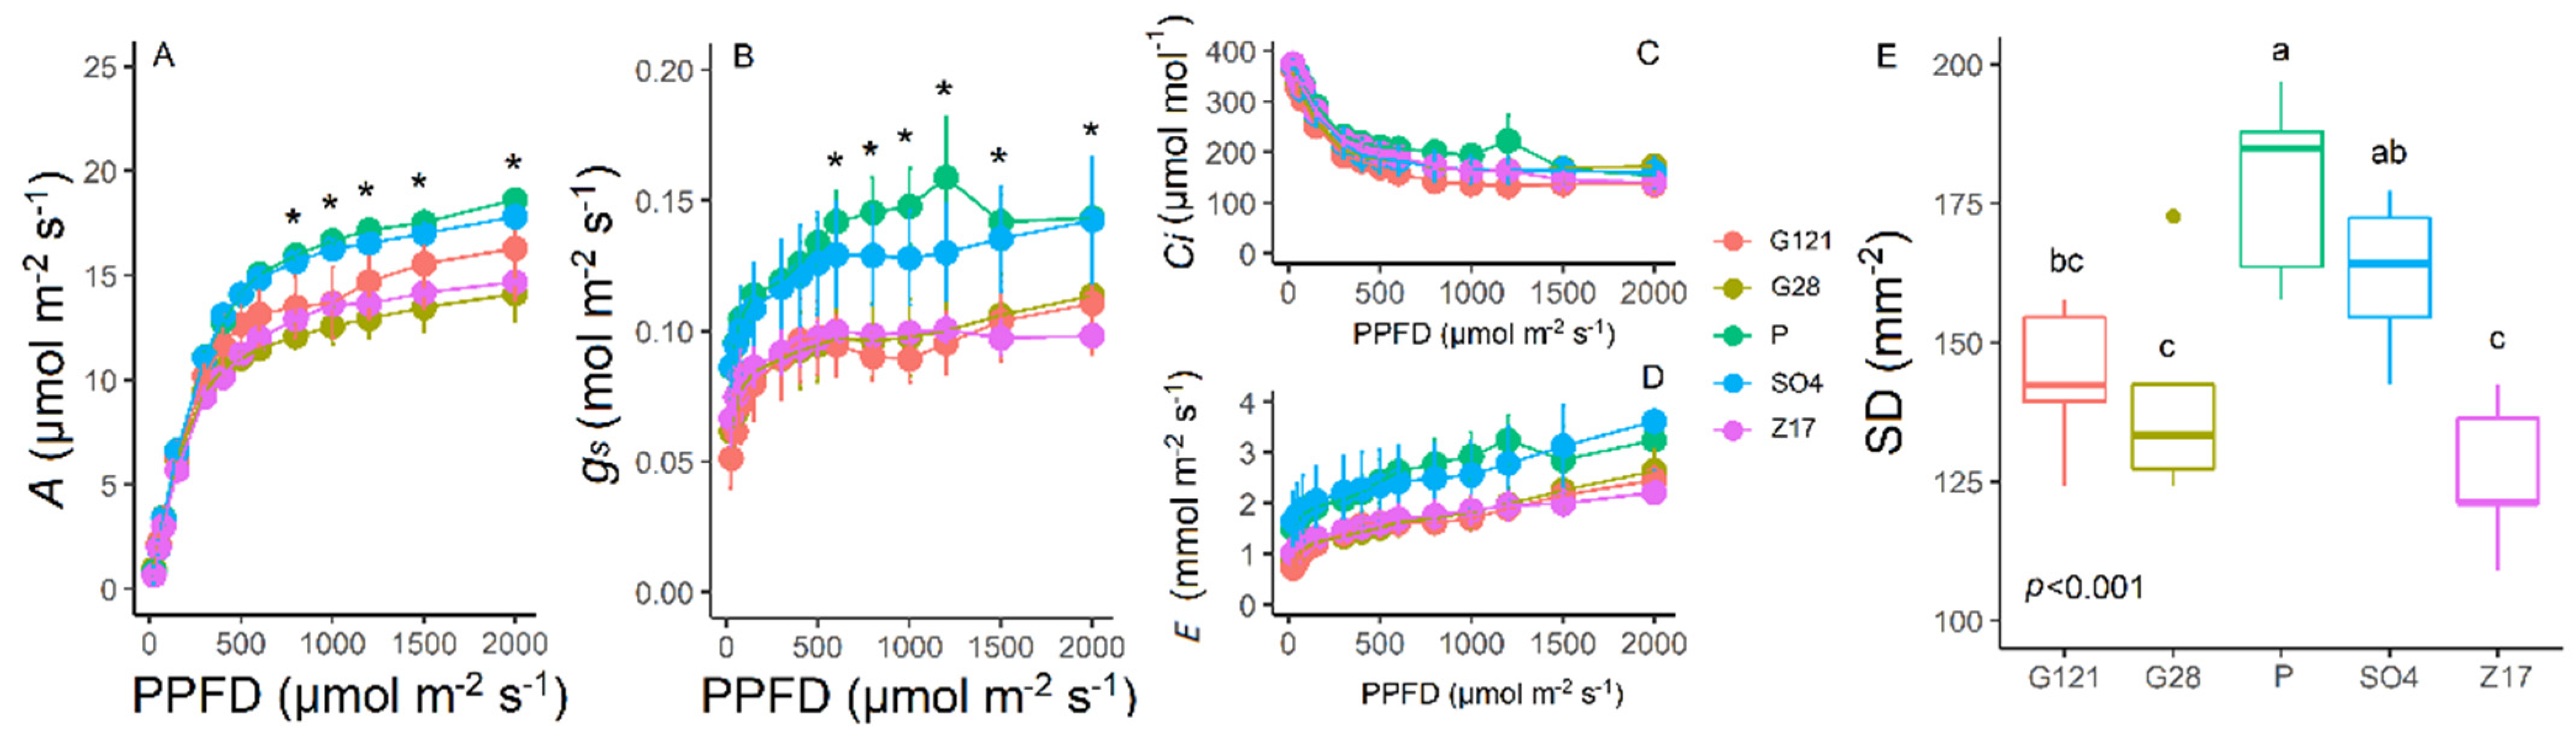
3.2. Light Response Curves and Stomatal Density

Under optimal conditions, significant (p < 0.001) differences were recorded for A and gs between rootstocks (Figure 2) and at different light conditions (p < 0.001) (Figure 2A–D). Indeed, SO4 and P showed a higher A and gs than G28, G121 and Z17 and especially at high light intensity. At saturating light conditions (2000 μmol m−2 s−1 PPFD), SO4 and P had similar A values (~16.5–17 μmol m−2 s−1) accompanied by a generally high gs (~0.14 mol m−2 s−1) while G28, G121 and Z17 showed consistent lower values. Similarly, higher SD was observed (p < 0.001) in P and SO4 compared with the other rootstocks (Figure 2E).

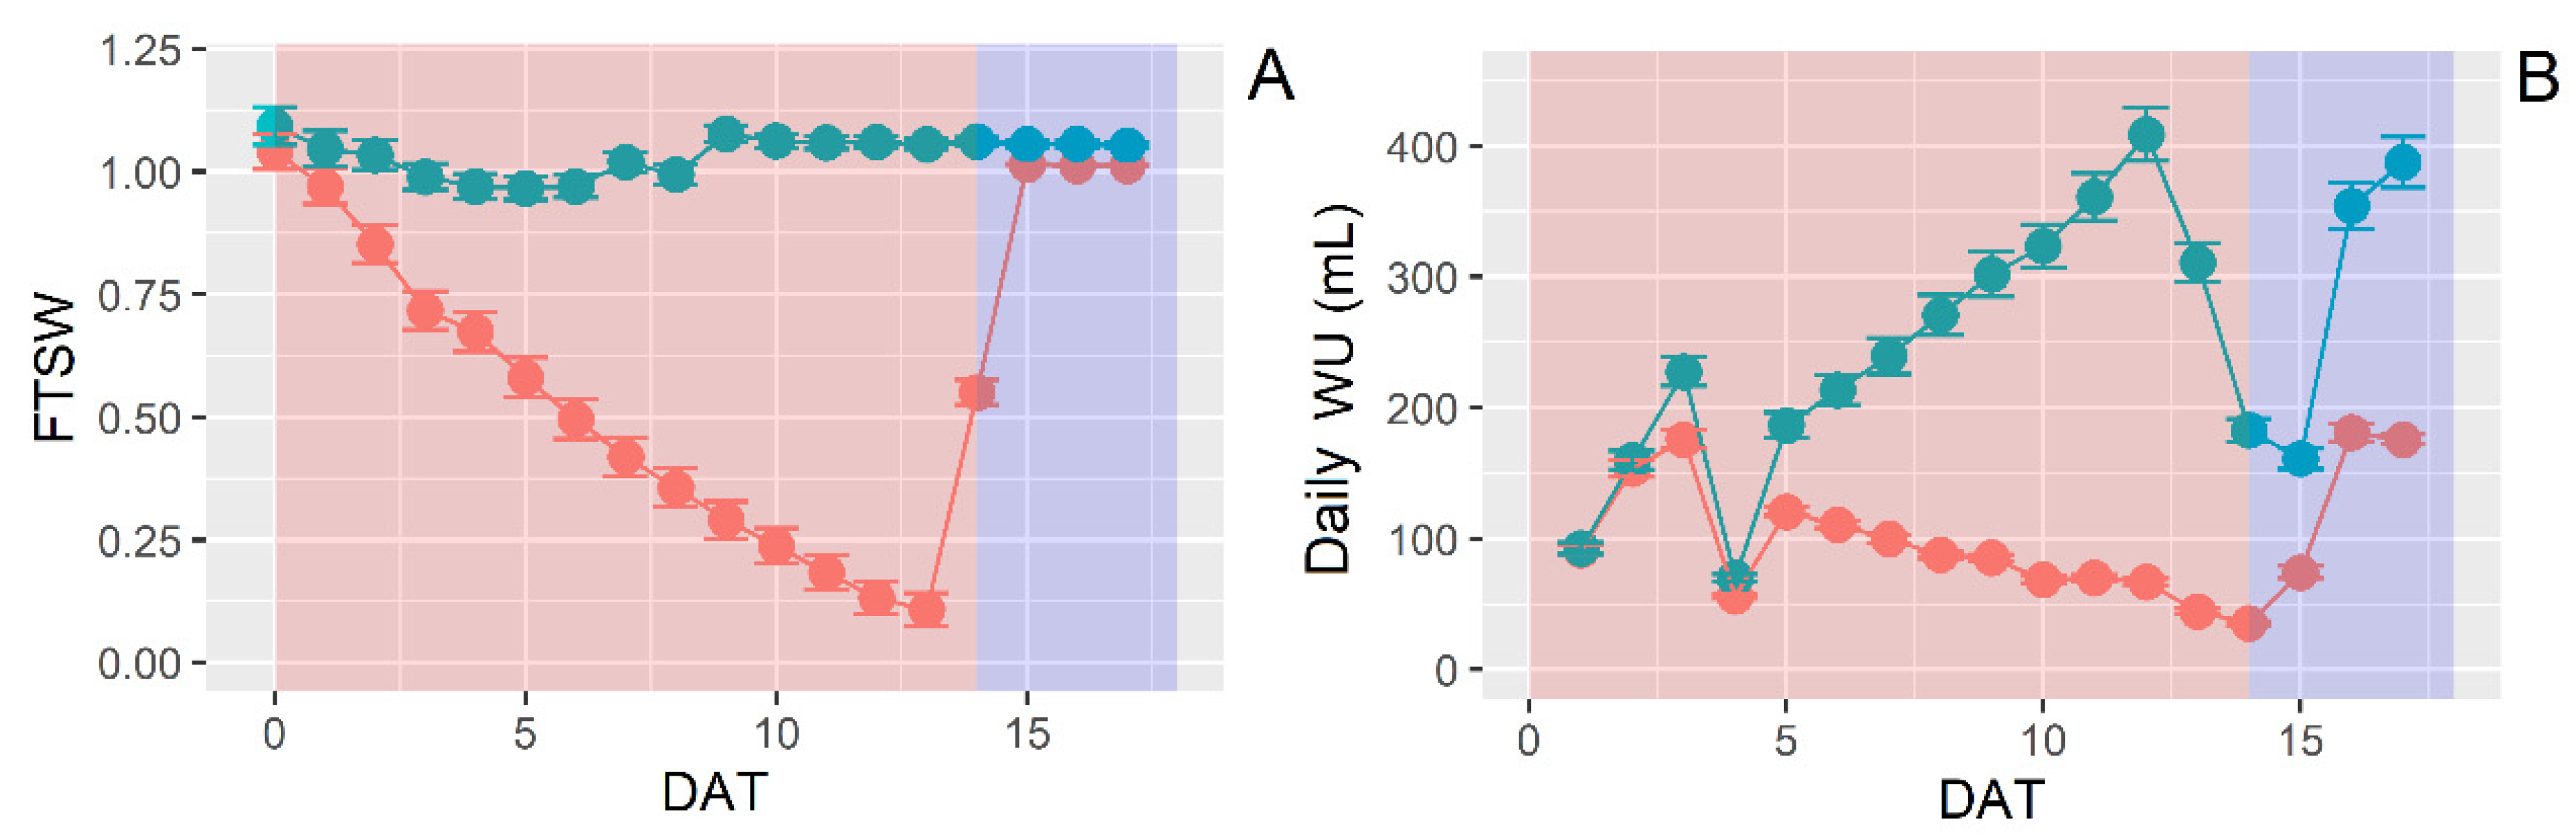
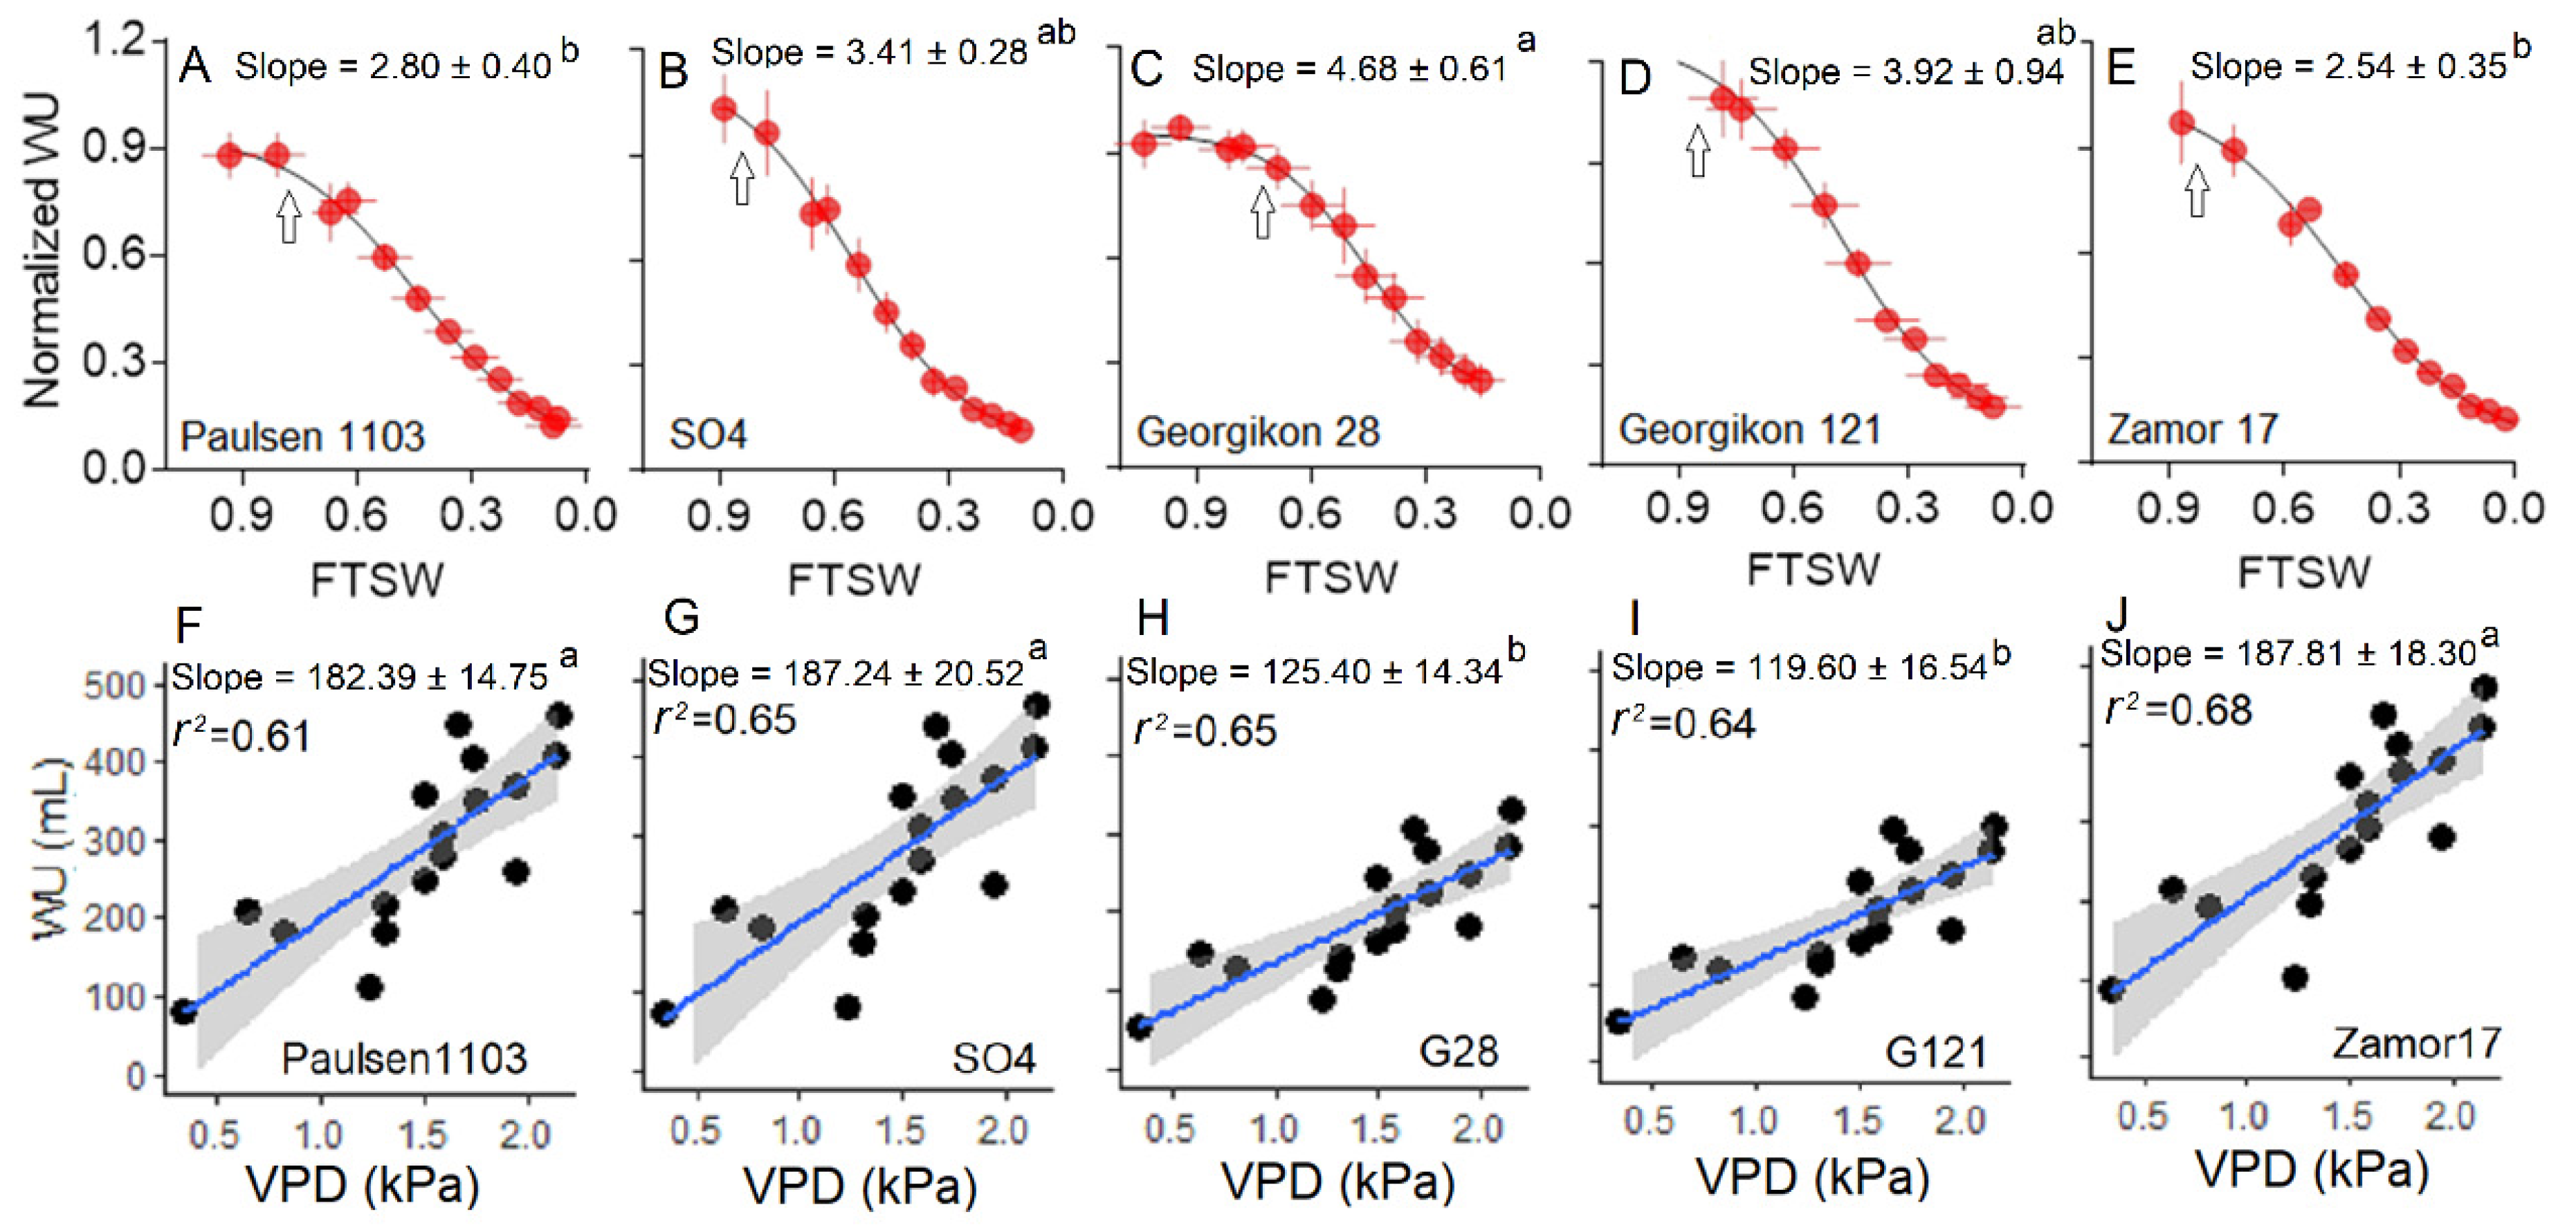
3.3. Water Use Behavior under Water Stress and Increasing VPD

Stress was applied over 14 days (DAT 0 to DAT 13) leading to a reduction in FTSW from ~1 to ~0.05 on average (Figure 3A) while very similar FTSW were recorded during the recovery period between WW and WS. Daily WU analysis revealed a distinct pattern in WW plants with a constant increase over the experimental period and a significant sensitivity to changes in evaporative demand. In WS plants, a linear reduction in WU was observed (Figure 3B).
Normalized WU plotted against FTSW (r2 = 0.9 on average, Figure 4A–E) revealed a significant genotypic variation among rootstocks for WU strategy under reduced water availability. Stomatal sensitivity (slope of linear part of the curve) was higher in G28 and G121 than the other genotypes tested with Z17 having the lowest slope (p = 0.021). Different WU reductions were recorded under WS as well with G28 and P showing WU reduction at lower FTSW levels (~0.75) than SO4, G121 and Z17 (~0.85 FTSW). The relationship between daily WU under WW conditions and FTSW was well explained by linear regression (r2 = 0.64 on average, Figure 3F–J) and for all the rootstocks, suggesting non-limiting transpiration rates at least at the highest VPD recorded in this work (2.2 kPa on average). However, the slope of this relationship was significantly higher in SO4, P and Z17 than G28 and G121 (p = 0.008).

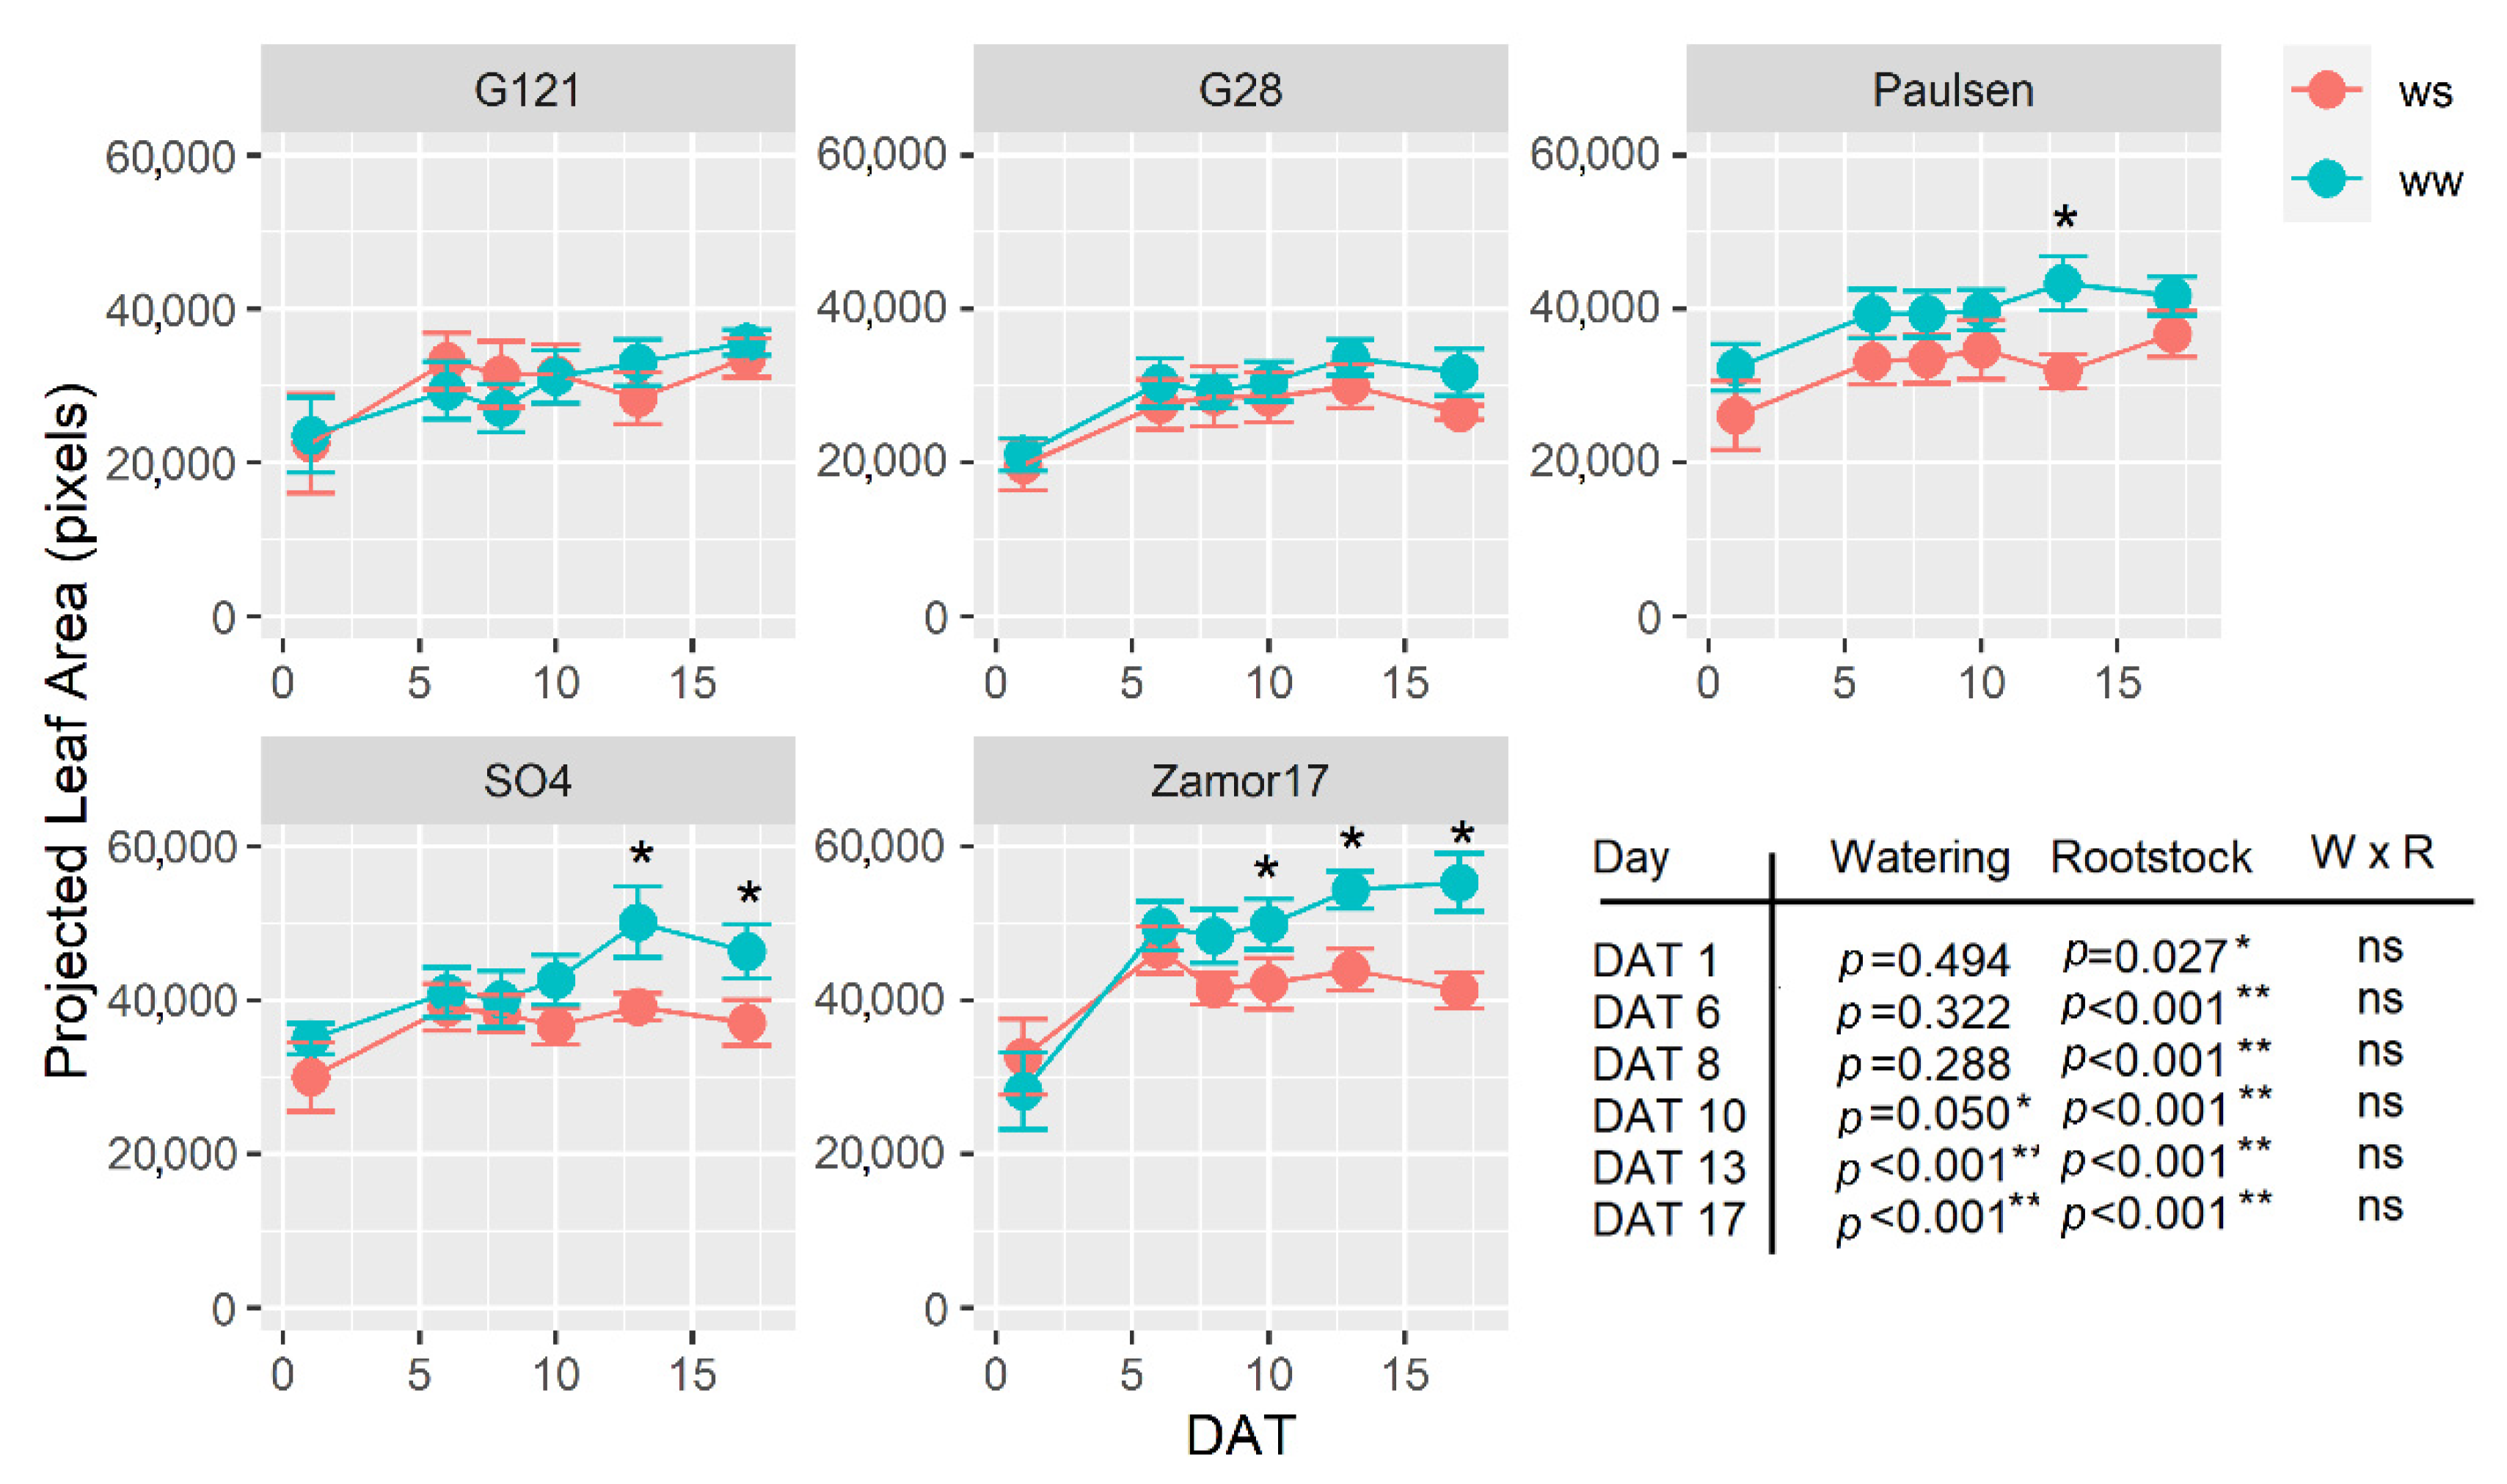
3.4. Dynamic Leaf Area

The pipeline used in this work (Figure S1) provides an affordable tool to estimate dynamic changes in vine leaf area. The relationship between non-destructive leaf area (through RGB imaging) and destructive leaf area (through destructive approaches) was best explained by a quadratic polynomial function (r2 = 0.86) (Figure S1). Under WW conditions, P, SO4 and in particular Z17 yielded the most vigorous canopy (p < 0.001 for all DAT, p = 0.027 for DAT1) while G28 and G121 showed lower PLA values (Figure 5). Under WS, Z17 showed a high degree of sensitivity of leaf area accumulation to water decline with a significant reduction in PLA since DAT 10 and compared with WW plants, while SO4 ad P since DAT 13 only. However, this difference was not significant in P after the recovery period. Conversely, no significant differences were observed for PLA between WW and WS in G28 and G121.

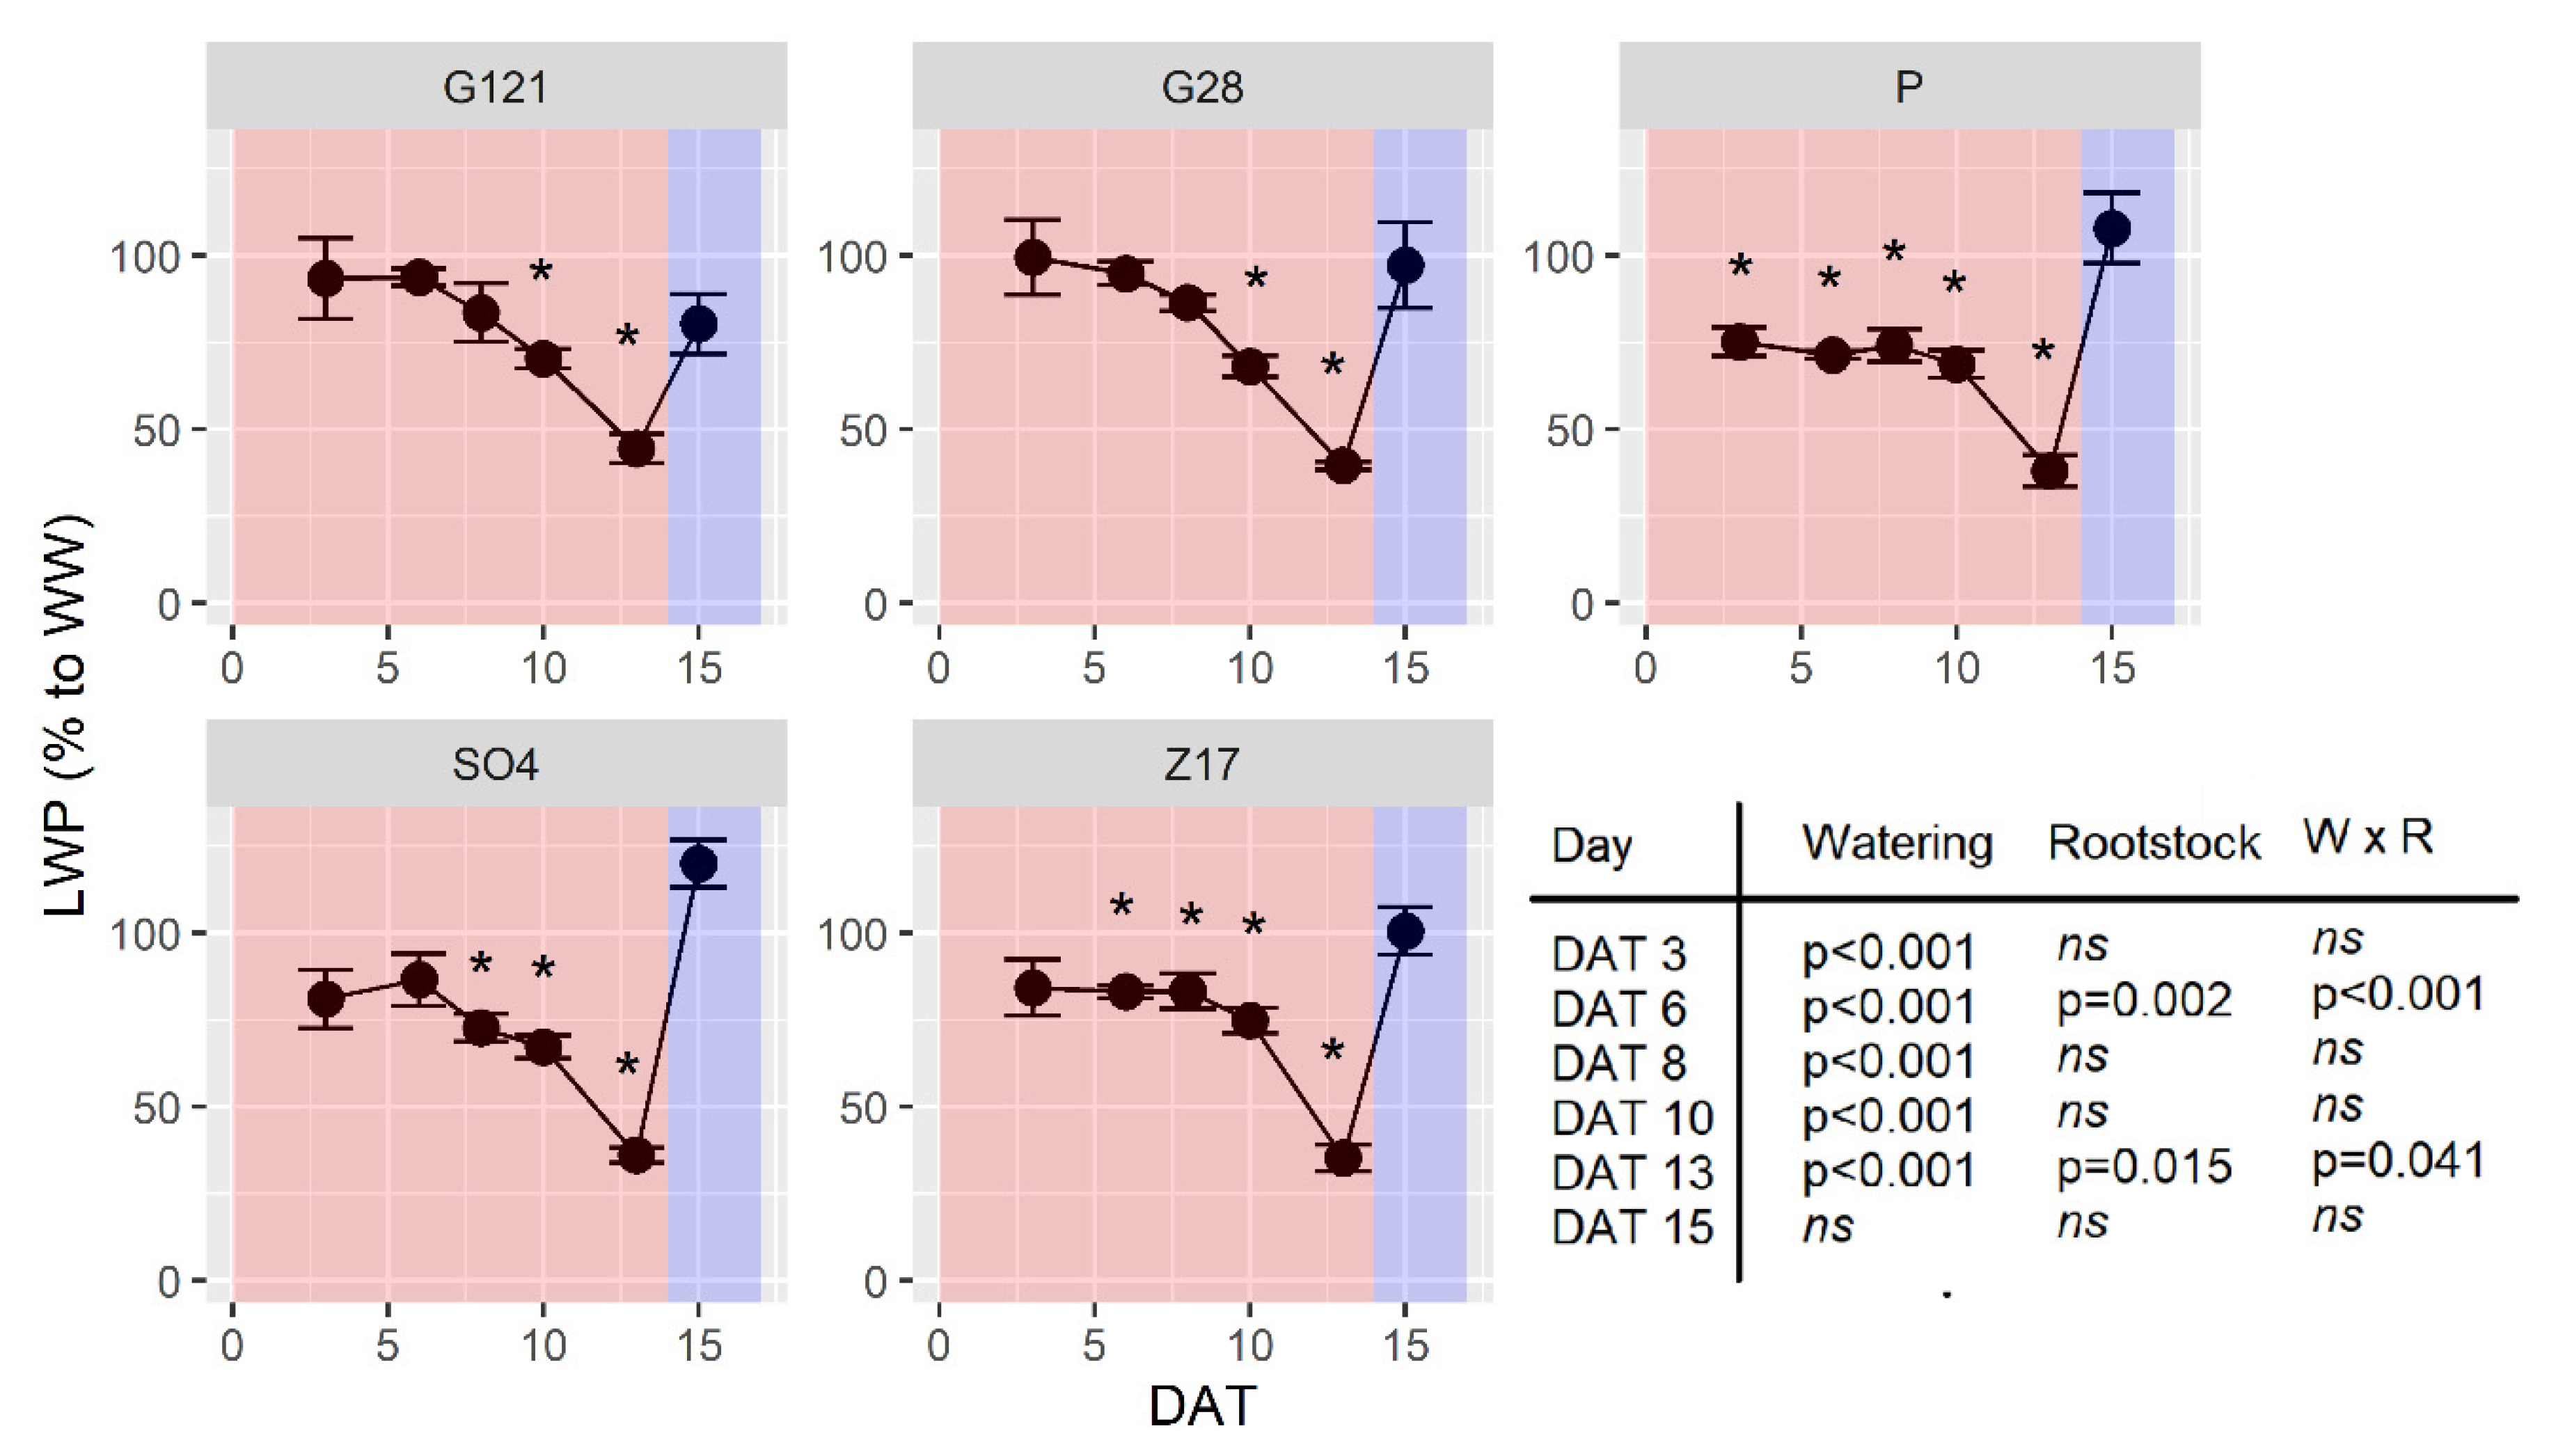
3.5. Leaf Water Potential

The dynamic change in leaf water potential (LWP) during developing stress showed a significant effect of water limitation since DAT 3 (p < 0.001) (Figure 6). P was the rootstock with earliest and most pronounced reduction under water stress and showed significant differences between WS and WW in LWP since DAT 3. Similar responses were recorded for Z17 since DAT 6. SO4 showed reduction for WS and compared with WW starting from DAT 8 while G28 and G121 significantly reduced LWP at DAT 10 and 13 only. Indeed, genotypic variation was recorded for LWP under stress on DAT 6 and DAT 13 (p = 0.002 and p = 0.015 respectively). A complete recovery was observed at DAT 15 for all the genotypes.

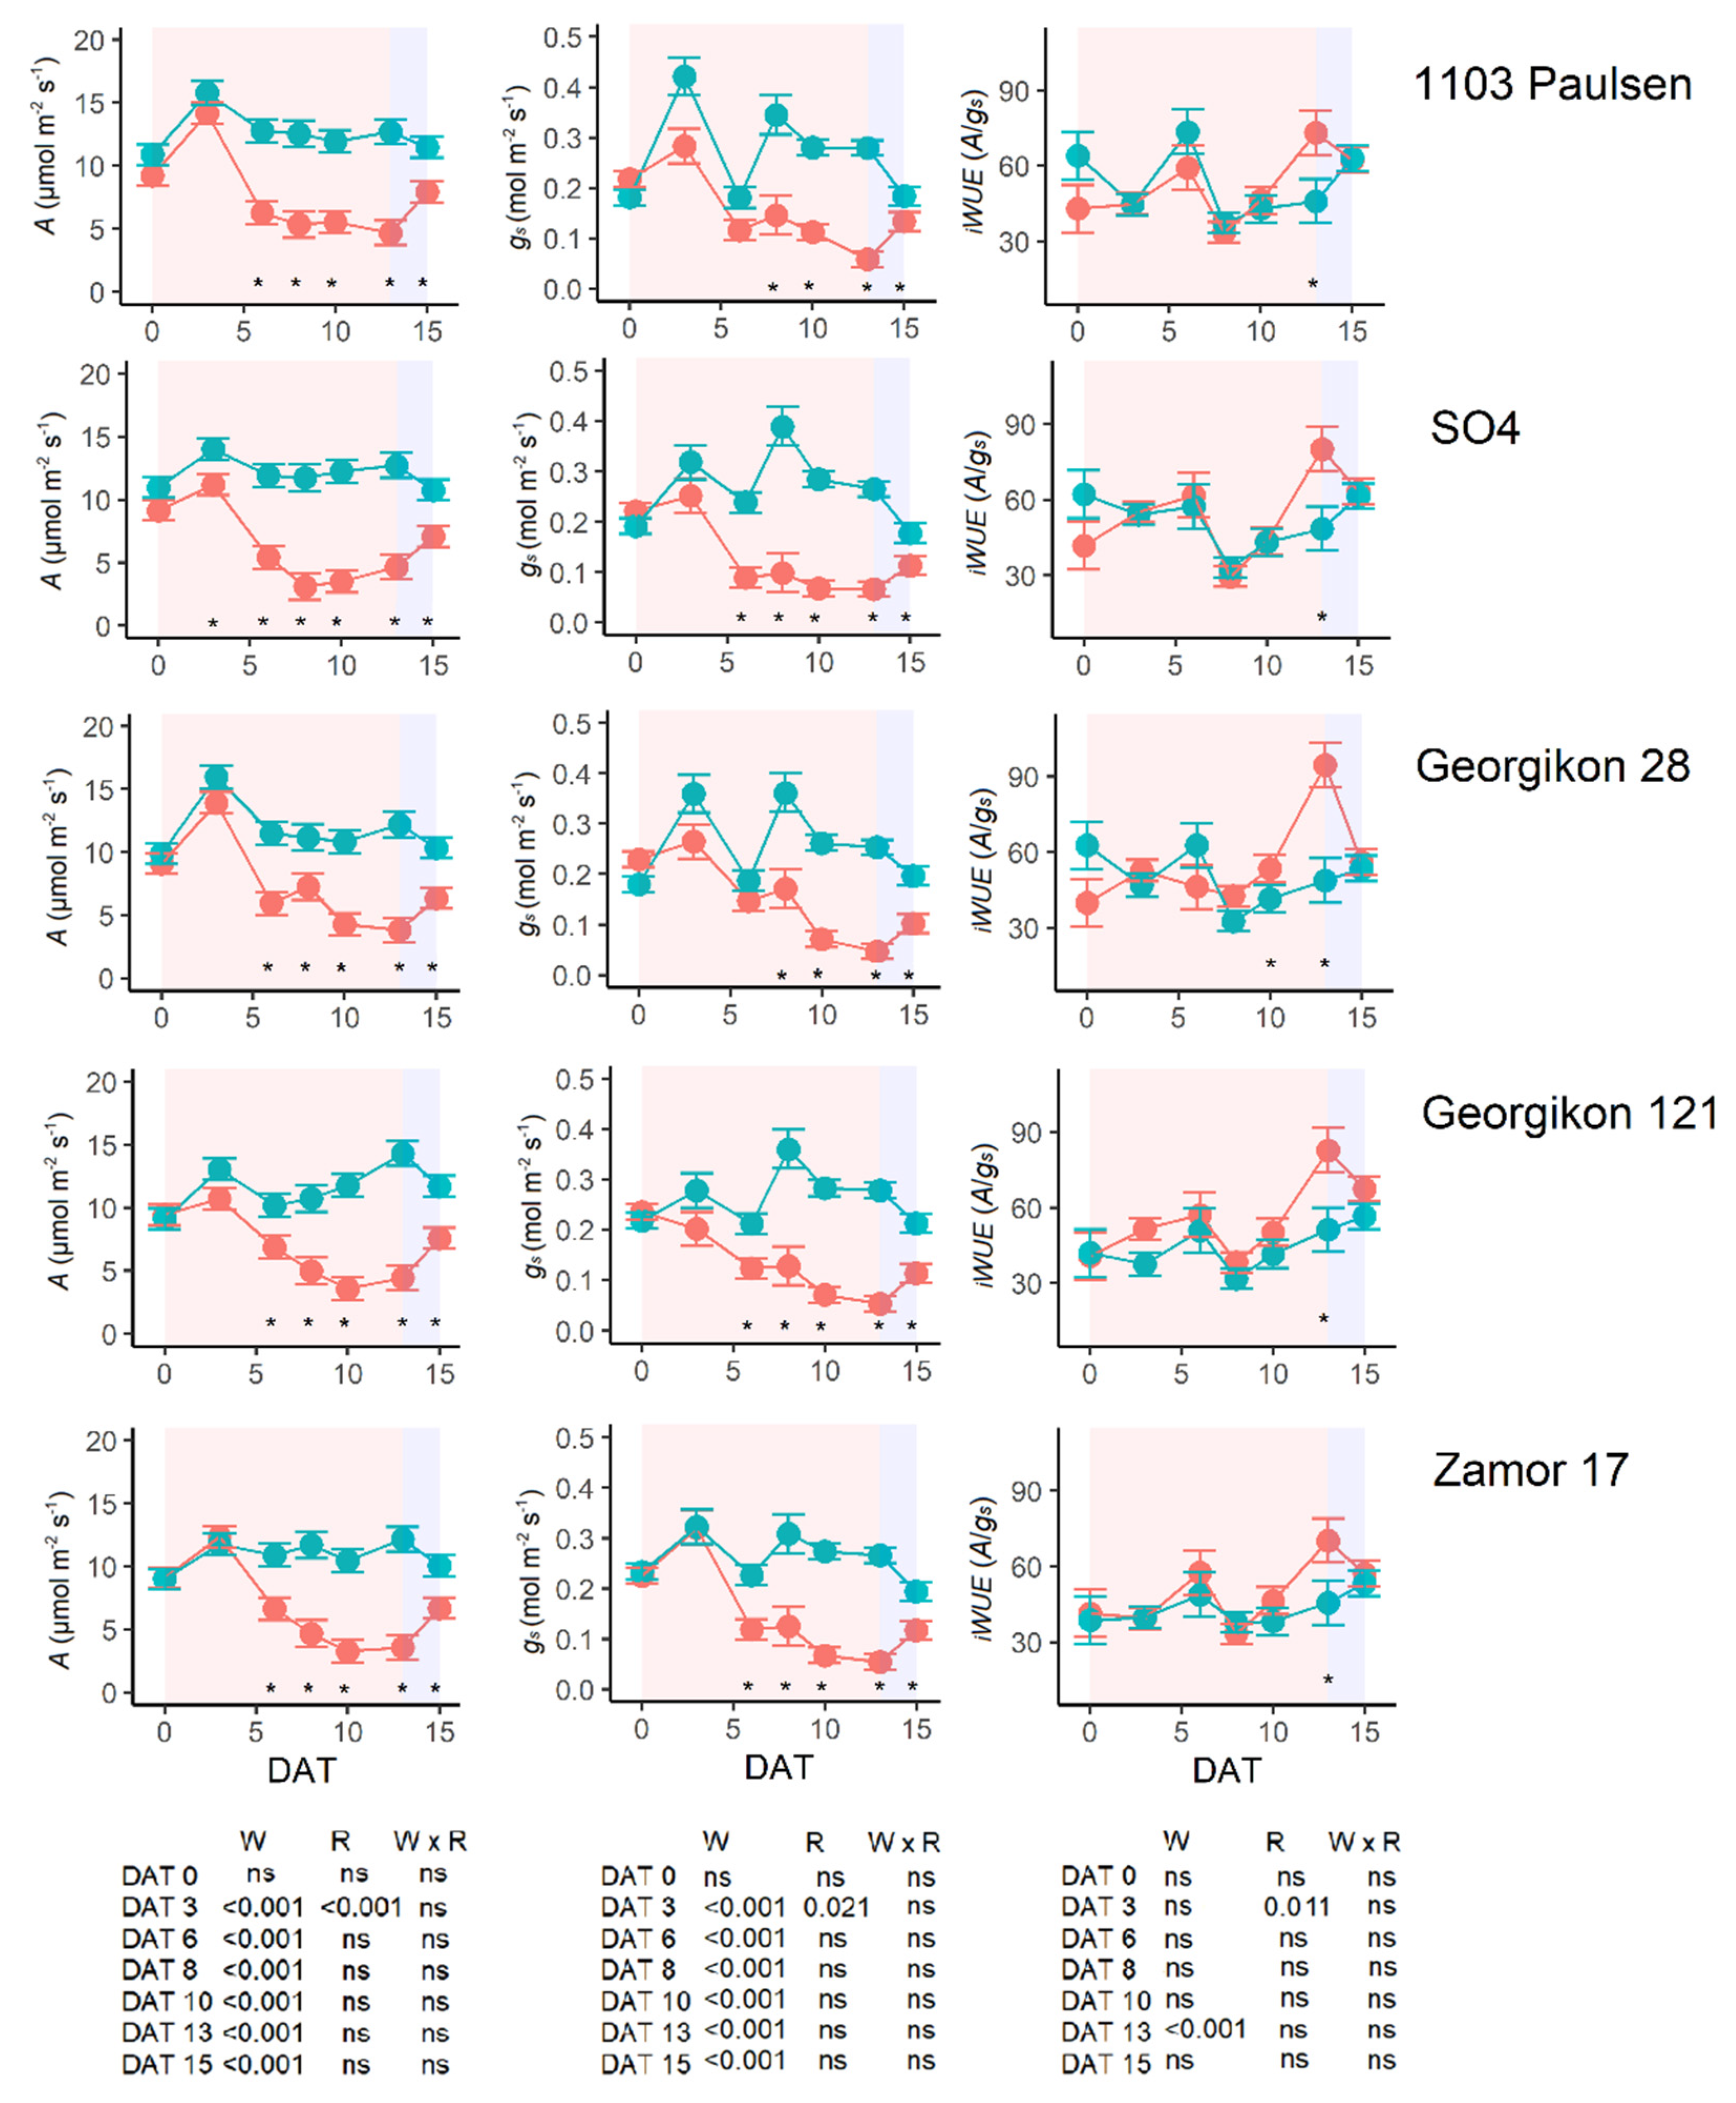
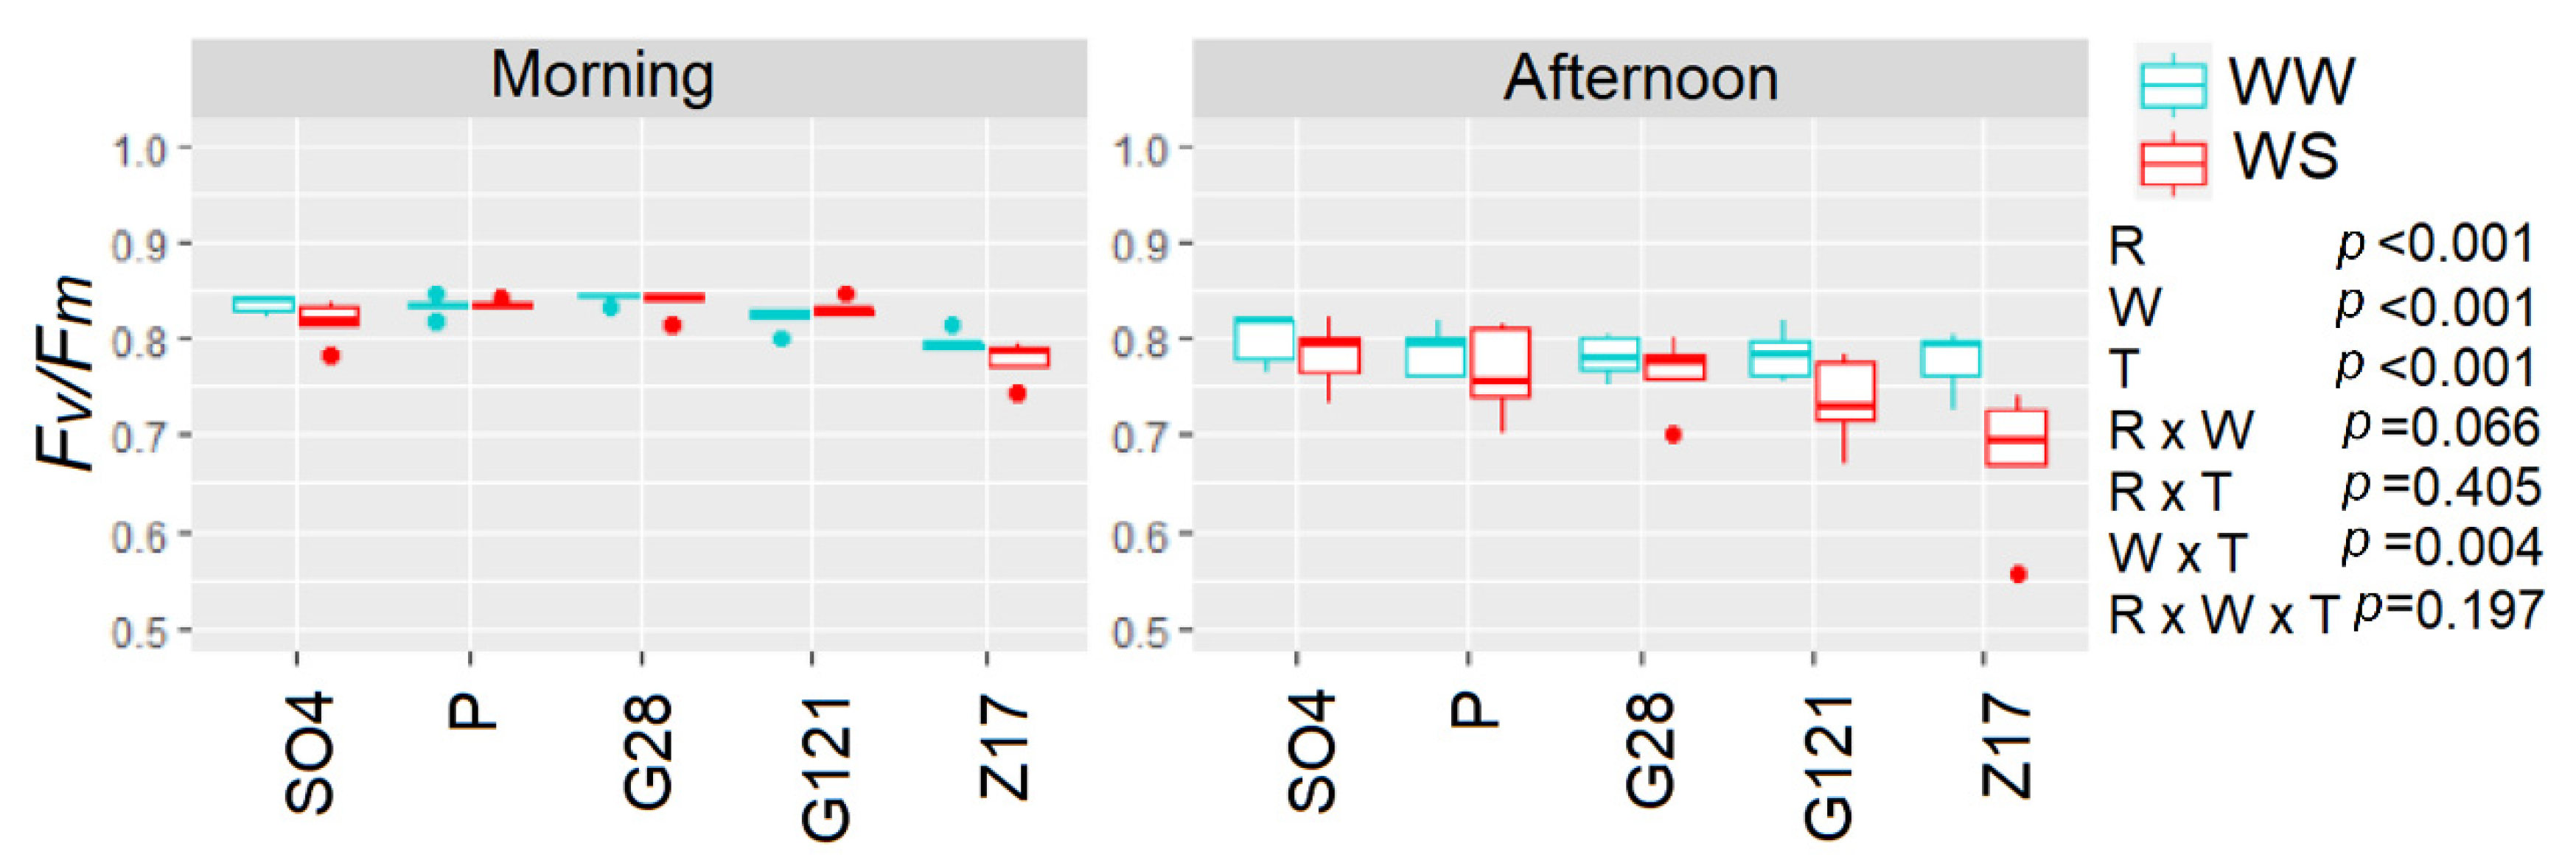
3.6. Gas Exchange and Chlorophyll Fluorescence

In vivo gas exchange measurements at saturating light and ambient CO2 concentration confirmed the generally higher A and gs for P and SO4 although this difference was significant on DAT 3 only (Figure 7). A consistently significant (p < 0.001, apart from DAT 0) effect of WS was recorded throughout the experiment. However, similar drop in gs of WS and compared with WW was recorded for all the rootstocks, although the slope of the reduction was slightly lower in P and Z17 than G28, G121 and Z17. Similarly, the same trends were observed for A under WS. At DAT 15, full A and gs recovery did not occur for any of the rootstocks (WS p < 0.001 for both traits). The A/gs ratio (iWUE) showed an overall significant increase on DAT 13 only (p < 0.001), with G28 and G121 showing a higher iWUE than P and SO4.
Chlorophyll fluorescence analyses were carried out on DAT 8 both in the morning (average T 24 °C) and in the afternoon (average T 41 °C) (Figure 8). Fv/Fm was unaffected in the morning with watering factor being non-significant following a two-way ANOVA (p = 0.105; water, W, and rootstock, R, as factors) although Z17 had generally lower values than the other genotypes (p < 0.001) for both WW and WS. In the afternoon, high temperatures led to a significant PSII downregulation with both WW and WS plants showing a significant reduction (R and W p < 0.001). The highest degrees of photoinhibition compared with the WW plants were recorded in Z17, G121 and P.

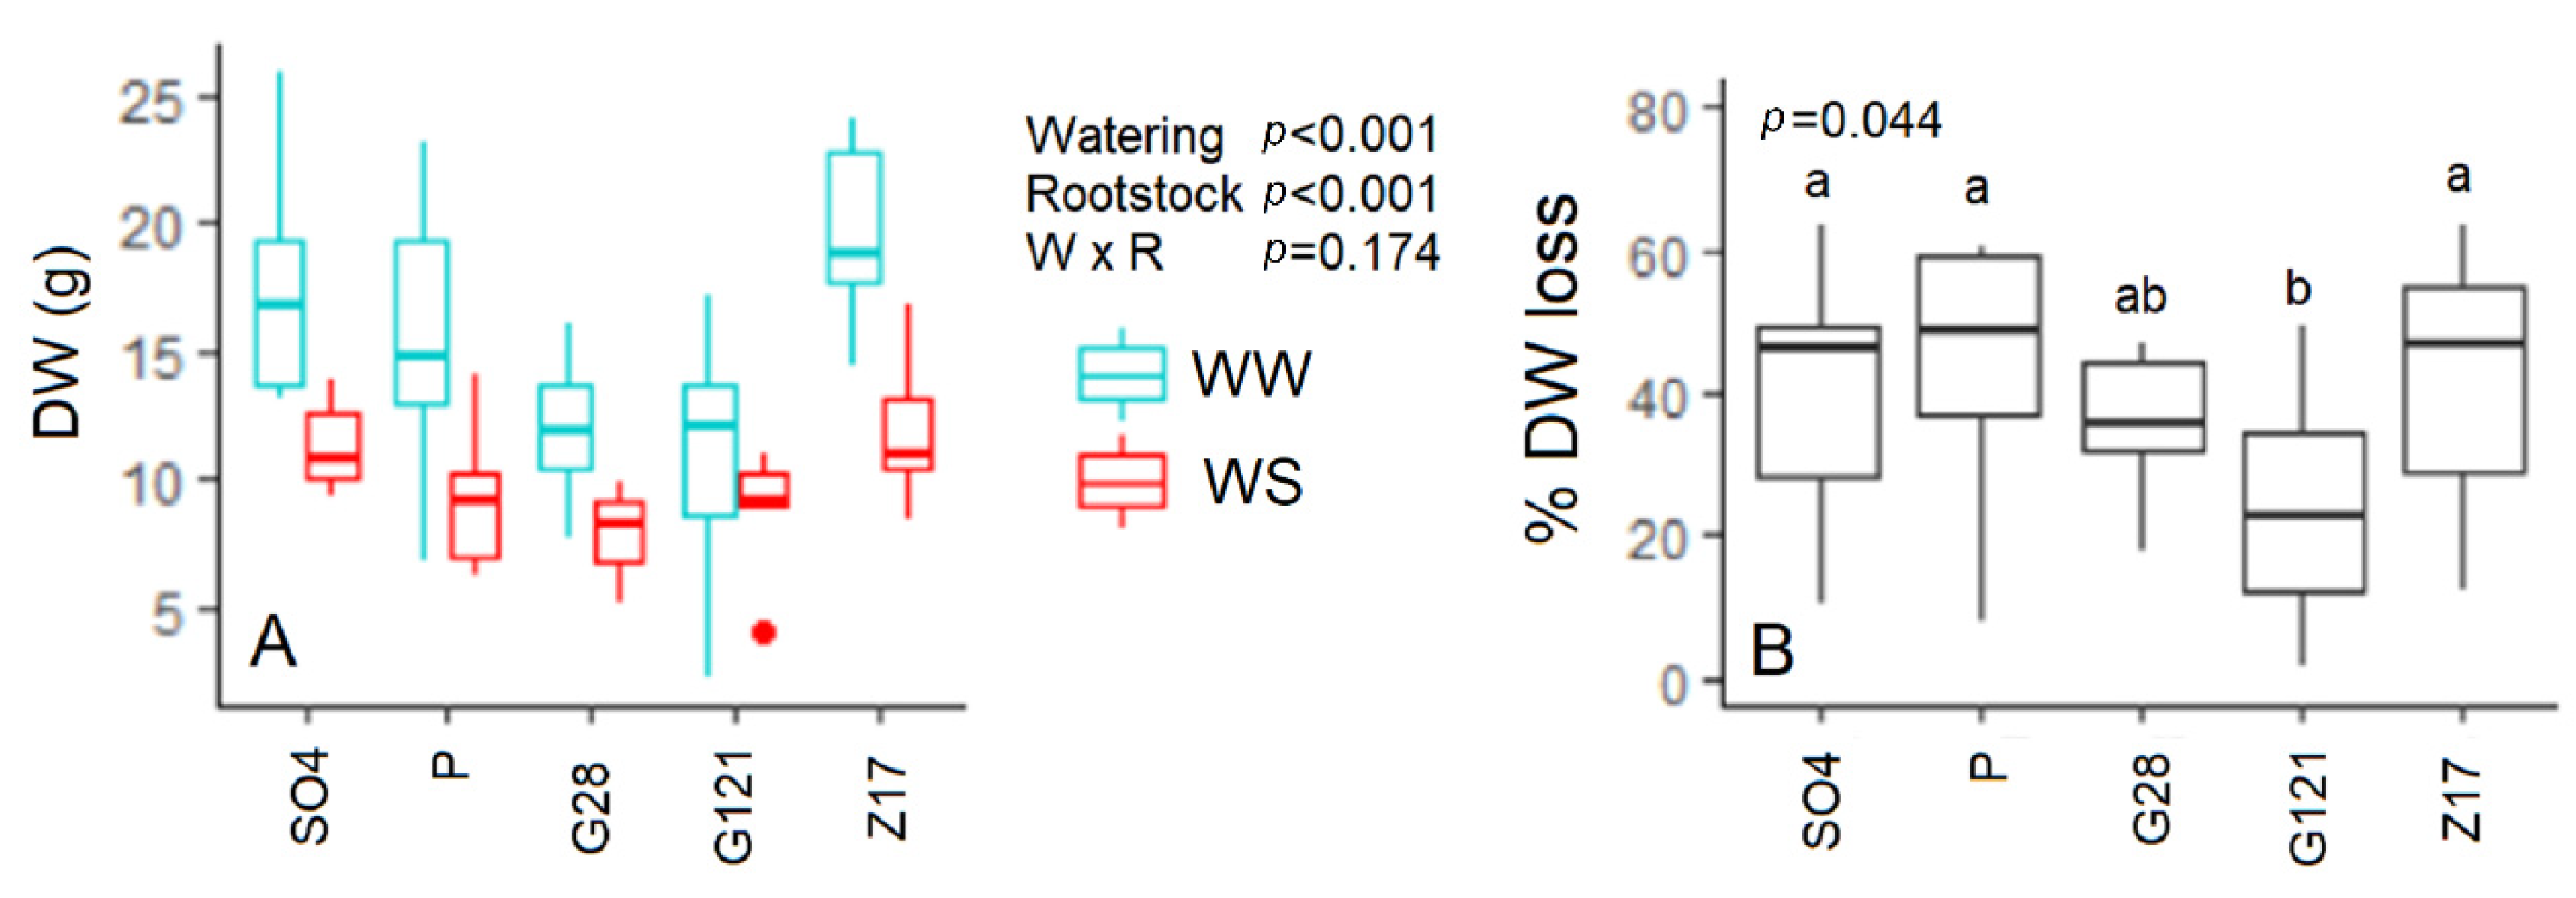
3.7. Biomass Dry Weight

Genotypic variation was observed under WW conditions between rootstocks for DW with P, SO4 and Z17 showing a more vigorous growth than G28 and G121 (p < 0.001) (Figure 9A). WS application for 14 days followed by a 5-day recovery period led to a significant (p < 0.001) reduction in biomass DW in all the rootstocks. However, while the extent of reduction was around 50% on average in P, SO4 and Z17, a 20 to 40% decrease only was observed in G28 and G121 (Figure 9B).

4. Discussion

4.1. Pinot gris Vigor and Physiological Traits Are Modulated by The Rootstock under Optimal Conditions

Rootstocks are essentials in vine industry due to their capacity to adapt a particular cultivar to stress and deliver preferable traits to the scion [29]. In a recent study and in line with our work, while little variation was observed for berry chemistry when Chardonnay and Cabernet Sauvignon were grafted on 15 rootstocks, most of induced changes by rootstock to scion were related to growth and physiological performances (e.g., yield and pruning weight) [30]. In Pinot gris, higher A and gs in SO4 and P at saturating and sub-saturating light conditions were accompanied by a larger number of stomata per unit of leaf area. These genotypes therefore yielded a higher whole-plant transpiration in Pinot gris when compared with G28 and G121. Similarly, higher vigor was observed in SO4 and P although Z17 showed the highest biomass DW and dynamic growth over the experimental period. High vigor in vine has been considered often a preferable trait, mainly due to the tight link between vigor and yield [30]. On the other hand, increasing reproductive and vegetative growth often results in a higher management workload for pruning and leaf thinning [31]. This study suggests that SO4, P and Z17 induced a high vigor, while G28 and G121 maintained lower leaf area in Pinot gris. By inducing lower vigor than P and SO4, G28 and G121 might be desirable rootstocks for reducing vine management costs in Pinot gris, although the direct effect on yield and grape composition should be further explored. In addition, our approach used to screen leaf area accumulation provide an easy and affordable method to quickly evaluate growth dynamics at early stages in pot vine and rootstock and to assess scion × rootstock interaction and responses under different environmental scenarios.
Serra et al. [2] showed that rootstock can affect stomata density and size (the determinant of gs per unit area) in Pinotage grafted on 140 Ruggeri showing lower stomatal density than 1103Paulsen. Similarly, P and to some extent SO4 had higher SD when compared with G28, G121 and Z17. Although the mechanisms are still not fully elucidated, it appears that different hydraulic conductivity may modulate daily plant water status and, therefore, affect leaf (cell division) and stomatal development (strongly dependent on light conditions and water availability) with larger hydraulic capacity associated with higher stomatal density [32]. On the same note, the response of WU to VPD, although linear for all the rootstocks, showed that G28 and G121 possess a more cautionary increase in WU at high levels of VPD than P, SO4 and Z17. This water-saving behavior under high VPD has been recently considered a preferable trait under drought condition [33] following sub-soil water conservation and potentially linked to limited root hydraulic conductivity and low involvement of aquaporins in water transport pathways [34]. Therefore, G28 and G121 induced a combination of water-saving behaviors in Pinot gris under optimal conditions (combination of low gs at saturating light, low SD, low vigor and high sensitivity of WU to increasing VPD) that can be advantageous when vine is relying on stored soil water availability only. On the other hand, since high gs and transpiration are key factors to overcome heat waves through enhancing leaf evaporative cooling and maintained photosynthesis [35,36], at least when soil water is fully available [36], low SD and gs might be detrimental under high temperature conditions. High vigor rootstocks have been shown to possess enhanced hydraulic conductivity partially owing to higher aquaporin activity [37] and high vigor vine have been shown to better perform than low vigor rootstocks under high temperature conditions [37]. In our experiment, when water was not limiting, no significant photoinhibition (lowered Fv/Fm, apart from Z17) was recorded between genotypes, suggesting a low association between leaf transpiration and heat tolerance at least in the environmental conditions applied in this work. Stomatal diurnal behavior (e.g., degree of midday depression and dynamic response to environmental cues) [36] may be largely involved in this discrepancy and can further explain some of the differences between genotypes observed in this work.

4.2. Rootstocks Induced Different Water Stress Tolerance Response in Pinot gris

It is not surprising that the literature indicates evident discrepancy in the response of vine to water stress as the same variety can behave as either iso- or anisohydric depending on environmental conditions (e.g., [19,20]). In addition, the same scion grafted on different rootstock can respond differently to environmental stresses [24] following a tight link that involves a complex communication network among the two plant parts. Our work suggests that the response of Pinot gris to water stress can be modulated by rootstock grafting. The most evident effect is the significant variation found for the response of LWP to soil dehydration with P and Z17 showing evident reduction in LWP while G28, G121 and to some extent SO4 maintained for a longer period a less negative value (Table S1). Therefore, while P and Z17 would be classified as near-anisohydric, G28 and G121 will fall into the isohydric class [17]. Whole plant transpiration confirms a higher stomatal sensitivity to water stress of G28 and G121, suggesting a pronounced stomatal control induced by these rootstocks. Gas exchange analysis, however, only partially confirms this trend with all rootstocks showing a significant degree of stomatal closure starting from DAT 6–8, while higher iWUE was observed for G28 when compared to the other rootstocks at DAT15 only. According to previous studies, the contrasting responses reported in this work might indicate that the rootstock induces different ABA accumulation and stomatal sensitivity to ABA [38], hydraulic signals [17], root aquaporins activity [37] and osmotic adjustment capacity [11]. For instance, P implies a risk taking anisohydric strategy with WU maintenance, early drops in LWP and high vigor consistent with previous work on this rootstock [2] and potentially suggesting a high root exploration strategy as drought avoidance. Indeed, rootstocks with higher inherent vigor seem to perform better than low vigor rootstocks under water deficit conditions [39]. Although a tight correlation between vigor and improved water uptake and transport [9] has been postulated, the effect of vigor on the stress tolerance of the scion is still not clear [40]. On the contrary, recent evidence indicates that the relationship between high vigor and stress resistance may not be as tight as previously thought [41] and deserves further work. Under natural field conditions, soil texture and depth influence root exploration capacity and might explain contradictory results [41] with vigorous rootstocks unable to exploit deep rooting when grown in shallow soils, thus limiting the possibility of transpiration maintenance under elevated temperatures following limited water resources [21]. Isohydric responses, such as the one displayed by G28 and G121, might confer significant advantages when root proliferation is unfeasible (e.g., shallow soils) and, therefore, stored soil water might become pivotal for plant performance. Hochberg et al. [42] also showed that Cabernet Sauvignon, a cultivar with a pronounced conservative behavior, compensate for lower gs by high rates of A and photorespiration thus enhancing iWUE and electron flow rates that may play a role in photoinhibition avoidance under terminal stress conditions. We partially confirm that isohydric behavior can be a desirable strategy in conditions of water stress as lower reduction in total biomass was observed for conservative rootstocks. However, caution must be taken in data interpretation as root growth in our settings was constrained by pot size and could hence be limiting avoidance strategies through deep root exploitation potentially implemented by P and Z17. Indeed, pot constraint can have a major effect on biomass allocation, nutrient uptake and root confinement and pot size has been shown to be a major determinant of biomass growth in crop plants grown in controlled environmental conditions [43]. Therefore, further field experiments are required to confirm the findings of this study.

5. Conclusions

Pinot gris grafted on different rootstocks shows substantial variation in water-saving strategies. G28 and G121 showed a consistent lower slope of WU WU to increased evaporative demand under well-watered conditions and further work should be focusing on the role of hydraulics on rootstock sensitivity to VPD. The near-isohydric behavior coupled with a less vigorous growth and lower steady state gs and stomatal density, led to a general water-saving behavior in G28 and G121, thus, in turn, to an insensitivity of biomass to WS. The significant variation in water responses of Pinot gris scion grafted on different rootstocks found in this work highlights the importance of rootstock choice. The more isohydric behavior imparted to the Pinot gris scion by G28 and G121 rootstocks compared with Z17, P and, to a lower extent SO4, indicates that these newer rootstocks could be advantageous under particular water-limited environments and areas characterized by shallow soil. Our study provides useful indications regarding the effect of rootstock on scion performance under water stress and suggests a series of different strategies that might help optimizing rootstock × scion choice in Pinot gris.

Supplementary Materials

The following are available online at https://www.mdpi.com/2073-4395/11/1/75/s1, Figure S1: Pipeline for RGB imaging and PLA estimation as well as relative correlation between PLA (non-destructive) and leaf area (destructive). Table S1: Summary of the physiological responses of Pinot gris to WS when grafted on different rootstocks.

Author Contributions

Conceptualization, M.F. and P.L.B.; Methodology, M.F.; Software, M.F.; Validation, P.L.B., M.B. and C.V.; Formal Analysis, M.F.; Investigation, M.F.; Resources, P.L.B.; Data Curation, M.F.; Writing—Original Draft Preparation, M.F.; Writing—Review and Editing, M.F., P.L.B., M.B. and C.V.; Visualization, M.F.; Supervision, M.B. and C.V.; Project Administration, C.V.; Funding Acquisition, C.V. All authors have read and agree to the published version of the manuscript.

Funding

This research received no external funding.

Data Availability Statement

The data of this study are available from the corresponding authors upon reasonable request.

Acknowledgments

The authors wish to thank Gabriele Quarati and Salvatore Mazzarello for help during data collection and Renzo Moscon and Mauro Ferrazza for helping with transplanting and plant management. We thank Damiano Gianelle for the use of the Licor 6400XT. The Autonomous Province of Trento is gratefully acknowledged for core funding of the Ecogenomics and Environmental Botany Group.

Conflicts of Interest

The authors declare no conflict of interest.

References

  1. Medrano, H.; Tomás, M.; Martorell, S.; Escalona, J.-M.; Pou, A.; Fuentes, S.; Flexas, J.; Bota, J. Improving water use efficiency of vineyards in semi-arid regions. A review. Agron. Sustain. Dev. 2015, 35, 499–517. [Google Scholar] [CrossRef] [Green Version]
  2. Serra, I.; Strever, A.; Myburgh, P.A.; Deloire, A. Review: The interaction between rootstocks and cultivars (Vitis vinifera L.) to enhance drought tolerance in grapevine. Aust. J. Grape Wine Res. 2014, 20, 1–14. [Google Scholar] [CrossRef]
  3. Van Leeuwen, C.; Destrac-Irvine, A.; Dubernet, M.; Duchêne, E.; Gowdy, M.; Marguerit, E.; Pieri, P.; Parker, A.; De Rességuier, L.; Ollat, N. An update on the impact of climate change in viticulture and potential adaptations. Agronomy 2019, 9, 514. [Google Scholar] [CrossRef] [Green Version]
  4. Medrano, H.; Escalona, J.M.; Cifre, J.; Bota, J.; Flexas, J. A ten-year study on the physiology of two Spanish grapevine cultivars under field conditions: Effects of water availability from leaf photosynthesis to grape yield and quality. Funct. Plant Biol. 2003, 30, 607–619. [Google Scholar] [CrossRef] [PubMed] [Green Version]
  5. Guilpart, N.; Metay, A.; Gary, C. Grapevine bud fertility and number of berries per bunch are determined by water and nitrogen stress around flowering in the previous year. Eur. J. Agron. 2014, 54, 9–20. [Google Scholar] [CrossRef]
  6. Marguerit, E.; Brendel, O.; Lebon, E.; Van Leeuwen, C.; Ollat, N. Rootstock control of scion transpiration and its acclimation to water deficit are controlled by different genes. New Phytol. 2012, 194, 416–429. [Google Scholar] [CrossRef] [PubMed]
  7. Frioni, T.; Biagioni, A.; Squeri, C.; Tombesi, S.; Gatti, M.; Poni, S. Grafting cv. grechetto gentile vines to new m4 rootstock improves leaf gas exchange and water status as compared to commercial 1103p rootstock. Agronomy 2020, 10, 708. [Google Scholar] [CrossRef]
  8. Vivier, M.A.; Pretorius, I.S. Genetically tailored grapevines for the wine industry. Trends Biotechnol. 2002, 20, 472–478. [Google Scholar] [CrossRef]
  9. Carbonneau, A. The Early Selection of Grapevine Rootstocks for Resistance to Drought Conditions. Am. J. Enol. Vitic. 1985, 36, 195–198. [Google Scholar]
  10. Tramontini, S.; Vitali, M.; Centioni, L.; Schubert, A.; Lovisolo, C. Rootstock control of scion response to water stress in grapevine. Environ. Exp. Bot. 2013, 93, 20–26. [Google Scholar] [CrossRef]
  11. Prinsi, B.; Negri, A.S.; Failla, O.; Scienza, A.; Espen, L. Root proteomic and metabolic analyses reveal specific responses to drought stress in differently tolerant grapevine rootstocks. BMC Plant Biol. 2018, 18, 1–28. [Google Scholar] [CrossRef] [PubMed]
  12. Ferlito, F.; Distefano, G.; Gentile, A.; Allegra, M.; Lakso, A.N.; Nicolosi, E. Scion—Rootstock interactions influence the growth and behaviour of the grapevine root system in a heavy clay soil. Aust. J. Grape Wine Res. 2020, 26, 68–78. [Google Scholar] [CrossRef]
  13. Tardieu, F. Any trait or trait-related allele can confer drought tolerance: Just design the right drought scenario. J. Exp. Bot. 2012, 63, 25–31. [Google Scholar] [CrossRef] [PubMed] [Green Version]
  14. Tardieu, F.; Simonneau, T.; Muller, B. The Physiological Basis of Drought Tolerance in Crop Plants: A Scenario-Dependent Probabilistic Approach. Annu. Rev. Plant Biol. 2018, 69, 733–759. [Google Scholar] [CrossRef] [Green Version]
  15. Douthe, C.; Medrano, H.; Tortosa, I.; Escalona, J.M.; Hernández-Montes, E.; Pou, A. Whole-plant water use in field grown grapevine: Seasonal and environmental effects on water and carbon balance. Front. Plant Sci. 2018, 9, 1540. [Google Scholar] [CrossRef]
  16. Romero, P.; Botía, P.; Navarro, J.M. Selecting rootstocks to improve vine performance and vineyard sustainability in deficit irrigated Monastrell grapevines under semiarid conditions. Agric. Water Manag. 2018, 209, 73–93. [Google Scholar] [CrossRef]
  17. Schultz, H.R. Differences in hydraulic architecture account for near-isohydric and anisohydric behaviour of two field-grown Vitis vinifera L. cultivars during drought. Plant Cell Environ. 2003, 26, 1393–1405. [Google Scholar] [CrossRef]
  18. Gerzon, E.; Biton, I.; Yaniv, Y.; Zemach, H.; Netzer, Y.; Schwartz, A.; Fait, A.; Ben-Ari, G. Grapevine anatomy as a possible determinant of isohydric or anisohydric behavior. Am. J. Enol. Vitic. 2015, 66, 340–347. [Google Scholar] [CrossRef]
  19. Hochberg, U.; Rockwell, F.E.; Holbrook, N.M.; Cochard, H. Iso/Anisohydry: A Plant-Environment Interaction Rather Than a Simple Hydraulic Trait. Trends Plant Sci. 2018, 23, 112–120. [Google Scholar] [CrossRef]
  20. Levin, A.D.; Williams, L.E.; Matthews, M.A. A continuum of stomatal responses to water deficits among 17 wine grape cultivars (Vitis vinifera). Funct. Plant Biol. 2020, 47, 11–25. [Google Scholar] [CrossRef]
  21. Koundouras, S.; Tsialtas, I.T.; Zioziou, E.; Nikolaou, N. Rootstock effects on the adaptive strategies of grapevine (Vitis vinifera L. cv. Cabernet-Sauvignon) under contrasting water status: Leaf physiological and structural responses. Agric. Ecosyst. Environ. 2008, 128, 86–96. [Google Scholar] [CrossRef]
  22. Galbignani, M.; Merli, M.C.; Magnanini, E.; Bernizzoni, F.; Talaverano, I.; Gatti, M.; Tombesi, S.; Palliotti, A.; Poni, S. Gas exchange and water-use efficiency of cv. Sangiovese grafted to rootstocks of varying water-deficit tolerance. Irrig. Sci. 2016, 34, 105–116. [Google Scholar] [CrossRef]
  23. Alsina, M.M.; Smart, D.R.; Bauerle, T.; De Herralde, F.; Biel, C.; Stockert, C.; Negron, C.; Save, R. Seasonal changes of whole root system conductance by a drought-tolerant grape root system. J. Exp. Bot. 2011, 62, 99–109. [Google Scholar] [CrossRef] [PubMed] [Green Version]
  24. Tandonnet, J.-P.; Cookson, S.J.; Vivin, P.; Ollat, N. Scion genotype controls biomass allocation and root development in grafted grapevine. Aust. J. Grape Wine Res. 2010, 16, 290–300. [Google Scholar] [CrossRef]
  25. Riaz, S.; Pap, D.; Uretsky, J.; Laucou, V.; Boursiquot, J.M.; Kocsis, L.; Walker, M.A. Genetic diversity and parentage analysis of grape rootstocks. Theor. Appl. Genet. 2019, 132, 1847–1860. [Google Scholar] [CrossRef] [PubMed]
  26. Vršič, S.; Kocsis, L.; Pulko, B. Influence of substrate pH on root growth, biomass and leaf mineral contents of grapevine rootstocks grown in pots. J. Agric. Sci. Technol. 2016, 18, 483–490. [Google Scholar]
  27. Müller-Linow, M.; Wilhelm, J.; Briese, C.; Wojciechowski, T.; Schurr, U.; Fiorani, F. Plant Screen Mobile: An open-source mobile device app for plant trait analysis. Plant Methods 2019, 15, 1–11. [Google Scholar] [CrossRef] [Green Version]
  28. Faralli, M.; Williams, K.S.; Han, J.; Corke, F.M.K.; Doonan, J.H.; Kettlewell, P.S. Water-Saving Traits Can Protect Wheat Grain Number Under Progressive Soil Drying at the Meiotic Stage: A Phenotyping Approach. J. Plant Growth Regul. 2019, 38, 1562–1573. [Google Scholar] [CrossRef]
  29. Albacete, A.; Martínez-Andújar, C.; Martínez-Pérez, A.; Thompson, A.J.; Dodd, I.C.; Pérez-Alfocea, F. Unravelling rootstock×scion interactions to improve food security. J. Exp. Bot. 2015, 66, 2211–2226. [Google Scholar] [CrossRef] [Green Version]
  30. Migicovsky, Z.; Cousins, P.; Jordan, L.M.; Myles, S.; Striegler, R.K.; Verdegaal, P.; Chitwood, D.H. Grapevine rootstocks affect growth-related phenotypes. bioRxiv 2020, 864850. [Google Scholar] [CrossRef] [Green Version]
  31. Rives, M. Vigour, pruning, cropping in the grapevine (Vitis vinifera L.). I. A literature review. Agronomie 2000, 20, 79–91. [Google Scholar] [CrossRef] [Green Version]
  32. Xu, Z.; Zhou, G. Responses of leaf stomatal density to water status and its relationship with photosynthesis in a grass. J. Exp. Bot. 2008, 59, 3317–3325. [Google Scholar] [CrossRef] [PubMed] [Green Version]
  33. Sinclair, T.R. Limited-Transpiration Rate Under Elevated Atmospheric Vapor Pressure Deficit. In Water-Conservation Traits to Increase Crop Yields in Water-Deficit Environments; Sinclair, T.R., Ed.; Springer: Berlin, Germany, 2017; pp. 11–16. ISBN 9783319563213. [Google Scholar]
  34. Sivasakthi, K.; Tharanya, M.; Kholová, J.; Muriuki, R.W.; Thirunalasundari, T.; Vadez, V. Chickpea genotypes contrasting for vigor and canopy conductance also differ in their dependence on different water transport pathways. Front. Plant Sci. 2017, 8, 1663. [Google Scholar] [CrossRef] [PubMed] [Green Version]
  35. Lawson, T.; Blatt, M.R.; Yu, L.; Shi, D.; Li, J.; Kong, Y.; Yu, Y.; Chai, G.; Hu, R.; Wang, J.; et al. Stomatal Size, Speed, and Responsiveness Impact on Photosynthesis and Water Use Efficiency. Plant Physiol. 2014, 164, 1556–1570. [Google Scholar] [CrossRef] [PubMed] [Green Version]
  36. Faralli, M.; Matthews, J.; Lawson, T. Exploiting natural variation and genetic manipulation of stomatal conductance for crop improvement. Curr. Opin. Plant Biol. 2019, 49, 1–7. [Google Scholar] [CrossRef] [PubMed]
  37. Gambetta, G.A.; Manuck, C.M.; Drucker, S.T.; Shaghasi, T.; Fort, K.; Matthews, M.A.; Walker, M.A.; McElrone, A.J. The relationship between root hydraulics and scion vigour across Vitis rootstocks: What role do root aquaporins play? J. Exp. Bot. 2012, 63, 6445–6455. [Google Scholar] [CrossRef]
  38. Tombesi, S.; Nardini, A.; Frioni, T.; Soccolini, M.; Zadra, C.; Farinelli, D.; Poni, S.; Palliotti, A. Stomatal closure is induced by hydraulic signals and maintained by ABA in drought-stressed grapevine. Sci. Rep. 2015, 5, 1–12. [Google Scholar] [CrossRef]
  39. Williams, L.E. Interaction of rootstock and applied water amounts at various fractions of estimated evapotranspiration (ETc) on productivity of Cabernet Sauvignon. Aust. J. Grape Wine Res. 2010, 16, 434–444. [Google Scholar] [CrossRef]
  40. Jones, H.G. How do rootstocks control shoot water relations? New Phytol. 2012, 194, 301–303. [Google Scholar] [CrossRef]
  41. Zhang, L.; Marguerit, E.; Rossdeutsch, L.; Ollat, N.; Gambetta, G.A. The influence of grapevine rootstocks on scion growth and drought resistance. Theor. Exp. Plant Physiol. 2016, 28, 143–157. [Google Scholar] [CrossRef]
  42. Hochberg, U.; Degu, A.; Fait, A.; Rachmilevitch, S. Near isohydric grapevine cultivar displays higher photosynthetic efficiency and photorespiration rates under drought stress as compared with near anisohydric grapevine cultivar. Physiol. Plant. 2013, 147, 443–452. [Google Scholar] [CrossRef] [PubMed]
  43. Poorter, H.; Bühler, J.; Van Dusschoten, D.; Climent, J.; Postma, J.A. Pot size matters: A meta-analysis of the effects of rooting volume on plant growth. Funct. Plant Biol. 2012, 39, 839–850. [Google Scholar] [CrossRef] [PubMed] [Green Version]
Figure 1. Average daily environmental conditions during the experimental period (21 July 2020 until 7 August 2020) Red background in the graphs represent stress application to WS pots while blue background represent the recovery period. (A) Average air temperature, (B) average relative humidity and (C) average vapor pressure deficit (VPD). Values are means ± standard error of the means.
Agronomy 11 00075 g001
Figure 2. Light (PPFD) response curves for Pinot gris grafted on five rootsotcks measured under optimal environmental conditions (n = 4). (A) CO2 assimilation rate (A), (B) stomatal conductance (gs), (C) sub-stomatal CO2 concentration (Ci), (D) transpiration rate (E) measured at of 400 μmol mol−1 ambient CO2 concentration, leaf temperature of 25 °C and VPD of between 1 and 1.5 kPa (values are means ± standard error of the means). Asterisks show significant differences (p < 0.05) between rootstocks according to one-way ANOVA. In (E), leaf stomatal density (SD) is shown (p < 0.001). Different letters represent significant differences according to Fisher’s test.
Agronomy 11 00075 g002
Figure 3. (A) Average fraction of transpirable soil water (FTSW) for WW (blue dots) and WS (red dots) during the experimental period. (B) Daily WU for WW (blue dots) and WS (red dots) during the experimental period. DAT represents days after water stress application. Red background in the graphs represents stress application to WS pots while blue background represents the recovery period. Data are means (n = 6–9) ± standard error of the means.
Agronomy 11 00075 g003
Figure 4. Plots of normalized water use (between 0 to1) to FTSW for each rootstocks (AE). Error bars represent standard error of the means (SEM, n = 6–9). Data for estimated values from logistic fit are shown in the graphs and slope was significant (p = 0.021) according to one-way ANOVA and different letters represent significant differences according to Fisher’s test. Arrows represent the level of FTSW at which WU was reduced. (FJ) Relationship between WU and VPD for all the rootstocks. The slope and r2 for each linear fit are shown in the graph and the slope of the regression was significantly different (p = 0.008, n = 6–9) according to one-way ANOVA. Different letters represent significant differences according to Fisher’s test. Grey area represents confidence interval.
Agronomy 11 00075 g004
Figure 5. PLA for Pinot gris grafted on different rootstocks collected over the experimental period and for plants subjected to well-watered (WW) and water-stressed conditions (WS). Asterisks represent significant differences between WW and WS for each rootstock. The p-value from two-way ANOVA is shown for each DAT and factor while ns represent non-significant differences. Data shown are means ± standard error of the means (SEM, n = 6–9).
Agronomy 11 00075 g005
Figure 6. Changes (%) in leaf water potential (LWP) for plants subjected to water stress (WS) and compared with plants under well-watered conditions (WW) measured with a Scholander pressure bomb in five rootstocks. The p-value from two-way ANOVA is shown for each DAT and factor while ns represent non-significant differences. Asterisks represent significant differences between WW and WS for each rootstock. Data shown are means ± standard error of the means (SEM, n = 3).
Agronomy 11 00075 g006
Figure 7. In vivo assessment of daily changes in CO2 assimilation rate (A), stomatal conductance (gs) and intrinsic water-use efficiency (iWUE) of Pinot gris grafted on five rootstocks and subjected to well-watered (WW, blue dots) and water stress (WS, red dots) conditions. Red background represents the length of stress application, blue background recovery. Two-way ANOVA p-values are shown in the graphs for both A and gs and for each DAT. Asterisks denote significant differences according to one-way ANOVA between WW and WS for each trait and rootstock. Data shown are means ± standard error of the means (SEM, n = 4–5).
Agronomy 11 00075 g007
Figure 8. Maximum quantum yield of photosystem II (PSII) in dark adapted samples (Fv/Fm) carried out in all the rootstocks subjected to WW and WS (n = 5). Data were recorded in the morning (average T 24 °C) and repeated in the afternoon (average T 41 °C) hence simulating heat stress conditions. The p-values from three-way ANOVA are shown in the graph.
Agronomy 11 00075 g008
Figure 9. (A) Biomass above ground dry weight (DW) for the five rootstocks used in this work under well-watered (WW) and water-stress (WS) conditions (n = 6–9). The p-values from two-way ANOVA are shown in the graph. (B) Decrease in DW for WS expressed as % of WW plants. Different letters represent significant differences according to Fisher’s test (n = 6–9). The p-value from one-way ANOVA is shown in the graph.
Agronomy 11 00075 g009
Publisher’s Note: MDPI stays neutral with regard to jurisdictional claims in published maps and institutional affiliations.

