Article

Simulating the Response of Drought–Tolerant Maize Varieties to Nitrogen Application in Contrasting Environments in the Nigeria Savannas Using the APSIM Model

1
Centre for Dryland Agriculture, Bayero University, Kano 700241, Nigeria
2
International Institute of Tropical Agriculture (IITA), P.M.B. 5320, Oyo Rd, Ibadan 200211, Nigeria
3
International Crop Research Institute for Semi-Arid Tropics (ICRISAT), Ibadan 200001, Nigeria
4
Department of Meteorology and Climate Science, Federal University of Technology, Akure PMB 704, Nigeria
*
Author to whom correspondence should be addressed.
Agronomy 2021, 11(1), 76; https://doi.org/10.3390/agronomy11010076
Submission received: 17 November 2020 / Revised: 25 December 2020 / Accepted: 27 December 2020 / Published: 31 December 2020

Abstract

:
This paper assessed the application of the Agricultural Production Systems sIMulator (APSIM)–maize module as a decision support tool for optimizing nitrogen application to determine yield and net return of maize production under current agricultural practices in the Nigeria savannas. The model was calibrated for two maize varieties using data from field experiments conducted under optimum conditions in three locations during the 2017 and 2018 cropping seasons. The model was evaluated using an independent dataset from an experiment conducted under different nitrogen (N) levels in two locations within Southern and Northern Guinea savannas. The results show that model accurately predicted days to 50% anthesis and physiological maturity, leaf area index (LAI), grain yield and total dry matter (TDM) of both varieties with low RMSE and RMSEn (%) values within the range of acceptable statistics indices. Based on 31-year seasonal simulation, optimum mean grain yield of 3941 kg ha−1 for Abuja, and 4549 for Kano was simulated at N rate of 120 kg ha–1 for the early maturing variety 2009EVDT. Meanwhile in Zaria, optimum mean yield of 4173 kg ha–1 was simulated at N rate of 90 kg ha−1. For the intermediate maturing variety, IWDC2SYNF2 mean optimum yields of 5152, 5462, and 4849 kg ha−1, were simulated at N application of 120 kg ha−1 for all the locations. The probability of exceeding attainable mean grain yield of 3000 and 4000 kg ha−1 for 2009EVDT and IWDC2SYNF2, respectively would be expected in 95% of the years with application of 90 kg N ha−1 across the three sites. Following the profitability scenarios analysis, the realistic net incomes of US$ 536 ha–1 for Abuja, and US$ 657 ha−1 for Zaria were estimated at N rate of 90 kg ha−1 and at Kano site, realistic net income of US$ 720 ha–1was estimated at N rate of 120 kg ha−1 for 2009EVDT.For IWDC2SYNF2, realistic net incomes of US$ 870, 974, and 818 ha−1 were estimated at N application of 120 kg ha−1 for Abuja, Zaria, and Kano respectively. The result of this study suggests that 90 kg N ha−1 can be recommended for 2009EVDT and 120 kg N ha–1 for IWDC2SYNF2 in Abuja and Zaria while in Kano, 120 kg N ha−1 should be applied to both varieties to attain optimum yield and profit.

1. Introduction

Maize (Zea mays L.) is the most widely grown arable cereal crop in Nigeria [1] and an important food crop grown for human consumption with estimated above 20 million, livestock feed, and industrial raw materials [2]. Due to the importance of maize in Nigeria, its production has significantly increased from 0.66 M tons in 1978, to about 11.3 M tons in 2013 [3,4], replacing traditional cereals like sorghum and pearl millet [5,6]. Despite the increase in maize production, average grain yield of maize in Nigeria over the last several decades has been oscillating around 1.8 to 2 t ha−1 [5,7], which is far less than the yield of about 5.9 t ha−1 of the world average. The low grain yields are mainly due to inherent soil infertility, low soil nutrient reserves especially nitrogen, inadequate nutrient replenishment [8,9] and frequent droughts [4].
Inherent soil infertility in the Nigeria Savannas limit the intensification of maize production. Savanna soils are predominantly sandy Lixisols, Acrisols, and Cambisols with low activity clays (like kaolinite), low organic matter contents, low nutrient reserves, and prone to water and wind erosions [9,10,11]. Nitrogen is the most limiting nutrient for increased maize productivity in the Nigeria Savannas [12]. Farmers in these regions mostly amend maize with <20 kg/ha–1 N or grow maize without inorganic N fertilization [10] resulting into low yields. The N fertilizer input use in the Nigeria savannas is constrained by high price and poor access [10], its low recovery due to losses through denitrification, ammonia volatilization, run off, and leaching [13].
Significant progress has been made in the development and deployment of some extra–early, early, and late maize varieties that combine resistance/tolerance to the parasitic weed (Striga) with drought tolerance [14], making them adaptable to the conditions in the savanna agro-ecologies. These varieties have also been reported to perform well under low–N conditions probably due to their good root development [15]. However, little information exists on the optimum N fertilizer needs of these varieties for specific agroecology within the savannas. Fertilizer recommendations in Nigeria are presently uniform for all maize varieties grown across diverse climatic and edaphic or agro-ecological environments [10]. This could result in inefficient and unbalanced fertilizer use and poor economic returns for the farmer [7]. Soils in the savannas are heterogeneous and weather conditions vary with agro-ecological zones and locations, making blanket fertilizer recommendations for savanna regions unrealistic. The published N, P, and K recommendation per hectare is 120 kg N, 60 kg phosphorus pentoxide (P2O5), and 60 kg dipotassium oxide (K2O) for all maize varieties across the Sahel, Sudan and Guinea Savannas [10]. This fertilizer recommendation does not account for the differences in the maturity periods of the different maize varieties released, their nutrient requirements and nutrient use efficiencies. Increased maize productivity in the savannas requires a better understanding of the optimum nitrogen level needed, according to the needs of location and varieties.
The long-term use of traditional field experimentation is suitable to assess the impact of management practices in crop production across diverse agro-ecologies. However, long–term studies are limited by inherent costs and time needed to maintain such studies. Dynamic crop simulation models coupled to decision support systems may help reducing that gap [16]. The use of a well–tested crop growth models such as Agricultural Production Systems simulator (APSIM) has proven effective and excellent to analyze the complex interactions in crop production [17,18] especially when considering the combined effects of weather uncertainties and fertilization strategies on yield and profitability [19]. Optimum fertilizer rates have been determined for some early maturing varieties in the Sudan savanna using the Crop Environment Resource Synthesis (CERES) model [19]. Jagtap, et al. [20] also reported optimum fertilizer application rates for some early maturing varieties in the Sudan savanna agroecology using CERES-Maize model. However, optimum N application rates for drought-tolerant maize varieties released for the Nigeria savannas have not been fully evaluated. The APSIM model is a useful tool to support the site-specific N fertilizer recommendations after careful calibration and evaluation [16].
The capability of APSIM to simulate crop growth and development either for a single cropping system or in mixtures (intercropping), rotation and weed management makes it more suitable to be used in African farming system [17]. In addition, APSIM parameterization performed better to variations of soil type, weather and management practices across the different agro-ecologies [21,22]. The APSIM model has been used successfully in the search for strategies for more efficient production, improved risk management, crop adaptation and sustainable production [16,21]. In a study by MacCarthy et al. [23] in the semi–arid areas of Ghana, the APSIM model adequately predicted the grain yield response of sorghum to both N and P applications. In Kenya, the model simulated P responses in maize and beans grown on contrasting soil types and adequately reproduced their observed grain yields [24]. The seasonal simulations by Kisaka et al. [16] showed that application of low rates of N (0, 20 and 40 kg N ha–1) had low inter–seasonal variations in yields compared to the use of high N rates (60 and 80 kg N ha–1). Results of the calibration and evaluation of the APSIM model in northern Nigeria showed that the model replicated the observed yield of two sorghum varieties [25]. For the two varieties, optimum grain yield was simulated at 60 kg N ha–1 in the Sudano–Sahelian zone, 80 kg N ha–1 in the Sudan savanna zone and 40 kg N ha–1 in the northern Guinea savanna. Fosu–Menshet al. [26] similarly used the APSIM model to simulate the impact of seasonal climate variation on the response of maize to inorganic fertilizer in the sub–humid of Ghana. The simulation result indicated that the model was able to reproduce the response of maize to water, N and P, and hence simulated maize grain yields with a coefficient of correlation (R2) of 0.90 and 0.88 for the maize varieties used. In central Malawi, Kamanga et al. [27] used the APSIM–model as a decision support-tool for improving the efficiency of the use of small amounts of nitrogen and phosphorus fertilizer on smallholder maize. The model predicted that similar or larger maize yield responses to 15 or 30 kg N ha−1 can be expected in 8 out of 10 years. The objectives of this study were to (i) calibrate and validate APSIM–maize module for two contrasting drought-tolerant maize varieties and evaluate the performance for simulating growth, phenology and yields; (ii) determine optimum yield and net return of two contrasting drought-tolerant maize varieties under different nitrogen fertilizer applications in the selected sites in the savannas agro-ecologies. This study will serve as actionable guidance for increase fertilizer-use by smallholder farmers, thereby increasing maize productivity and enhance food security in the semi-arid environments.

2. Materials and Methods

2.1. Description of Study Area

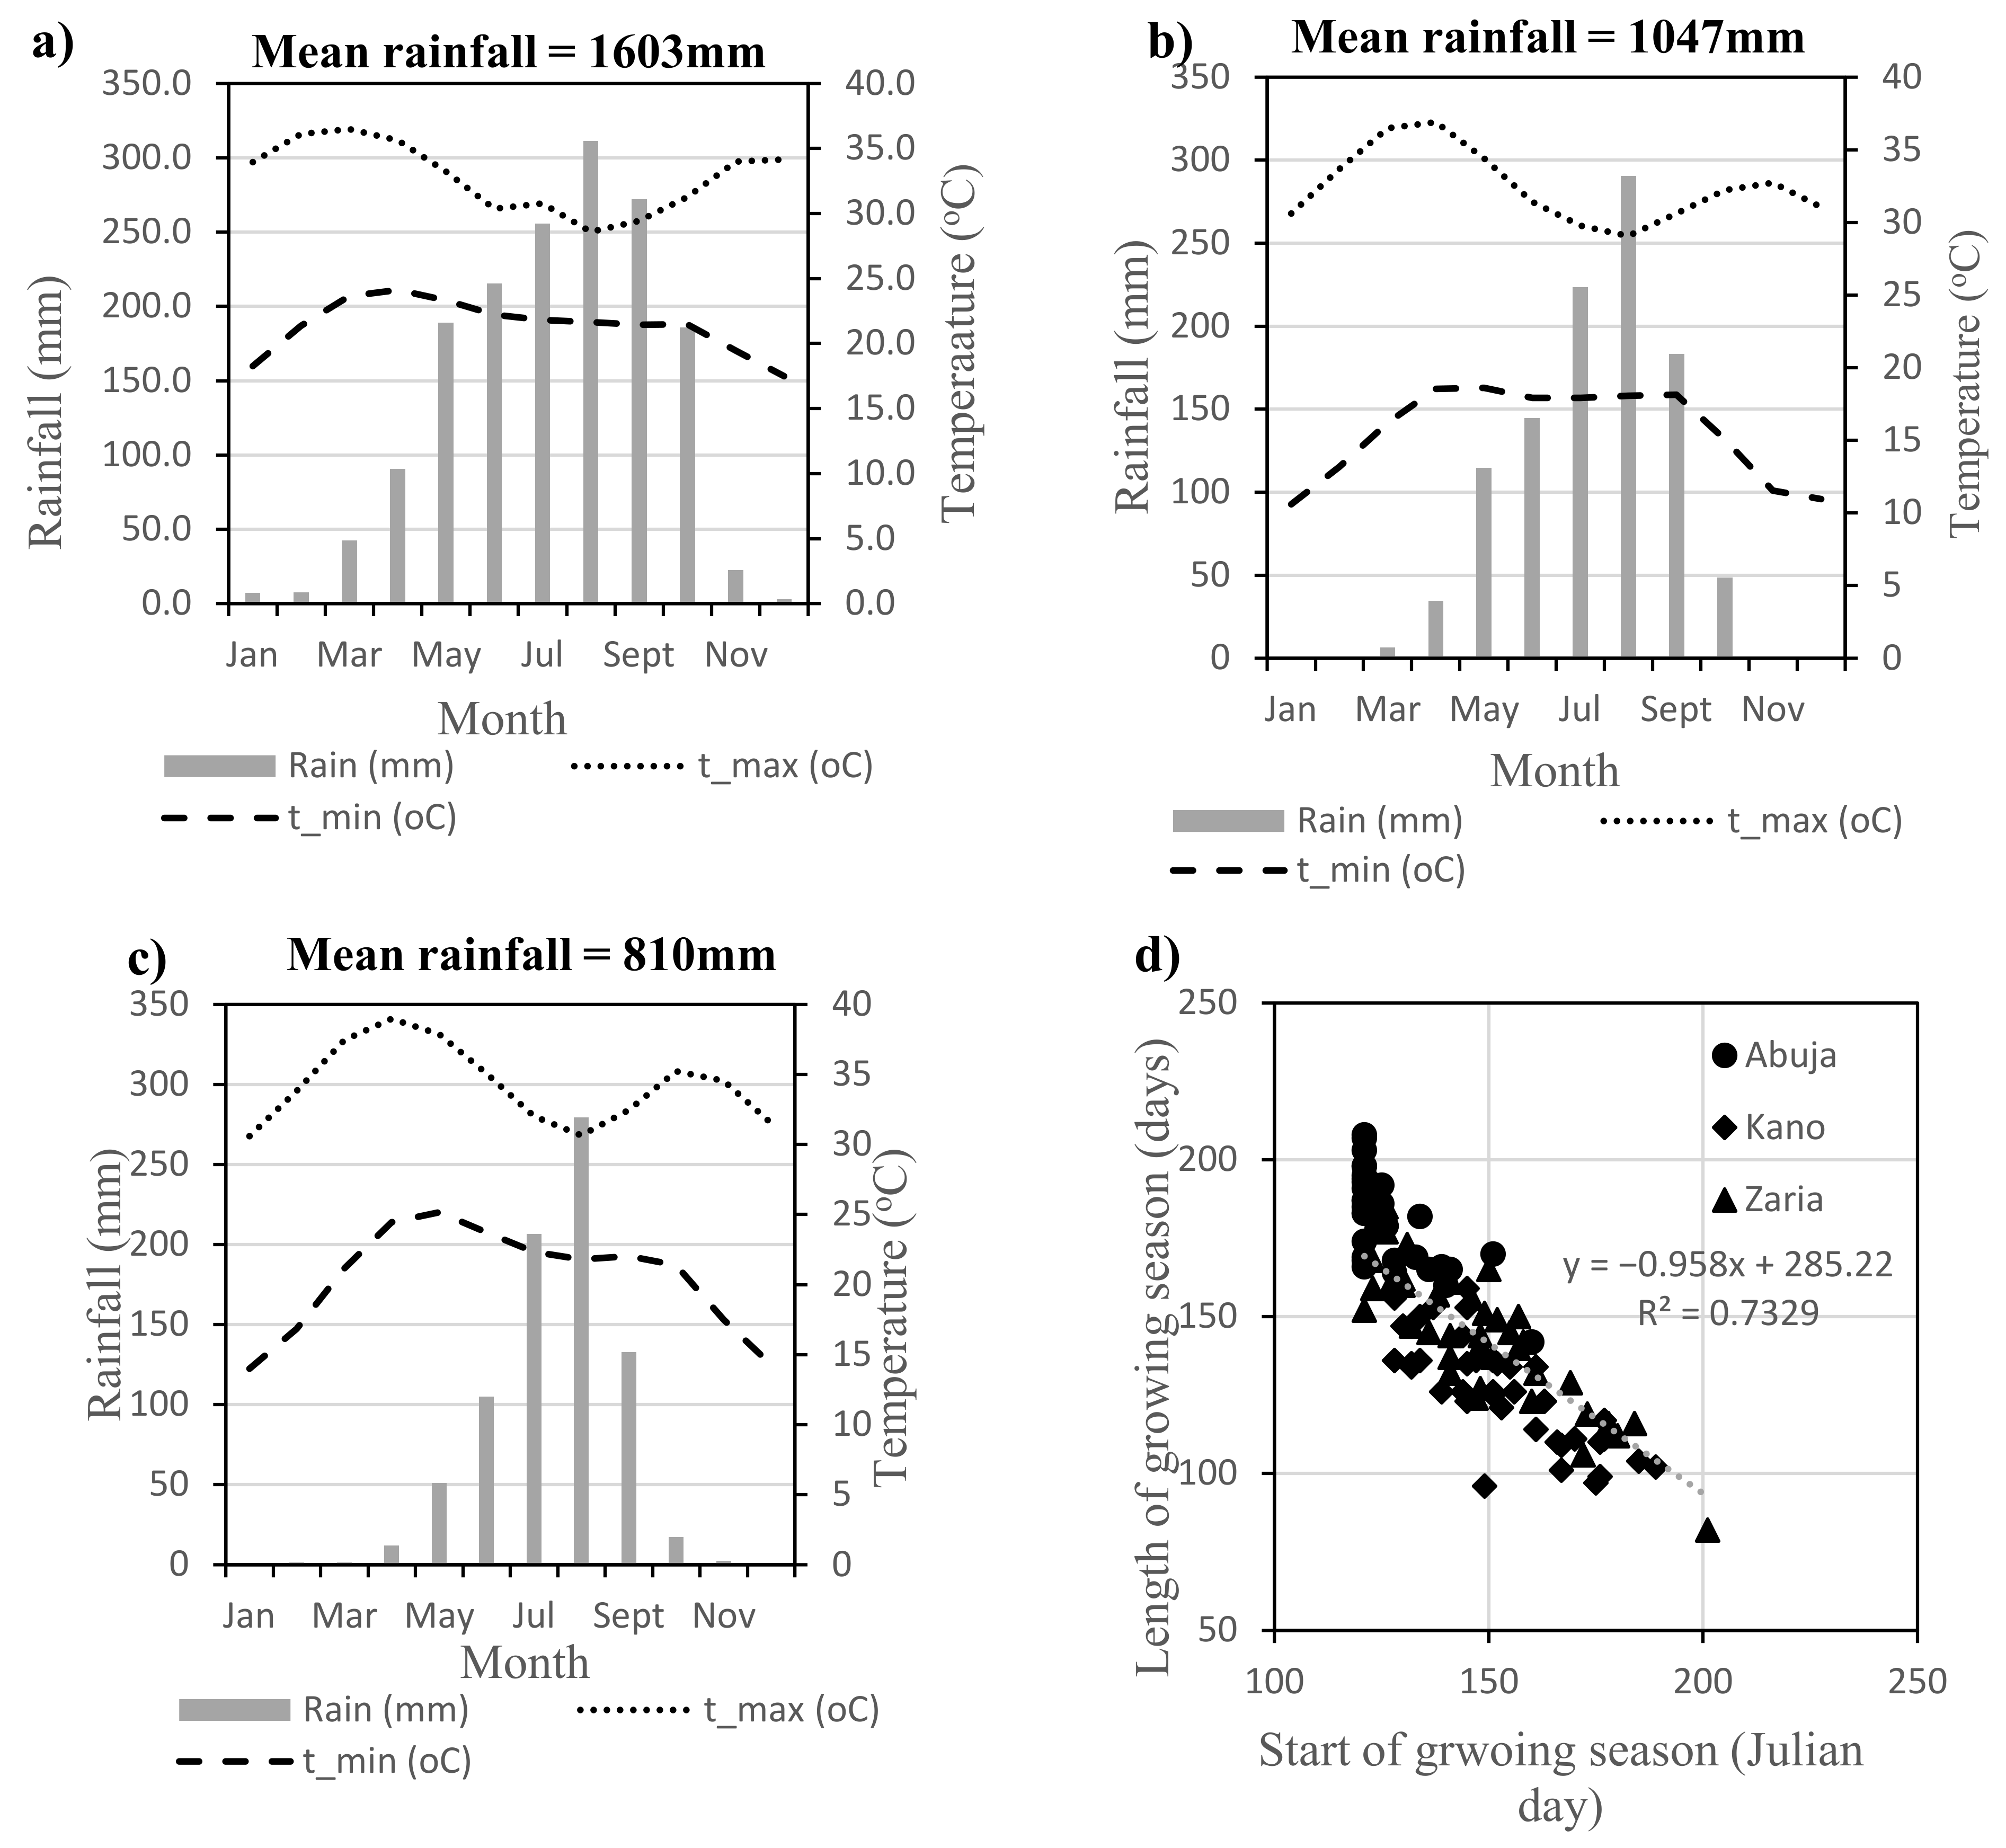
The study sites were Abuja (9°9′ N 7° 20′ E 447 m a.s.l.), in the southern Guinea savanna (SGS) zone, Zaria (11°1′ N 7°37′ E 681 m a.s.l.) in the northern Guinea savanna (NGS) zone and Kano (11°59′ N 8°25′ E 466 m a.s.l.) and Dambatta (12°19′ N 8°31′ E 504 m a.s.l.) in the Sudan Savanna (SS) zone. Temperature varies annually and seasonally over the SGS zone with average maximum temperature in the growing season within the range of 26–28 °C whereas minimum temperature ranges between 18–22 °C [28,29,30]. Rainfall distribution in the zone is unimodal. Average annual rainfall range between 1000 mm to 1524 mm and spread over 181–210 days which defines the growing season [29,30]. The soils in this zone have been identified mainly as Lithosols, Ferralic combisols, Fericacrisols, Oxichaplustalfs and Luvisols [31]. The average maximum temperature in the NGS zone ranges from 27–30 °C during the growing season, whereas average minimum temperature during the growing season is around 20–22 °C [29]. Mean annual rainfall in the zone is approximately 1125 mm and the length of the growing season range between 151–180 days [30]. The dominant soil types mainly found in the NGS according to the FAO classification are Luvisols, Acrisols, Ferralsols and Lithosols [31]. The SS generally has a shorter growing season around 90 days with mean annual rainfall of 600–800 mm [19]. The SS is characterized by high average annual minimum temperature in the range 33–38 °C during the growing season, whereas average minimum temperature range between 22 and 26 °C [4]. The soil types mainly found in the SS zone are Alfisols, Inceptisols, Entisols and Vertisols [32].

2.2. Soil and Weather Data at the Experimental and Model Application Sites

Soil profiles were dug at each of the experimental sites and at sites selected for model application for characterization using the analytical procedures of IITA [33]. The soil samples were collected from different soil profile, prepared and analyzed for physio–chemical properties. The samples were air-dried, gently crushed with porcelain pestle and mortar and sieved through 2 mm mesh prior to analysis. The fine soil samples were analyzed for the relevant soil parameters required for modelling including soil texture, chemical proprieties, and organic carbon at the Analytical Services Laboratory of the International Institute of Tropical Agriculture (IITA), Ibadan, Nigeria following the analytical procedures by IITA [33]. Soil fertility ratings of Esu [34], Landon [35] and NSPFS [36] were used in interpreting the results obtained in this study. Soil water characteristics such as lower limit (LL), drain upper limit (DUL), and saturated water content (SAT) were not determined at the time of analyzing the soils and were therefore derived from pedo-transfer functions developed by Saxton and Rawls [37]. The generic horizons of the profiles and soil types were classified using the FAO guidelines [38]. After carrying out all analysis, the soils were classified to the sub-group level before being entered into the APSIM soil module.
Weather data including daily solar radiation, daily maximum and minimum air temperature, and daily precipitation were obtained directly from an automated watchdog weather station device (2000 Series, Spectrum Technologies, Aurora, IL, USA) installed within 2 km radius to the experimental fields established for model calibration and validation. Daily long-term weather data on rainfall, minimum and maximum temperature and solar radiation were collected from the Nigerian Meteorological Agency (NIMET, Port Harcourt, Nigeria) for a period of 31-year (1985–2015) in order to simulate maize response to varying N application rates on contrasting soils in the selected sites within Nigeria savannas.

2.3. Experiments for Model Calibration and Validation

To calibrate the APSIM–maize modules, a total of 9 on-station field trials were conducted during the 2017 and 2018 cropping season. Three (3) trials were conducted in 2017 consisting of 1 trial per site while in 2018, 6 trials were conducted and consisted of 2 trials per site. Two drought-tolerant maize varieties (2009EVDT and IWDC2SYNF2) with contrasting maturity period were used in the trial. The 2009EVDT is an early maturing variety (matures between 90–95 days) and IWDC2SYNF2 is a medium maturing variety (matures between 100–110 days). The experiments were laid out as a single factor experiment in a randomized complete block design (RCBD) with three replications. The plots contained four ridges of 3 × 5 m2 (15m2), spaced at 0.75 m. In 2017 growing season, planting was done on 4th July at Zaria, 3rd July at BUK–Kano and 1st July at Dambatta. In 2018, the experiments were planted on 14 June and 27 June at Zaria, 27 June and 10 July at BUK–Kano and on 26 June and 9 July at Dambatta. Planting was done at a spacing of 0.25 m between stands and 0.75 m between rows to give a plant population of 53,333 plants ha−1. Two seeds were planted and later thinned to 1 plant per stand at 2 weeks after sowing. Inorganic fertilizer; was applied at the rate of 120, 60, 60 kg ha−1 for N, P205 and K2O respectively. NPK 15–15–15 was used to supply the full doses of K and P and 50% of N one week after planting (WAP). Another 60 kg N ha−1 in the form of urea was applied 5 WAP. Optimum conditions of fertilization and supplementary irrigation was applied when necessary to reduce the effect of non-limiting conditions of plant nutrition and water stress during growth and development of the plants.
Another trial was established in two locations to obtain independent experimental data sets for the validation of the model after successful calibration. The data sets were obtained from trials established under rain-fed conditions at the International Institute of Tropical Agriculture (IITA, Oyo, Nigeria) experiment station, Abuja and at the Institute of Agricultural Research Farm Ahmadu Bello University Farm, Zaria, Nigeria during the 2016 and 2017 growing seasons. The experiments were laid out in a split-plot factorial arrangement. The main plot had five levels of nitrogen varied from 0–120 kg ha−1 at 30 kg ha−1 interval while the subplots consisted of maize varieties. Each experiment had three replications with a subplot measuring 15 m2 containing four rows of 0.75 m apart and 5 m in length with intra row spacing of 0.25 m between stands which gave a plant population of 53,333 plants ha−1. At Abuja the experiments were planted on 19 June in 2016 and 17 June in 2017 cropping season. At Zaria, the experiments were planted on 25th June in 2016 and 20th June in 2017.Phosphorus in the form of SSP (Single Super phosphate) and potassium in the form of MOP (Muriate of Potash) were applied at constant rate of 60 kg ha−1 at planting. Nitrogen in the form of urea was applied twice in the N treatment plots. First dose of each nitrogen rate was applied 1 WAP (week after planting) and the second dose at 5 WAP. A mixture of gramaxone (1:1–dimethyl–4, 4–bipyridinum dichloride, manufactured by Syngenta Crop protection AG, Switzerland) and primextra (Atrazine 223 gL−1 + Metolachlor 277 gL−1, manufactured by Syngenta Crop protection AG, Basel, Switzerland) was applied at a rate of 1 L ha−1 each to control weeds using knapsack sprayer. Manual weeding was done at 2 and 7 weeks after planting (WAP) to control late emerging weeds.

2.4. Crop Data Collection and Measurements

Days from sowing to 50% pollen shed and days from sowing to 95% physiological maturity were determined using plants in the two middle rows of each plot. Leaf area index (LAI) was measured using AccuPAR model LP–80 PAR/LAI Ceptometer (Decagon Devices, Pullman, WA, USA). At maturity, the two middle rows in each plot measuring 7.5 m2 were harvested for dry matter determination. The samples were separated into leaves, stem, cobs and grain and dried at 60 °C for 76 h in a force-draft oven to constant weight. Leaf, stem, cob and grain weight were summed to calculate total dry matter (TDM) in kg ha−1. The number of ears and grains per plant were computed from 5-randomly selected maize stand in each plot, threshed and measured. For grain yield determination, plants from the two middle rows excluding the quadrat area were hand-cut at the soil surface. Maize ears were removed, sun–dried for one week and shelled. Grains were weighed and added to those from the quadrat area, and final grain yield was expressed in kg ha−1, adjusted to 12% moisture content using Farmex MT–16 grain moisture tester.

2.5. APSIM Model Description

The APSIM is a farming systems model that consists of several modules that are integrated to perform farming systems simulation based on environmental variables [39]. The APSIM modelling structure includes biophysical modules, management modules, data input and output modules, and a simulation engine module [17]. Several modules and sub modules developed by many different researchers have been integrated into the APSIM framework for farm system analysis. APSIM simulates yield in response to inputs of daily weather (solar radiation, rainfall, minimum and maximum temperature), crop genetic information, soil properties (such as field capacity, wilting point, bulk density, saturated soil water content, soil OC, pH, nitrate, and labile P) and crop management practices [17]. The model uses two soil water balance approaches described by either SoilWat (a “cascading bucket” approach) or APSWIM (Richards’ equation approach) [40]. The soil water module (soilwat2) utilizes the cascading soil water balance model [17] which works on a daily time step basis to simulate water balance. Soil water varies between LL and the SAT. Excess water above the SAT drains to the next lower layer. It is specified by the field capacity (dul), lower limit (ll) of extractable water and the saturated water content of the soil (sat). The bare soil runoff curve number (cn2_bare) determines the proportion of rainfall that infiltrates and how much is lost through surface runoff. Soil evaporation is assumed to take place in 2 stages (i) constant and the (ii) falling rate stages. Further details on the APSIM model are provided by Keating et al. [17].

2.6. APSIM Model Calibration Procedure

The maize module was calibrated within the (APSIM v.7.9) framework for the two maize varieties. Soil data described, characterized, and classified to the sub-group level at each of the experimental locations were entered into the APSIM soil module. Weather data collected from the experimental fields were converted to APSIM met file and imported into the model. The input data for the two maize varieties include crop management information, phenology, yield and yield components. Five (5) in-built modules within the APSIM frame work (crop module (APSIM–maize), soil water module (SoilWat), soil nitrogen module (Soiln), residue module (Residue) and the manure module (Manure)) were linked and used accordingly. Soil water dynamics between soil layers were defined by the cascading water balance method [41]. Additional soil variables such as soil water concentration (SWCON), soil albedo, FBiom and FInertnot available in the laboratory analysed data were estimated using APSIM soil protocol reported by Dalgliesh et al. [41] and Saxton and Rawls [37]. Management operations such as dates of all planting operations, sowing depth, plant density, type and amount of fertilizer, tillage (type, depth and fraction of above-ground materials incorporated) were setup in the model. Genetic coefficients used by APSIM for maize are expressed in thermal degrees and photoperiod. Crop development is controlled by temperature (thermal degree days) and photoperiod. Thermal time accumulations were derived using algorithm described by Carberry and Abrecht [42] using observed phenology and weather data, with estimated base temperature of 10 °C and an optimum temperature of 30 °C. Intercepted radiation and the radiation-use efficiency determined potential biomass growth.
Since the varieties used in this study had not been incorporated into the APSIM model before, varieties of the same maturity period as the test variety within the APSIM–maize model were selected as reference variety. The parameter set selected were code B105, an early maturing hybrid and hybrid B110 an intermediate maturing generic variety already in the APSIM model which best represented the general characteristics (days to anthesis, days to physiological maturity and yield) of the experimental maize variety 2009EVDT and IWDC2SYNF2 respectively. The calibration was carried out using the measured parameters, first by adjusting phenological parameters (days to flowering and maturity) and then followed by adjusting the growth and yield parameters (LAI, grain numbers, grain yield and TDM. After several iterations’ adjustments, calibration was completed when the APSIM variety (default variety) satisfactorily reproduced the behavior of the varieties of interest (2009EVDT and IWDC2SYNF2).

2.7. APSIM Model Validation Procedure

After successfully obtaining the genetic coefficients (process of model calibration), the model was evaluated under varying nitrogen applications rates (0, 30, 60, 90, 120 kg N ha−1) using independent experimental data sets as described in Section 2.4. Without changing the genetic coefficients obtained for the two varieties, a simulation tree was set up linking the APSIM–maize module with the soil water module (SOIL WAT), the soil nitrogen module (SOILN), and the surface residue module RESIDUE [43]. Soil water parameters for the validation sites (Air dry, DUL, LL15, DUL, SAT and KS) were derived from the pseudo–transfer function (Saxton and Rawls, [37]. In setting up of the validation tree, maize roots were set to reach 100 cm as it is assumed that there would be little plant available water below100 cm. A runoff curve number of 85 was used and the parameters for soil evaporation were set at 8 and 3.5 mm for first and second stage drying, respectively. Soil nitrogen parameters (NO3 and NH
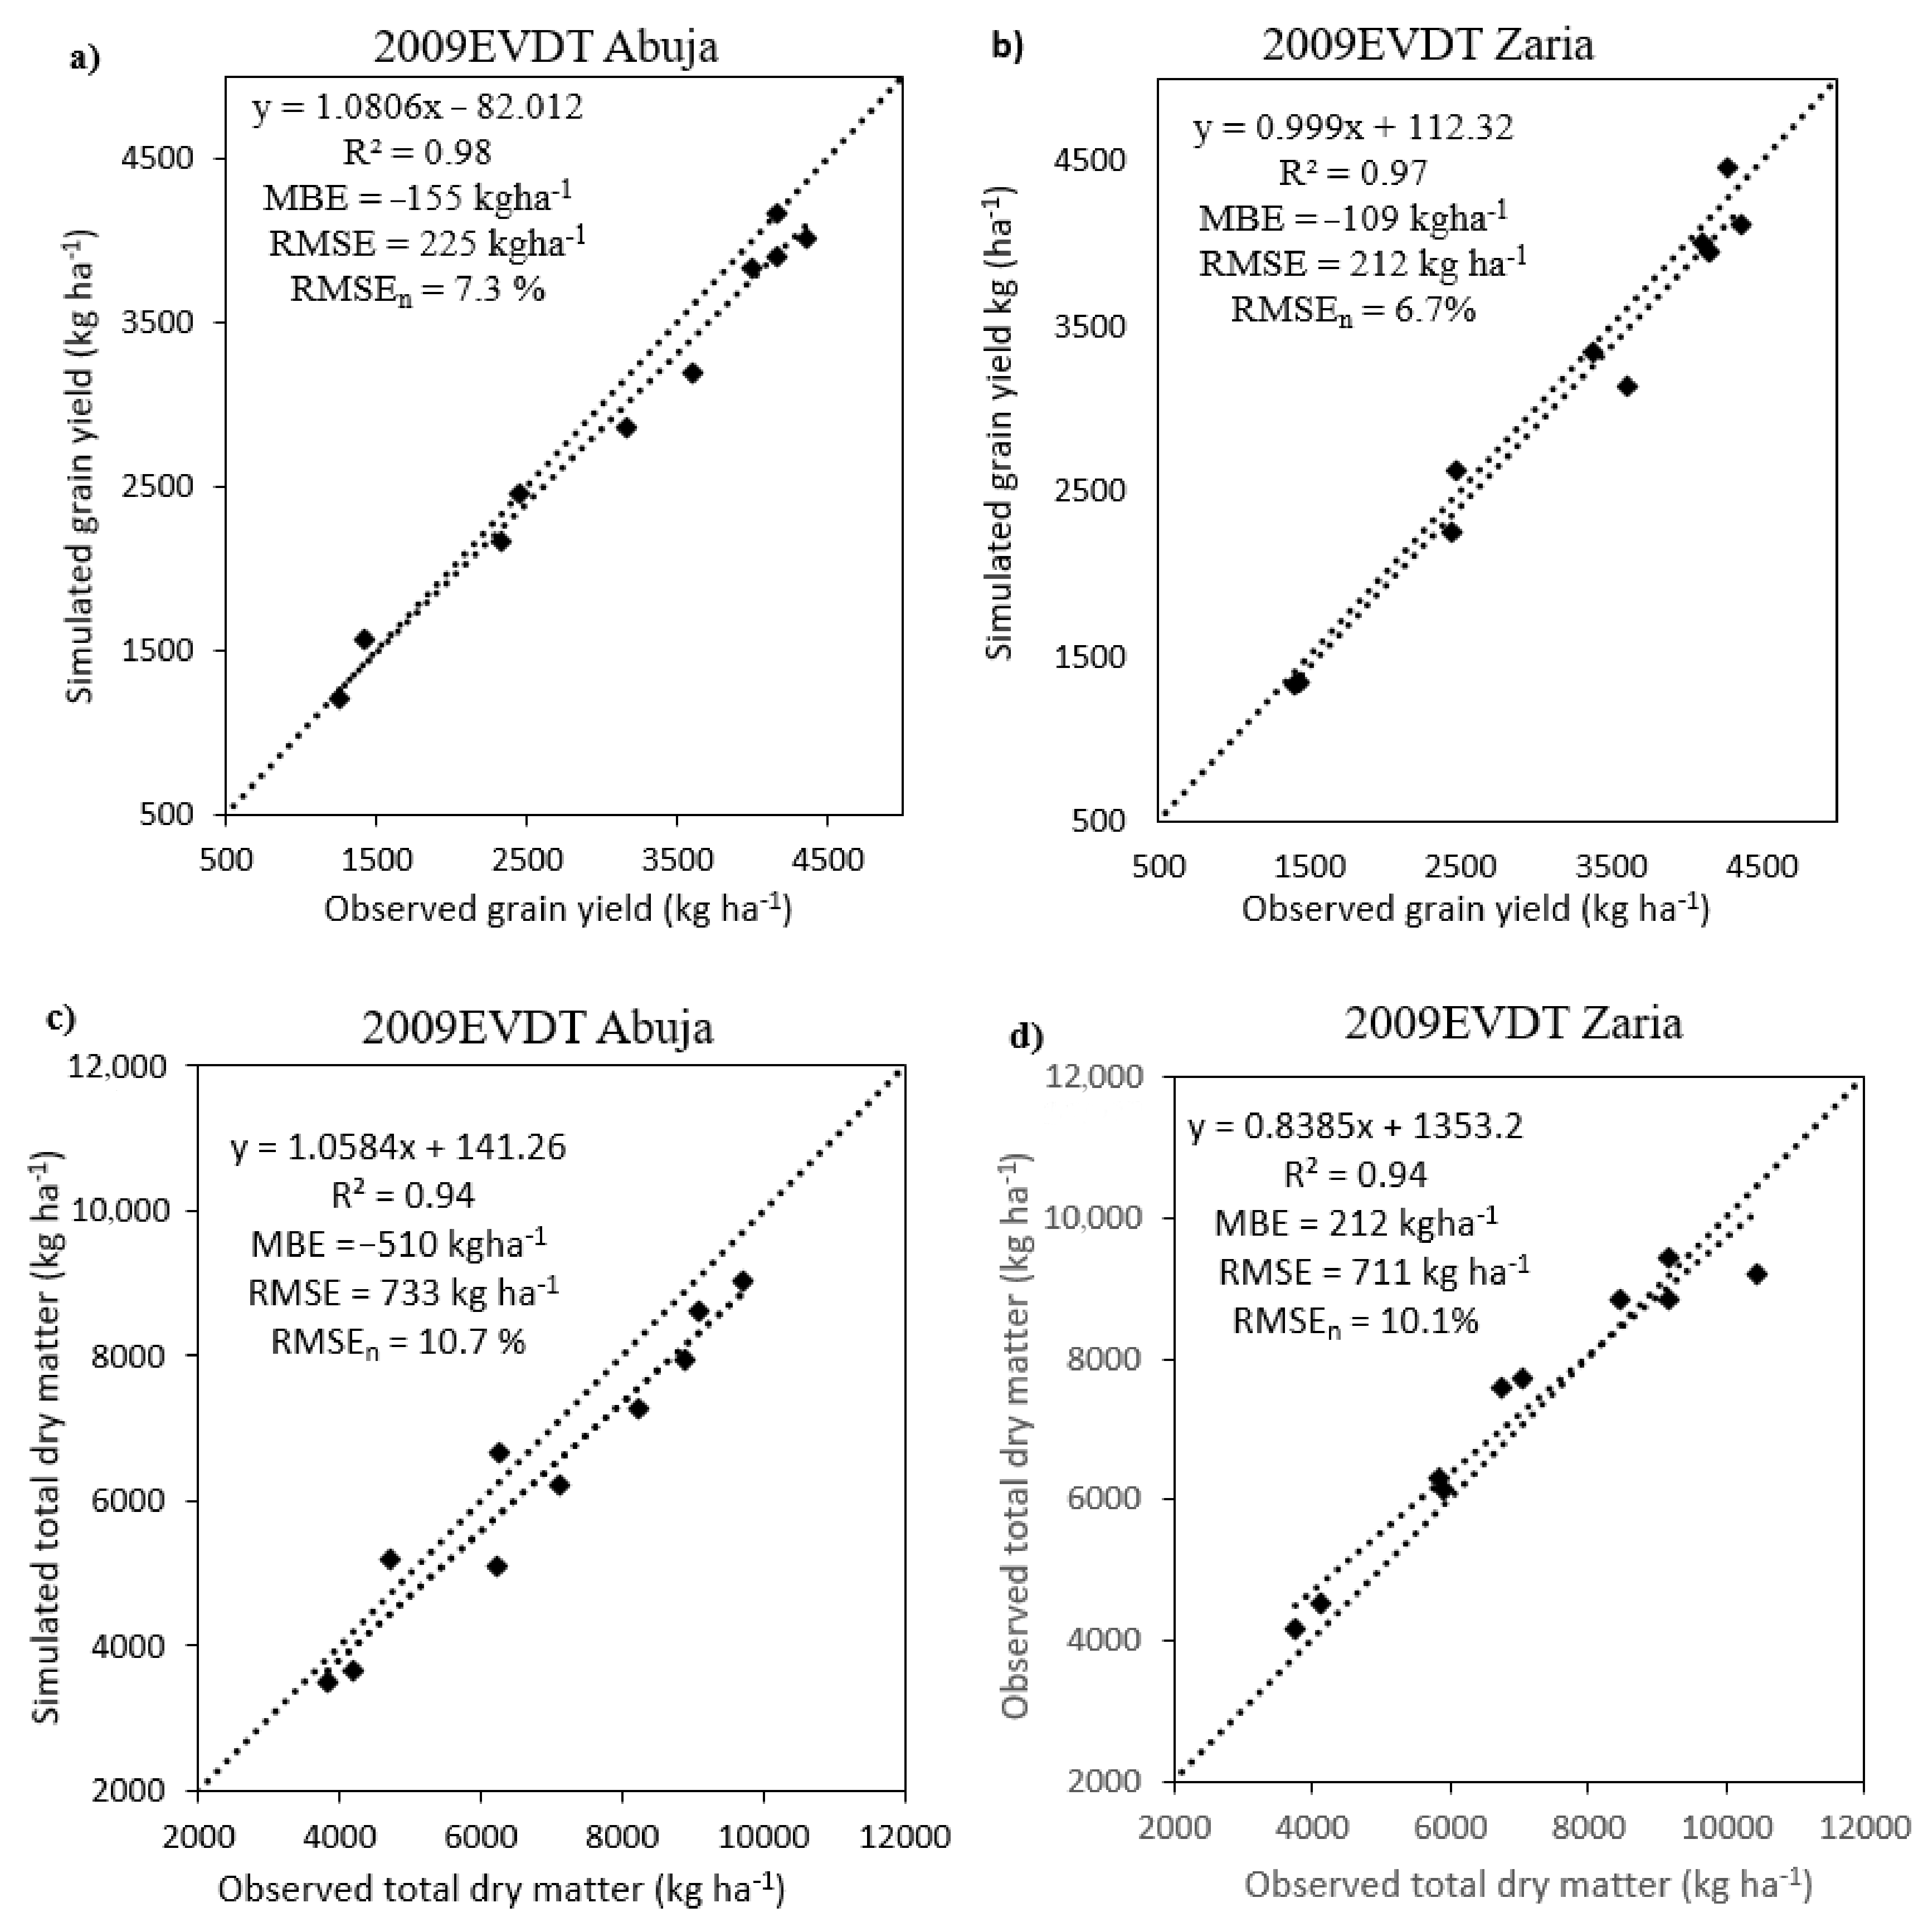
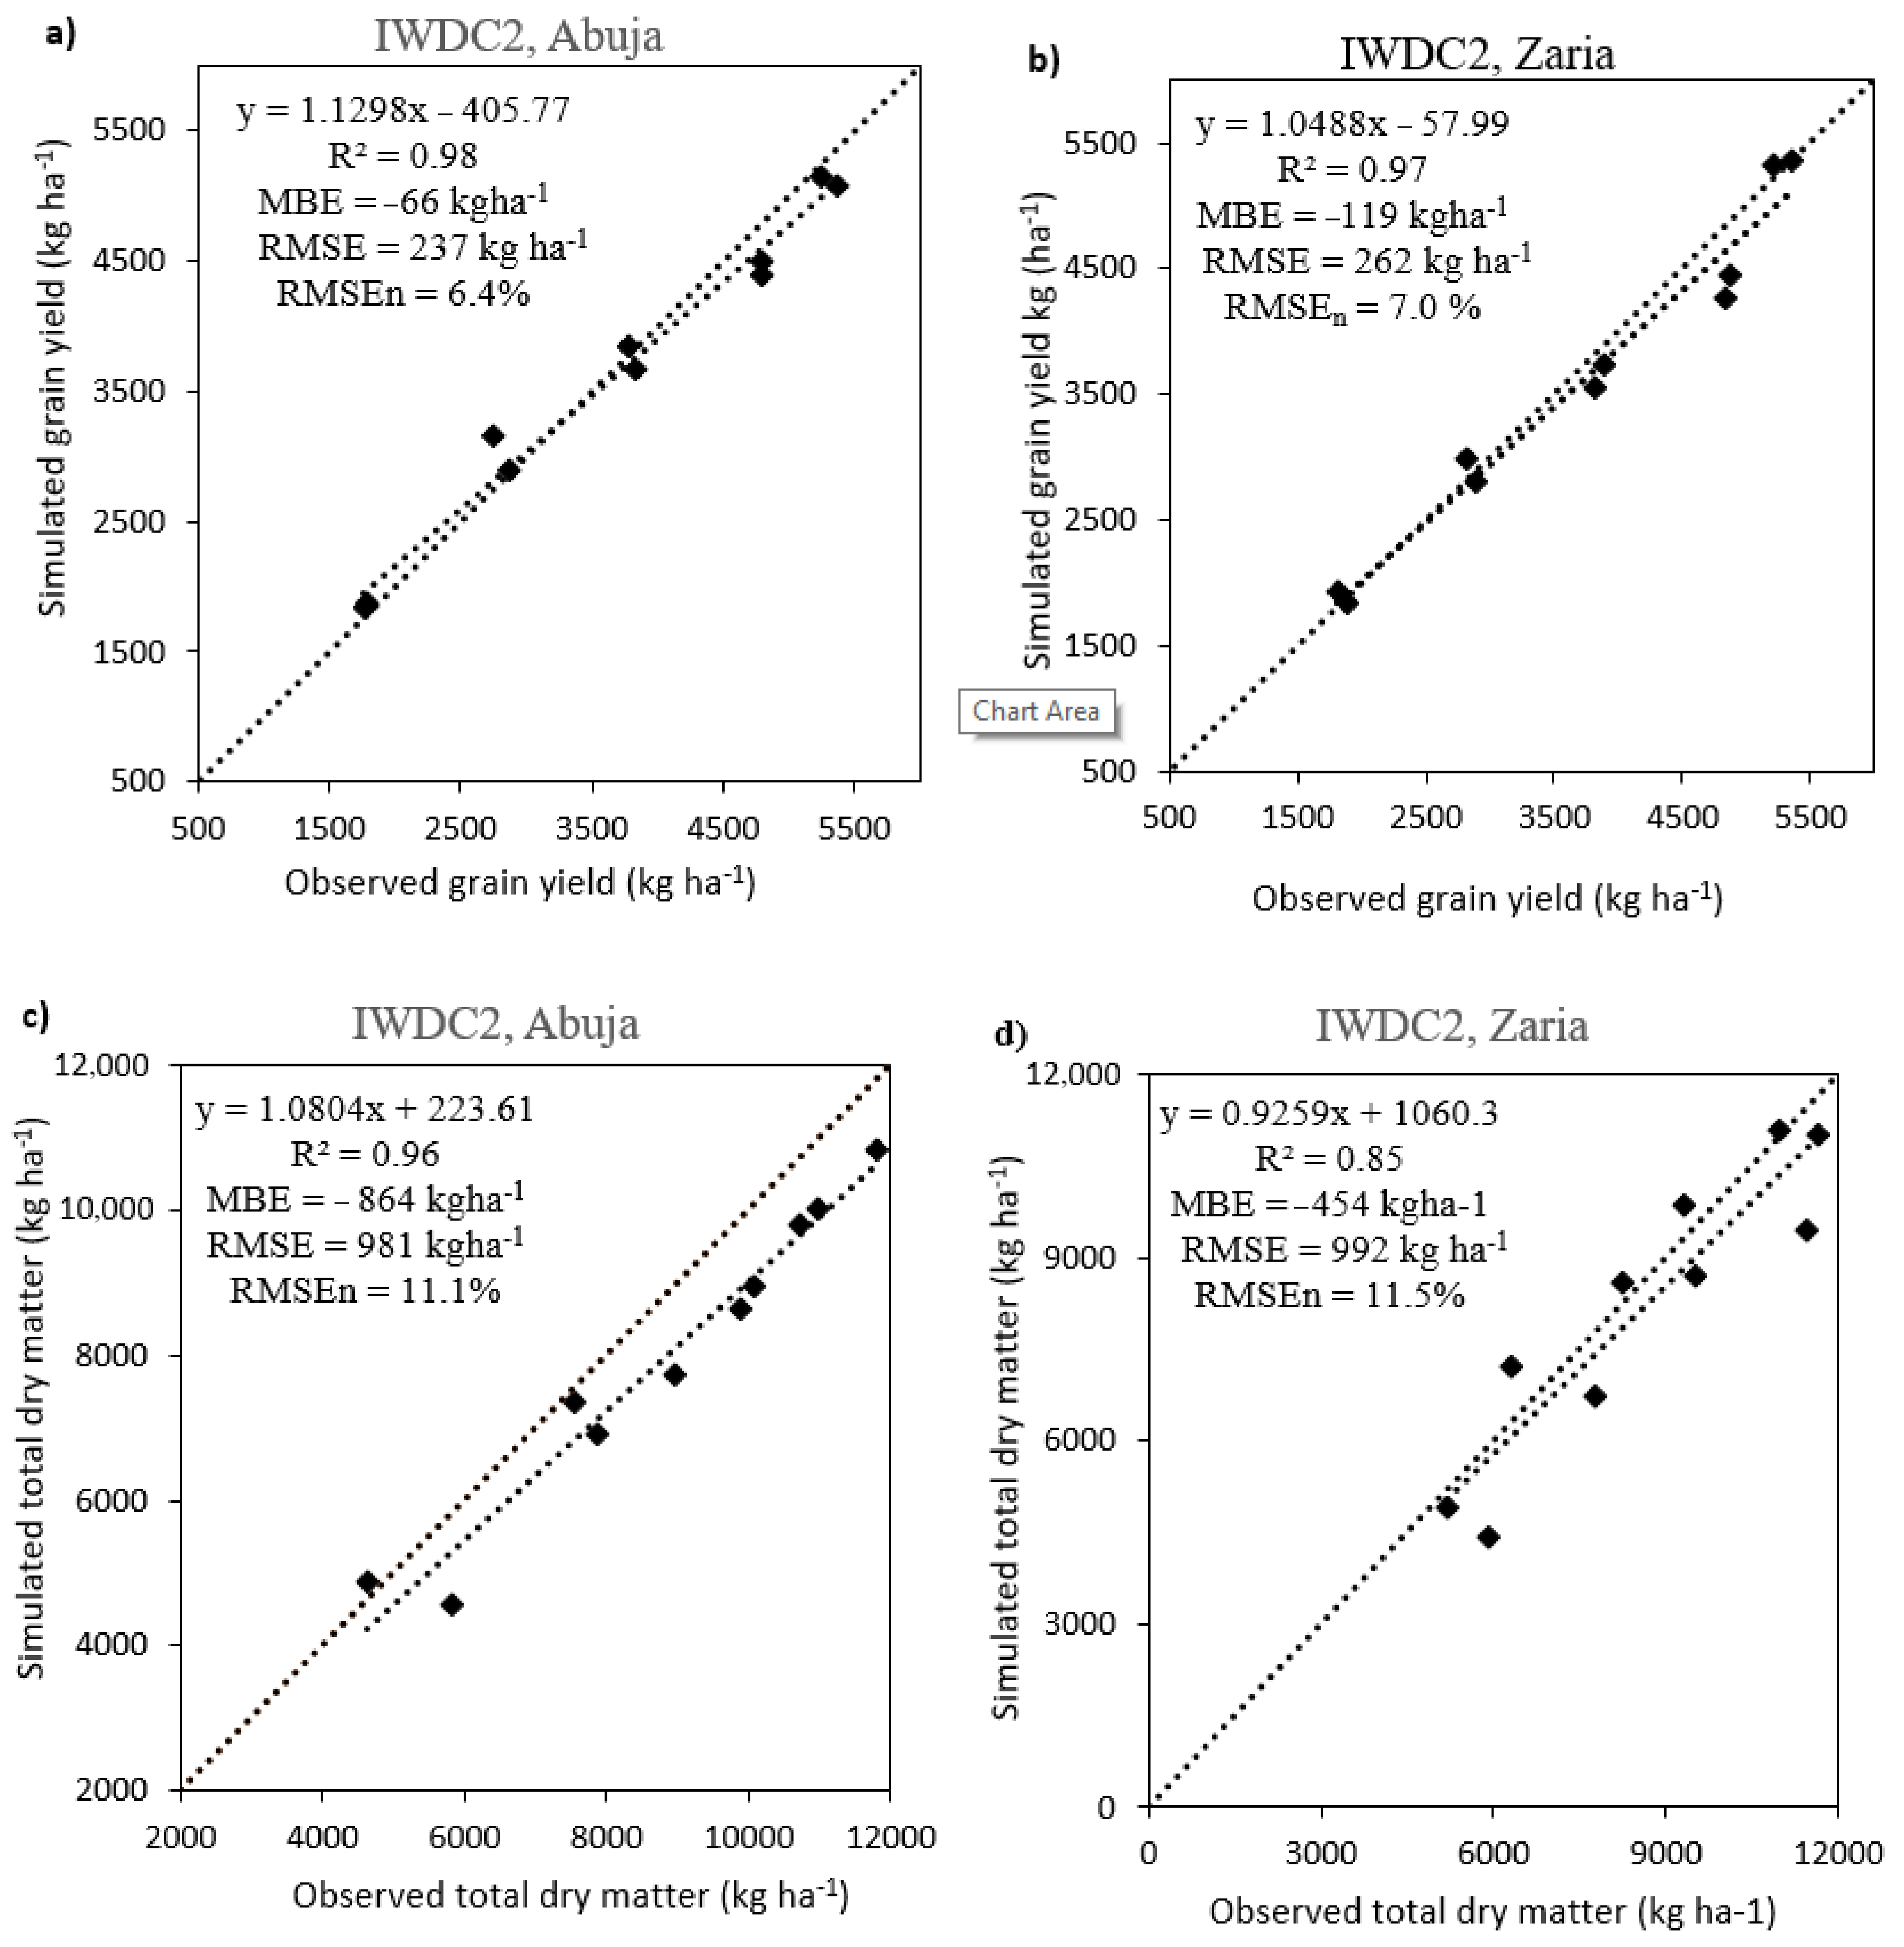
4) were taken from measurements at the site. The amount of surface crop residues was initialized as zero because residues were absent at the start of the simulation. Weather data and management information were setup accordingly. Under management condition, water, nitrogen, surface organic matter (SOM) and phosphorus were reset on a fixed date (prior to the start of each simulation). The model was run, and the observed and simulated outputs compared statistically for each parameter evaluated. The parameters evaluated include: days to anthesis, days to physiological maturity, LAI, TDM and grain yield. Model simulated values were compared with the observed data using mean bias error (MBE), root mean square error (RMSE), normalized root mean square error (RMSEn), and coefficient of determination (R2).
M B E = 1 ( i = 1 n O i i = 1 n P i ) i = 1 n O i
R M S E = i = 1   n ( P i O i ) 2 n 0.5
R M S E n % = i = 1 n ( P i O i ) 2 n 0.5 × 100
R 2 = i = 1 n O i O P i P 2 i = 1 n O i O 2 i = 1 n P i P 2
where n: number of observations, Pi: predicted value for the ith measurement and Oi: observed value for the ith measurement and O and P represent the mean of the observed values for all studied parameters.
The mean bias error (MBE) was used to check whether model predictions were overestimated or underestimated Xeviet al. [44]. RMSE is the “best” measure as it summarizes the mean difference in the units of observed and predicted values. This index provides a measure of the absolute and the percentage error, respectively, between observed and simulated values. Simulation output is considered excellent if RMSEn < 10%, good when RMSEn is ≥10% and ≤20%, fair when RMSEn is ≥20% and ≤30% and poor if RMSEn is ≥30% Jamieson et al. [45]. The coefficient of determination (R2) was also computed according to Archontoulis and Miguez [46] to provide a measure of the predictive ability. A model reproduces experimental data perfectly when R2 is 1.

2.8. Procedure for Seasonal Simulation of N–Fertilizer Applications on Maize Yield

After the model was successfully calibrated and evaluated, a simulation was performed using seasonal weather records from 1985–2015, obtained from Nigerian Meteorological Agency (NIMET, Port Harcourt, Nigeria). This was to identify the optimum N rate for each maize variety in three contrasting locations (Abuja in the SGS, Kano in the SS, and Zaria in NGS. The model initial water, nitrogen and organic matter contents were reset at the beginning of each simulation (1 April) to eliminate the residual effect of these parameter in the soil profile on crop growth and development for current season. Also, planting date for each season was controlled by a sowing rule module to align with the start of the rainy season and maize sowing window in each agro-ecological zone. Automatic sowing was initiated following a proven criterion reported by Akinseye et al. [47] which stated 20 mm of rainfall accumulates over 3 consecutive days. The planting windows were 31 May–31 July for Abuja (SGS), 1 June–31 July for Zaria (NGS) and 15 June to 31 July for Kano (SS) respectively, which represent current “best farmer’s practice” for maize cultivation in the three agro-ecological zones. Seven (7) fertilizer rates (0, 30, 60, 90, 120 150 and 180 kg N ha−1) were used to determine potential optimum N application rate for each variety in each location. The varieties were sown at a planting distance of 0.75 × 0.25 m. Fertilizer rates were applied in two splits; at 7 and 35 days after emergence. Table 1 depicts soil data used for the long-term simulations for each site selected. The soils indicated very low fertility class (<4.0 g kg1) and classified as Oxic Haplustalfs (Abuja), Isohyperthermic (Zaria) and Typic Kanhaplustalf (Kano) according to the United States Department of Agriculture (USDA) soil Taxonomy.
In Abuja site, the soil indicates a sand content of 34.93%, silt content of 16.0% silt, and clay content of 49.07%. The soil was sandy loam in texture with bulk density of 1.89 gcm−3. The surface soil organic carbon content at the topsoils was 0.58%, pH was slightly acidic (4.99), and NO3 was 1.67 kg ha–1 while NH4 was 0.64 kg ha−1. In Zaria indicates a silty loam texture with a sand content of 38%, silt content of 42% and clay content of 20%. The bulk density of the surface soil was 1.25 g/cm−3. The soil was moderately acidic pH (5.61), NO3 content was 2.59 kg ha–1, NH4 was 0.74 kg ha−1 and organic matter content was 0.57%. In Kano, the soil surface horizon had a loamy sand texture with sand content of 82%, silt content of 13% and clay content of 5%. The bulk density of the surface soil was 1.66 g/cm−3. The soil was slightly acidic to neutral pH (6.57). The nutrient contents in the plough layers were; organic carbon (0.30%), NO3 (2.75 kg ha−1) and NH4 (0.60 kg ha−1). The total water holding capacity of Kano soil was 0.1 mm/mm. The surface horizon in Kano had a loamy sand texture, slightly acidic to neutral pH (6.57), very low nutrient content especially NO3 (2.75 kg ha−1) and NH4 (0.60 kg ha−1) and low organic carbon content (0.30).
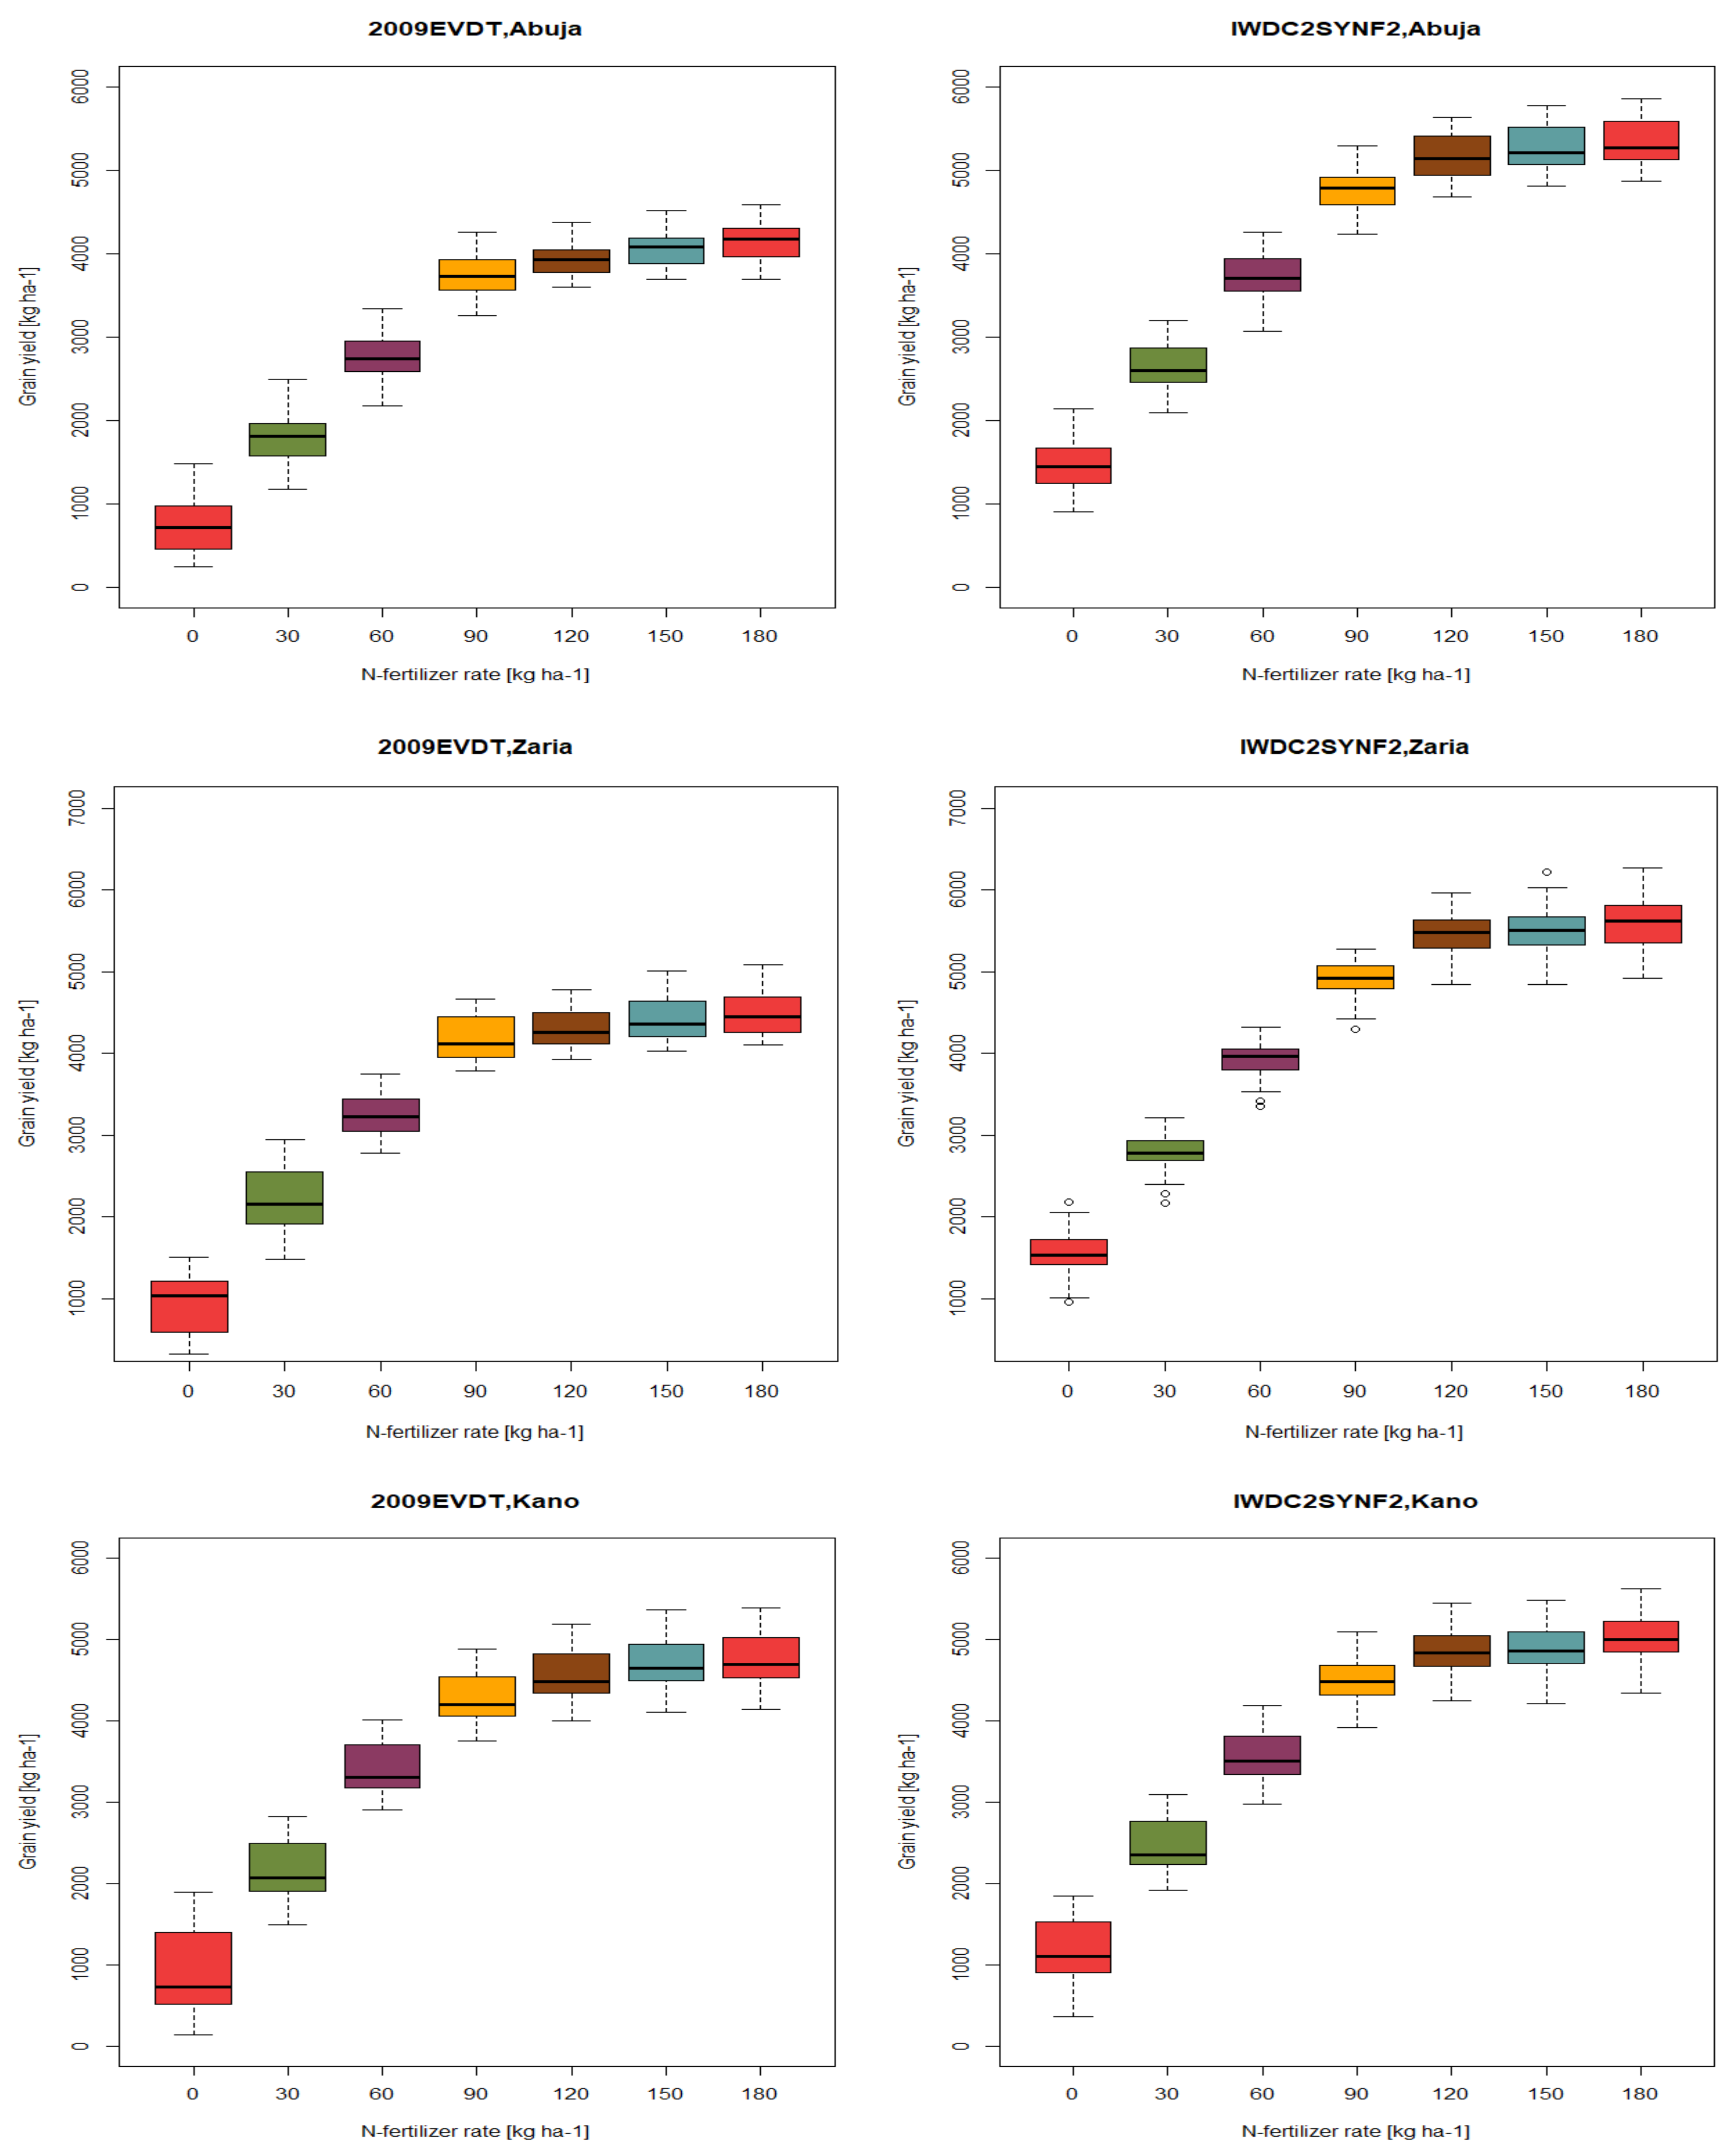
Simulated grain yields from the seasonal analysis across the N fertilizer rates analyzed using a box and whisker plot to assess optimum N rate per site. The coefficient of variation (CV%), which is the ratio of standard deviation to the mean grain yield over the simulated period, was used to assess the level of variability of grain yields among N–fertilizer rates. Let the grand mean yield across N–fertilizer rates be designated GMjk;
GM jk = i = 1 n X i j k N
Then the CV is defined as:
CV = S t d e v   o f   G M i j k G M j k × 100
According to Gomes [
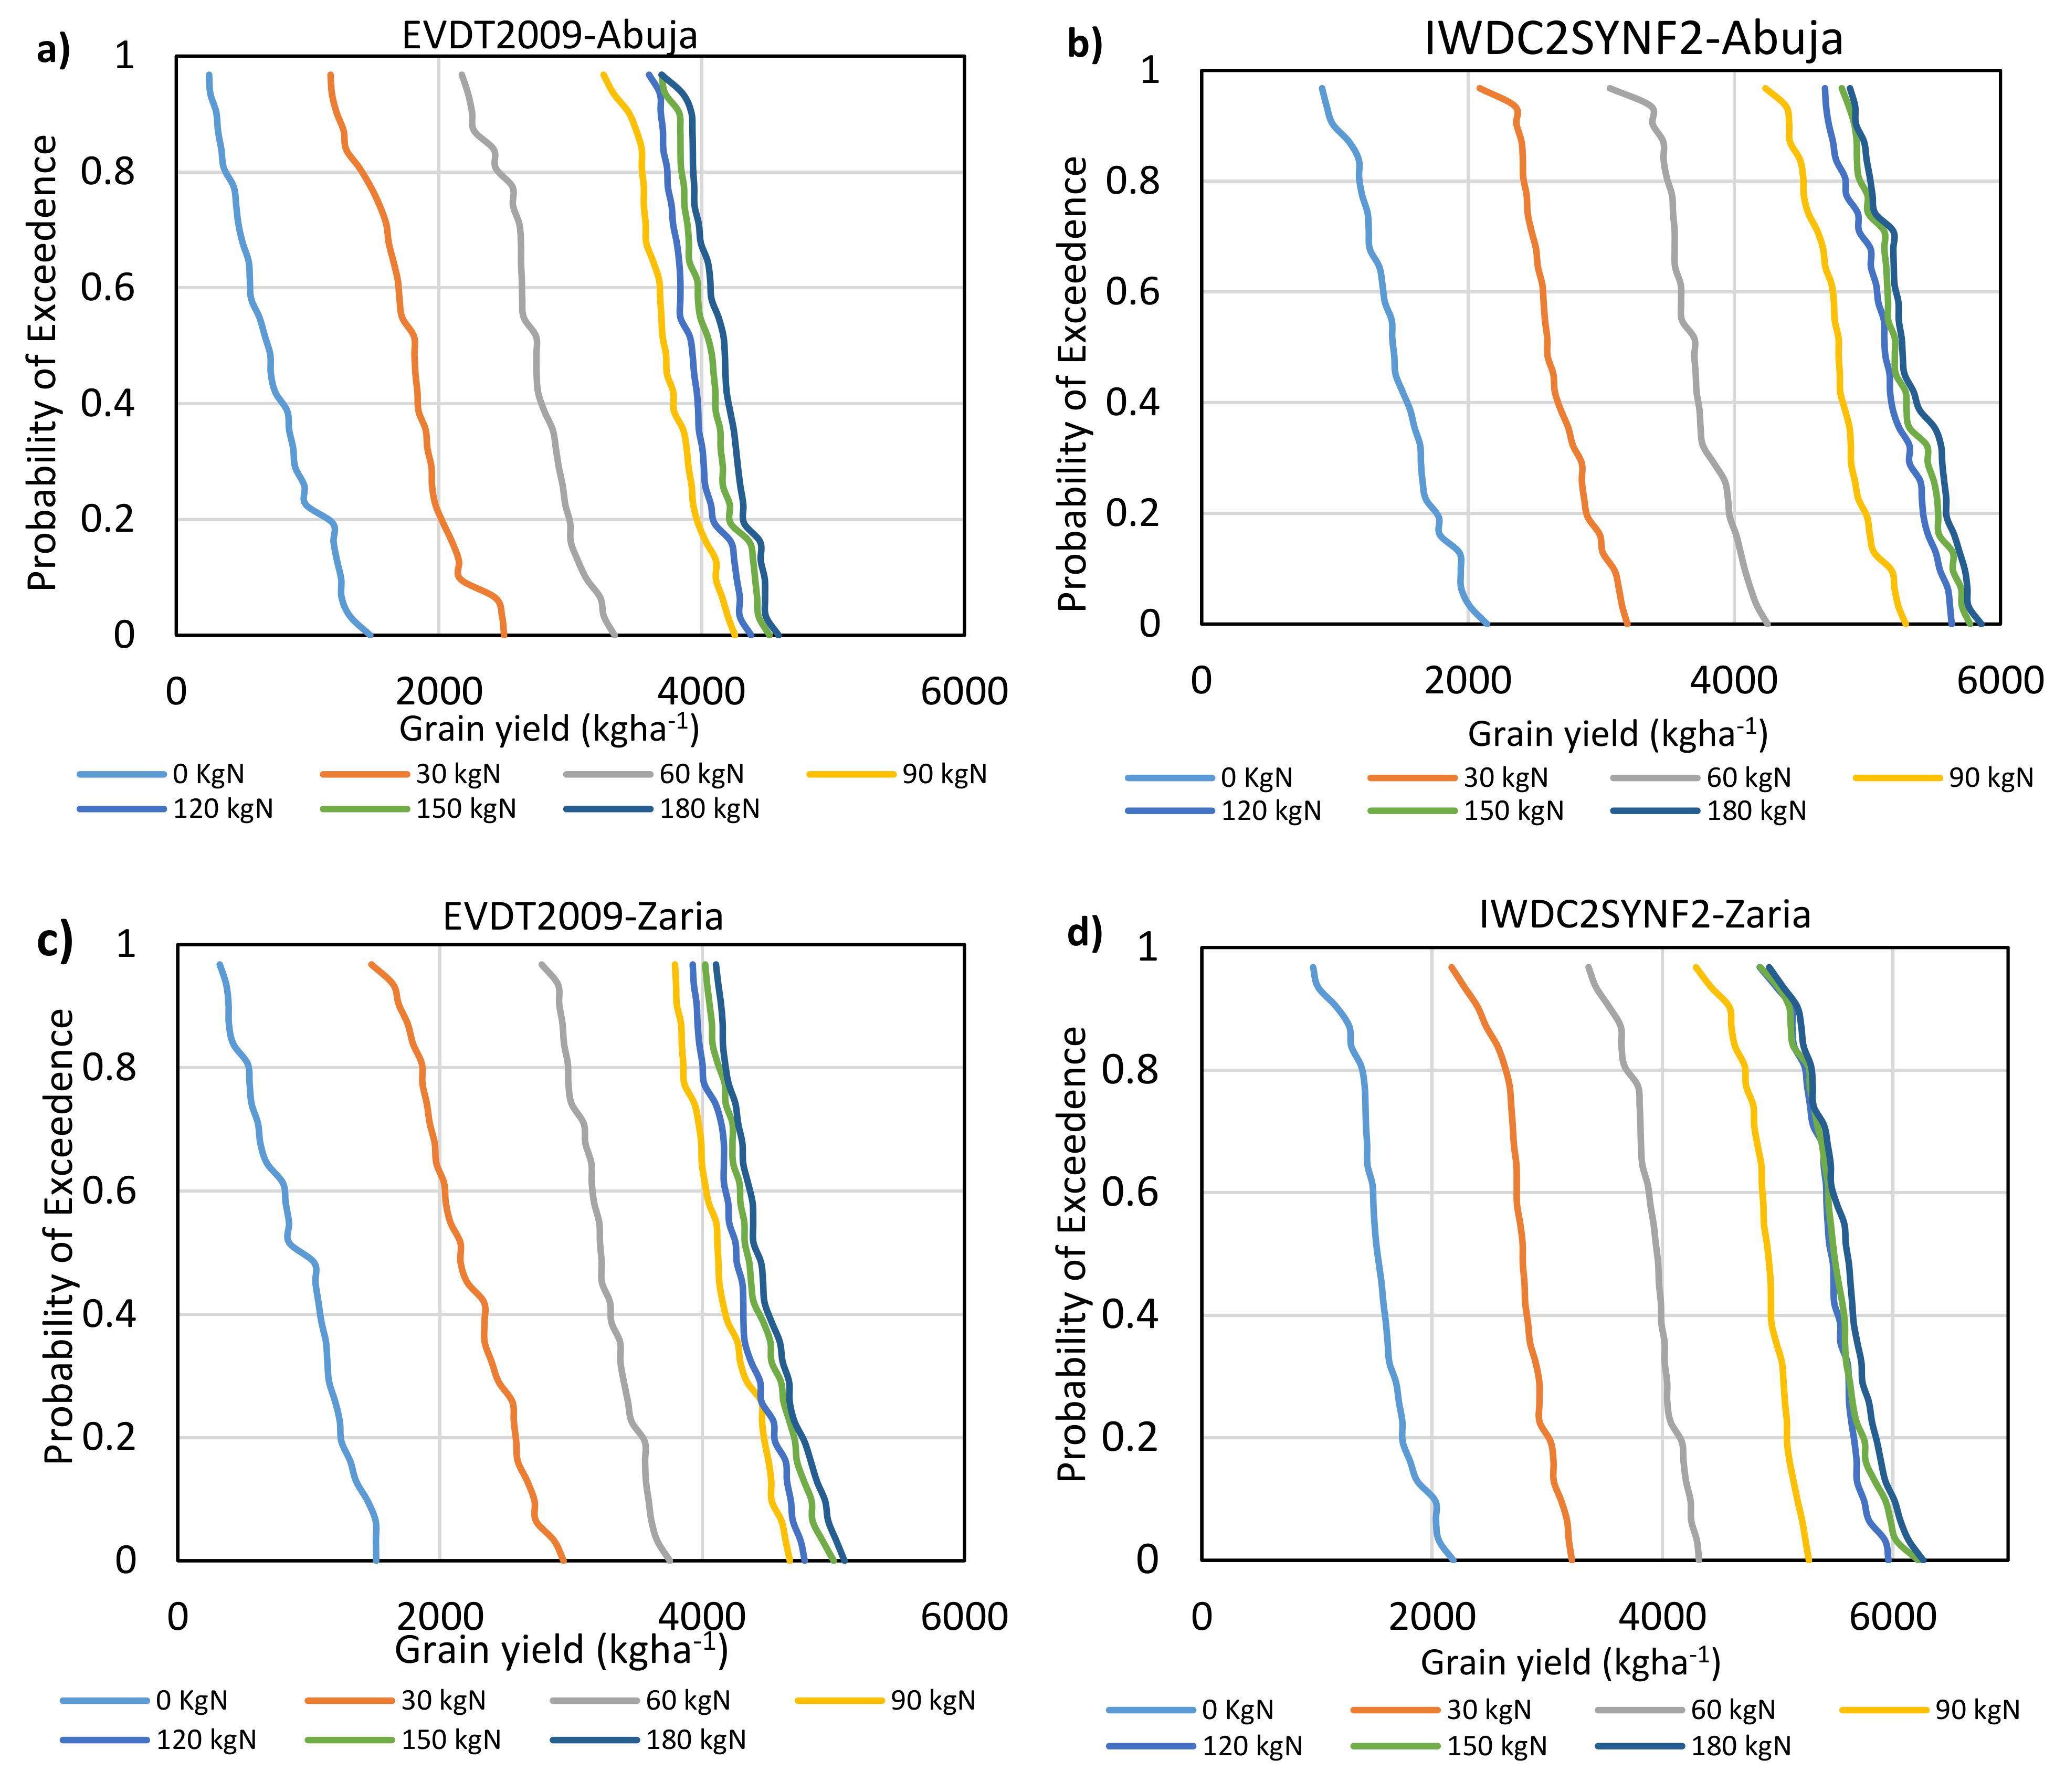
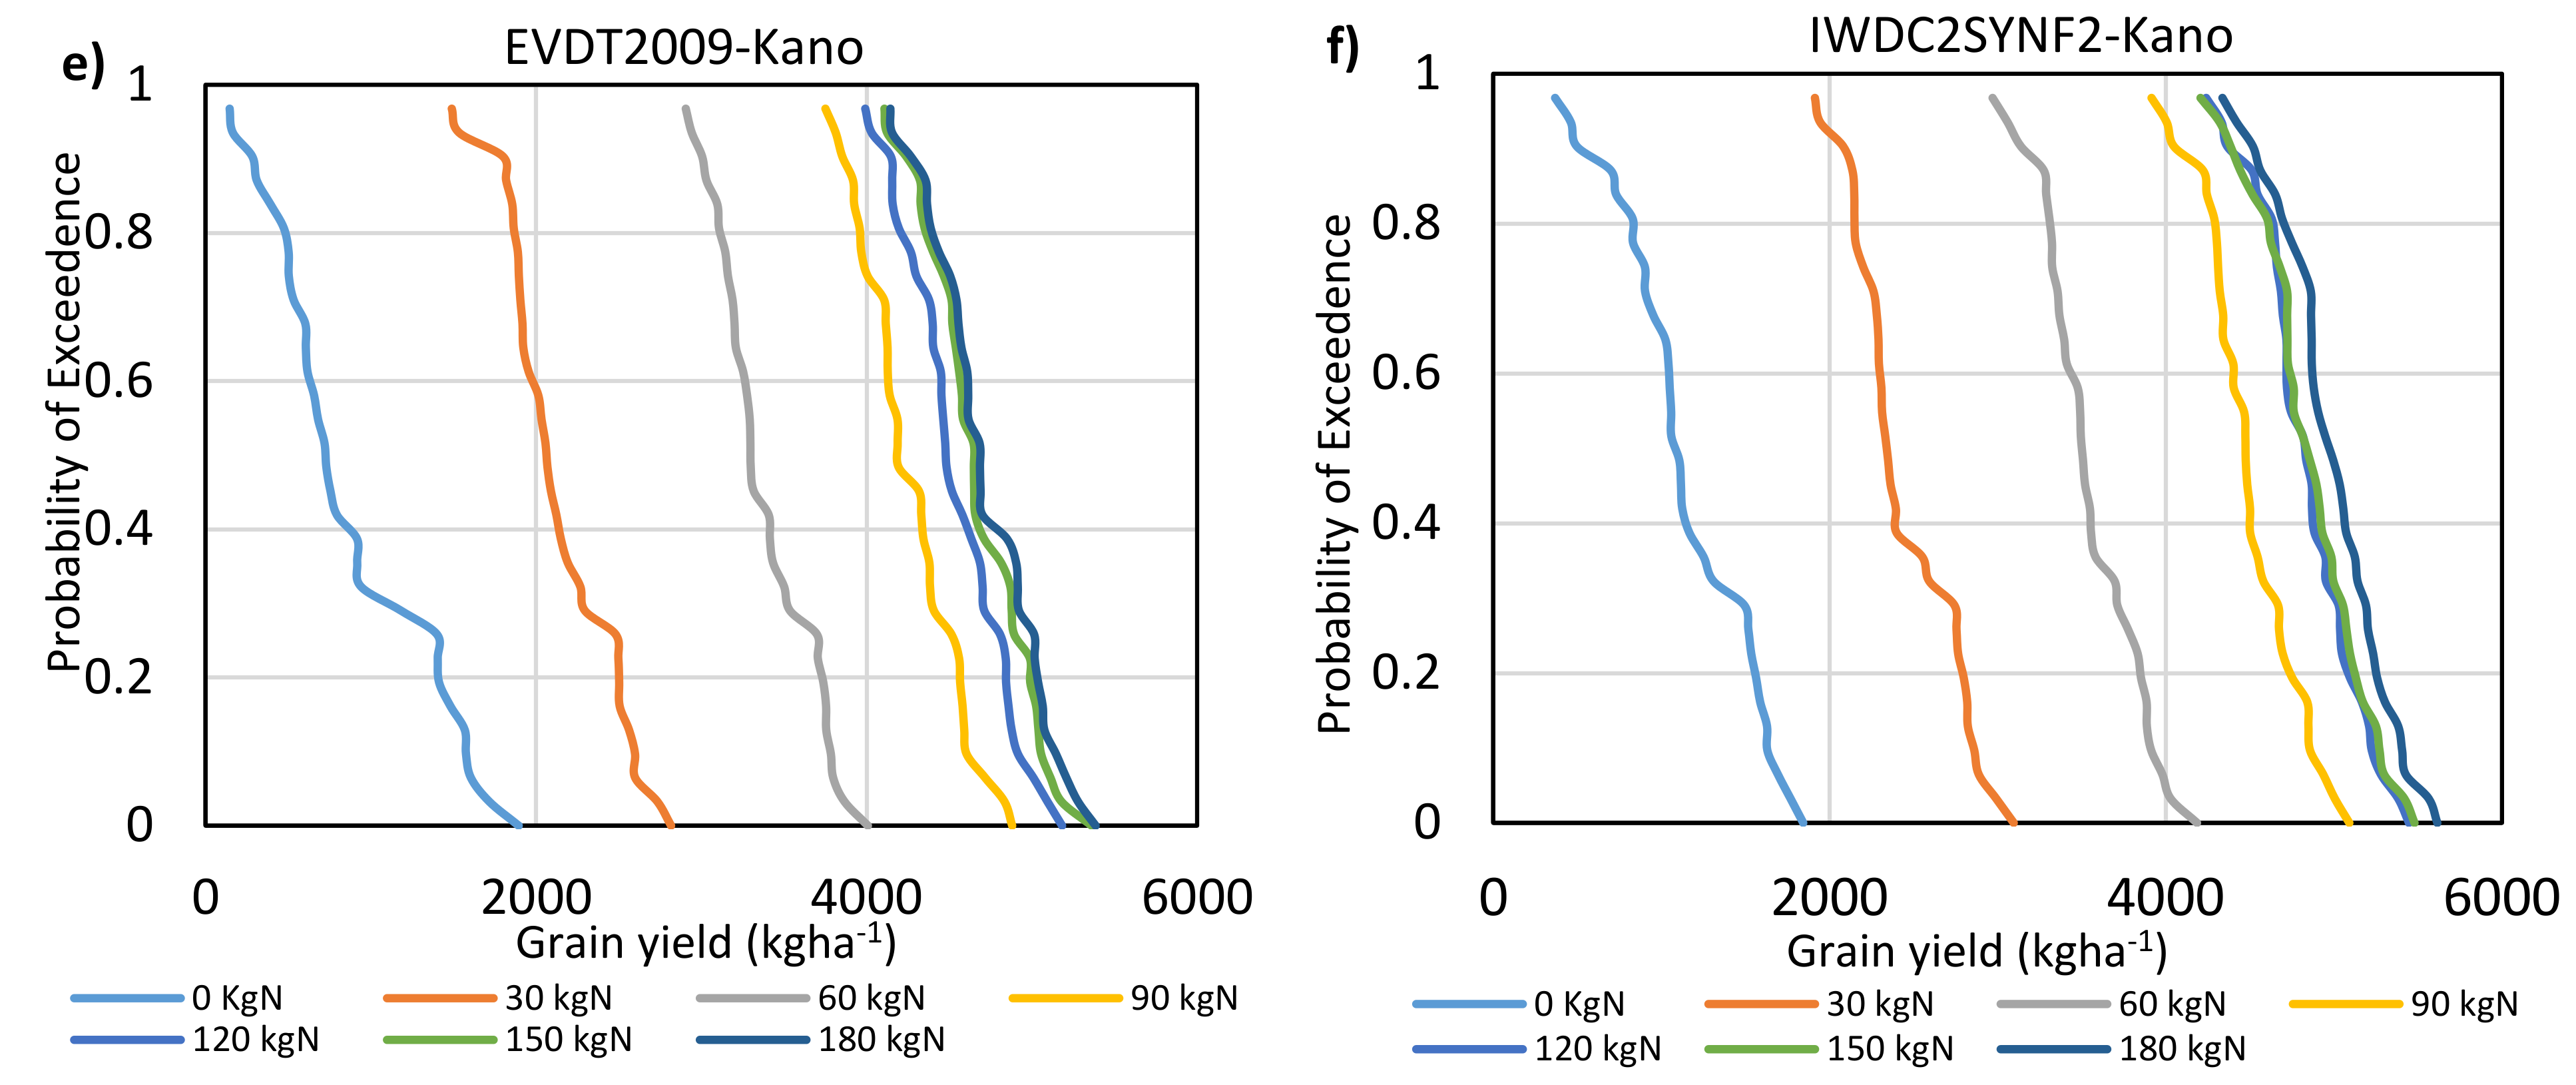
48], CV% is classified as low (CV < 10%), medium (CV% between 10% and 20%), high (CV% between 20% and 30%), very high (CV% > 30%). Similarly, probability of exceedance plots was used to present the results of simulated yields for 31-year period, to determine attainable yield threshold of 3000 kg ha−1 for 2009EDVT and 4000 kg ha−1 for IWDC2SYNF2 based on the released guide by the IITA maize breeders.

2.9. Profitability of Maize Production as Influenced by Varieties and N–Fertilizer Application

Partial budgeting analysis was used to estimate the cost of production and net income [49,50] for each of the simulation site. The economic analyses were performed to compare the profitability of producing the two maize varieties tested under different N–fertilizer rates based on current agronomic practices. The average maize prices at the prevailing market price were surveyed in the study areas. The total cost of production (TCP) is the average cost of all recommended and variable inputs including seed, fertilizer, herbicides, insecticides, and labour cost (ploughing, ridges, planting, weeding, harvesting, and bagging) for each location were determined following the procedure reported by Ajeigbe et al. [
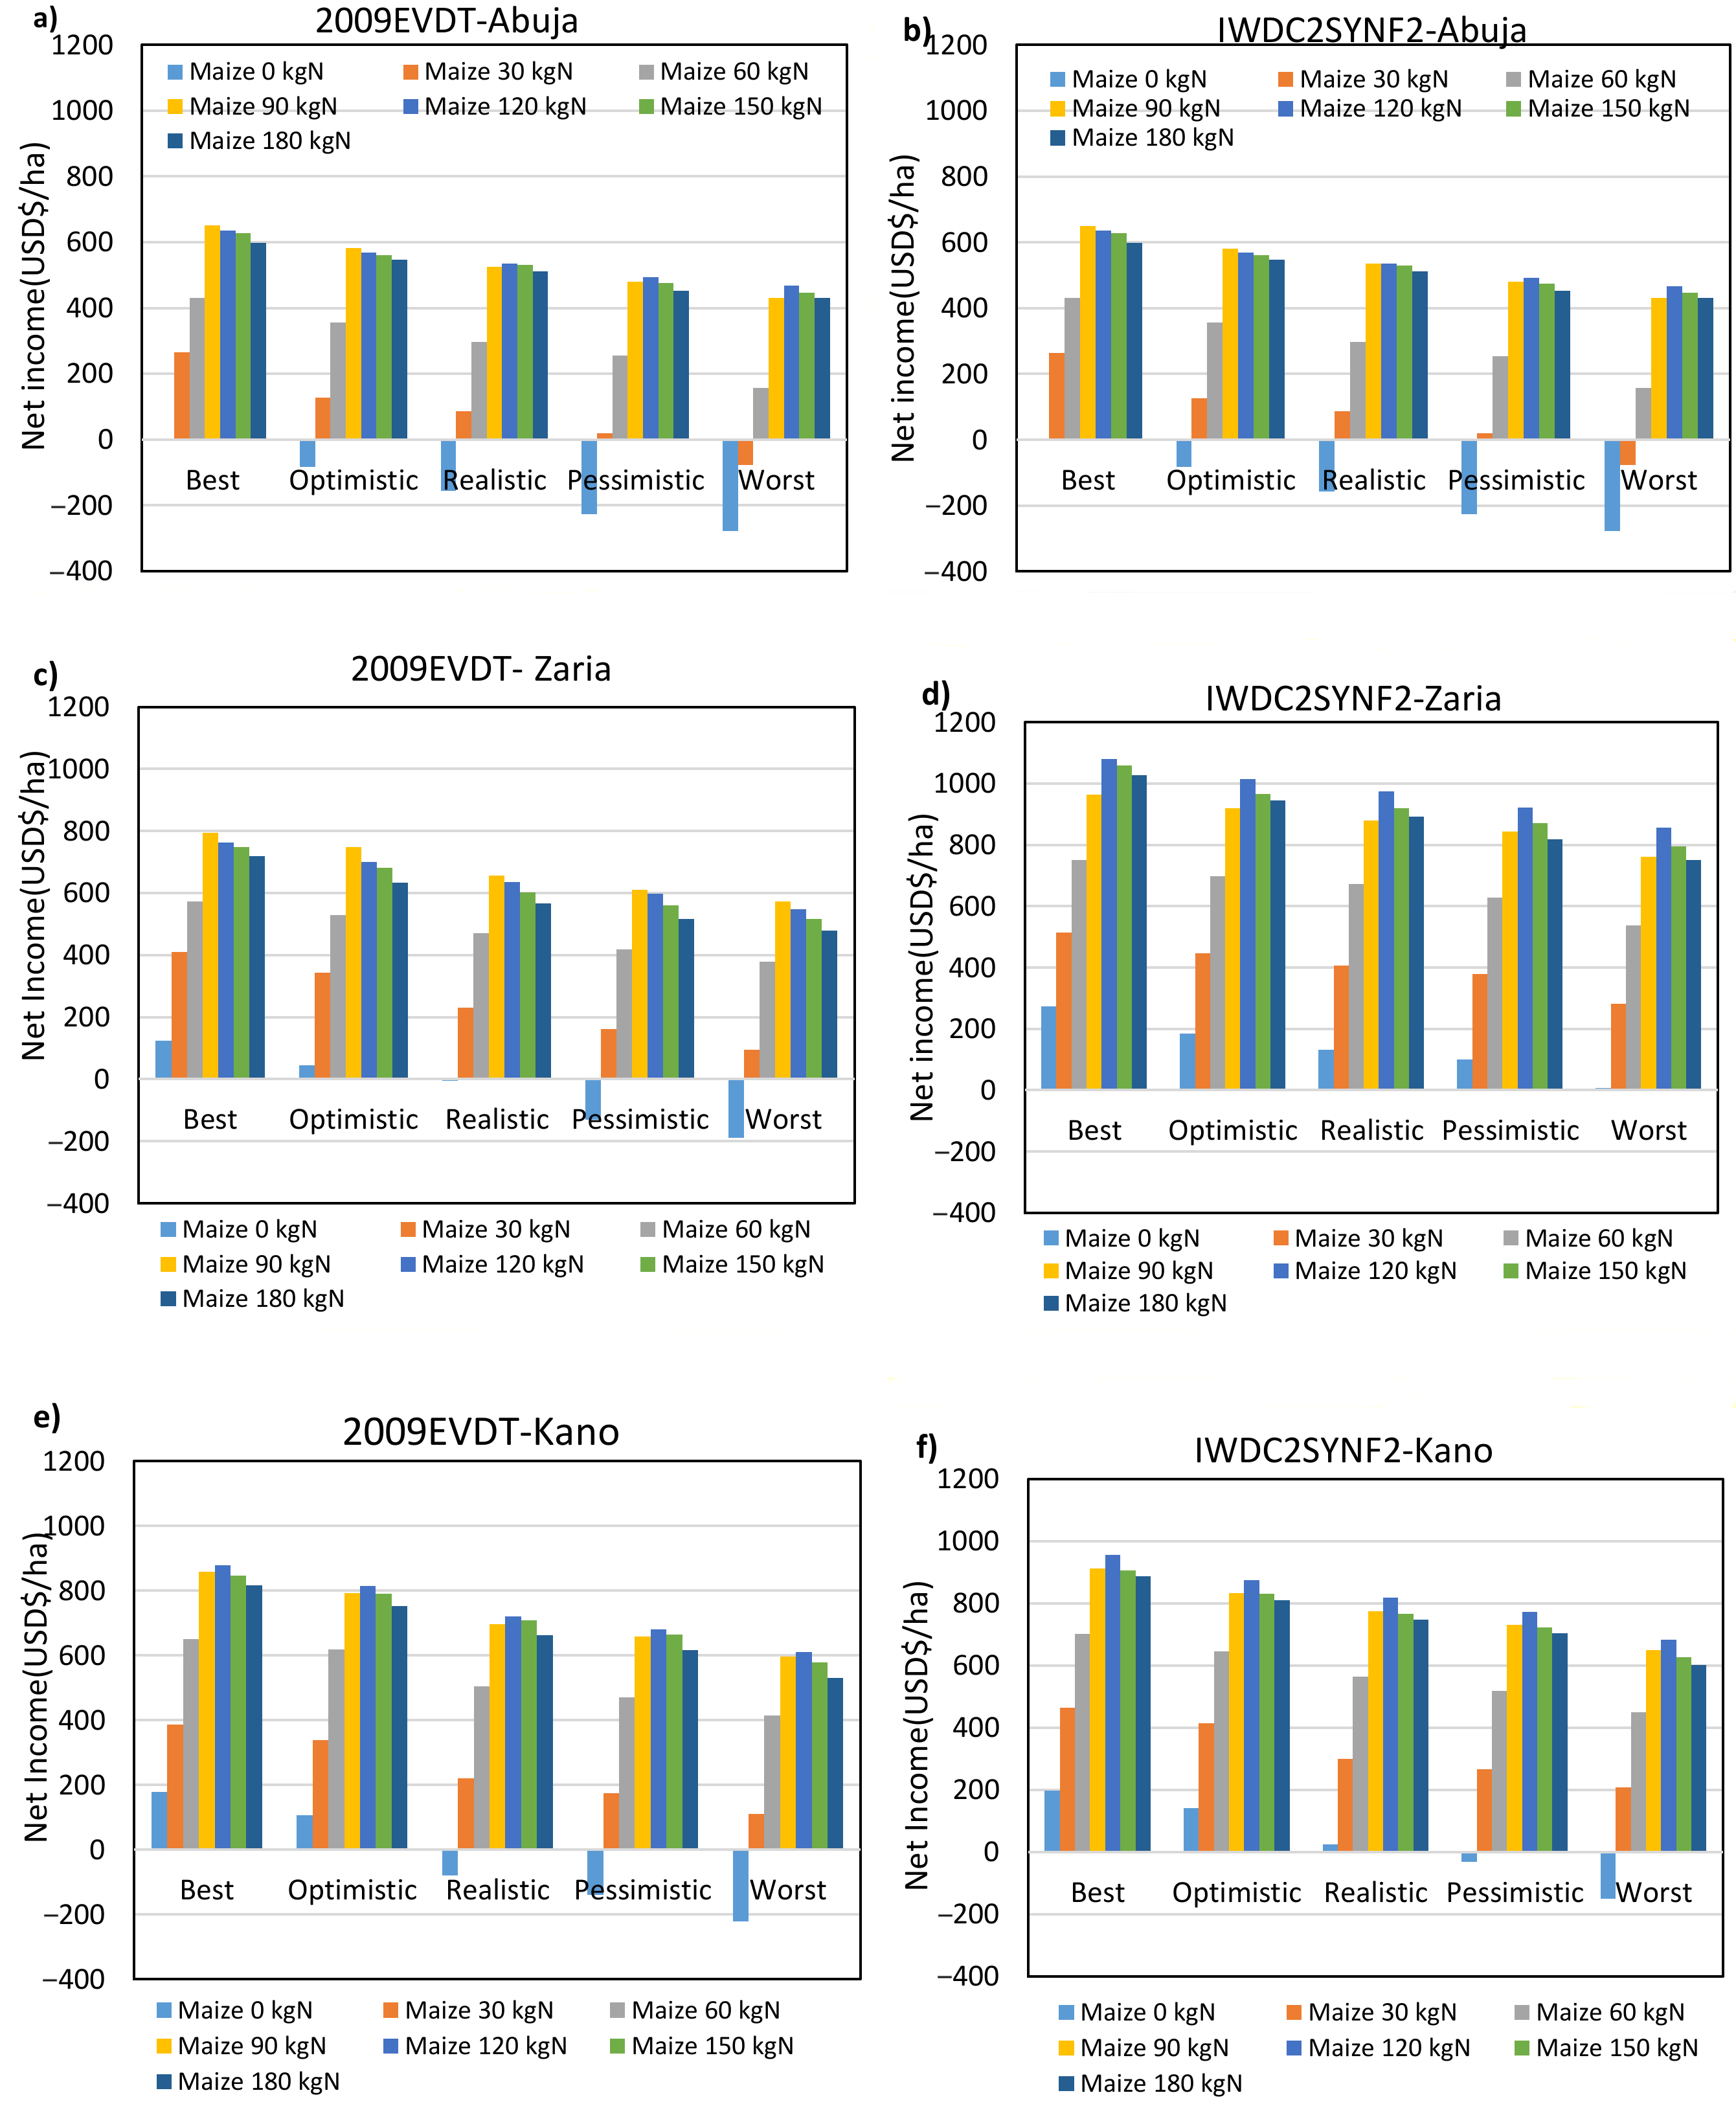
50]. Most smallholder farmers in the various locations buy fertilizer on the open market. Because of this, the average open market fertilizer prices were used in the estimation of economic returns. The benefits or net income under each of the different N levels were estimated using the current farm gate price for maize grain at harvest. The total revenue (TR) for grain yield was determined based on the prevailing price in each location on their respective grain yield per ha, assuming there was no cost borne for storage. Net returns or income is the difference between TR and TCP. Thereafter, decision aid was applied across N application rates for the estimated net income to determine the five (5) different scenarios of net income including best (95th percentile—the highest net income in 5% of the simulated years), optimistic (75th percentile—net income estimate in 25% of the simulated years), realistic (50th percentile—median net income estimate in 50% of the simulated years), pessimistic (25th percentile—net income estimates in 75% of the simulated years), and worst (5th percentile–lowest net income estimates in 95% of the years) respectively for both maize varieties.

3. Results

3.1. Weather Conditions at the Experimental Sites

The long–term weather information at model application sites (Abuja, Zaria and Kano) is presented in Figure 1a–d. The mean annual rainfall for Abuja was 1603 mm, whereas average minimum and maximum temperatures of 21 °C and 32 °C, respectively (Figure 1a). In Zaria, mean annual rainfall amount was 1047 mm, while average minimum and maximum temperatures were 16 °C and 32 °C respectively (Figure 1b). In Kano, the mean annual rainfall was 810 mm while average minimum and maximum temperatures were 20 and 34 °C respectively (Figure 1c). High differences in total rainfall amounts were observed among the locations. On average, Abuja recorded total annual rainfall that were higher than Zaria and Kano. There was generally a strong negative correlation coefficient (r = 0.73) between the onset and length of the growing season across the sites (Figure 1d).

3.2. Model Calibration

Genotype specific parameters generated from the calibration experiments of the two varieties are presented in Table 2. From the results, it was observed that IWDC2SYNF2 had higher grain yield compared to 2009EVDT. IWDC2SYNF2 also recorded higher thermal time from emergence to the end of juvenile stage, and higher thermal time from flowering to maturity. Table 3 shows the statistics of calibration for days to anthesis, days to physiological maturity, maximum LAI, TDM and grain yield. The calibration results show high prediction accuracy with all statistical indices within the acceptable range as evidenced by low MBE, RMSE, and RMSEn (≤10%) for all the parameters and for both varieties. For grain yield and TDM of 2009EVDT, the estimated MBE was 287 and 490 kg ha−1, RMSE 301 and 517 kg ha−1; excellent RMSEn of 5 and 4%, respectively. For IWDC2SYNF2 the model over predicted grain yield with MBE of 364 kg ha–1, RMSE of 383 kg ha−1, and excellent RMSEn of 6%. Total dry matter of IWDC2SYNF2 was under predicted with MBE of −954 kg ha−1, RMSE of 988 kg ha−1, and high accuracy with RMSEn (6.4%).

3.3. Model Validation

Figure 2 and Figure 3 show model validation results for both maize varieties across locations. A good agreement was observed between simulated and observed values for grain yield and total dry matter (TDM) in the two sites (Abuja and Zaria). Across the N–fertilizer levels, the observed grain yield of EVDT2009 ranged from a minimum of 1253 kg ha−1 to a maximum of 4361 kg ha−1 at Abuja and 1435–4361 kg ha−1 at Zaria. The observed grain yield of IWDC2SYNF2 ranged from a minimum of 1762 kg ha−1 to a maximum of 5380 kg ha−1 at Abuja; and 1812–5372 kg ha−1 at Zaria. Similarly, for TDM, the observed values for EVDT2009 variety ranged 3826–9717 kg ha–1 in Abuja and 3750–10,439 kg ha−1 in Zaria. The observed TDM of IWDC2SYNF2 was higher ranged from 4639–11,813 kg ha−1 (Abuja) and 5187–11,609 kg/ha–1 (Zaria). Statistical indicators for model performance indicate low MBE and RMSE, the model accuracy (RMSEn) ranged from high to low and strong R2 values. For 2009EVDT variety (Figure 2a,b), grain yield of maize was slightly underestimated with MBE of −155 and −109 kg/ha−1, RMSE of 225 and 212 kg/ha−1, RMSEn of 7 and 7% and R2 of 0.98 and 0.97respectively. The TDM (Figure 2c,d) was equally well predicted with MBE of −510 and 212 kg ha−1, RMSE of 733 and 711 kg/ha−1, RMSEn of 11 and 10% for observed and simulated, respectively. As shown in Figure 3a,b, grain yield of IWDC2SYNF2 was also well simulated with model slightly underestimating the grain yield. The observed and simulated values were –66 and −119 kg/ha−1, of 237 and 262 kg/ha−1, 6 and 7% for MBE, RMSE, and RMSEn, respectively. The TDM (Figure 3c,d) was equally well predicted indicating MBE of −864 and −454 kg/ha–1, RMSE (981 and 992 kg/ha−1), RMSEn (11 and 12%) for observed and simulated, respectively. The accurate prediction all the tested parameters for both varieties under optimum condition and at different N levels with low RMSE values implies that the model could be used at larger scale to optimize maize production.

3.4. Seasonal Analysis of Maize Response to N–Fertilizer Application

The seasonal effects of maize response to N applications are presented in Figure 4 and Figure 5. The response of maize to N fertilizer applications varied for both varieties and the locations. Grain yield increased with increasing application of N for both varieties at all locations. In Abuja representing SGS zone (Figure 4), the simulated mean grain yields ranged from 751–4161 kg ha−1 for 2009EVDT and 1483–5336 kg ha−1 for IWDC2SYNF2 when N fertilizer was applied at the rates of 0, 30, 60, 90, 120, 150 and 180 kg ha−1. Higher yield variability was simulated for both varieties when N–fertilizer was applied between 0 and 60 kg N compared to N–rates of 90 and 180 kg N. The coefficient of variation (CV) ranged from 11–47% for EVDT2009 and 8–22% for IWDC2SYNF2 compared to CV ranged from 5–7% for both varieties when fertilizer was applied between 90 and 180 kg N. The application of N–fertilizer at 30–180 kg ha−1 increased simulated grain yield by 58–82% for 2009EVDT and 45–72% for IWDC2SYNF2 compared to when no fertilizer (0 kg N ha−1) is applied. In the NGS zone represented by Zaria, simulated mean grain yield ranged from 929–4496 kg ha−1 for 2009EVDT and 1568–5594 kg ha−1 for IWDC2SYNF2. Application of N increased grain yield by 58–79% for 2009EVDT and 44–72% for IWDC2SYNF2 compared to zero (0 kg N) application. For 2009EVDT, high grain yield variability was simulated between 0 and 60 kg N with CV ranged from 10–41% compared to low variability ranged from 6.1–6.7% when applied N rate between 90 and 180 kg ha−1. In addition to the low variability in coefficient observed, the marginal yield increase between 90 and 180 kg N ha−1 suggests 90 kg N ha−1 as optimum rate with simulated grain yield ranging from 3792–4668 kg ha–1 which falls within breeder’s attainable yield range for the variety. In contrast, for IWDC2SYNF2 the simulated grain yield showed a more stable yield (year-to-year variations) at 120 kg N with marginal yield increase between 120 and 180 kg N ha−1. The results show that increasing N application beyond 120 kg N ha−1 resulted in marginal increase in grain yield. In the Sudan Savanna zone represented by Kano, the simulated mean yields ranged from 887–4733 kg ha−1 for 2009EVDT and 1153–4999 kg ha−1 for IWDC2SYNF2 across N application rates. The results further reveal high yield variability for both varieties with CV ranged from 10–56% (EVDT2009) and 10–34% (IWDC2SYNF2) between 0 and 60 kg N, compared to low CV (6–7%) estimated when fertilizer rates of between 90 and 180 kg N were applied. The simulated mean grain yield increased significantly from 0–90 kg N ha−1 (887–4271 kg ha−1 for 2009EVDT and 4549–4733 kg ha−1 for IWDC2SYNF2) with marginal mean yield differences between 120 and 180 kg N. The results suggest 120 kg N as optimum rate due to stable year–to–year variations in grain yield beyond which, may result to minimal increase beyond the N-rate for both varieties. In addition, mean grain yield increased by 59–81% for 2009EVDT and 53–77% for IWDC2SYNF2 when applied N rate from 30–180 kg ha−1 compared to zero (0 kg N).
The probability of exceedance was used to further explain the chances of simulating attainable yield threshold for both varieties across N application rates (Figure 5a–f). High yield variations were observed between 0 to 90 kg N when compared to N–fertilizer application from 120 to180 kg ha−1 across the sites for both varieties. In Abuja (Figure 5a,b) represented SGS zone, the probability of exceeding maize yield of at least 1000 kg ha−1 with no fertilizer application, would be 20% of the years for 2009EVDT and at the same threshold, 87% for IWDC2SYNF2 of all the years. These results suggest high yielding potential and drought tolerance trait of IWDC2SYNF2 than 2009EVDT. However, with increasing N–fertilizer rate, the probability of exceeding an attainable grain yield of 3000 kg ha−1 occur only 16% of the years with the application of 60 kg N and all the years between 90 and 180 kg N for 2009EVDT. Also, the probability of exceeding of 4000 kg ha−1 for IWDC2SYNF2, occur only 16% of the years with the application of 60 kg N ha−1 and 95% of the years between 90 and 180 kg N. Thus, the risk of attainable grain yield of 3000 kg ha−1 for 2009EVDT and 4000 kg ha−1 for IWDC2SYNF2 with 60 kg N ha−1 is high compared to N–rate between 90 and 180 kg ha−1 in Abuja.
In the NGS represented by Zaria (Figure 5c,d), maize yield of at least 1000 kg ha−1 occur only 48% of the years for 2009EVDT and at the same threshold, 93% of the years for IWDC2SYNF2, with no fertilizer application. Though, non-application of fertilizer is not advisable for maize production, the results suggest that IWDC2SYNF2 variety has higher advantage over 2009EVDT in the zone when little or no fertilizer is applied. The probability of exceeding an attainable grain yield of 3000 kg ha−1 for 2009EVDT occurred 75% of the years with N–application of 60 kg N ha−1 and all the years for application rates between 90 and 180 kg N ha−1. For IWDC2SYNF2, the probability of exceeding a grain yield threshold of 4000 kg ha−1 occur only 35% of the years with the application of 60 kg N ha−1 and all the years between 90 and 180 kg N ha−1. The risk of not exceeding the threshold with the application of 60 kg N ha−1 is higher for IWDC2SYNF2.
In the Sudan Savanna (SS) zone represented by Kano (Figure 5e,f), maize yield of at least 1000 kg ha−1 would be expected to occur 29% of the years for 2009EVDT and at the same threshold, 65% of the years for (IWDC2SYNF2) when no fertilizer is applied. The probability of exceeding grain yield threshold of 3000 kg ha−1 for 2009EVDT would be expected to occur 90% of the years at N application rate of 60 kg N ha−1 and all the years at application rates between 90 and 180 kg N ha−1. For IWDC2SYNF2, the probability of exceeding grain yield threshold of 4000 kg ha−1 at N application rate of 60 kg N ha–1 was 3% and almost all the years at application rates between 90 and 180 kg N ha−1. The result revealed higher risk with application of 60 kg N ha−1 for IWDC2SYNF2 than for 2009EVDT.

3.5. Profitability of Maize Production as Influenced by Varieties and N–Fertilizer Application

Figure 6 shows the scenarios analysis of simulated maize yield (2009EVDT and IWDC2SYNF2) for net income under different N–fertilizer applications in the Abuja, Zaria and Kano respectively. The results showed the net income for both varieties at varying N–fertilizer application for best, optimistic, realistic, pessimistic, and worst scenarios respectively across the studied sites. In Abuja (Figure 6a,b), the highest net income among the scenarios was attained at 90 kg N ha−1 for 2009EVDT and 120 kg N ha−1 for IWDC2SYNF2 with realistic net income of 536 US$ ha−1 for 2009EVDT and 870 US$ ha–1 for IWDC2SYNF2. Similarly, in Zaria (Figure 6c,d), the highest realistic net income of 657 US$ ha–1 was estimated for 2009EVDT with application of 90 kg N ha–1 while the net income of 974 US$ ha−1 was estimated for IWDC2SYNF2 with application of 120 kg N ha–1. The estimated net benefit was significantly higher by 100% for 2009EVDT and 86% for IWDC2SYNF2 when compared to no N–fertilizer application. On the contrary, in Kano the result shows that both maize varieties attained the highest net income when N–fertilizer was applied at 120 kg ha−1 with the highest realistic net income of 720 US$ ha−1 for 2009EVDT and 818 US$ ha−1 for IWDC2SYNF2 (Figure 6e,f). Generally, the results showed that lack of N or low quantities of fertilizer input to maize production across the Nigeria savanna would lead to no significant gain increase which could result in poor economic returns for farmers.

4. Discussion

The model was successfully calibrated and evaluated for the two contrasting varieties with high accuracy for days to anthesis, physiological maturity, LAI, grain yield and total dry matter. The high model accuracy with APSIM–maize showed that the model could be used as a tool for decision making with regards N application for the two varieties in the Nigeria Savannas. Our results agreed with those of MacCarthy et al. [51] who calibrated and evaluated the APSIM model and applied under different nutrient and crop residue management in semi-arid region of Ghana. These findings further agreed with recent study by Akinseye et al. [25] which showed that the APSIM–model was able to replicate the observed yield accounting for yield differences and variations in phenological development between two sorghum varieties in the Sudano–Sahelian zone, Sudan savanna zone and northern Guinea savanna agroecological zones of Nigeria.
There was dramatic response to N by both maize varieties simulated across the sites. This was not surprising because the soil analysis result shows low organic carbon (<1.0%) for all the locations as depicted in Table 1. The results were in agreement with earlier report by Devkota et al. [52], who found that response to N by crops is usually high when soil organic carbon is less than 1.0%. As shown in Figure 4, nitrogen response on both maize varieties was higher in Kano with increase in yield ranged from 59–81% for 2009EVDT and 53–77% for IWDC2SYNF2 when N–fertilizer (30–180 kg ha−1) was applied compared to zero N–fertilizer application, followed by Abuja where yield increased by 58–82% for 2009EVDT and 45–72% for IWDC2SYNF2 with N–application between 30–180 kg N ha−1compared to zero N–application. In Zaria, yield increase was up to 58–79% kg ha–1 for 2009EVDT and 44–72% kg ha−1 for IWDC2SYNF2 with N–application between 30–180 kg N ha–1 relative to zero N application. However, the simulated grain yield for both maize varieties showed more stable yield and low variability with no dramatic yield changes between 120 and 180 kg N ha1. These results suggest optimum N application rate at 120 kg ha−1 for both maize varieties in all the sites, except for 2009EVDT in Abuja and Zaria where no dramatic mean yield differences were simulated between 90 and 120 kg N ha–1. Additionally, the probability of yield exceeding 1000 kg ha−1 across the sites with no fertilizer application was much low and risky for 2009EVDT (Figure 5). This implies that there will be no dramatic yield output for farmers without application of nitrogen fertilizer on maize crop particularly the 2009EVDT variety in the Nigeria savannas. This confirmed earlier reports that N is a major limiting nutrient for maize production in the Nigerian savannas [12,15]. The very low probability (3–36%) exceeding desired yield of 4000 kg ha−1 for IWDC2SYNF2 at N application of 60 kg ha−1 is associated with higher risk across the sites. On the other hand, there is lower risk and high probability for exceeding the desired yield of 3000 kg ha−1 for 2009EVDT with N–application of 60 kg N ha−1 except in Abuja site where lower risk was obtained with N–application of 90 kg ha–1. For IWDC2SYNF2, the N rate must be increased to 90 kg N ha−1 in order to attain a yield of 4000 kg ha−1. Although there was dramatic response to N in Kano, the potential average grain yields were lower compared to Zaria and Abuja except for 2009EVDT. These results indicated the demand of variable and adjusted fertilizer rate recommendation in response to prevailing soil, weather and management conditions for the greater profitability and environmental benefits as well as high fertilizer use efficiency.
Averaged mean grain yield simulated across location for both varieties was generally higher in Zaria in the NGS followed by Abuja in the SGS while Kano in the SS gave lower yield compared to the other two locations. This could be attributed to relatively low organic C, high sand, low silt and clay contents in SS compared to NGS and SGS. Similar results of soil analysis in this study agree with Shehu et al. [53] who also reported low organic C, low total N, high sand, low silt and clay contents for Kano and other Sudan savanna zones. On the contrary, SGS has longer growing season and higher rainfall, low solar radiation due to high cloud cover, low soil nutrients, and high relative humidity during the crop growing periods may result to lower grain yield than that of Zaria in the NGS. This could probably be due to the low level of solar intensity that prevails during the cropping season in Abuja. Devkotaet al. [52] similarly reported that low levels of solar radiation during the maize growing season limits yield potential even at high organic carbon availability in Kaski District (Lumle) in Nepal. Generally, IWDC2SYNF2 yielded more compared to 2009EVDT in the Guinea Savannas suggesting that IWDC2SYNF2 can be a variety of choice in the Guinea savanna. This is because the longer length of the growing season (150–200 days) in GS supports the longer maturity variety resulting to higher yield potential [54]. In Kano there was no clear yield difference between 2009EVDT (early maturing) variety and IWDC2SYNF2 (intermediate variety). This suggests that IWDC2SYNF2 is not the ideal variety for the drier region due shorter length of the growing season and high variability of rainfall that in-turn lower yield potential if appropriate planting date is not followed for the variety.
Optimum N application rate is simulated at 120 kg N ha−1 for both varieties in Kano and for IWDC2SYNF2in Abuja and Zaria. Optimum yield was simulated at 90 kg N ha−1 in Zaria for 2009EVDT. The result of this study is contrary to the findings of Adnan et al. [19] who reported 90 kg N ha−1 as the optimum rate for early maturing varieties in the Sudan savanna of Nigeria using CERES–maize model. MacCarthy et al. [55] simulated optimum yield of early and extra-early maturing maize varieties at 60 kg N ha−1 while for intermediate maturing varieties optimum yield was simulated at 90 N kg ha−1 in the Guinea savannas of Ghana. These differences in rates for the Nigeria savanna and Ghana savannas may be due to differences in the soil conditions of these two regions. The result of this study is also contrary to findings of Fosu–Mensah et al. [26] who simulated optimum yield at moderate application of N 50 kg N ha−1 during the major season and 60 kg N ha–1 during the minor season in sub-humid Ghana using the APSIM model. The N rate for this study varies based on maize variety and agro-ecology. Similarly, the N rate from other studies referred in this study varied with locations and varieties. This implies that fertilizer application rates should be according to the variety and location
The decision aid scenarios analysis for both maize varieties showed variations for realistic net income on the investment under the optimum N–fertilizer rate which was based on the current agricultural practices. The non–application of fertilizer will return little or no benefits on the investment (Figure 5). The application of 90 kg N ha−1 was found as economic viable rate with highest realistic net income estimated for early-maturing variety 2009EVDT in Abuja and Zaria while the application of 120 kg N ha−1 indicated the highest realistic net income in Kano site. On the contrary, the application of 120 kg N ha−1 was found as economically viable rate and consistently recorded the highest realistic net income for IWDC2SYNF2 medium–maturing variety across the three sites. This result is in agreement with report of Buah et al. [56] (2009) in Guinea savannah region of Ghana and Adesoji et al. [1] in the northern Guinea savannah zone of Nigeria. They found that increasing N rate beyond 90 kg N ha−1 for early-maturing maize varieties did not give corresponding increase in yield and net benefit to justify the extra cost that may be incurred in term of extra N–fertilizer inputs. The additional 30 kg N ha−1 to attain economic viable rate of 120 kg N ha−1 for 2009E in Kano could be attributed to the low organic carbon content and resultant low nitrogen content in Sudan savannah soils as reported in several studies including Akinseye et al. [24] for sorghum varieties, Adnan et al. [19] for early maturing maize varieties. The extra 30 kg N ha−1 to attained economic viable rate of 120 kg N ha−1 for the medium maturing IWDC2SYNF2 is due to its higher yielding potential than the early maturing.

5. Conclusions

The APSIM–maize model was successfully calibrated and evaluated for the SGS, NGS and SS of Nigeria. It explicitly captured the effects of inorganic N fertilizer application on measured parameters for 2009EVDT and IWDC2SYNF2 maize varieties with all statistical indices within the acceptable range. Thus, indicating that the model is a useful decision support tool to help optimize fertilizer N application strategies to obtain the maximum economic and environmental efficiency for maize in the Nigeria Savannas. The response to mineral fertilizer (N) applications varied between locations and varieties. Application of 120 kg N ha−1 has shown to produce an agronomic optimum and stable yield for both varieties across the three sites except in Zaria where optimum yield for 2009EVDTis obtained at 90 kg N ha−1.The probability of obtaining desired grain yield of 3000 kg ha−1 and 4000 kg ha−1 for 2009EVDT and IWDC2SYNF2 respectively can be attained 95% of the years with application of between 90 and 180 kg N ha−1 across the three sites. For 2009EVDT, the application of 90 kg N ha−1is the most economically viable nitrogen rate in Abuja (SGS) and Zaria (NGS), while the application of 120 kg N ha−1 gives the highest realistic net income in Kano (SS) site. For IWDC2SYNF2, application of 120 kg N ha−1 is the most economically viable N rate across the three sites. The result of this study suggests that to obtain optimum and profitable yield, 90 kg N ha−1 can be recommended for 2009EVDT in Abuja and Zaria and 120 kg N ha−1 for IWDC2SYNF2 in both locations. Whereas in Kano, 120 kg N ha−1 should be applied to both varieties in order to obtain optimum and profitable yield.

Author Contributions

Conceptualization, A.B., A.Y.K., and J.M.J.; methodology, A.B., and A.Y.K.; validation, A.B., A.Y.K., A.M.A. and A.I.T.; formal analysis, A.B., A.M.A., and F.M.A.; field experimentation, A.B., and A.I.T., resources, A.Y.K.; data curation, A.B., A.Y.K., and F.M.A.; writing original draft preparation, A.B., A.Y.K., and F.M.A.; writing review and editing, A.B., A.Y.K., A.I.T., and F.M.A.; supervision, A.Y.K., J.M.J., and F.M.A.; funding acquisition, A.Y.K. All authors have read and agreed to the published version of the manuscript.

Funding

The Research was funded by the Bill and Melinda Gates Foundation through the Project Taking Maize Agronomy to Scale in Africa (TAMASA) with Grant no. OPP1113374.

Institutional Review Board Statement

Not applicable for studies not involving humans or animals.

Informed Consent Statement

Not applicable for studies not involving humans.

Data Availability Statement

Maize cultivars (2009EVDT and IWDC2SYNF2) were kindly provided by Dr. Abebe Menkir, maize breeder, IITA, Ibadan, Nigeria).

Acknowledgments

We wish to thank the Centre for Dryland Agriculture, Bayero University Kano for their partial support to undertake the field work. We thank the Nigerian Meteorological Agency (NIMET) for providing climate data and the staff of Agronomy unit of IITA, Kano office for collecting the experimental data in this research study.

Conflicts of Interest

The authors declare no conflict of interest.

References

  1. Adesoji, A.G.; Abubakar, I.U.; Labe, D.A. Economic performance of maize under incorporated legumes and Nitrogen in Northern Guinea Savanna zone of Nigeria. Asian J. Agric. Res. 2016, 10, 38–46. [Google Scholar] [CrossRef] [Green Version]
  2. Maziya-Dixon, B.; Akinyele, I.O.; Oguntona, E.B.; Nokoe, S.; Sanusi, R.A.; Harris, E. Nigerian Food Consumption and Nutrition Survey 2001–2003; Summary; International Institute of Tropical Agriculture—IITA: Ibadan, Nigeria, 2004. [Google Scholar]
  3. Badu-Apraku, B.; Fakorede, M.A.B.; Lum, A.F.; Akinwale, R. Improvement of yield and other traits of extra–early maize under stress and non–stress environments. Agron. J. 2009, 101, 381–389. [Google Scholar] [CrossRef]
  4. Kamara, A.Y.; Ekeleme, F.; Menkir, A.; Chikoye, D.; Omoigui, L.O. Influence of nitrogen fertilization on the performance of early and late–maturing maize varieties under natural infestation with Strigahermonthica. Arch. Agron. Soil Sci. 2009, 55, 125–145. [Google Scholar] [CrossRef]
  5. FAOSTAT. Production Statistics (Prodstat); Food and Agriculture Organization of the United Nations: Rome, Italy, 2018. [Google Scholar]
  6. Adnan, A.A.; Jibrin, M.J.; Kamara, A.Y.; Abdulrahman, B.L.; Shuaibu, A.S.; Garba, I.I. CERES–Maize model for determining the optimum planting dates of early maturing maize varieties in northern Nigeria. Front. Plant Sci. 2017, 8, 1–18. [Google Scholar] [CrossRef] [Green Version]
  7. Shehu, B.M.; Merckx, R.; Jibrin, J.M.; Kamara, A.Y.; Rurinda, J. Quantifying variability in maize Yield Response to Nutrient Applications in the Northern Nigerian Savanna. Agronomy 2018, 8, 18. [Google Scholar] [CrossRef] [Green Version]
  8. Jibrin, M.J.; Kamara, A.Y.; Ekeleme, F. Simulating planting date and cultivar effects on dryland maize production using CERES–maize model. Afr. J. Agric. Res. 2012, 7, 5530–5536. [Google Scholar]
  9. Ekeleme, F.; Jibrin, J.M.; Kamara, A.Y.; Oluoch, M.; Samndi, A.M.; Fagge, A.A. Assessment of the relationship between soil properties, Strigahermonthica infestation and the on–farm yields of maize in the dry Savannas of Nigeria. Crop Prot. 2014, 66, 90–97. [Google Scholar] [CrossRef]
  10. FDALR. Assessment of Soil Degradation in Nigeria; Project Report; Federal Department of Agricultural Land Resources: Abuja, Nigeria, 1999; p. 259.
  11. FFD. Fertilizer Use and Management Practices for Nigeria; Federal Fertilizer Department, Federal Ministry of Agriculture and Rural Development: Abuja, Nigeria, 2012; p. 215.
  12. Oikeh, S.O.; Chude, V.O.; Kling, G.J.; Horst, W.J. Comparative productivity of nitrogen-use efficient and nitrogen-inefficient maize varieties and traditional grain sorghum in the moist savanna of West Africa. Afr. J. Agric. Res. 2007, 2, 112–118. [Google Scholar]
  13. Berthelsen, M.; Fenger, J. (Eds.) Natural Nitrogen Deposition in Catchment; Gyldendal: Copenhagen, Denmark, 2005. [Google Scholar]
  14. Badu-Apraku, B.; Oyekunle, M.; Akinwale, R.O.; Lum, A.F. Combining ability of early–maturing white maize inbreeds under stress and non–stress environments. Agron. J. 2011, 103, 544–557. [Google Scholar] [CrossRef]
  15. Kamara, A.Y.; Menkir, A.; Ajala, S.O.; Kureh, I. Performance of diverse maize genotypes under nitrogen deficiency stress in the Northern Guinea savanna of Nigeria. Exp. Agric. 2005, 41, 199–212. [Google Scholar] [CrossRef]
  16. Kisaka, M.O.; Mucheru-Muna, M.; Ngetich, F.K.; Mugwe, J.N.; Mugendi, D.N.; Mairura, F.; Muriuki, J. Using APSIM–Model as a decision-support-tool for long–term integrated nitrogen–management and maize productivity under semi-arid conditions in Kenya. Exp. Agric. 2015, 1–12. [Google Scholar] [CrossRef]
  17. Keating, B.A.; Carberry, P.S.; Hammer, G.L.; Probert, M.E.; Robertson, M.J.; Holzworth, D.; Huth, N.I.; Hargreaves, J.N.G.; Meinke, H.; Hochman, Z. An overview of APSIM, a model designed for farming systems simulation. Eur. J. Agron. 2003, 18, 267–288. [Google Scholar] [CrossRef] [Green Version]
  18. Chenu, K.; Porter, J.R.; Martre, P.; Basso, B.; Chapman, S.C.; Ewert, F.; Bindi, M.; Asseng, S. Contribution of crop models to adaptation in wheat. Trends Plant Sci. 2017, 22, 472–490. [Google Scholar] [CrossRef] [PubMed]
  19. Adnan, A.A.; Jibrin, M.J.; Alpha, Y.; Kamara, A.Y.; Abdulrahman, B.L.; Shaibu, A.S.; Garba, I.I. Using CERES–Maize Model to Determine the Nitrogen Fertilization Requirements of Early Maturing Maize in the Sudan Savanna of Nigeria. J. Plant Nutr. 2017, 40, 1066–1082. [Google Scholar] [CrossRef]
  20. Jagtap, S.S.; Mornu, M.; Kang, B.T. Simulation of growth, development and yield of maize in the transition zone of Nigeria. Agric. Syst. 1993, 41, 215–229. [Google Scholar] [CrossRef]
  21. Claas, N.; Rotter, R.P.; Thorburn, P.J.; Boote, K.J.; Ewert, F. Editorial Introduction to the Special Issue “Modelling cropping systems under climate variability and change: Impacts, risk and adaptation”. Agric. Syst. 2018, 159, 139–143. [Google Scholar]
  22. Amarala, T.A.; Andradeb, C.L.T.; Duarteb, J.O.; Garciab, J.C.; Garcia, A.; Garciac, Y.; Silvad, D.F.; Albernaze, W.M.; Hoogenboom, G. Nitrogen management strategies for smallholder maize production systems: Yield and profitability variability. Int. J. Plant Prod. 2015, 9, 75–98. [Google Scholar]
  23. MacCarthy, D.S.; Vlek, P.L.G.; Bationo, A.; Tabo, R.; Fosu-Mensah, B.Y. Modelling nutrient and water productivity of sorghum in smallholder farming systems in a semi-arid region of Ghana. Field Crop. Res. 2010, 118, 251–258. [Google Scholar] [CrossRef] [Green Version]
  24. Delve, R.J.; Probert, M.E.; Cobo, J.G.; Ricaurte, J.; Rivera, M.; Barrios, E.; Rao, I.M. Simulating phosphorus response in annual crop using APSIM; model evaluation on contrasting soil types. Nutr. Cycl. Agroecosyst. 2009, 8, 293–306. [Google Scholar] [CrossRef]
  25. Akinseye, F.M.; Ajeigbe, H.A.; Traore, P.C.S.; Agele, S.O.; Zemadim, B.; Whitbread, A. Improving sorghum productivity under changing climatic conditions: a modelling approach. Field Crop. Res. 2020, 246, 1–11. [Google Scholar] [CrossRef]
  26. Fosu-Mensah, B.Y.; MacCarthy, D.S.; Vlek, P.L.G.; Safo, E.Y. Simulating impact of seasonal climatic variation on the response of maize (Zea mays L.) to inorganic fertilizer in sub-humid Ghana. Nutr. Cycl. Agroecosyst. 2012, 94, 1–19. [Google Scholar] [CrossRef]
  27. Kamanga, B.C.G.; Waddington, S.R.; Whitbread, A.M.; Almekinders, C.J.M.; Giller, K.E. Improving the Efficiency of use of small amounts of Nitrogen and Phosphorus Fertiliser on Smallholder Maize in Central Malawi. Exp. Agric. 2013, 5, 229–249. [Google Scholar] [CrossRef]
  28. Omotosho, J.B.; Agele, S.O.; Balogun, I.A.; Adefisan, E.A. Climate variability, crop–climate modelling and water ecophysiology research: implications for plant’s capacities for stress acclimation, yield production and food security. Glob. J. Plant Ecophysiol. 2013, 3, 56–69. [Google Scholar]
  29. Ayanlade, A. Seasonality in the daytime and night–time intensity of land surface temperature in a tropical city area. Sci. Total Environ. 2016, 557, 415–424. [Google Scholar] [CrossRef] [PubMed]
  30. Jagtap, S.S. Changes in Annual, Seasonal and Monthly Rainfall in Nigeria during 1961–1990 and Consequences to Agriculture. Discov. Innov. 1995, 7, 311–426. [Google Scholar]
  31. FAO-UNESCO. Soil Map of the World; UNESCO: Paris, France, 1974; Volume I, p. 59. [Google Scholar]
  32. Lombin, G. Soil and climate constraints to crop production in the Nigerian savanna region. In Proceedings of the 15th Annual Conference of Soil Science Society of Nigeria, Kaduna, Nigeria, 20–24 September 1987. [Google Scholar]
  33. IITA. Automated and Semi-Automated Methods for Soil and Plant Analysis; Manual Series No. 7; IITA: Ibadan, Nigeria, 1989. [Google Scholar]
  34. Esu, I.E. Detailed Soil Survey of NIHORT Farm at Bunkure, Kano State, Nigeria; Institute for Agricultural Research (IAR) ABU: Zaria, Nigeria, 1991; pp. 27–37.
  35. Landon, J.R. Booker Tropical Soils Manual; Longman Publishers: Harlow, UK, 1991; p. 134. [Google Scholar]
  36. NSPFS. Nigerian Soil Fertility Rating and Thematic Fertility Maps; National Special Programme for Food Security (NSPFS): Abuja, Nigeria, 2005. [Google Scholar]
  37. Saxton, K.E.; Rawls, W.J. Soil water characteristic estimates by texture and organic matter for hydrologic solutions. Soil Sci. Soc. Am. J. 2006, 70, 1569–1578. [Google Scholar] [CrossRef] [Green Version]
  38. FAO. Reference Base for Soil Resources. A Framework for International Classification, Correlation and Communication; World Soil Resources Reports 103; FAO: Rome, Italy, 2006. [Google Scholar]
  39. Holzworth, D.P.; Huth, N.I.; deVoil, P.G.; Zurcher, E.J.; Herrmann, N.I.; McLean, G.; Chenu, K.; van Oosterom, E.; Snow, V.; Murphy, C.; et al. APSIM evolution towards a new generation of agricultural systems simulation. Environ. Model. Softw. 2014, 62, 327–350. [Google Scholar] [CrossRef]
  40. Kirschbaum, M.U.; Carter, J.O.; Grace, P.R.; Keating, B.A.; Keenan, R.J.; Landsberg, J.J.; McKeon, G.M.; Moore, A.D.; Paul, K.I.; Pepper, D.A.; et al. Brief description of several models for simulating net ecosystem exchange in Australia. In Net Ecosystem; Cooperative Research Centre for Greenhouse Accounting: Canberra, Australia, 2001; pp. 8–29. [Google Scholar]
  41. Dalgliesh, N.; Hochman, Z.; Huth, N.I.; Holzworth, D. Field Protocol to AP Soil Characterisations; Version 4; CSIRO: Canberra, Australia, 2016. [Google Scholar]
  42. Carberry, P.S.; Abrecht, D.G. Tailoring crop models to the semi–arid tropics. In Climatic Risk in Crop Production: Models and Management for the Semi–Arid Tropics and Subtropics; Muchow, R.C.T., Bellamy, J.A., Eds.; CAB International: Wallingford, UK, 1991; pp. 157–182. [Google Scholar]
  43. Probert, M.E.; Dimes, J.P.; Keating, B.A.; Dalal, R.C.; Strong, W.M. APSIM’s water and nitrogen modules and simulation of the dynamics of water and nitrogen in fallow systems. Agric. Syst. 1998, 56, 1–28. [Google Scholar] [CrossRef]
  44. Xevi, E.; Gilley, J.; Feyen, J. Comparative study of two crop yield simulation models. Agric. Water Manag. 1996, 30, 155–173. [Google Scholar] [CrossRef]
  45. Jamieson, P.D.; Porter, J.R.; Wilson, D.R.A. Test of the computer simulation model ARC25 WHEAT on the wheat crop grown in Zealand. Field Crop. Res. 1991, 27, 337–350. [Google Scholar] [CrossRef]
  46. Archontoulis, V.S.; Fernando, E.M.; Kenneth, J.M. A methodology and an optimization tool to calibrate phenology of short–day species included in the APSIM PLANT model: Application to soybean. Environ. Model. Softw. 2014, 62, 465–477. [Google Scholar] [CrossRef]
  47. Akinseye, F.M.; Adam, M.; Agele, S.O.; Hoffmann, M.P.; Traore, P.C.S.; Whitbread, A.M. Assessing crop model improvements through comparison of sorghum (Sorghum bicolor L. moench) simulation models: A case study of West African varieties. Field Crop. Res. 2017, 201, 19–31. [Google Scholar] [CrossRef] [Green Version]
  48. Gomes, F.P. Experimental Statistics Course; Nobel: Sao Paulo, Brazil, 1985; p. 467. [Google Scholar]
  49. CIMMYT–International Maize and Wheat Improvement Centre. From Agronomic Data to Farmer Recommendations: “An Economics Training Manual”, Completely Revised Edition; CIMMYT: Mexico City, Mexico, 1988. [Google Scholar]
  50. Ajeigbe, H.A.; Akinseye, F.M.; Kamara, A.Y.; Tukur, A.; Ayuba, K. Productivity, Water use efficiency and profitability of Pearl millet (Pennisetum glaucum) under different Nitrogen applications in Sudanian Agro-ecological zone of Nigeria. Int. J. Agron. 2020, 2020, 1802460. [Google Scholar] [CrossRef]
  51. MacCarthy, D.S.; Vlek, P.L.G. Impact of climate change on sorghum production under different nutrient and crop residue management in semi–arid region of Ghana. Afr. Crop Sci. J. 2012, 20, 243–259. [Google Scholar]
  52. Devkota, K.P.; McDonald, A.J.; Khadka, L.; Khadka, A.; Paudel, G.; Devkota, M. Fertilizers, hybrids, and the sustainable intensification of maize systems in the rain–fed mid–hills of Nepal. Eur. J. Agron. 2016, 80, 154–167. [Google Scholar] [CrossRef]
  53. Shehu, B.M.; Jibrin, J.M.; Samndi, A.M. Fertility Status of Selected Soils in the Sudan Savanna Biome of Northern Nigeria. Int. J. Soil Sci. 2015, 10, 74–83. [Google Scholar] [CrossRef] [Green Version]
  54. Chianu, J.N.; Tsujii, H.; Mbanasor, J. Determinants of the decision to adopt improved maize variety by smallholder farmers in the savannas of northern Nigeria. J. Food Agric. Environ. 2007, 5, 318–324. [Google Scholar]
  55. MacCarthy, D.S.; Adiku, S.G.K.; Freduah, B.S.; Gbefo, F.; Kamara, A.Y. Using CERES–Maize and ENSO as Decision Support Tools to evaluate climate–sensitive farm management practices for maize production in the northern regions of Ghana. Front. Plant Sci. 2017, 8, 1–13. [Google Scholar] [CrossRef] [Green Version]
  56. Buah, S.S.J.; Abatania, L.N.; Aflakpui, G.K.S. Quality protein maize response to nitrogen rate and plant density in the Guinea Savanna Zone of Ghana. West Afr. J. Appl. Ecol. 2009, 16, 9–21. [Google Scholar] [CrossRef] [Green Version]
Figure 1. (ad) - Cumulative monthly rainfall and temperature over a 31–year period (1985–2015) for Abuja (a), Zaria (b), Kano (c) and Start and length of growing (d) Source of data: NIMET, 2016).
Agronomy 11 00076 g001
Figure 2. (ad) - Comparison of observed and simulated for grain yield and total dry matter (TDM) at across N–fertilizer applications in two growing seasons (2016 and 2017) at Abuja and Zaria for 2009EVDT maize variety.
Agronomy 11 00076 g002
Figure 3. (ad)- Comparison of observed and simulated for grain yield and total dry matter (TDM) at across N–fertilizer applications in two growing seasons (2016 and 2017) at Abuja and Zaria for IWDC2SYNF2maize variety.
Agronomy 11 00076 g003
Figure 4. Box plot of 31 years (1985–2015) simulated grain yield for 2009EVDT and IWDC2SYNF2 applied under varying N–fertilizer in Abuja, Zaria and Kano respectively. The boundary of the box closest to zero indicates the 25th percentile; a line within the box marks the median, and the upper boundary of the box indicates the 75th percentile. Whiskers above and below the box indicate the 95th and 5th percentiles.
Agronomy 11 00076 g004
Figure 5. - Probability of exceedance for simulated grain yield of EVDT2009 and IWDC2 in Abuja (a,b), Zaria (c,d) and Zaria (e,f) representing three agro ecological zones under semi-arid region.
Agronomy 11 00076 g005aAgronomy 11 00076 g005b
Figure 6. (af) - Scenario analysis of net income of maize yield (2009EVDT and IWDC2SYNF2) simulated under different N–fertilizer rates in the Abuja, Zaria and Kano representing SGS, NGS and SS agro-ecological zones of Nigeria (1 USD = 359.99 NGN).
Agronomy 11 00076 g006
Table 1. Soil physical and chemical properties used for the model application sites.
DepthAir DryLL
(mm/
mm)
DULSATBDOCFBiomFInertSandSiltClaypHNO3NH4
(cm)(mm/mm)(mm/
mm)
(mm/
mm)
(g/
cm3)
(%)(0–1)(0–1)(%)(%)(%)(1:5 H20)(kg/
ha)
(kg/
ha)
Experimental Site (Abuja)
0–200.170.290.390.421.890.580.040.4034.9316.0049.074.991.670.64
20–500.200.160.290.471.640.230.020.6032.9342.0025.074.794.260.27
50–850.190.120.270.421.640.290.020.8032.9350.0017.074.663.830.84
85–1300.190.120.260.421.630.150.020.9534.9348.0017.074.853.730.79
130–1900.170.150.280.411.630.080.010.9534.9340.0025.074.703.530.74
Experimental Site (Zaria)
0–110.060.120.270.461.250.570.020.5538.0042.0020.005.612.590.74
011–590.090.130.330.451.310.310.020.8021.0030.0049.005.482.240.52
59–1000.110.120.360.381.530.120.150.9026.0024.0050.004.561.510.61
100–1380.120.150.390.41.570.130.110.8928.0026.0046.004.901.490.64
138–1850.110.110.350.391.590.080.010.9528.0024.0048.005.570.490.64
185–2370.100.110.350.391.60.120.010.8526.0022.0036.005.110.480.56
Experimental Site (Kano)
0–130.070.140.240.281.660.300.020.3582.0013.005.006.572.750.60
13–470.070.140.240.321.720.180.020.4080.0013.007.006.772.130.29
47–740.090.180.280.341.600.080.010.5086.009.005.006.991.350.24
74–970.010.190.290.351.670.060.010.8086.009.005.007.153.640.25
97–1300.090.180.280.371.700.060.010.8086.007.007.007.172.600.20
130–1840.070.100.270.221.700.040.010.8084.007.009.007.282.440.20
Note: LL15 = lower limit at 15 barmetric pressure, DUL = drained upper limit, SAT: volumetric water content at saturation, BD = bulk density, OC = organic carbon content, NO3 = Nitrate content and NH4 = Ammonium content.
Table 2. Calibrated cultivar-specific parameters for 2009EVDT and IWDC2SYNF2 maize varieties.
ParametersAcronymUnit2009EVDTIWDC2SYNF2Remark
Thermal Time Accumulation
Duration from emergence to end of juvenile tt_emerg_to_endjuv°C day210260Calibrated
Duration—end of juvenile to flowering initiation est_days_endjuv_to_init°C day2030Calibrated
Duration—flag leaf to flowering stage tt_flag_to_flower°C day5050Default
Hour—Photoperiod critical 1Photoperiod crit_1Hour12.512.5Default
Hour—Photoperiod critical 2Photoperiod crit_2Hour2424Default
Duration—flowering to start of grain filling tt_flower_to_start_grain°C day170120Calibrated
Duration, flowering to maturitytt_flower_to_maturity°C day650850Calibrated
Duration—maturity to seed ripening tt_maturity_to_ripe units°C day11Default
Grain maximum number per headhead_grain_no_max 700850Calibrated
Grain growth rate grain_gth_ratemg/day19.515.5Calibrated
Base temperature t_base°C day1010Default
Table 3. Comparison of observed and simulated parameters for phenological development, leaf area index (LAI), total dry matter (TDM) and grain yield, after model calibration.
Cultivar/ParametersUnitObserved RangeMean ObservedPredicted RangeMean PredictedMBERMSERMSEn
(%)
EVDT2009
50% AnthesisDAP48–525047–59522.03.36.5
Physiological maturity87–949081–9788−1.23.43.7
LAIm2/m22.69–2.942.742.38–3.022.740.020.248.60
Total dry matter Kg ha−112,467–13,81413,08513,219–14,10513,5754905174
Grain yieldKg ha−15384–588756675613–624459512873015
IWDC2SYNF2
50% Anthesis DAP58–605955–65590.32.94.9
Physiological maturity103–10810599–114105−0.94.24.0
LAIm2/m22.89–3.232.842.41–3.302.91−0.120.311.4
Total dry matter Kg ha−114,504–16,92415,48313,532–16,02214,529−9549886.4
Grain yield Kg ha−16371–701767516658–75907114−3643836
Note: Number of observations = 9.
Publisher’s Note: MDPI stays neutral with regard to jurisdictional claims in published maps and institutional affiliations.

