Article

Adaptation to Water and Salt Stresses of Solanum pimpinellifolium and Solanum lycopersicum var. cerasiforme

by
Mary-Rus Martínez-Cuenca
1,
Leandro Pereira-Dias
2,
Salvador Soler
2,
Lidia López-Serrano
1,
David Alonso
2,
Ángeles Calatayud
1 and
María José Díez
2,*
1
Instituto Valenciano de Investigaciones Agrarias (IVIA), CV-315, Km 10.7, 46113 Moncada, Valencia, Spain
2
Instituto Universitario de Conservación y Mejora de la Agrodiversidad Valenciana (COMAV), Universitat Politècnica de València, Camino de Vera s/n, 46022 Valencia, Spain
*
Author to whom correspondence should be addressed.
Agronomy 2020, 10(8), 1169; https://doi.org/10.3390/agronomy10081169
Submission received: 25 June 2020 / Revised: 4 August 2020 / Accepted: 6 August 2020 / Published: 10 August 2020

Abstract

:
Solanum pimpinellifolium and Solanum lycopersicum var. cerasiforme represent a valuable tool for tomato breeding, particularly for tolerance to abiotic stresses. Water stress and salinity are major constraints to tomato’s cultivation, and for which limited genetic variability has been reported within the cultivated species. We evaluated four accessions of S. pimpinellifolium and four of S. l. var. cerasiforme for their adaptation to water deficit and salinity. The CO2 assimilation rate, stomatal conductance, substomatal CO2 concentration, transpiration rate, and leaf chlorophyll concentration were evaluated, as well as morphological and agronomic traits. The accessions showed a remarkable inter- and intra-species response variability to both stresses. Two S. pimpinellifolium accessions and one S. l. var. cerasiforme showed unaltered physiological parameters, thus indicating a good adaptation to water deficit. Two S. l. var. cerasiforme accessions showed an interesting performance under salt stress, one of which showing also good adaptation to water stress. In general, both stresses showed a negative impact on leaf size and fruit fresh weight, especially in the big-sized fruits. However, flowering, fruit setting and earliness remained unaltered or even improved when compared to control conditions. Stressed plants yielded fruits with higher ° Brix. Response to stresses seemed to be linked to origin environmental conditions, notwithstanding, variability was observed among accessions of the same region.

1. Introduction

Water deficit and salinity are two of the most important abiotic stresses that limit both productivity and quality of crops [1]. Plant responses to these stresses involve adaptive changes and, frequently, deleterious effects [2]. Water deficit prevents plant development by decreasing the plant’s relative water content and water potential in their tissues, and consequently the closure of the stomatal complex. This leads to osmotic stress, limited nutrient uptake, reduced photosynthetic activity, oxidative stress, and growth inhibition [3]. Likewise, net photosynthesis can be lowered by mesophyll conductance restriction or by impairing CO2 fixation reactions [4]. The effect of salinity on plants is more complex and involves two phases: osmotic stress, similar to the one induced by water deficit, and toxic effect produced by the ionic accumulation on leaves that gives rise to imbalances between nutrients and induces metabolic damage [5,6]. Plants have developed different adaptive strategies to face these stresses, such as osmotic adjustment by accumulation of compatible solutes, stomatal closure, reactive oxygen species (ROS) detoxification and, in the case of salt tolerance, mechanisms of ionic exclusion or intercellular ion compartmentalization [7].
Cultivated tomato (Solanum lycopersicum L.) is very sensitive to water stress, especially during flowering and fruit enlargement stages [8]. In addition, tomato is moderately sensitive to salinity levels higher than 2.5–3.0 dS m−1 [9,10]. Genetic variability for salt and water stresses tolerance in tomato has been found limited; nonetheless, sources of tolerance have been reported in its wild relatives that can be exploited in breeding [11,12,13,14]. However, most of these species are difficult to cross with cultivated tomato, giving rise to embryo abortion and making difficult the progress of breeding works. This fact and the complex genetic control of the tolerance to salinity and water stress have hampered the introgression of salt/drought tolerance from distant wild relatives into cultivated tomato [12].
The wild species Solanum pimpinellifolium has a bushy growth type and inhabits the coastal regions of Ecuador, Peru, and northern Chile. The natural range of S. pimpinellifolium encompasses such differing environments as the northern coastal Ecuadorian tropical rainforests and the Peruvian coastal desert [15]. In central and southern Peru, S. pimpinellifolium is restricted to cultivated fields, roadsides and dumping grounds, and its distribution is sparse, whereas in northern Peru and Ecuador it is found in wild and dense populations located in undisturbed areas [16,17]. This species with such a wide range of distribution is a potential source of alleles of interest for tolerance to abiotic stresses. Numerous quantitative trait loci (QTLs) conferring tolerance to abiotic stresses have been identified in S. pimpinellifolium [18,19]. Several accessions have been characterized as tolerant to salt stress and are promising sources of genes and alleles for improvement of salinity tolerance in the cultivated tomato [18,20,21,22,23,24,25,26,27,28]. Rao et al. [29] tested a collection of 94 accessions of S. pimpinellifolium to saline stress and found five accessions possessing better survival traits, seven with good yield traits and two combining both under salt stress. Later, the same group conducted an association study to identify variation linked to salt tolerance traits in four candidate genes [30] including the dehydration responsive element binding (DREB1A) and Pyrophosphatase (VP1.1) genes. Recently, the accession LA0480 has been sequenced and tested for its tolerance to salinity [31], suggesting that S. pimpinellifolium offers a wealth of breeding potential for desirable traits and concretely an enrichment in genes involved in biotic and abiotic stresses responses [32].
The Solanum lycopersicum variety cerasiforme grows spontaneously worldwide in tropical and subtropical regions [33]. It has been collected in a wide range of habitats, from deserts to very humid regions at altitudes that range from sea level to 2400 m [34], although it prefers humid areas below 1200 m. It is widely distributed close to human-modified areas, such as irrigation canals, home gardens and orchards. This botanical variety has been far less studied than S. pimpinellifolium. Its adaptation to water deficit and salinity has been recently tested by Diouf et al. [35] using a Multi-parent Advanced Generation Inter-Cross (MAGIC) population derived from the cross of eight parental lines, four of them belonging to S. l. var. cerasiforme and four to S. l. var. lycopersicum. Even using the eight parents of the same species, they were able to identify 54 QTLs linked to fruit quality traits, flowering and ripening earliness, and vegetative traits. Impact of water deficit and salt stress was found for most traits, with a positive effect on soluble solids content. Remarkably, some lines increased, simultaneously, fruit weight and soluble solid content under both stresses [35]. Using the high-resolution mapping constructed from the MAGIC population it was possible to detect candidate genes, to specify the allelic effect of each parental line at the QTL, and the sequence information of the eight parental lines.
We are constructing a MAGIC population from eight parents, four belonging to S. pimpinellifolium and four to S. l. var. cerasiforme species. These genotypes were selected to maximize their genetic diversity and origin from diverse habitats and environmental conditions [36,37]. In order to evaluate the adaptability and response of each accession to both water and salinity stresses and to further study their genetic control in the MAGIC population, we have measured different physiological parameters like the CO2 assimilation rate (AN), stomatal conductance to water vapor (gs), instantaneous carboxylation (AN/Ci) and water use efficiency (AN/E), as well as several morphological and agronomic vegetative, flowering and fruits traits in an experiment comparing three treatments: water deficit, salinity, and a control. The relation between the responses and the origin of their climatic conditions and accession domestication level is discussed herein.

2. Materials and Methods
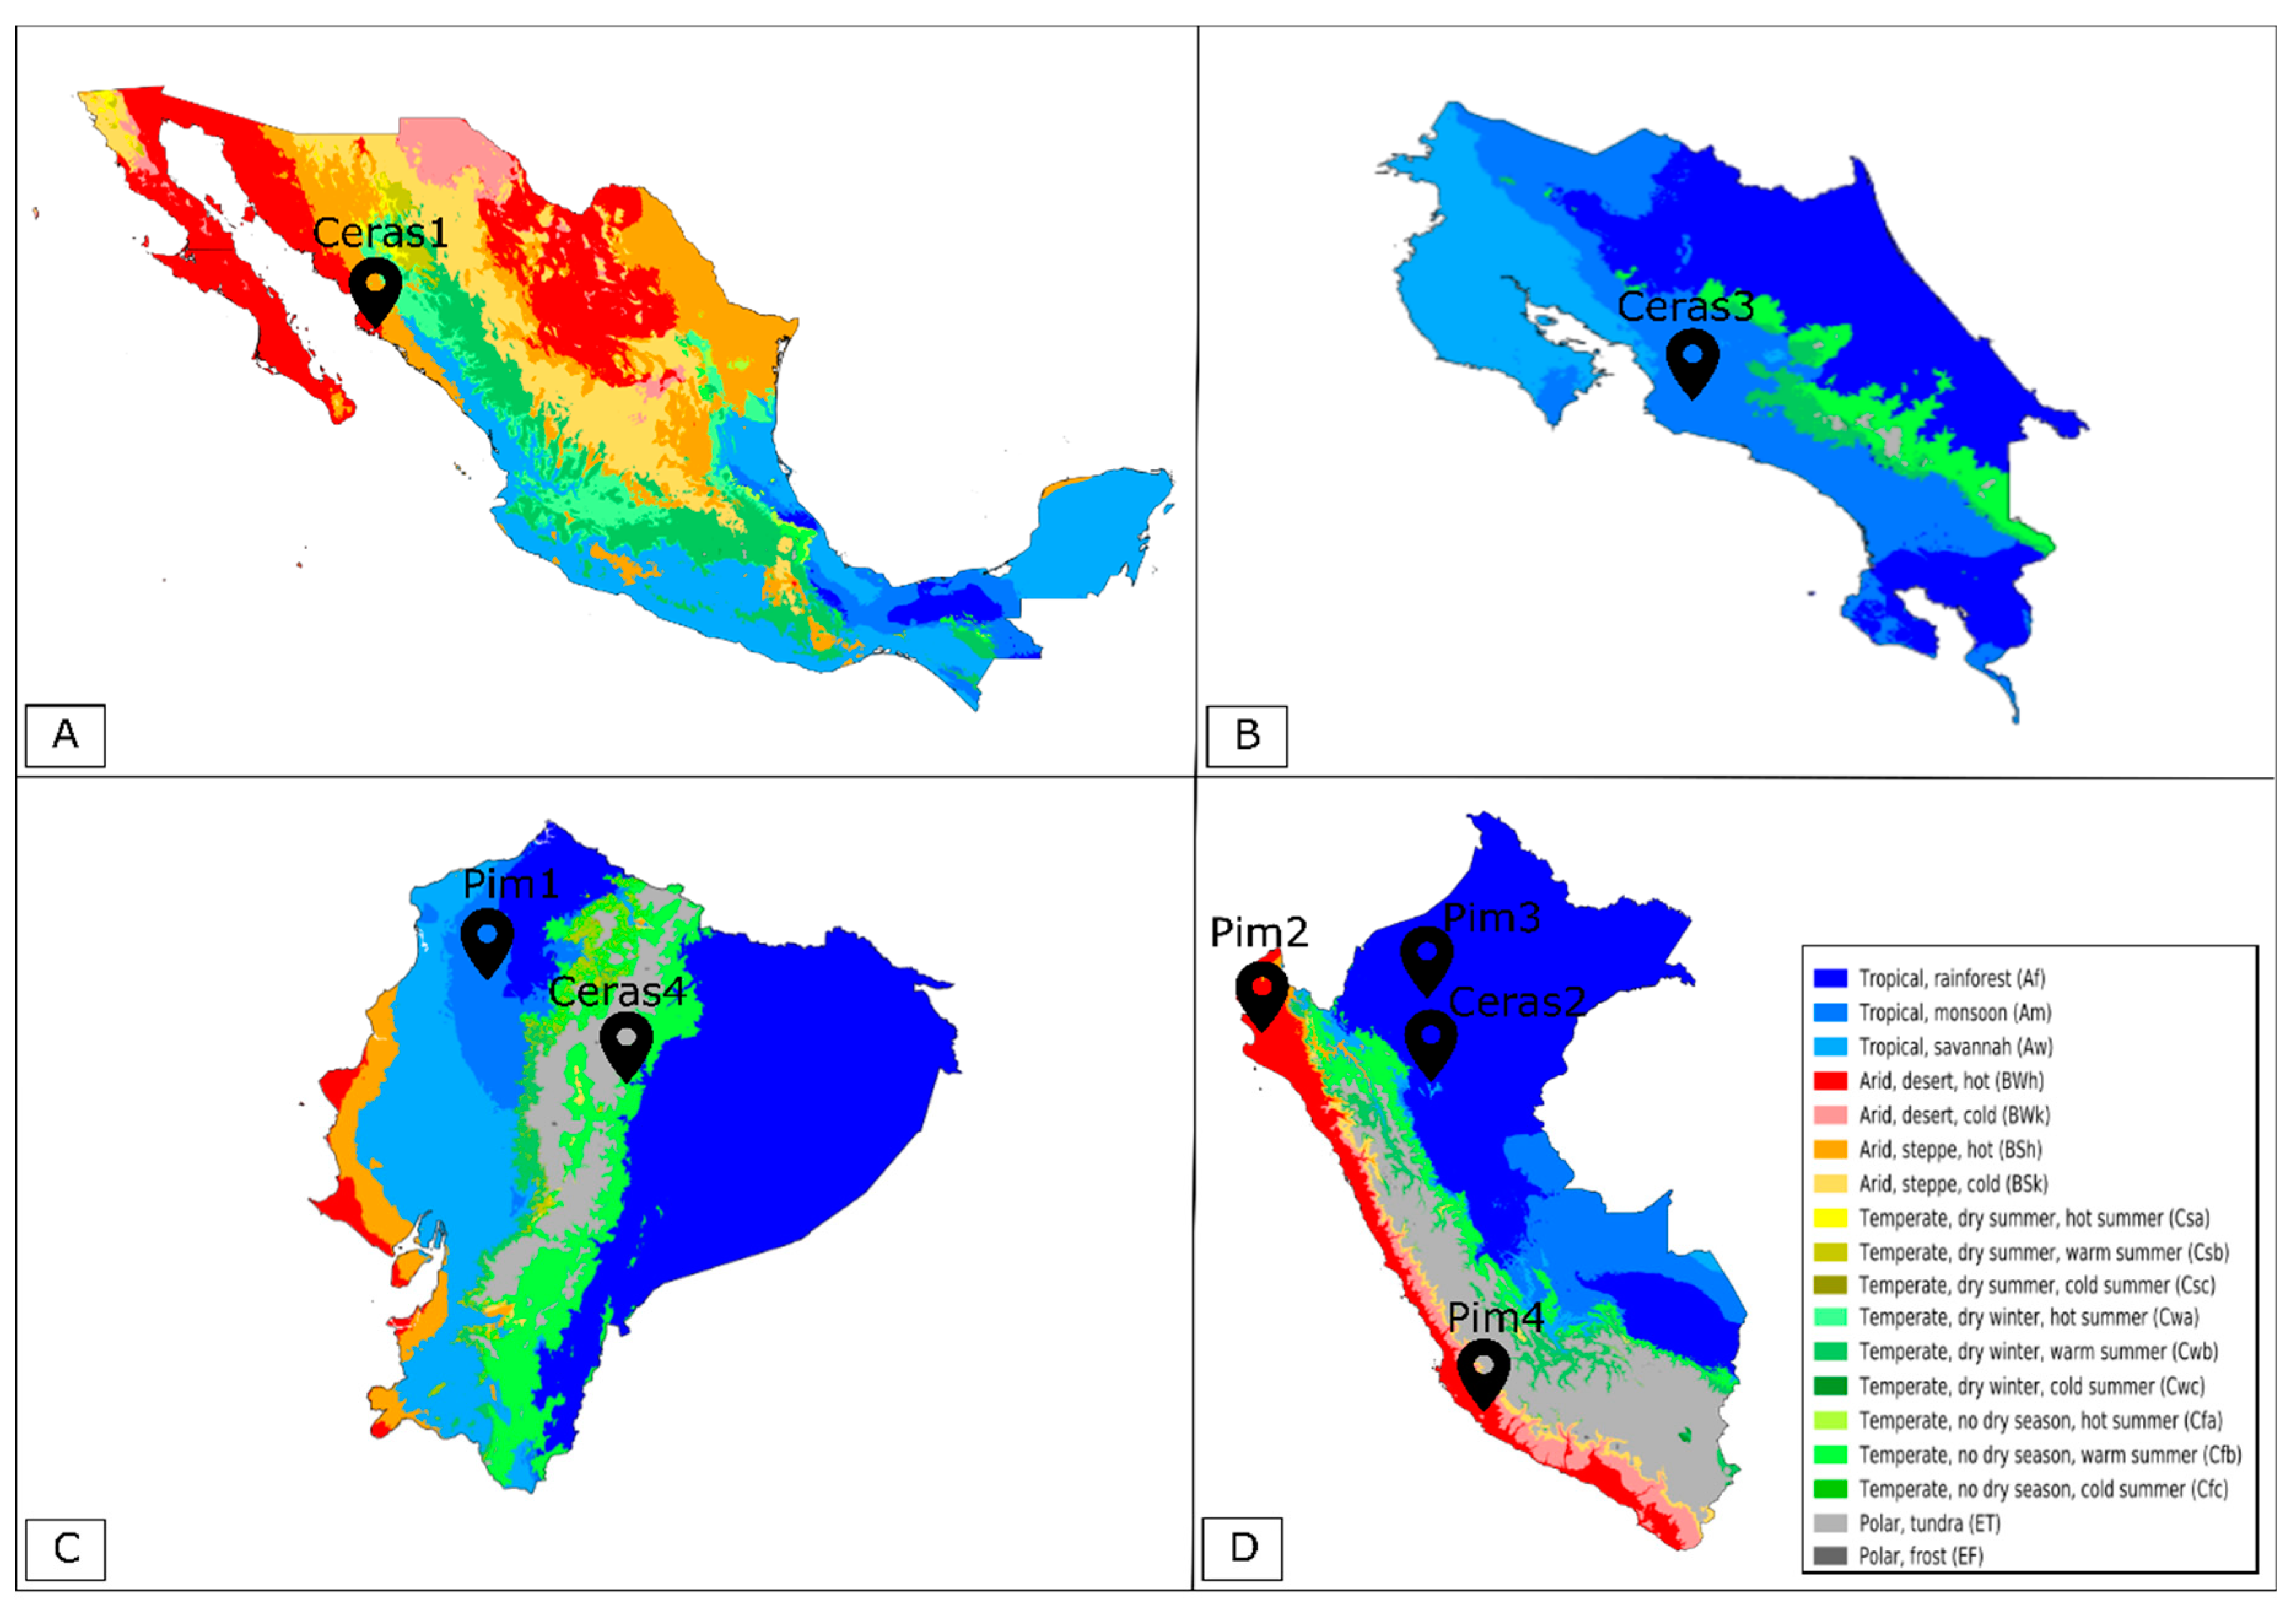
2.1. Plant Material

Plant material consisted of four accessions of S. pimpinellifolium and four accessions of S. l. var. cerasiforme (Table 1). The range of distribution of the accessions of S. pimpinellifolium encompasses very humid environments as the ones of Manabí province (Ecuador) and the Amazonian region in the north of Peru, and dry areas of Northern Peru (Piura) and the coastal desert of Peru. In these areas, the range of temperatures and pluviometry is very high (Figure 1). The four accessions of S. l. var. cerasiforme come from very diverse areas, from the Sinaloa desert in Mexico, where S. l. cerasiforme grows as a wild, to the highly humid area of San Martín (Peru), where a richness of morphological variability exists. Plant material was provided by the COMAV’s genebank (Universitat Politècnica de València, Valencia, Spain), except LA2251 which was provided by the Tomato Genetic Resources Centre (University of California, Davis, USA) and the accession PI 487625 from the US Department of Agriculture (USDA, Washington D.C., USA) (Table 1).

2.2. Experimental Design and Greenhouse Conditions

Tomato seeds were germinated in moistened perlite at 28 °C under greenhouse conditions. Seedlings were transferred to 15 L pots filled with 3.4 Kg of 100% natural coconut coir fibre (225 g L−1 density, Cocopeat, Projar Co., 46930 Quart de Poblet, Valencia, Spain) in a heated polyethylene greenhouse on September 10th 2018 at the Instituto Valenciano de Investigaciones Agrarias (IVIA, Valencia, Spain; 39°35′22.3″ N 0°23′44.0″ W, 37 m above sea level). Plants were drip-irrigated with nutrient solution containing (all in mM): 14 NO3, 1 H2PO4−, 2 SO42−, 1 NH4+, 16 K+, 4 Ca2+ and 2 Mg2+. Micronutrients were also provided (all in μM): 15 Fe2+, 10 Mn2+, 5 Zn2+, 30 B3+, 0.75 Cu2+ and 0.6 Mo6+) [40]. The electrical conductivity (EC) of the nutrient solution was 1.4 dS m−1 and pH 6.1.
After 15 days in pots (at six true-leaves stage), plants were divided into three groups for the control, water and saline stress treatments. Plants were irrigated by drip irrigation system and water doses in control plants was calculated weekly based on estimations of crop evapotranspiration (ETc) [41], and fractionated in two daily applications (morning and afternoon). The nutrient saline solution was allowed to drain freely from pots and the control drainage was controlled from 10% to 20% depending on solar radiation. Water stress treatment began by reducing the volume of irrigation water to 40% of the control. Salinity treatment began by adding NaCl (70 mM) to the irrigation solution to reach an EC of 8 dS m-1 and pH 6.1. Plants were pruned at one stem. Both stresses were conducted simultaneously.
Physiological and phenotypic measurements were taken at 75 and 120 days after the water deficit and salinity treatments (DAT) began. The layout was completely randomized with four replications per treatment and two plants per replication. A total of eight plants per accession were used in each treatment.
During the experiments, plants were grown under natural light conditions with a maximum Photosynthetically Active Radiation (PAR) of 1000 µmol m−2 s−1 (800–1000 µmol m−2 s−1), a mean temperature of 21 °C (18–24 °C) and a mean humidity of 60% (50–70%).

2.3. Gas Exchange Measurements

The CO2 assimilation rate (AN, µmol CO2 m−2 s−1), stomatal conductance to water vapor (gs, mol H2O m−2 s−1), substomatal CO2 concentration (Ci, µmol CO2 mol−1 air) and transpiration rate (E, mmol H2O m−2 s−1) were measured with a portable LI-COR 6400 infrared gas analyzer (Li-Cor Inc., Lincoln, NE, USA). In addition, parameters AN/Ci and AN/E were calculated as instantaneous carboxylation and water use efficiency, respectively, at the end of the experiment. Measurements were taken under saturating light conditions (1000 µmol quanta m−2 s−1), with reference CO2 (400 µmol CO2 mol−1) at 24 °C (24 °C ± 2) and 75% relative humidity (75% ± 10). To guarantee their accuracy, readings were kept after all gas exchange parameters were stabilized and their corresponding variation coefficients were lower than 1%. The terminal lobe of fully expanded and non-detached leaves (3rd–4th leaf position from the apex) were used for the measurements taken from 09:00 h to 11:00 h (UT + 01:00 h). Eight different plants were used (n = 8) per accession and treatment (control, water, and salt stresses).

2.4. Leaf Chlorophyll Concentration Measurement by Soil Plant Analysis Development (SPAD) Chlorophyll Meter

SPAD was estimated using a portable SPAD-502 meter (Konica Minolta, Tokyo, Japan). Measurements were done in the same leaves used for gas exchange, taking 3 measurements in each leaf and calculating the mean value. Eight different plants were used (n = 8) per accession and per treatment (control, water, and salt stress) at the end of the experiment.

2.5. Agronomic and Phenotypic Traits

Plants were phenotyped for vegetative, flower and fruit traits in order to determine the effect of salinity and water deficit treatments on plant development. Vegetative traits recorded were length (cm) and width (cm) of the whole leaf and of the terminal lobe at 75 and 120 days after treatment started. The following traits were recorded in each plant for the first four trusses to measure stress effects on flowering, fruit set and earliness: number of flowers per truss, number of fruits per truss, fruit set (measured as the number of fruits divided by the number of flowers for the four first trusses), flowering and maturity earliness (measured as the number of days between the transplant and the opening of the first flower, and between the transplant and the first ripe fruit, respectively). Fruit fresh weight (g) was measured for each plant by calculating the average of ten ripe fruits individually weighted and randomly collected from the first four trusses at 120 days after the treatment began. Total soluble solids content (°Brix) was measured using the juice of the ten weighted fruits using a manual refractometer (HI96801, Hanna Instruments S.R.L, Woonsocket, Rhode Island, USA).

2.6. Statistical Analyses

The results of all parameters were analyzed by two-way ANOVA (accessions × treatments; StatPoint Technologies, Warrenton, VA, USA) to estimate the main effects and their interactions considering all accessions (Supplemental material, Tables S1–S7). Given that plants showed a great phenotypic and origin variability, it has been also done one-way ANOVA to analyze the behavior of each accession individually after water and salinity stresses were applied and in comparison to their respective controls. There were not significant differences among plants from the same accession and treatment.
The analysis was performed at 75 and 120 after treatment began. The mean comparisons were made using Fisher’s least significance difference (LSD) test at p < 0.05.

3. Results

S. l. var. cerasiforme accession Ceras4 showed a physiological disorder after the transplant to the greenhouse. This disorder consisted on the formation of intumescences on the abaxial part of the leaves that progressed distorting the leaves and giving a generalized necrosis that killed the plants. In some cases, the disorder affected also stems and petioles. This disorder is well known in some tomato varieties when cultivated under air-controlled conditions like greenhouses, and it has been also observed in some wild relatives like Solanum habrochaites [42]. It is clearly dependent on the genotype and the environmental conditions. Hence, this accession was excluded from the experiment.

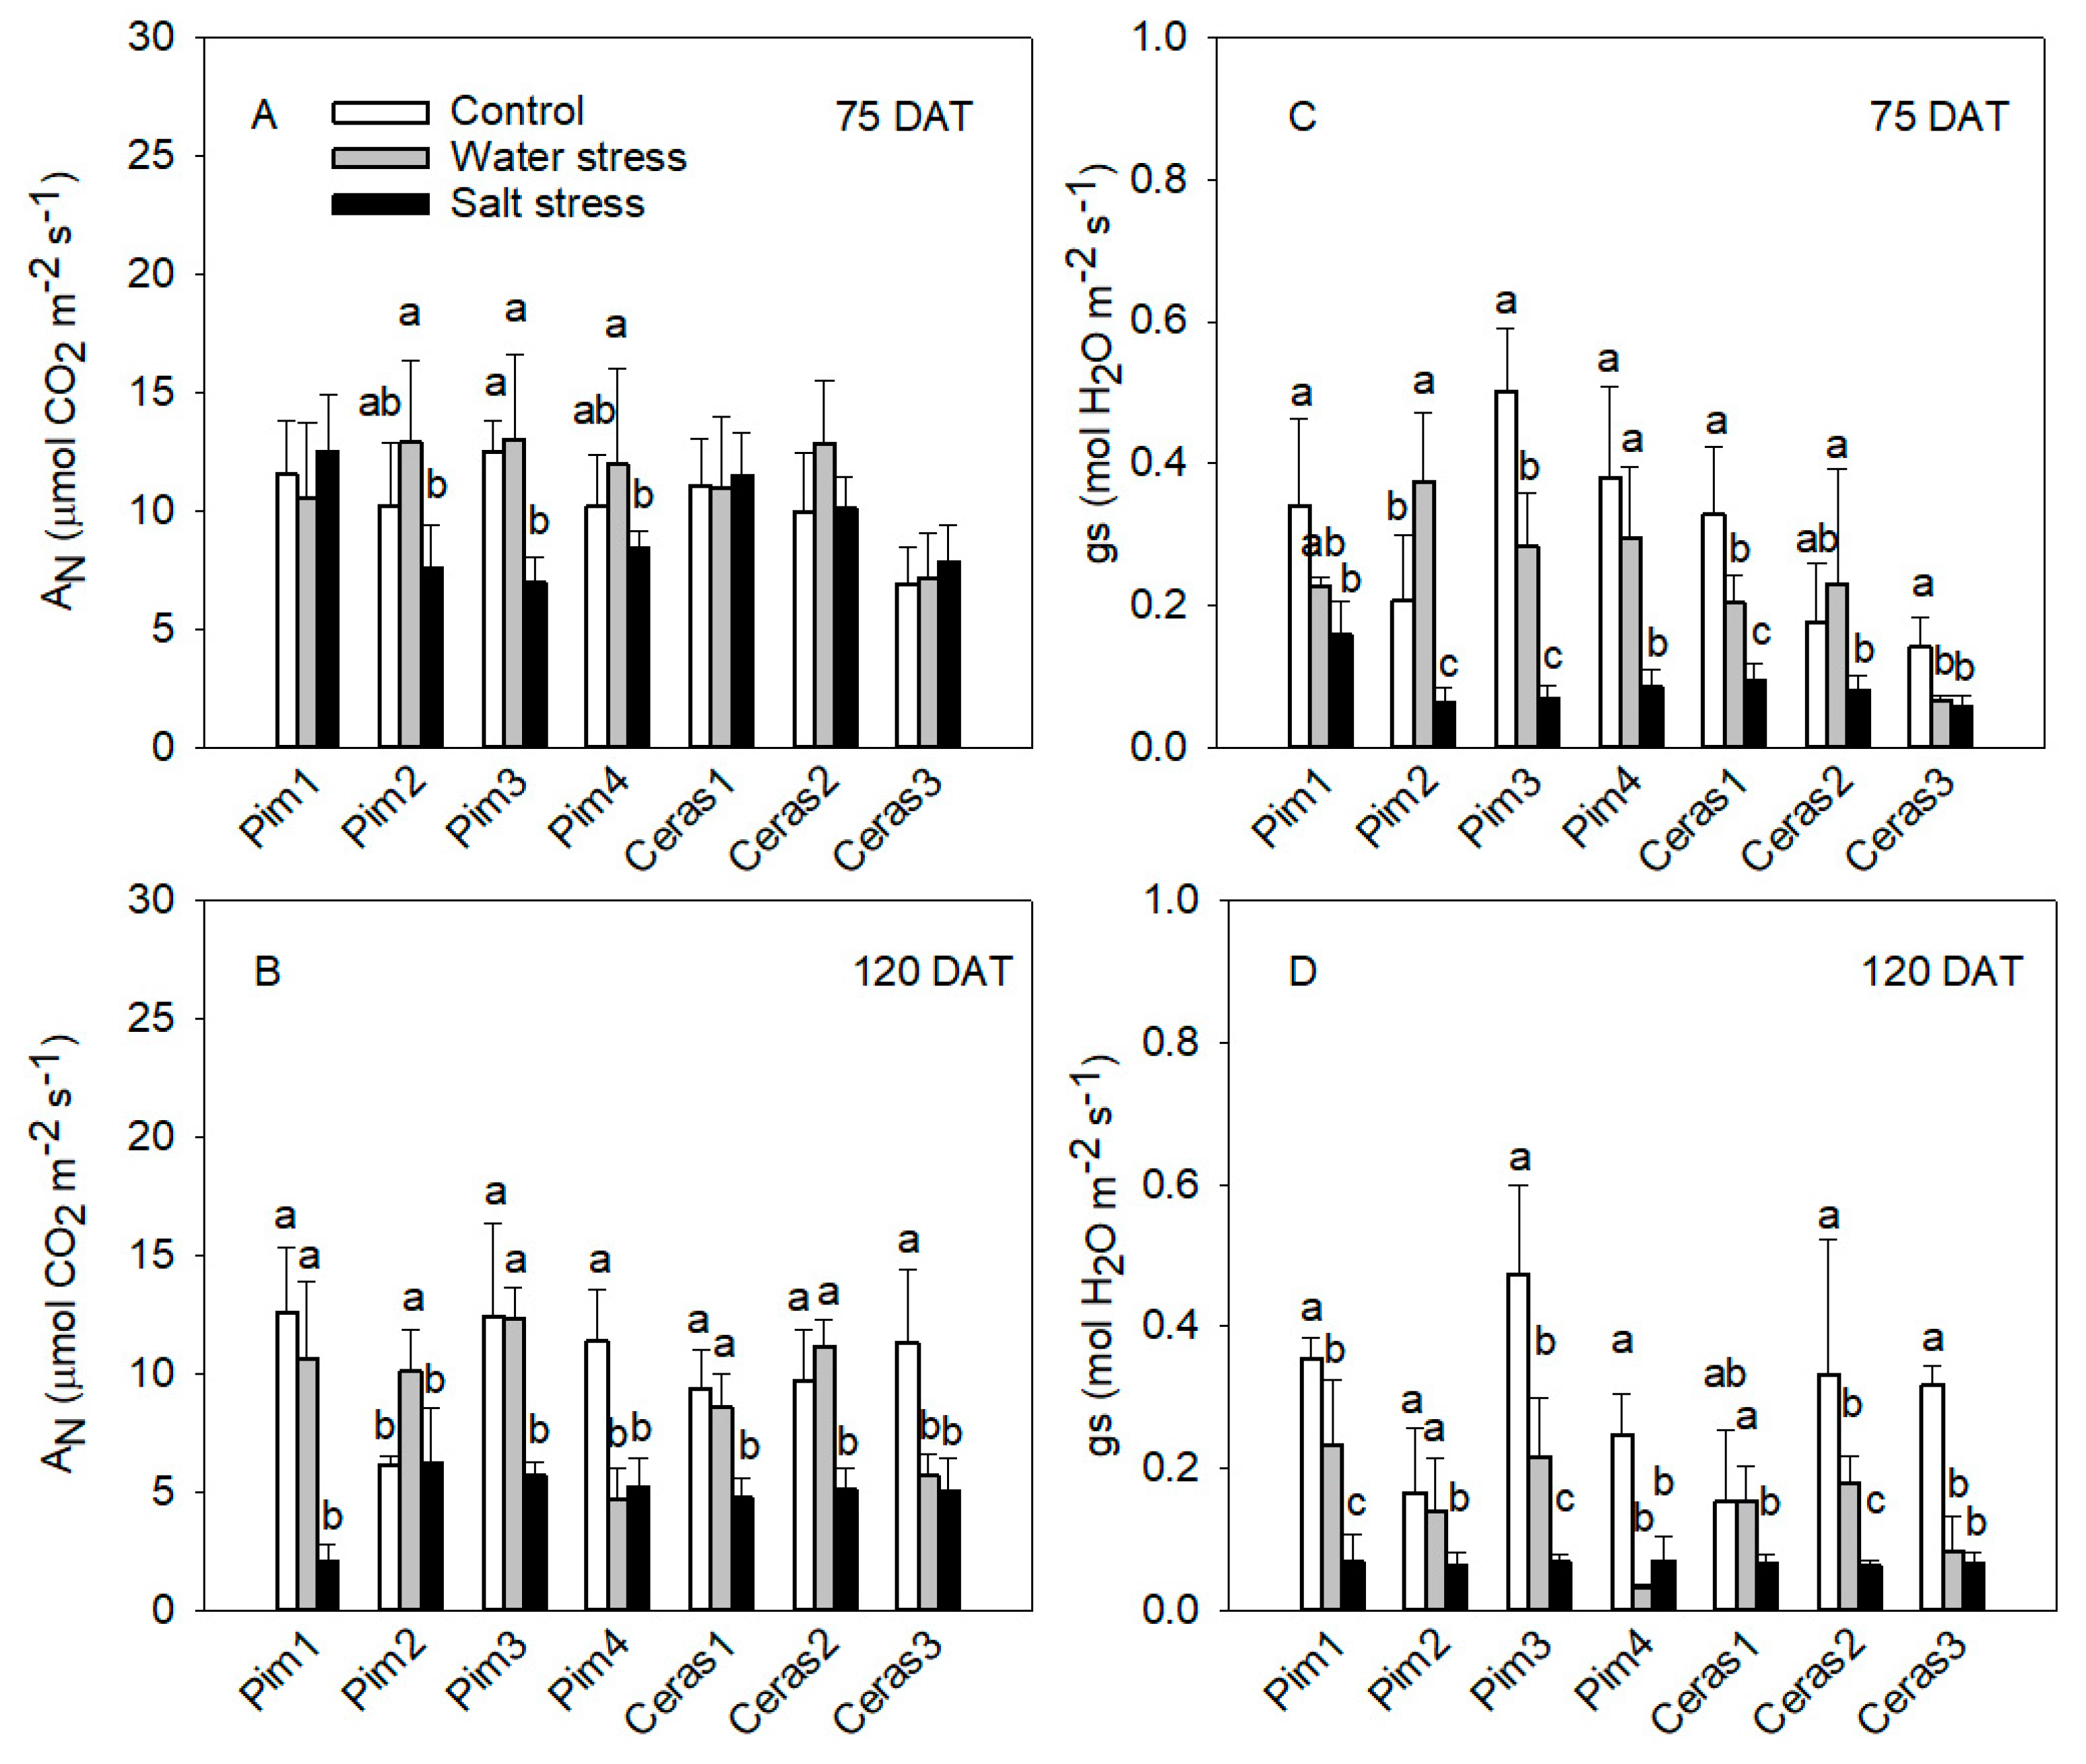
3.1. Gas Exchange Measurements

3.1.1. Photosynthetic Rate and Stomatal Conductance

The two-way ANOVA revealed highly significant differences for the main effects (accession and treatment), as well as for their interaction, for both parameters (AN and gs) at 75 and 120 DAT. Salt treatment effect showed a significantly higher negative impact on the genotypes’ performances compared to water stress and control treatments regarding both parameters (Table S1).
At the genotype’s level, the photosynthetic rate (AN) was not significantly affected by water deficit at 75 DAT for any accession (Figure 2A) when compared to control conditions. At the end of the experiment (120 DAT), AN decreased in Pim4 and Ceras3 water-stressed plants (59% and 50%, respectively) when compared with control plants, while it increased by 64% in Pim2 accession. The effect of salt stress on AN at 75 DAT was higher compared with water stress, reducing AN in three Pim accessions (Pim2, Pim3, and Pim4) (Figure 2A). At 120 DAT (Figure 2B), salt stress provoked a significant reduction in AN ranging from 47% to 84% in all of the studied accessions, and particularly in Pim1 salt-treated plants (84%). Only AN in Pim2 accession under salinity did not show significant differences at 120 DAT when compared with control plants (Figure 2B).
Stomatal conductance was not affected by water stress in Pim1, Pim4, and Ceras2 accessions at 75 DAT (Figure 2C), while it was significantly increased in Pim2 (80% with respect to control). At 120 DAT only Pim2 and Ceras1 remained unaffected, while the other genotypes were significantly affected (Figure 2D). All plants grown under salt stress significantly reduced gs when compared with controls (ranging from 53% to 86%) at 75 DAT. Finally, at 120 DAT, gs was again diminished in all accessions under salinity conditions (Figure 2D).

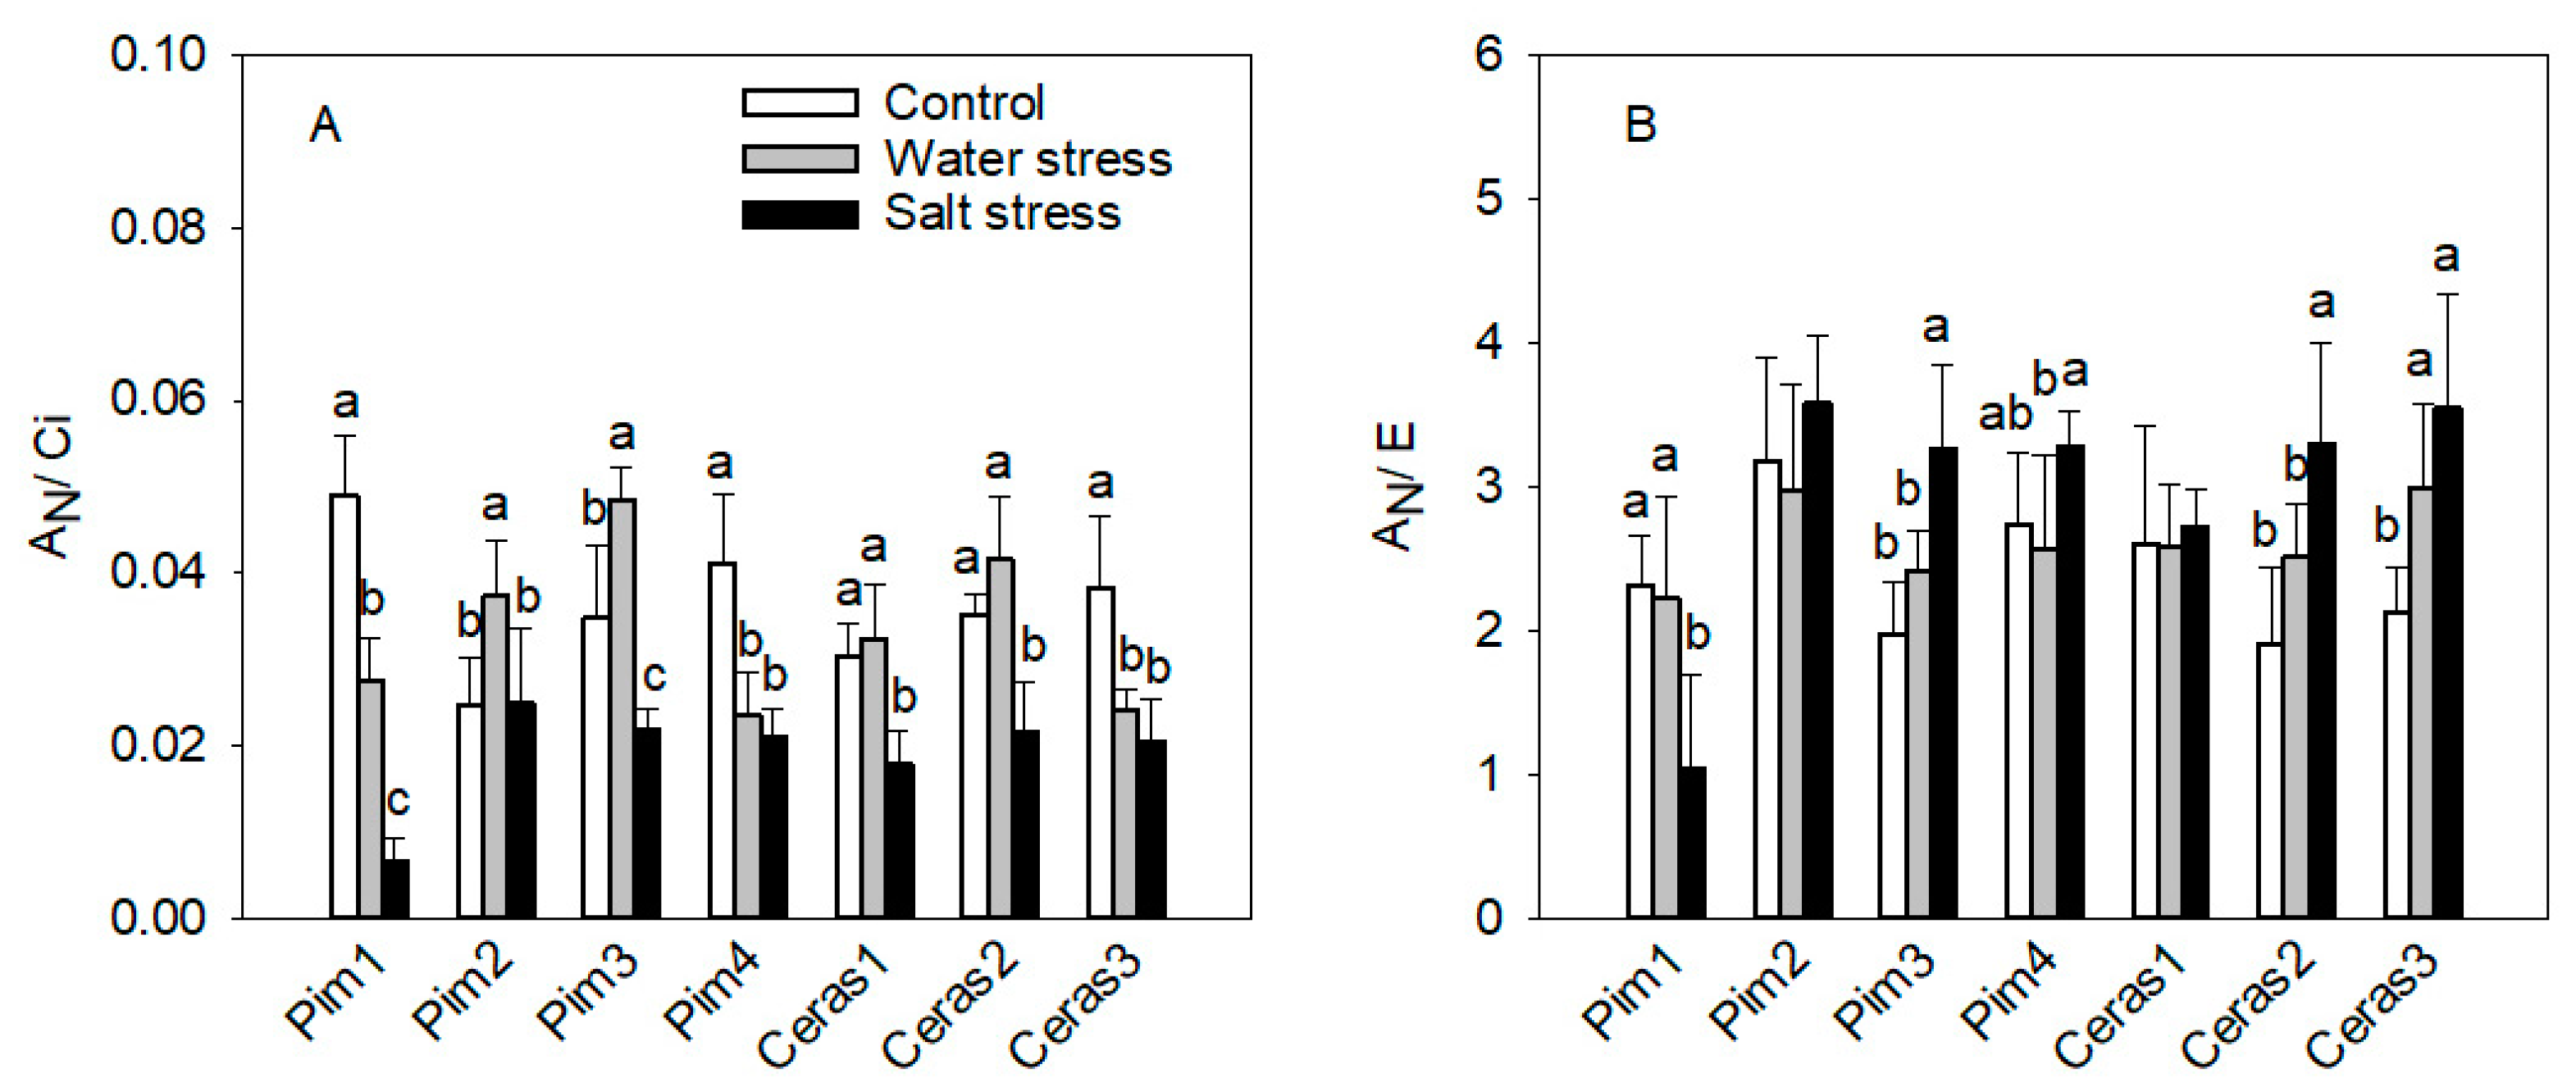
3.1.2. Instantaneous Carboxylation Efficiency

Two-say ANOVA revealed highly significant differences for the factors “accession” and “treatment”, as well as for their interaction for the instantaneous carboxylation efficiency parameter, estimated as the AN/Ci ratio. AN/Ci ratio were significantly lower under saline treatment (Table S2).
Under water stress conditions, AN/Ci ratio was reduced in Pim1, Pim4 and Ceras3 accessions (ranging from 37% to 43%), compared to their control (Figure 3A). Pim2 and Pim3 water-stressed plants showed higher AN/Ci ratio than controls (increase of 51% and 18%, respectively) (Figure 3A).
Under salt-stress conditions, AN/Ci was reduced in all accessions when compared with their respective control or even water-stressed plants (Figure 3A). This reduction was notably important in Pim1 (87%). Only Pim2 accession did not show significant differences when compared with control (Figure 3A).

3.1.3. Instantaneous Water Use Efficiency

Regarding the instantaneous water use efficiency (AN/E), estimated as the ratio between CO2 assimilation (AN) and transpiration (E), the factors “accession” and “treatment” were statistically significant, as well as their interaction, as revealed by the conducted ANOVA. Salt-treated plants showed a significantly higher values than water-stressed plants and control (Table S2).
At the genotypes level, AN/E in Ceras3 showed a significant increase (41% increase) under water stress when compared with its control plants (Figure 3B).
Pim3, Ceras2, and Ceras3 under salt-stressed plants registered higher AN/E values than control plants (65%, 74%, and 67% increase, respectively), while this ratio was not significantly affected in Pim2, Pim4, and Ceras1 salt-treated plants. On the contrary, Pim1 salt-stressed plants registered the highest decrease (55%) when compared with its control (Figure 3B).

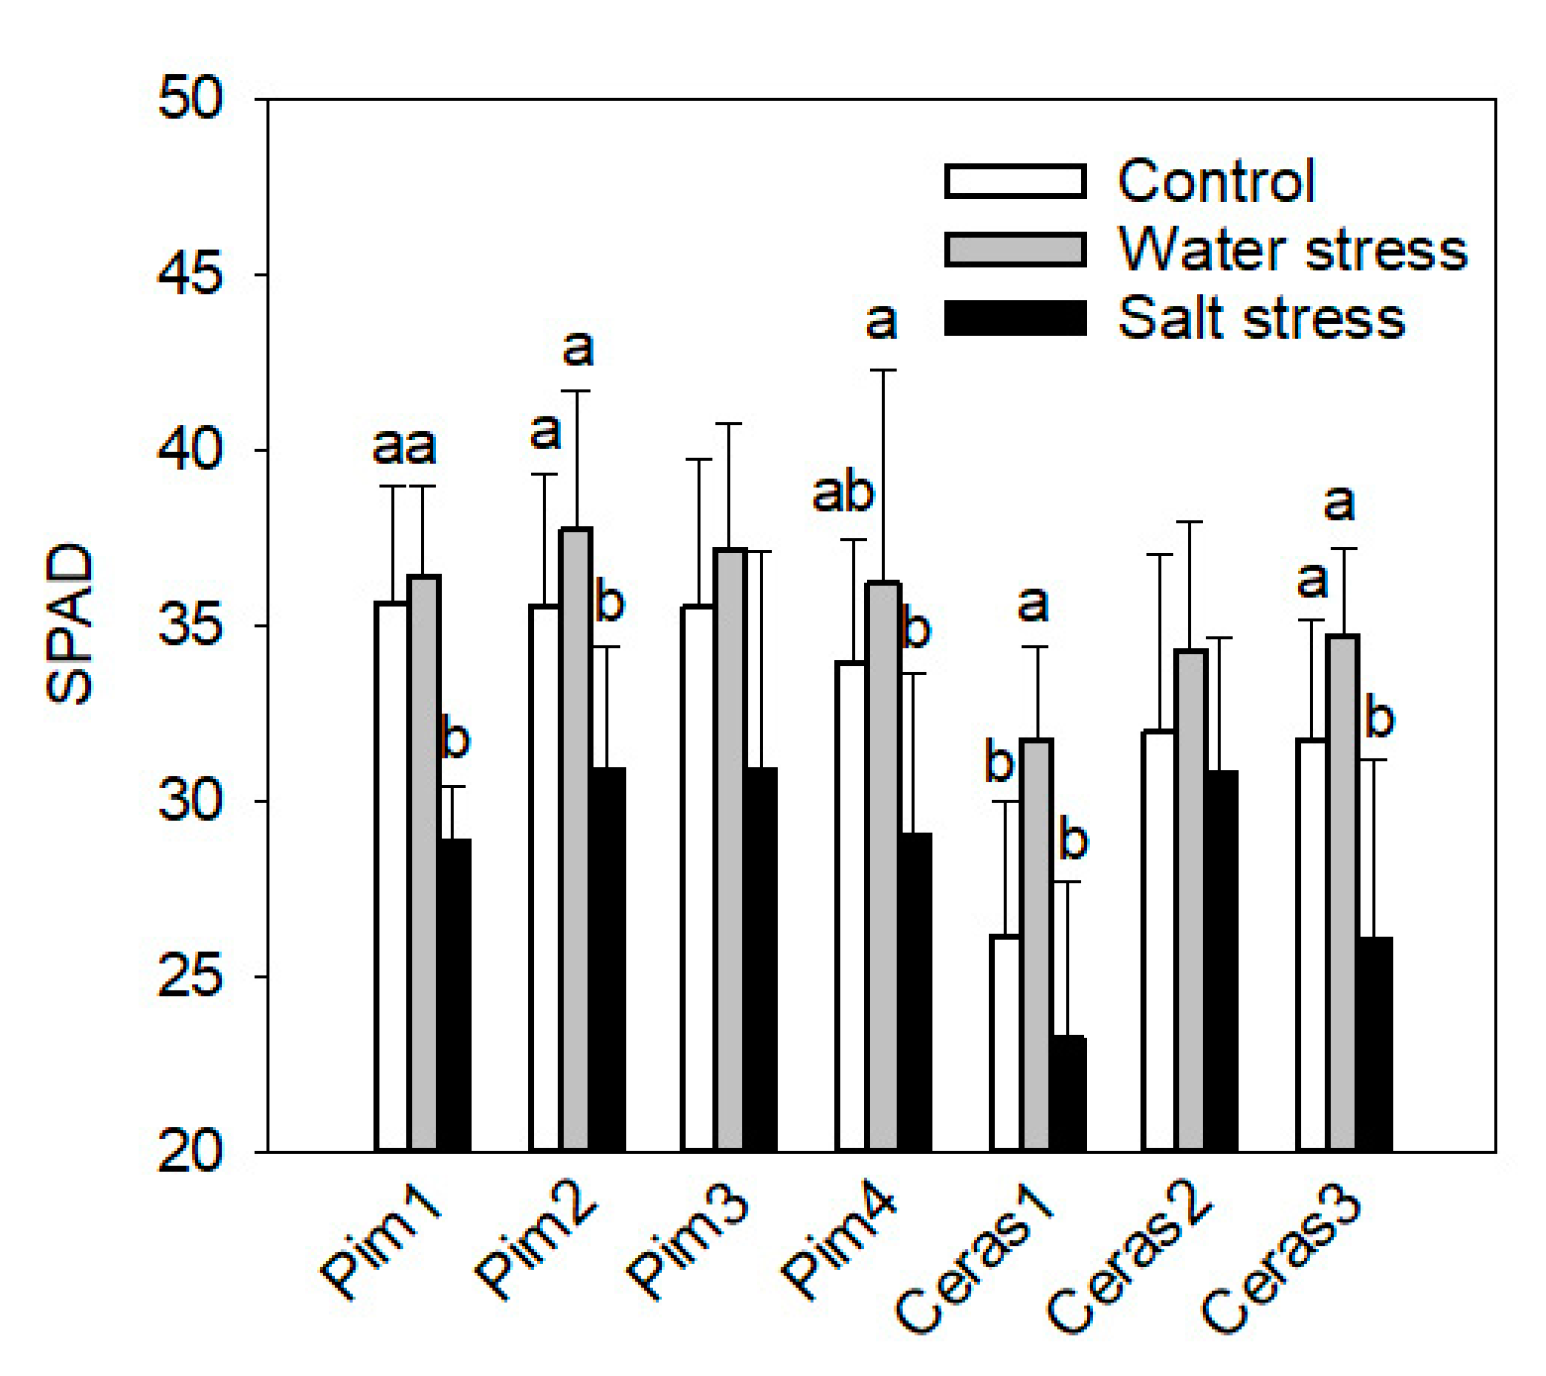
3.2. Leaf Chlorophyll Concentration Measurement by SPAD

Two-way ANOVA showed highly significant effects regarding the factors “accession” and “treatment”, whereas their interaction (accession × treatment) was not statistically significant (Table S3).
SPAD values, measured in terminal lobe of fully expanded and non-detached leaves, of salt-treated plants showed the lowest values, while water-stressed plants tended to show higher values than the other two treatments, although statistically not different from the values observed under control conditions (Table S3 and Figure 4).
Two accessions (Pim3 and Ceras2) did not show significant differences either under salt stress conditions or under water stress when compared with respective controls.

3.3. Phenotypic Traits

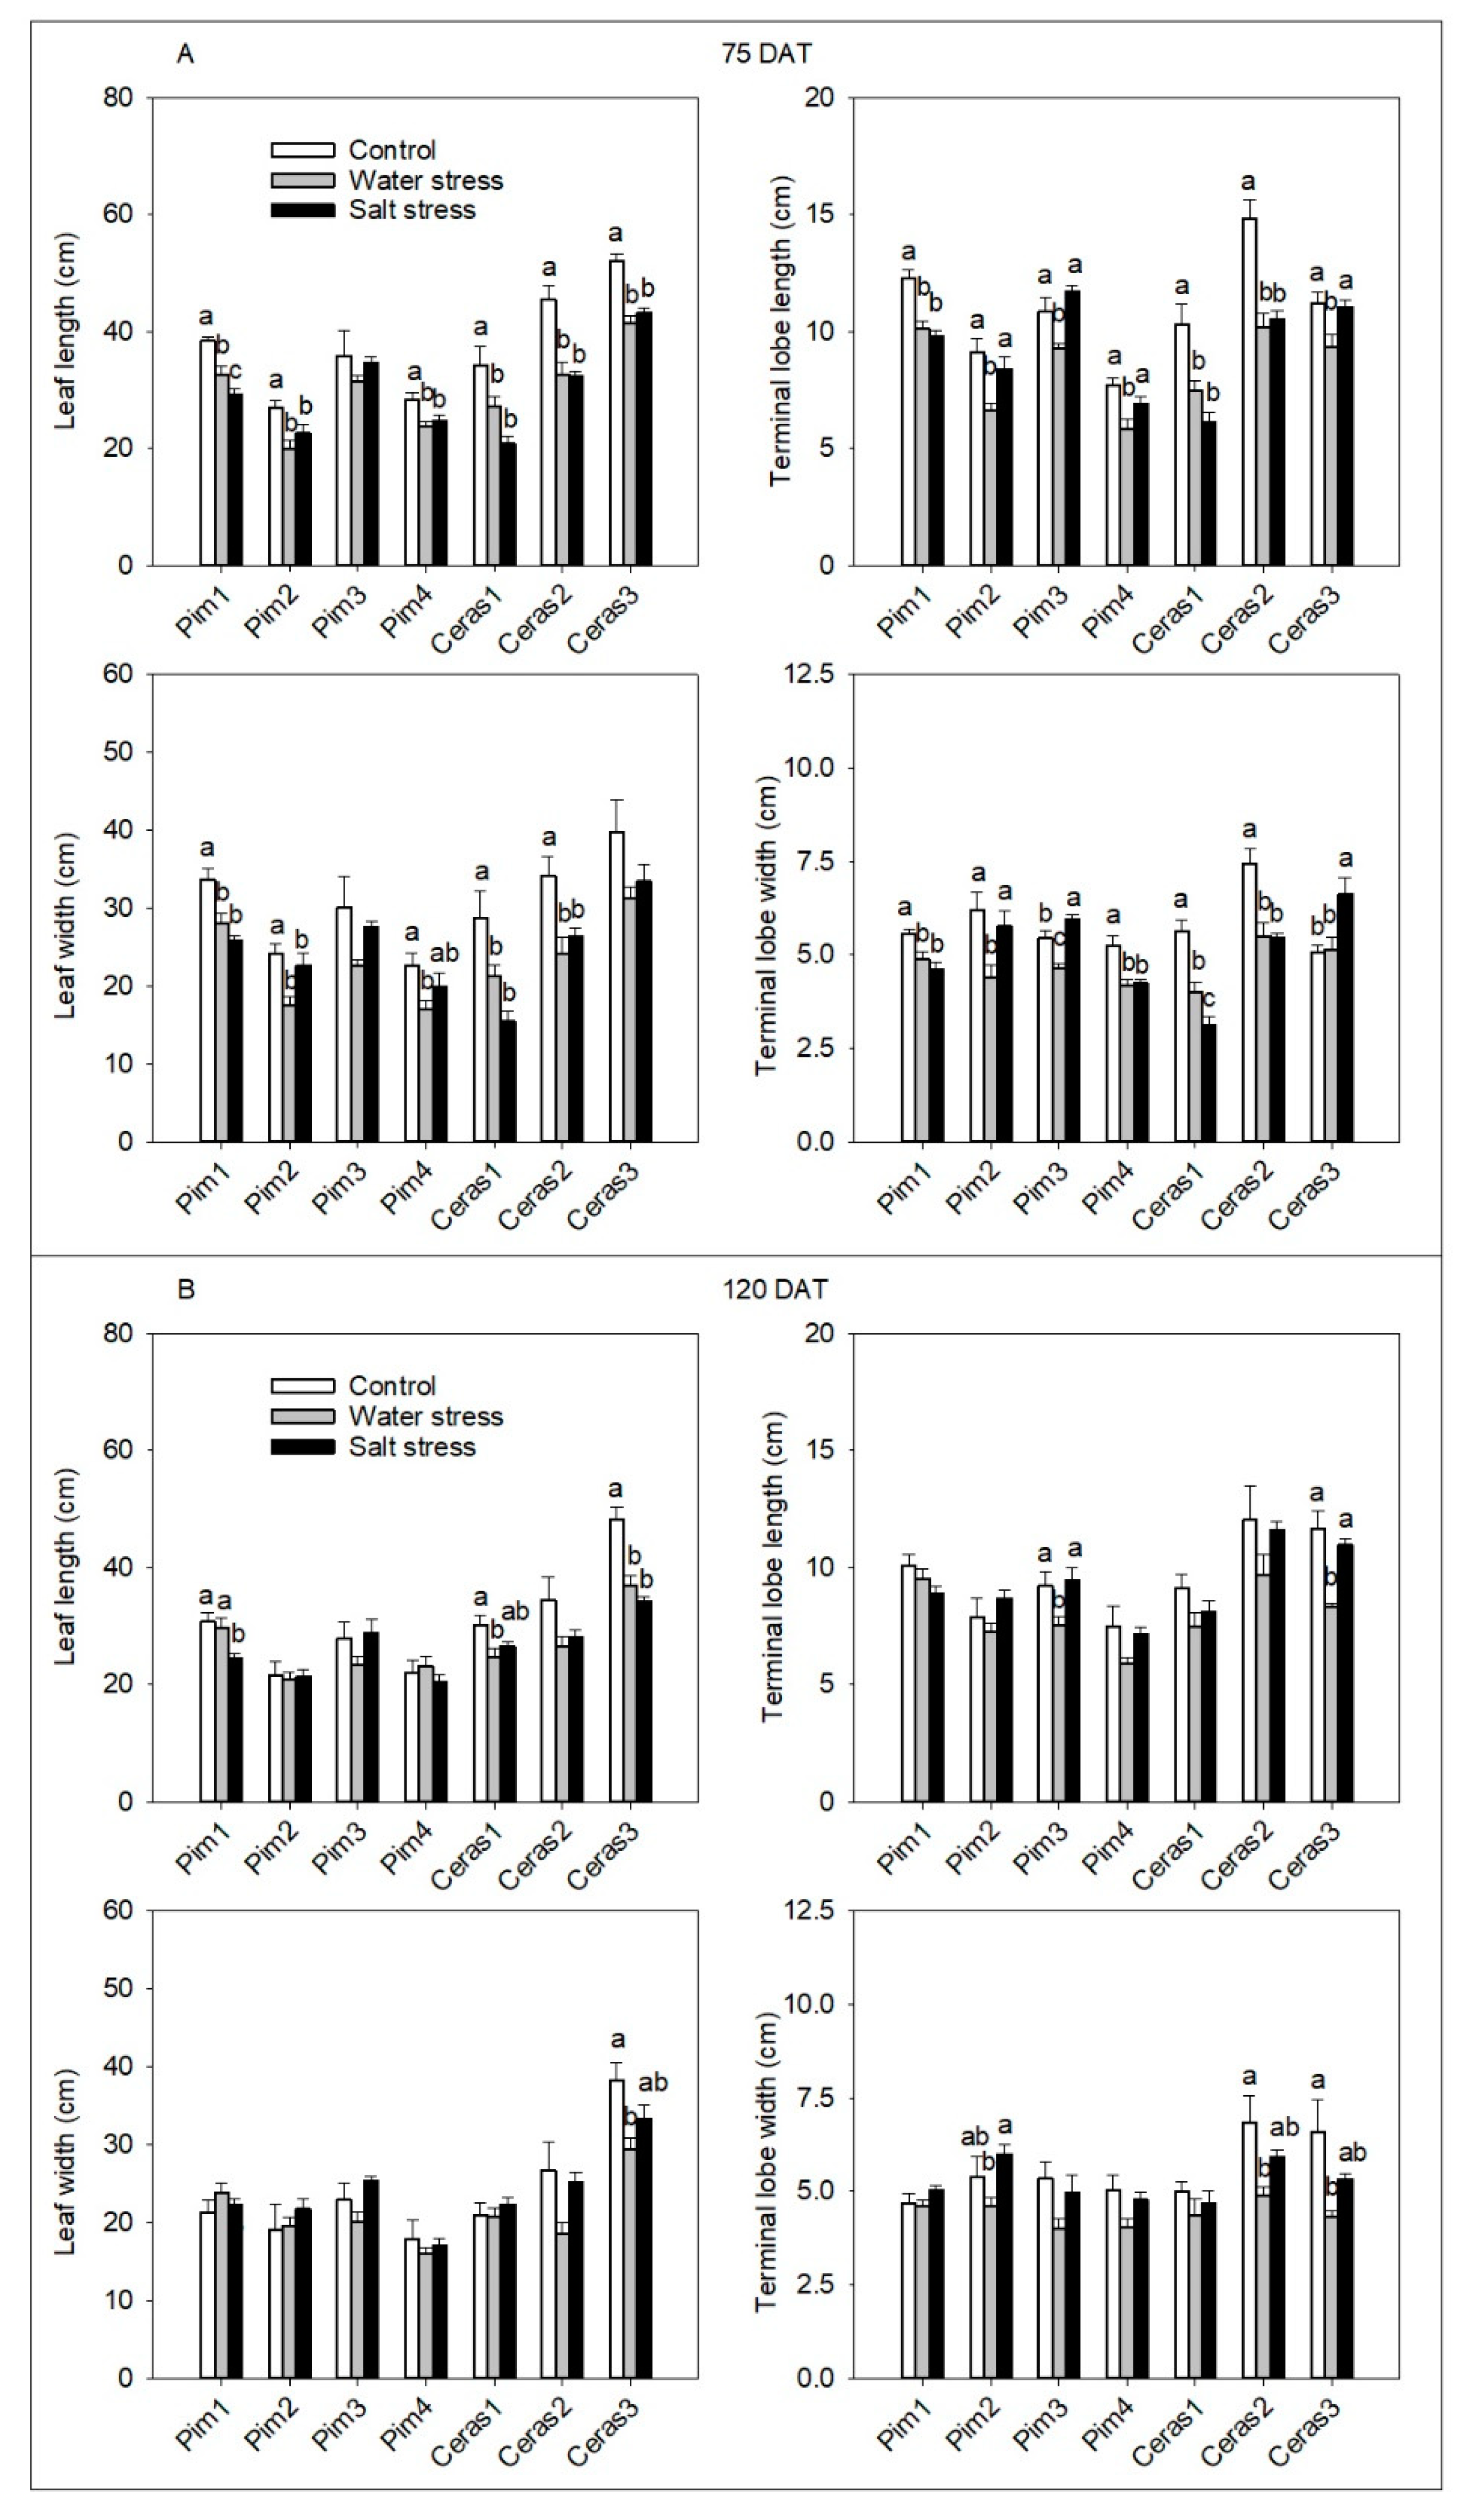
3.3.1. Leaf Morphological Parameters

The two-way ANOVA showed that both accession and treatment effects were highly significant regarding leaf and terminal lobe’s dimensions (length and width).Significant interactions were observed (accession × treatment) for the next parameters: leaf length both at 75 and 120 DAT, leaf lobe length at 75 DAT, leaf lobe width at 75 DAT. By contrast, there were not significant interactions for leaf width both at 75 and 120 DAT, leaf lobe length at 120 DAT, leaf lobe width at 120 DAT (Table S4).
In general terms, water stress led to a significant decrease of both leaf and terminal lobe dimensions in all genotypes at 75 DAT, except in Pim3, which was not significantly affected for both leaf length and width, and Ceras3, which showed no differences regarding leaf and terminal lobe width (Figure 5A). Water stress treatment effect was considerably decreased at 120 DAT (Figure 5B). Thus, only Ceras3 was negatively affected for both leaf and terminal lobe length and width, whereas Pim3 showed shorter terminal lobes, Ceras1 showed significantly shorter leaves, and Ceras2 thinner terminal lobes (Figure 5B).
Salt stress showed an overall significant negative effect in most accessions; however, accessions behavior was more variable than under water stress conditions (Figure 5A). At 75 DAT, S. pimpinellifolium accession Pim1 and S. l. var. cerasiforme accessions Ceras1 and Ceras2 showed a significant decrease of both leaf and terminal lobe average dimensions, compared to control plants. Pim2 showed a significant decrease of its leaf’s length, Pim3 significantly increased its terminal lobe average width, Pim4 leaf length and terminal lobe width were significantly affected, and finally accession Ceras3 decreased its average leaf length while increasing its terminal lobe width (Figure 5A). On the other side, at 120 DAT the response was more stable across genotypes. Thus, significant differences between salt-stressed and control plants were only observed for Pim1 and Ceras3, which decreased their leaf length (Figure 5B).

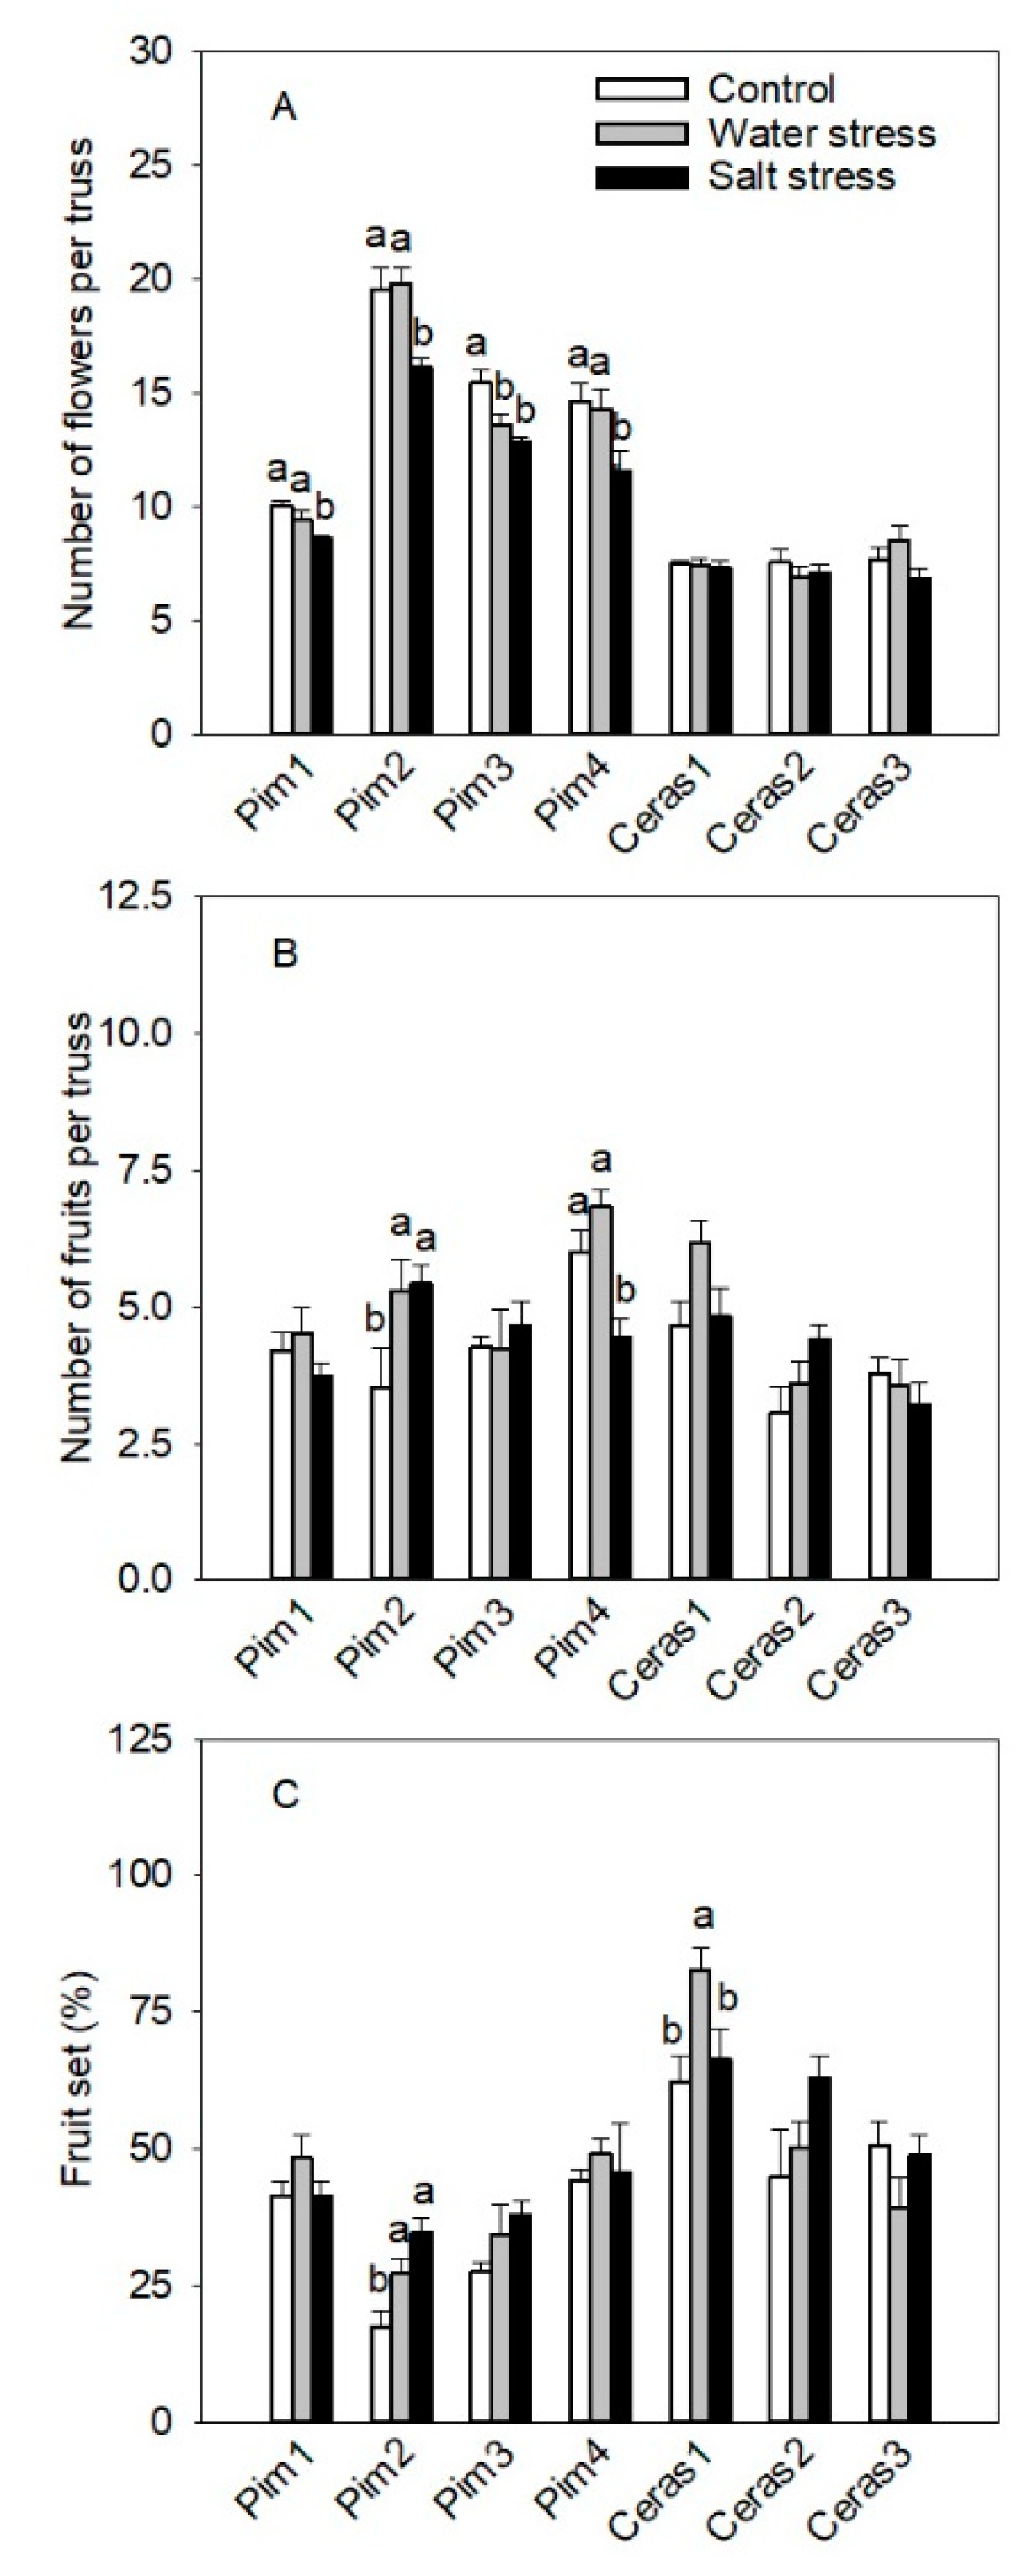
3.3.2. Flowers and Fruits per Truss Parameters

Both accession and treatment effect showed a highly significant impact on the parameters used herein. Their interaction (accession × treatment) was as well statistically significant (Table S5).
At the accessions level, S. pimpinellifolium accessions showed a complex response to the different treatments. Thus, significant differences between control and water-stressed plants were only observed for Pim3, which decreased the number of flowers per truss, and Pim2, which increased both the number of fruits per truss and fruit set (Figure 6A–C). S. l. var. cerasiforme accessions did not show significant differences between water stress and control treatments regarding both the number of flowers per truss and the number of fruits per truss (Figure 6A,B). Accession Ceras1 significantly increased its fruit set under water stress treatment, while the remaining accessions showed no differences (Figure 6C).
Regarding salt-treated S. pimpinellifolium, all genotypes showed fewer flowers per truss compared with control plants (Figure 7A). In addition, the number of fruits per truss increased in the case of Pim2, decreased in Pim4 and remained unalterable in the rest of accessions (Figure 6B). Finally, fruit set was significantly increased for Pim2 (Figure 6C). Regarding S. l. var. cerasiforme accessions, there were no significant differences between salt and control treatments in any parameters (Figure 6A–C).

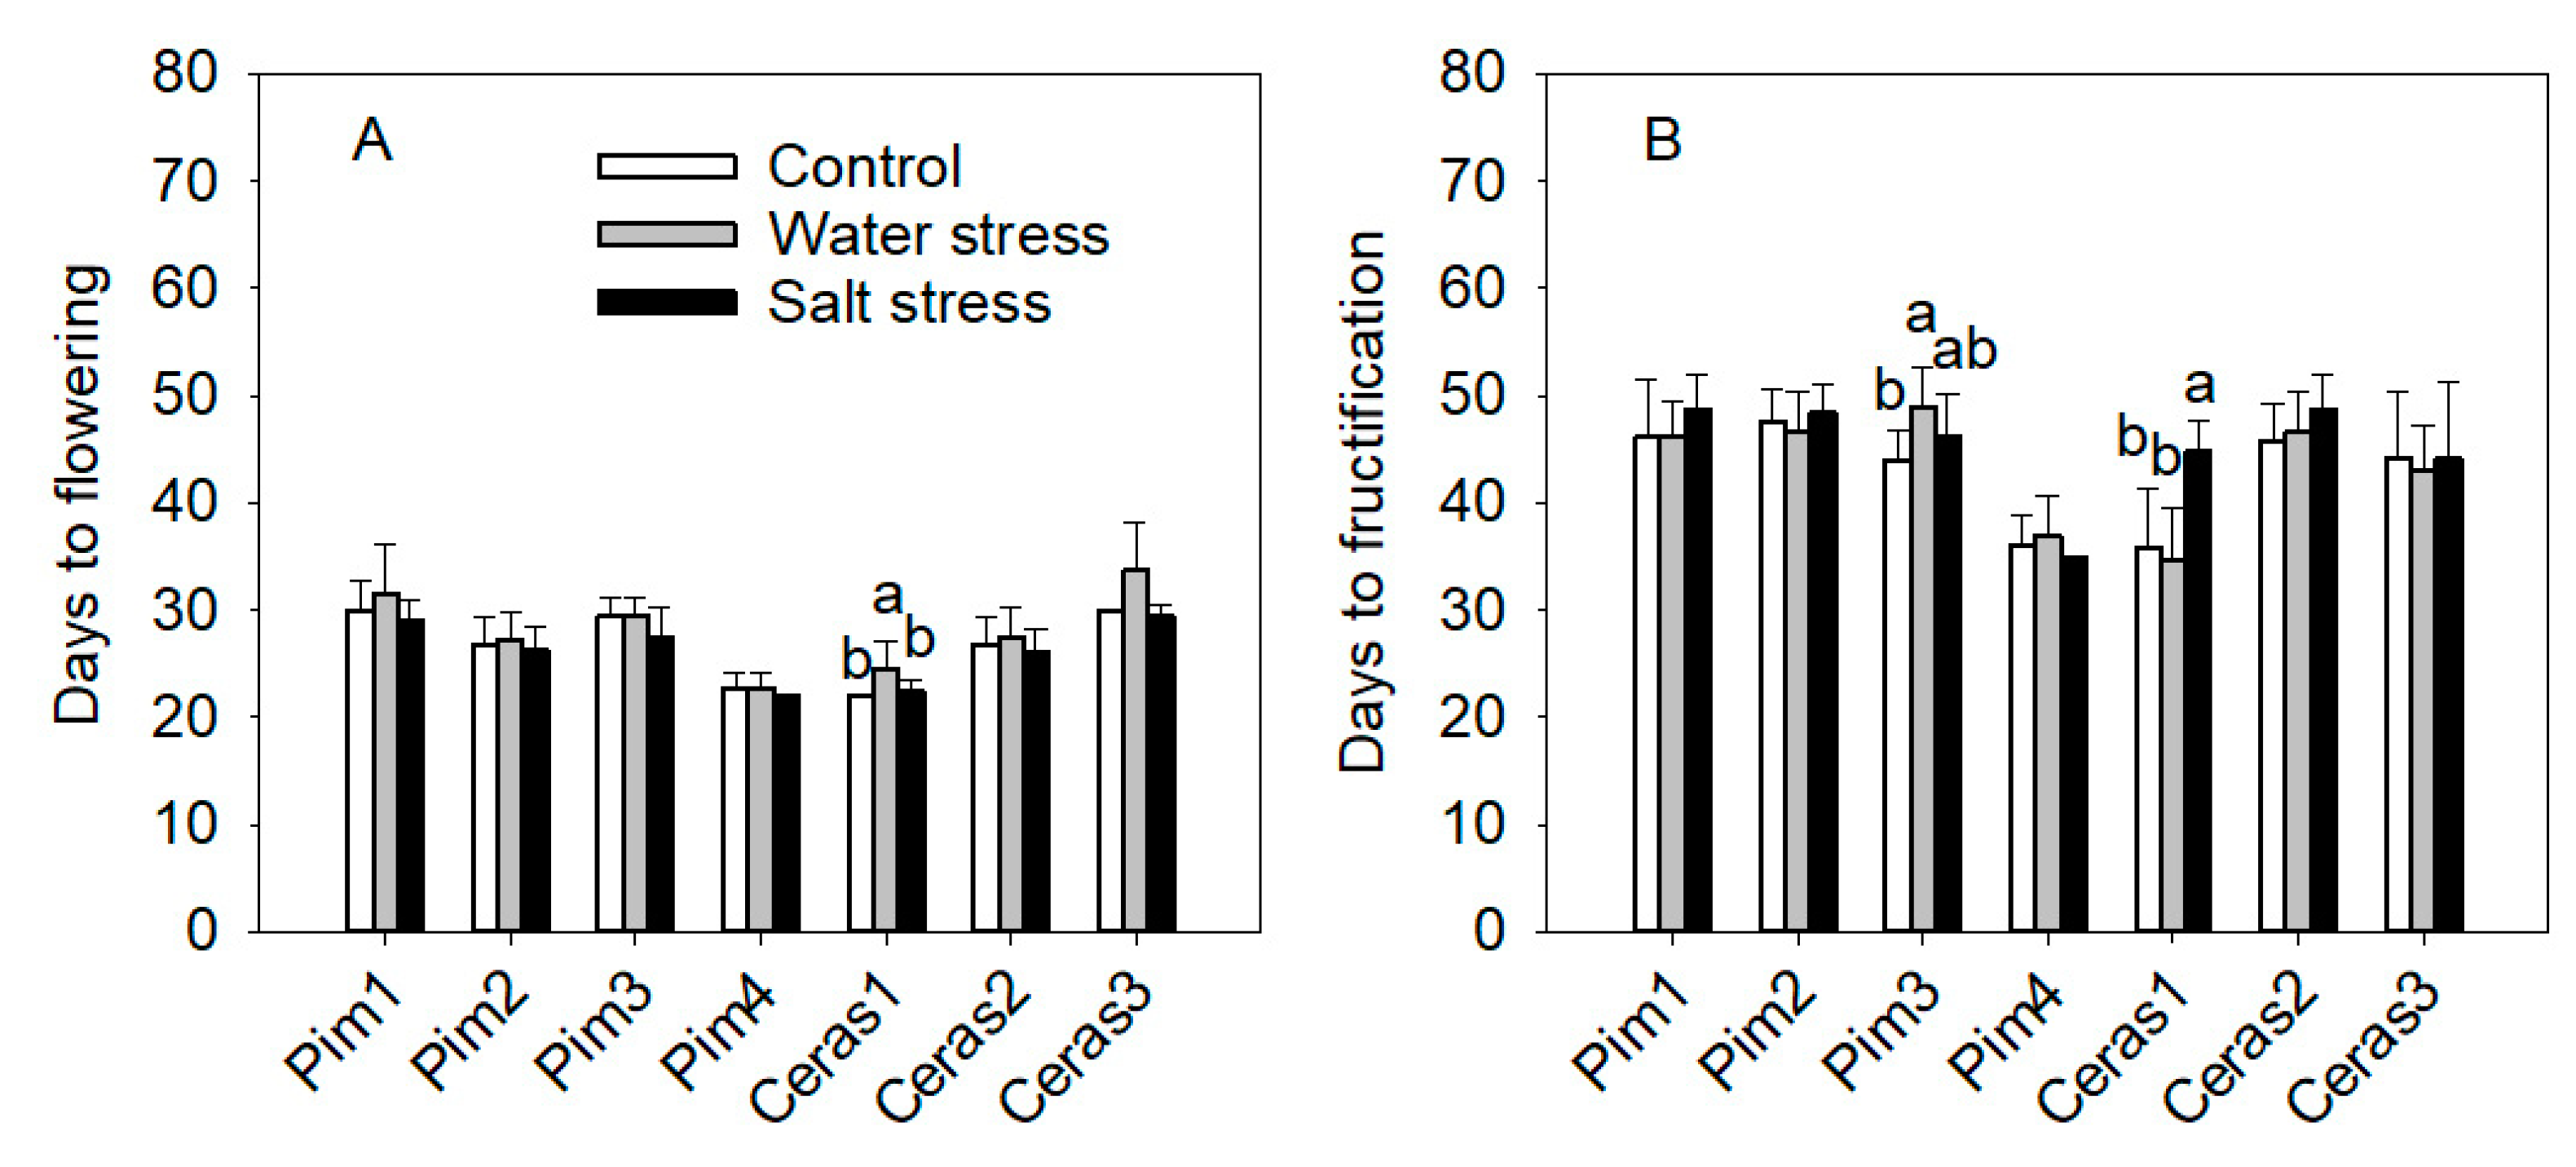
3.3.3. Flowering and Maturity Earliness

Regarding flowering and maturity earliness, two-way ANOVA showed highly significant effects for both accession and treatment factors. In this case, the interaction was not statistically significant for the trait days to flowering, whereas for days to fructification the interaction between both factors was highly significant (Table S6).
Most accessions started to flower around 27 days after the beginning of the experiment (Figure 7A). Regarding treatments, there was not a significant effect of water and salinity stress on this trait. Only Ceras1 plants grown under water stress presented a statistically significant delay of 3 days on the days to flowering when compared to control plants (Figure 8A). Similar behavior was observed in the days to fructification (Figure 7B). Only Pim3 plants grown under water stress presented a statistically significant delay of 5 days on the days to fructification when compared to their corresponding control plants. Under salt stress only Ceras1 plants presented a statistically significant delay of nine days to fructification when compared to their corresponding control plants and water stress (Figure 7B).

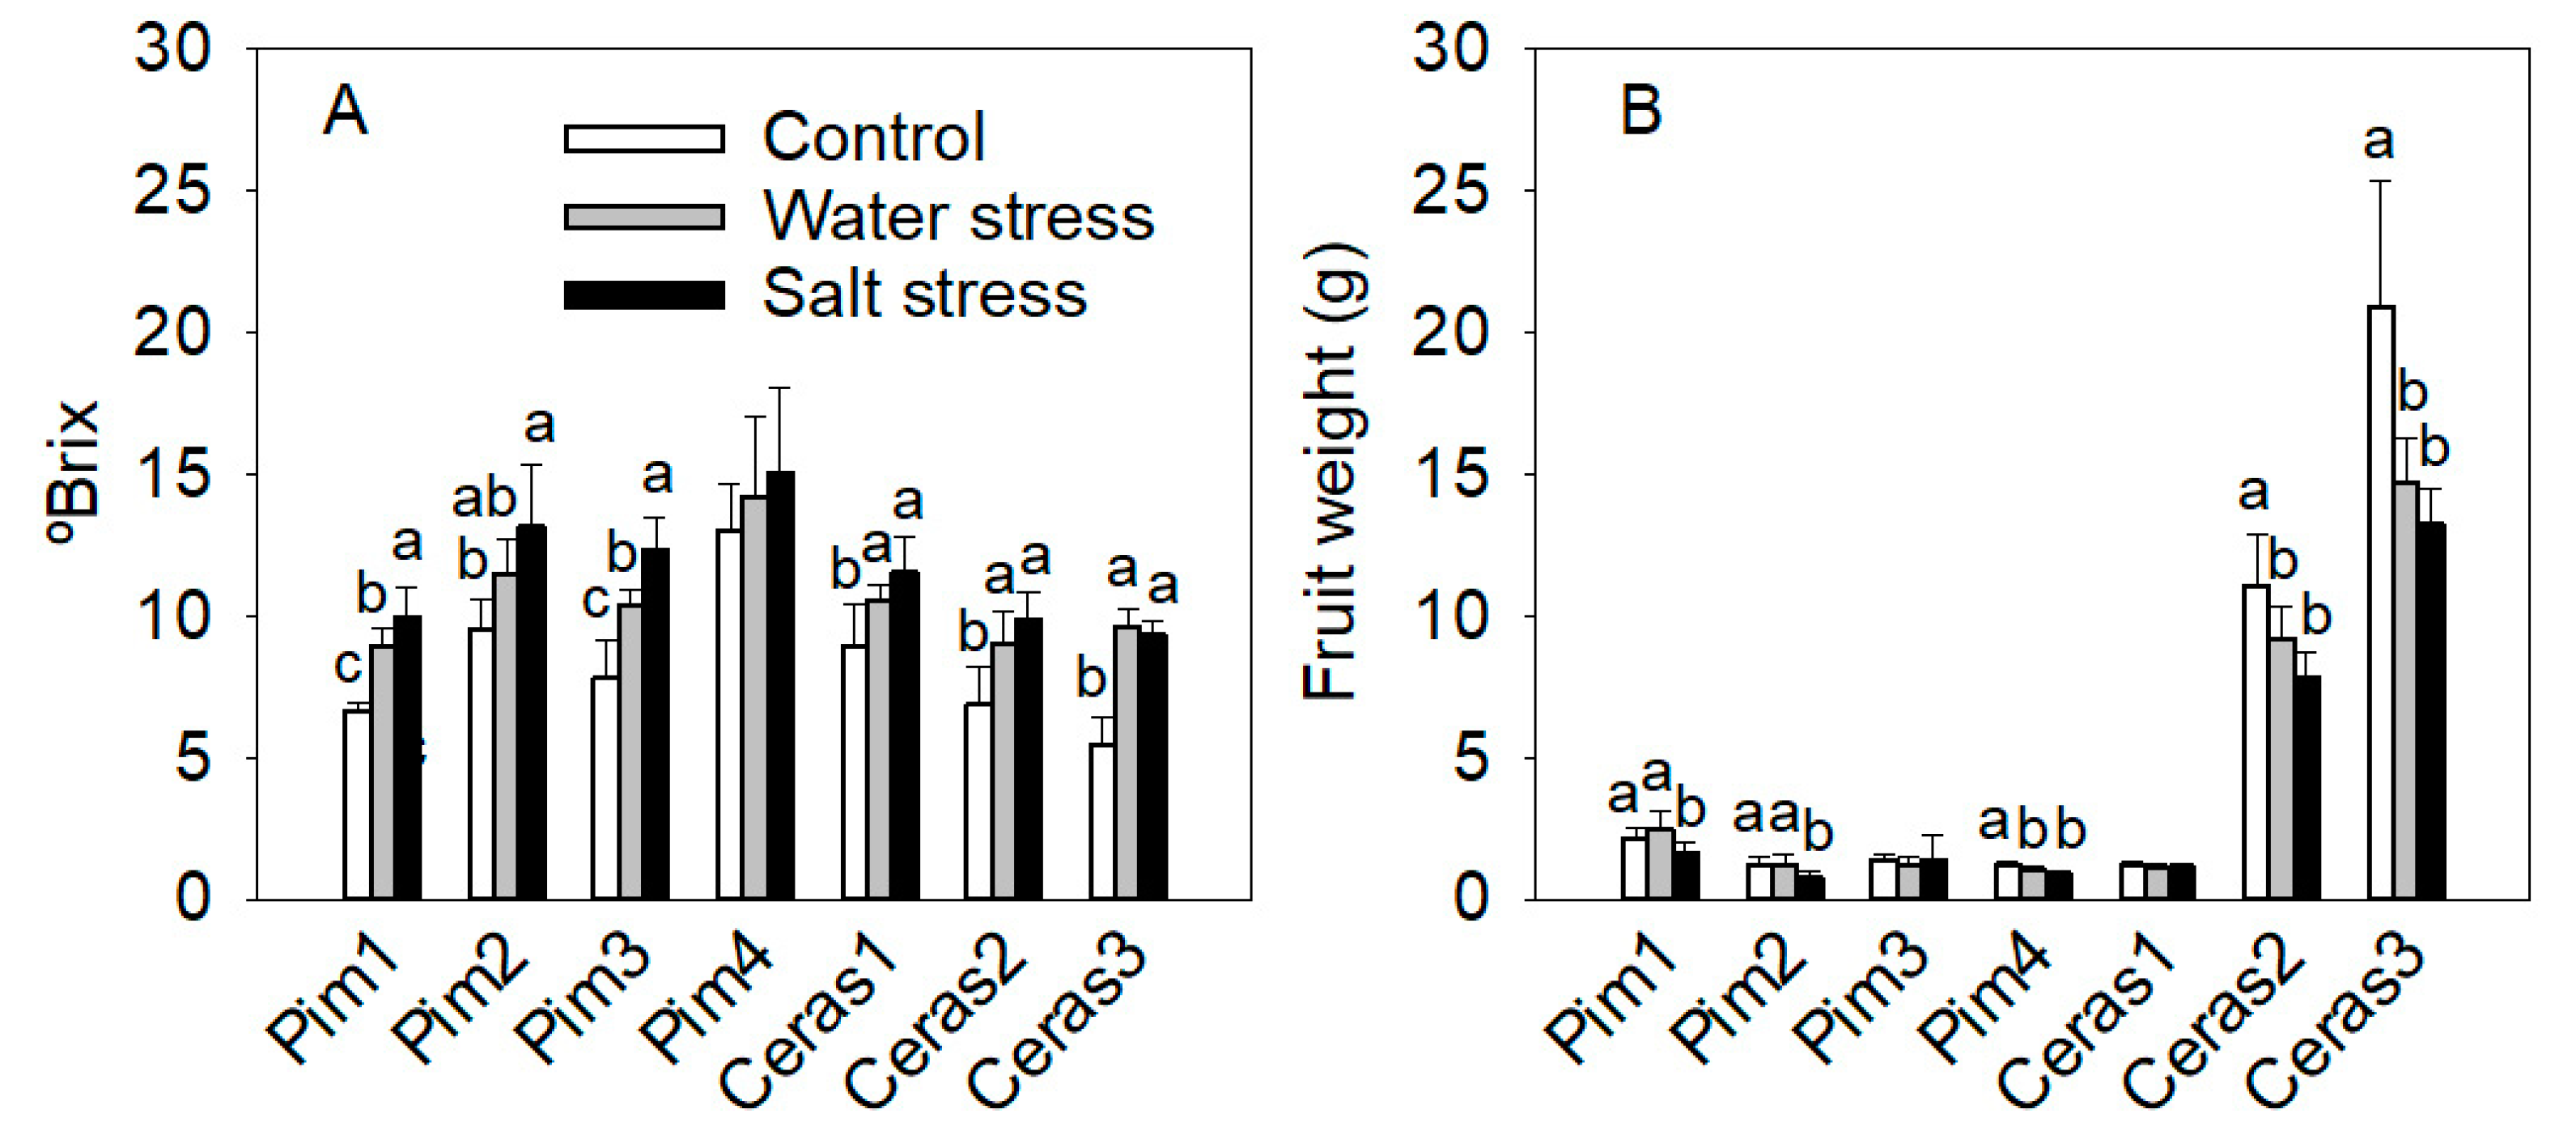
3.3.4. Fruit Parameters

Regarding °Brix and fruit fresh weight, the two-way ANOVA showed statistically significant effects for accession and treatment. Despite that, significant interaction (accession × treatment) was only observed for fruit fresh weight (Table S7).
Total soluble solids content was positively affected by both stress treatments in most accessions, compared to control conditions (between 21% and 28% average increase, for water and salt stresses, respectively). In fact, only Pim4 was not significantly affected by any of the treatments (Figure 8A). This accession showed the highest average ° Brix under the three treatments. Salt treatment showed the highest °Brix values, followed by water stress and then control. In addition, accessions Ceras2 and Ceras3 showed no differences between both stress treatments, accession Pim2 was not significantly affected by the water stress treatment (Figure 8A).
Under stress conditions, plants tended to decrease their fruit size, especially when grown under salt stress (averaging 21% and 31% under water and salt stresses, respectively). Regarding water-stressed plants, statistically significant differences were observed in S. pimpinellifolium accession Pim4 and S. l. var. cerasiforme accessions Ceras2 and Ceras3, which showed fruit fresh weight decrease (around 15%, 17% and 30%, respectively) when compared with control plants. The marked difference between the fruit weight of Ceras1 with respect to Ceras2 and Ceras3 is due to the wild condition of Ceras1, while Ceras2 and Ceras3 beard fruits remarkably bigger than the typical small rounded fruits of this variety. Finally, salt-stressed plants significantly decreased fruit fresh weight in Pim1, Pim2, Pim4, Ceras2 and Ceras3 (around 22%, 32%, 24%, 29% and 36%, respectively) (Figure 8B).

4. Discussion

Water stress and salinity are two of the major abiotic constraints to tomato cultivation. Despite tomato being considered moderately sensitive to salinity compared to other Solanaceae’s species, yield loss may be high and depends on both the salt concentration and the duration of the stress [43,44,45]. In addition, water stress can have important consequences for tomato production, as it might result in yield reduction of up to 50% in the case of an equivalent reduction in irrigation [46]. In this work, we explore the adaptation to water deficit and salinity of seven parents of a MAGIC population, four belonging to S. pimpinellifolium and three to S. l. var. cerasiforme.
Overall, there was an evident high variability in the response of the tested genotypes under the experimental conditions, demonstrating the existence of genetic variability susceptible of being exploited by breeders. The conducted ANOVA revealed the existence of significant differences between the tested accessions for all recorded traits. However, when looking at the results of the LSD test it can be concluded that there is not a clear effect of the “species” factor on the results. In our opinion, this result shouldn’t be taken as a general rule, but as the consequence of the specific group of accessions tested in this experiment. These accessions were selected to maximize their genetic diversity, morphological traits, geographic origin, and degree of domestication, as they are the founders of a MAGIC population. As an example, Ceras1 grows as a wild and resembles phenotypically to S. pimpinellifolium. In the same way, the four accessions of S. pimpinellifolium were collected covering a wide range of distribution of this species, showing remarkable different morphology in some plant, inflorescence and fruit traits, as well as adaptation to different environmental conditions. Hence, the maximization of the diversity between the accessions belonging to each species probably masked the differences in the response between species. Regarding the applied treatments, the effect of the water stress treatment was less harmful than the one produced by salinity. These results have also been described in other crops, such as pepper [47], as a consequence of the specific toxicity produced by salt ion accumulation, mainly Na+ and Cl, when plants are subjected to salinity stress.
In this experiment, S. pimpinellifolium accessions did not show a decrease in AN at 75 DAT under water stress. At 120 DAT only Pim4 decreased AN, remaining this parameter unaltered in Pim1 and Pim3 and increasing in Pim2. However, the stomatal conductance diminished at 120 DAT in three accessions except in Pim2. In spite of the stomatal closure detected in Pim1 and Pim3, it did not interfere with the photosynthetic rate (AN) indicating that stomatal closure was more sensitive to water stress than AN [48]. This could be explained by the fact that only critical levels of gs, described as low as 0.1 mol H2O/m·s are able to affect photosynthesis [49]. At the end of the productive period, the instantaneous carboxylation efficiency increased in Pim2 and Pim3, diminishing in Pim1 and Pim4. The decrease in AN/Ci indicated that water stress affected the photosynthesis by metabolic limitations in Pim1 and Pim4 [50,51]. Water use efficiency (AN/E) remained unaltered in the four genotypes. Considering these data as a whole, we consider the accessions Pim2 and Pim3 as tolerant to the water stress treatment applied in this experiment. Regarding the recorded agronomic and morphological traits, most of them remained unaffected, decreasing only the number of flowers per truss in Pim3 and increasing the number of fruits per truss and the fruit set in Pim2. The vegetative vigor, measured as the leaves size, decreased at 75 DAT, but this effect disappeared as the treatment progressed. The fruit weight was only reduced in Pim4. The °Brix increased in almost all Pim accessions as a consequence of the water deficit treatment. This response is in agreement with the one found by other authors [52,53]. According to Albert et al. [54], this can be due to a reduction in fruit water content and not to increased synthesis of sugars, although Ripoll et al. [55] found higher fructose and glucose synthesis in tomato fruits submitted to water deficit stress at different stages of fruit development, indicating that both dilution effect and higher sugar synthesis are responsible of fruit quality enhancement in tomato under water deficit conditions.
The four tested accessions in this experiment come from areas with very different climatic conditions, ranging from the desertic climate of the coastal northern Peru (Pim2) and the coastal south Peru (Pim4), to the highly humid and hot areas or Manabí (Pim1) in Ecuador and Amazonas province in the north of Peru (Pim3). Nakazato et al. [56] conducted an interesting study using S. pimpinellifolium accessions from different western slopes of the Andes and the adjacent coastal regions of Peru, to demonstrate that environmental factors drive the phenotypic differentiation and adaptation to environmental stresses, and showing evidence of trait-environment associations. They found a negative correlation between tolerance to water stress, measured as the number of days to wilting, and the annual precipitation, indicating that individual populations that occur in arid environments are more likely drought tolerant [56]. Interestingly, Pim2, one of the most tolerant accessions to water stress in our experiment due to photosynthesis preservation, comes from desert areas with scarce precipitation. This behavior fits with the results found by Nakazato et al. [56]. Nevertheless, in a study conducted by Albert et al. [54], in which some S. pimpinellifolium accessions from different origins were tested, no correlation was found between the climate and the adaptation to water deficit, showing different adaptation to water stress of accessions coming from the same province. Herein, Pim3, coming from Amazonas province (Peru) with climatology clearly different to Piura (Pim2) was also found tolerant to the water stress conditions applied in this study. Zuriaga et al. [15] conducted a comprehensive experiment to study the molecular variability of S. pimpinellifolium, including 247 accessions covering all its range of distribution. They found a clear genetic differentiation among the studied accessions, related to their geographical origin [15]. The accessions used herein belong to groups genetically and environmentally differentiated by Zuriaga et al. [15], demonstrating that the differences found have a genetic basis and can be exploited in breeding.
In contrast to the response to water stress observed in S. pimpinellifolium, salinity treatment severely affected the photosynthetic rate, as well as the stomatal conductance, particularly at the end of experiment. The ion imbalance, ion toxicity and osmotic stress produced by the salinity treatment interfered with both parameters, as described by other authors [7,57]. Herein, salt treatment lead to a decrease in chlorophyll levels, as demonstrated by the significant differences shown by SPAD measurements in Pim1 and Pim2, not observed under water stress conditions. As a consequence of the decrease in photosynthesis efficiency, the vegetative development also decreased, as shown by the smaller leaf and leaf terminal lobe sizes, compared to control. Despite that, fruit set (except for Pim4) and flowering earliness were not affected. Finally, a negative effect was observed on fruit fresh weight, which has been described as one of the most important effects of sensitivity to salinity, being more notable in bigger fruits [30,35,58]. The decrease in fruits as small as the ones of S. pimpinellifolium, shows the negative effects of salinity in the tested accessions.
Regarding S. l. var. cerasiforme, the photosynthetic rate did not vary in water stressed compared to control plants at 75 DAT, although Ceras1 and Ceras3 reduced their gs, compared with control. At the end of the experiment (120 DAT), Ceras1 and Ceras2 showed no alteration of CO2 fixation, whereas Ceras3 showed a decrease of gs values. This allowed for dynamic modulation of photosynthesis under water stress, with conservative values of AN/Ci indicating no photosynthesis metabolic limitations in both Ceras1 and Ceras2 [47], however in Ceras3 decrease in AN/Ci and in gs indicating that AN reduced by stomatal closure and by inhibition of mesophyll conductance and/or photochemical efficiency at 120DAT, similar results were obtained in [47]. The water use efficiency remained unaltered in Ceras1 and Ceras2 and increased in Ceras3, caused by a considerable stomata closure associated to a decrease in the transpiration rate [51]. Regarding the phenotypic traits, only leaf size, at 75 DAT, and fruit fresh weight (not in Ceras1) decreased as consequence of the treatment. Decrease in plant vigor, as a result of the water stress treatment, was also reported for a group of 55 accessions of S. l. var. cerasiforme and S. pimpinellifolium tested by Albert et al. [54] whereas the accessions’ yield remained unaffected. The authors suggested that tomato plants buffer the negative effects of water deficit by limiting their vegetative growth and by reallocating the photo-assimilates to the fruits. According to our results, the most tolerant S. l. var. cerasiforme accessions were Ceras1 and Ceras2 for the absence of alteration of CO2 fixation, unaltered water-use efficiency, and maintenance of most of the vegetative and reproductive traits unaffected. Interestingly, Ceras1 was also tested for tolerance to water deficit by Albert et al. [54] with similar conclusions to ours, where yield was not decreased and plant vigor was slightly reduced. Finally, Ceras3, the accession with bigger fruits, showed the most marked reduction in fruit fresh weight. The greater weight loss in larger fruited accessions has already been reported by several authors [35,54].
Under salinity stress, at 75 DAT, no limitation of CO2 occurred in S. l. var. cerasiforme accessions. At 120 DAT stomatal conductance and photosynthesis were negatively affected by salinity in all accessions. Herein, AN/Ci decreased in all S. l. var. cerasiforme accessions, suggesting stomatal constraints. Previous studies have demonstrated a positive relationship between photosynthetic capacity and growth in the plants grown under salinity [47,59,60,61]. As a consequence of the considerable reduction of carbon assimilation rate, vegetative growth, leaf and leaf terminal lobe sizes decreased in all tested genotypes.
S. l. var. cerasiforme, unlike S. pimpinellifolium grows normally in the proximity of cultivated fields or in backyards in close contact with humans [37]. In these conditions, plants can compete with fast growing species or genotypes such as those in cultivation or in backyards, but do not need to develop special adaptive traits to abiotic stresses [56]. Notwithstanding, S. l. var. cerasiforme can also be found in wild conditions. This is the case of Mexico where this species is widely distributed and can be found as a wild, weedy and even as partially cultivated varieties in tropical and subtropical areas with semiarid and humid regimes [62]. When growing in semiarid and hot climates this species is found in association with larger plants that provide them with shade. Accession Ceras1 comes from the Sinaloa desert, in Mexico, in the Pacific slopes (ca. 300–1100 m) of Sierra Madre Occidental [63], while Ceras2 and Ceras3 come from humid and hot areas. Hence, the three S. l. var. cerasiforme accessions come from very different conditions. In our experiment, Ceras1 has been the most tolerant accession under both treatments while Ceras2 showed an interesting behavior under water stress deficit. Given the fact that Ceras1 grows as a wild variety in semiarid conditions, it may indicate that this accession could have a natural adaptation to similar stresses conditions to those applied here. Morphologically, there are marked differences between the three accessions. Ceras1 is similar to S. pimpinellifolium with thin stem, small leaves, and fruits of similar weight, shape and size (between 1 and 1.5 cm of diameter). In contrast, the other S. l. var. cerasiforme accessions (Ceras2 and Ceras3) are closer to the cultivated tomato, with stronger stem and bigger leaves and fruits of more than 3 cm in diameter. The genetic and morphological variability of S. l. var. cerasiforme was already shown by Blanca et al. [37]. In the three accessions used in this work, strategically selected by their genetics, environmental conditions of origin and morphology, we have found different adaptation to abiotic stresses, showing that this species constitutes a valuable source of variability for tomato’s breeding.

5. Conclusions

Water stress and salinity are major constraints to tomato cultivation and genetic variability has been found limited within the cultivated species. Tomato wild relatives have been reported as important genetic sources of abiotic tolerance traits. The studied accessions showed a remarkable amount of variability regarding water and salt stresses adaptation, corroborating the richness of these materials in genetic variability. Accessions Pim2, Pim3, and Ceras1 showed promising results regarding water stress, while Ceras1 and Ceras2 showed an interesting performance under salt stress. The aptitude of some genotypes to improve under a specific treatment seemed to be linked to the environmental conditions of their region of origin, although variability can be found for adaptation to abiotic stresses among accessions of the same area. The study of the MAGIC population will enable the elucidation of the genetics underlying the tolerance found in some of these accessions and their exploitation in future breeding programs.

Supplementary Materials

The following are available online at https://www.mdpi.com/2073-4395/10/8/1169/s1, Table S1: Two-way ANOVA analysis of net CO2 assimilation rate (AN) and leaf stomatal conductance (gs) in 4 Solanum pimpinellifolium accessions and 3 Solanum lycopersicum var. cerasiforme accessions under control, water stress and salt stress. Table S2: Two-way ANOVA analysis of instantaneous carboxylation efficiency (AN/Ci) and water use efficiency (AN/E) in 4 Solanum pimpinellifolium accessions and 3 Solanum lycopersicum var. cerasiforme accessions under control, water stress and salt stress. Table S3: Two-way ANOVA analysis of SPAD values in 4 Solanum pimpinellifolium accessions and 3 Solanum lycopersicum var. cerasiforme accessions under control, water stress and salt stress. Table S4: Two-way ANOVA analysis of leaf and terminal lobe length and width in 4 Solanum pimpinellifolium accessions and 3 Solanum lycopersicum var. cerasiforme accessions under control, water stress and salt stress. Table S5: Two-way ANOVA analysis of the number of flowers per truss, the number of fruits per truss and the fruit set in 4 Solanum pimpinellifolium accessions and 3 Solanum lycopersicum var. cerasiforme accessions under control, water stress and salt stress. Table S6: Two-way ANOVA analysis of the days to flowering and the days to fructification in 4 Solanum pimpinellifolium accessions and 3 Solanum lycopersicum var. cerasiforme accessions under control, water stress and salt stress. Table S7: Two-way ANOVA analysis of the total soluble solids content (°Brix) and the fruit fresh weight in 4 Solanum pimpinellifolium accessions and 3 Solanum lycopersicum var. cerasiforme accessions under control, water stress and salt stress.

Author Contributions

Conceptualization, S.S., Á.C. and M.J.D.; data curation, M.-R.M.-C., L.P.-D., L.L.-S. and D.A.; formal analysis, M.-R.M.-C., L.P.-D., L.L-S., Á.C. and M.J.D.; funding acquisition, Á.C.; project administration, M.J.D.; resources, Á.C. and M.J.D.; writing—original draft, M.-R.M.-C., L.P.-D., Á.C. and M.J.D.; writing—review & editing, M.-R.M.-C., L.P.-D., S.S., L.L.-S., D.A., Á.C. and M.J.D. All authors have read and agreed to the published version of the manuscript.

Funding

This research was funded by the Spanish Ministerio de Economía y Competitividad and the Fondo Europeo de Desarrollo Regional/European Regional Development Fund, grant number AGL2015-71011-R. Authors also thank the G2P-SOL (Linking genetic resources, genomes, and phenotypes of Solanaceous crops) and BRESOV (Breeding for resilient, efficient, and sustainable organic vegetable production) projects for support. G2P-SOL and BRESOV projects have received funding from the European Union’s Horizon 2020 research and innovation program under grant agreements 677379 (G2PSOL), and 774244 (BRESOV). David Alonso is grateful to Universitat Politècnica de València for a predoctoral (PAID-01-16) contract under the Programa de Ayudas de Investigación y Desarrollo.

Conflicts of Interest

The authors declare no conflict of interest.

References

  1. Cramer, G.R.; Urano, K.; Delrot, S.; Pezzotti, M.; Shinozaki, K. Effects of abiotic stress on plants: A systems biology perspective. BMC Plant Biol. 2011, 11, 1–14. [Google Scholar] [CrossRef] [Green Version]
  2. de Oliveira, A.B.; Mendes Alencar, N.L.; Gomes-Filho, E. Comparison between the water and salt stress effects on plant growth and development. In Responses of Organisms to Water Stress; InTech: London, UK, 2013; pp. 68–94. [Google Scholar]
  3. Farooq, M.; Hussain, M.; Wahid, A.; Siddique, K.H.M. Drought stress in plants: An overview. In Plant Responses to Drought Stress: From Morphological to Molecular Features; Springer-Verlag: Berlin/Heidelberg, Germany, 2012; pp. 1–33. ISBN 9783642326. [Google Scholar]
  4. Niu, G.; Rodriguez, D.S.; Crosby, K.; Leskovar, D.; Jifon, J. Rapid screening for relative salt tolerance among chile pepper genotypes. HortScience 2010, 45, 1192–1195. [Google Scholar] [CrossRef]
  5. De Pascale, S.; Ruggiero, C.; Barbieri, G.; Maggio, A. Physiological responses of pepper to salinity and drought. J. Am. Soc. Hortic. Sci. 2003, 128, 48–54. [Google Scholar] [CrossRef] [Green Version]
  6. Hasanuzzaman, M.; Nahar, K.; Fujita, M. Plant response to salt stress and role of exogenous protectants to mitigate salt-induced damages. In Ecophysiology and Responses of Plants under Salt Stress; Springer: New York, NY, USA, 2013; pp. 25–87. ISBN 9781461447. [Google Scholar]
  7. Munns, R.; Tester, M. Mechanisms of salinity tolerance. Annu. Rev. Plant Biol. 2008, 59, 651–681. [Google Scholar] [CrossRef] [PubMed] [Green Version]
  8. Rao, S.N.K.; Bhatt, R.M.; Sadashiva, A.T. Tolerance to water stress in tomato cultivars. Photosynthetica 2000, 38, 465–467. [Google Scholar] [CrossRef]
  9. Scholberg, J.M.S.; Locascio, S.J. Growth response of snap bean and tomato as affected by salinity and irrigation method. HortScience 1999, 34, 259–264. [Google Scholar] [CrossRef] [Green Version]
  10. Singh, J.; Sastry, E.V.D.; Singh, V. Effect of salinity on tomato (Lycopersicon esculentum Mill.) during seed germination stage. Physiol. Mol. Biol. Plants 2012, 18, 45–50. [Google Scholar] [CrossRef] [Green Version]
  11. Rick, C.M. Potential improvement of tomatoes by controlled introgression of genes from wild species. In Proceedings of the Broadening the Genetic Base of Crops, Wageningen, The Netherlands, 3–7 July 1978; Zeven, A.C., van Harten, A.M., Eds.; Pudoc: Wageningen, The Netherlands, 1979; pp. 167–173. [Google Scholar]
  12. Foolad, M.R. Recent advances in genetics of salt tolerance in tomato. Plant Cell. Tissue Organ Cult. 2004, 76, 101–119. [Google Scholar] [CrossRef]
  13. Albaladejo, I.; Meco, V.; Plasencia, F.; Flores, F.B.; Bolarin, M.C.; Egea, I. Unravelling the strategies used by the wild tomato species Solanum pennellii to confront salt stress: From leaf anatomical adaptations to molecular responses. Environ. Exp. Bot. 2017, 135, 1–12. [Google Scholar] [CrossRef]
  14. Egea, I.; Albaladejo, I.; Meco, V.; Morales, B.; Sevilla, A.; Bolarin, M.C.; Flores, F.B. The drought-tolerant Solanum pennellii regulates leaf water loss and induces genes involved in amino acid and ethylene/jasmonate metabolism under dehydration. Sci. Rep. 2018, 8, 1–14. [Google Scholar] [CrossRef]
  15. Zuriaga, E.; Blanca, J.M.; Cordero, L.; Sifres, A.; Blas-Cerdán, W.G.; Morales, R.; Nuez, F. Genetic and bioclimatic variation in Solanum pimpinellifolium. Genet. Resour. Crop Evol. 2009, 56, 39–51. [Google Scholar] [CrossRef]
  16. Zuriaga, E.; Blanca, J.; Nuez, F. Classification and phylogenetic relationships in Solanum section Lycopersicon based on AFLP and two nuclear gene sequences. Genet. Resour. Crop Evol. 2009, 56, 663–678. [Google Scholar] [CrossRef]
  17. Rick, C.M.; Fobes, J.F.; Holle, M. Genetic variation in Lycopersicon pimpinellifolium: Evidence of evolutionary change in mating systems. Plant Syst. Evol. 1977, 127, 139–170. [Google Scholar] [CrossRef]
  18. Villalta, I.; Reina-Sánchez, A.; Bolarín, M.C.; Cuartero, J.; Belver, A.; Venema, K.; Carbonell, E.A.; Asins, M.J. Genetic analysis of Na+ and K+ concentrations in leaf and stem as physiological components of salt tolerance in tomato. Theor. Appl. Genet. 2008, 116, 869–880. [Google Scholar] [CrossRef]
  19. Lin, K.H.; Yeh, W.L.; Chen, H.M.; Lo, H.F. Quantitative trait loci influencing fruit-related characteristics of tomato grown in high-temperature conditions. Euphytica 2010, 174, 119–135. [Google Scholar] [CrossRef]
  20. Bolarín, M.C.; Fernández, F.G.; Cruz, V.; Cuartero, J. Salinity tolerance in four wild tomato species using vegetative yield-salinity response curves. J. Am. Soc. Hortic. Sci. 1991, 116, 286–290. [Google Scholar] [CrossRef] [Green Version]
  21. Cuartero, J.; Yeo, A.R.; Flowers, T.J. Selection of donors for salt-tolerance in tomato using physiological traits. New Phytol. 1992, 121, 63–69. [Google Scholar] [CrossRef]
  22. Foolad, M.R.; Chen, F.Q. RFLP mapping of QTLs conferring salt tolerance during the vegetative stage in tomato. Theor. Appl. Genet. 1998, 97, 1133–1144. [Google Scholar] [CrossRef]
  23. Cuartero, J.; Fernández-Muñoz, R. Tomato and salinity. Sci. Hortic. (Amsterdam). 1999, 78, 83–125. [Google Scholar] [CrossRef]
  24. Foolad, M.R. Comparison of salt tolerance during seed germination and vegetative growth in tomato by QTL mapping. Genome 1999, 42, 727–734. [Google Scholar] [CrossRef]
  25. Foolad, M.R.; Zhang, L.P.; Lin, G.Y. Identification and validation of QTLs for salt tolerance during vegetative growth in tomato by selective genotyping. Genome 2001, 44, 444–454. [Google Scholar] [CrossRef] [PubMed]
  26. Bolarín, M.C.; Estañ, M.T.; Caro, M.; Romero-Aranda, R.; Cuartero, J. Relationship between tomato fruit growth and fruit osmotic potential under salinity. Plant Sci. 2001, 160, 1153–1159. [Google Scholar] [CrossRef]
  27. Zhang, L.P.; Lin, G.Y.; Foolad, M.R. QTL comparison of salt tolerance during seed germination and vegetative stage in a Lycopersicon esculentum × L. pimpinellifolium RIL population. In Proceedings of the XXVI International Horticultural Congress: Environmental Stress and Horticulture Crops, Toronto, ON, Canada, 11 August 2002; pp. 59–67. [Google Scholar]
  28. Estañ, M.T.; Villalta, I.; Bolarín, M.C.; Carbonell, E.A.; Asins, M.J. Identification of fruit yield loci controlling the salt tolerance conferred by solanum rootstocks. Theor. Appl. Genet. 2009, 118, 305–312. [Google Scholar] [CrossRef] [PubMed]
  29. Rao, E.S.; Kadirvel, P.; Symonds, R.C.; Ebert, A.W. Relationship between survival and yield related traits in Solanum pimpinellifolium under salt stress. Euphytica 2013, 190, 215–228. [Google Scholar] [CrossRef] [Green Version]
  30. Rao, E.S.; Kadirvel, P.; Symonds, R.C.; Geethanjali, S.; Thontadarya, R.N.; Ebert, A.W. Variations in DREB1A and VP1.1 genes show association with salt tolerance traits in wild tomato (Solanum pimpinellifolium). PLoS ONE 2015, 10, 1–19. [Google Scholar] [CrossRef] [PubMed] [Green Version]
  31. Razali, R.; Bougouffa, S.; Morton, M.J.L.; Lightfoot, D.J.; Alam, I.; Essack, M.; Arold, S.T.; Kamau, A.A.; Schmöckel, S.M.; Pailles, Y.; et al. The genome sequence of the wild tomato Solanum pimpinellifolium provides insights into salinity tolerance. Front. Plant Sci. 2018, 9, 1–21. [Google Scholar] [CrossRef] [PubMed] [Green Version]
  32. Nakazato, T.; Goodwin, S.B.; Sutter, T.R. Comparative Transcriptome Analysis of Responses to Water Deficit in Solanum lycopersicum and S. pimpinellifolium Roots. Available online: https://omictools.com/88516daa3ab811e2cd922bd46ae0ade3-dataset (accessed on 26 February 2020).
  33. Rick, C.M. Tomato, Lycopersicon esculentum (Solanaceae). In Evolution of Crop Plants; Longman Group: London, UK, 1976; pp. 268–273. [Google Scholar]
  34. Warnock, S.J. Natural habitats of Lycopersicon species. HortScience 1991, 26, 466–471. [Google Scholar] [CrossRef] [Green Version]
  35. Diouf, I.A.; Derivot, L.; Bitton, F.; Pascual, L.; Causse, M. Water deficit and salinity stress reveal many specific QTL for plant growth and fruit quality traits in tomato. Front. Plant Sci. 2018, 9, 1–13. [Google Scholar] [CrossRef] [Green Version]
  36. Blanca, J.; Montero-Pau, J.; Sauvage, C.; Bauchet, G.; Illa, E.; Díez, M.J.; Francis, D.M.; Causse, M.; van der Knaap, E.; Cañizares, J. Genomic variation in tomato, from wild ancestors to contemporary breeding accessions. BMC Genomics 2015, 16, 257. [Google Scholar] [CrossRef] [Green Version]
  37. Blanca, J.; Cañizares, J.; Cordero, L.; Pascual, L.; Díez, M.J.; Nuez, F. Variation revealed by SNP genotyping and morphology provides insight into the origin of the tomato. PLoS ONE 2012, 7, e48198. [Google Scholar] [CrossRef] [Green Version]
  38. Climate-Data.org. Datos climáticos mundiales. Available online: https://es.climate-data.org/ (accessed on 5 March 2020).
  39. Beck, H.E.; Zimmermann, N.E.; McVicar, T.R.; Vergopolan, N.; Berg, A.; Wood, E.F. Present and future köppen-geiger climate classification maps at 1-km resolution. Sci. Data 2018, 5, 180214. [Google Scholar] [CrossRef] [PubMed] [Green Version]
  40. Maynard, D.N.; Hochmuth, G.J. Knott’s Handbook for Vegetable Growers; John Willey & Sons: New York, NY, USA, 2007; ISBN 978-0-471-73828-2. [Google Scholar]
  41. Allen, R.G. Crop Evapotranspiration: Guidelines for Computing Crop Water Requirements; Food and Agriculture Organization of the United Nations: Rome, Italy, 1998. [Google Scholar]
  42. Lang, S.P.; Tibbitts, T.W. Factors controlling intumescences development in tomato plants. J. Am. Soc. Hortic. Sci. 1983, 108, 93–98. [Google Scholar]
  43. Bolarín, M.C.; Cano, E.A.; Estañ, M.T.; Caro, M. Growth, fruit yield, and ion concentration in tomato genotypes after pre- and post-emergence salt treatments. J. Am. Soc. Hortic. Sci. 1993, 118, 655–660. [Google Scholar] [CrossRef] [Green Version]
  44. Jones, R.A.; Hashim, M.; El-Beltagy, A.S. Developmental responsiveness of salt-tolerant and salt-sensitive genotypes of Lycopersicon. In Arid Lands: Today and Tomorrow; Whitehead, E., Hutchison, F., Timmeman, B., Varazy, R., Eds.; Westview Press: Boulder, CO, USA, 1988; pp. 765–772. [Google Scholar]
  45. Maas, E.V. Salt tolerance of plants. Appl. Agric. Reasearch 1986, 1, 12–26. [Google Scholar]
  46. Cantore, V.; Lechkar, O.; Karabulut, E.; Sellami, M.H.; Albrizio, R.; Boari, F.; Stellacci, A.M.; Todorovic, M. Combined effect of deficit irrigation and strobilurin application on yield, fruit quality and water use efficiency of “cherry” tomato (Solanum lycopersicum L.). Agric. Water Manag. 2016, 167, 53–61. [Google Scholar] [CrossRef]
  47. López-Serrano, L.; Penella, C.; Bautista, A.S.; López-Galarza, S.; Calatayud, Á. Physiological changes of pepper accessions in response to salinity and water stress. Spanish J. Agric. Res. 2017, 15, e0804. [Google Scholar] [CrossRef] [Green Version]
  48. Chaves, M.M.; Oliveira, M.M. Mechanisms underlying plant resilience to water deficits: prospects for water-saving agriculture. J. Exp. Bot. 2004, 55, 2365–2384. [Google Scholar] [CrossRef] [Green Version]
  49. Flexas, J.; Bota, J.; Loreto, F.; Cornic, G.; Sharkey, T.D. Diffusive and metabolic limitations to photosynthesis under drought and salinity in C3 plants. Plant Biol. 2004, 6, 269–279. [Google Scholar] [CrossRef]
  50. Lawlor, D.W. Limitation to photosynthesis in water-stressed leaves: stomata vs. metabolism and the role of ATP. Ann. Bot. 2002, 89, 871–885. [Google Scholar] [CrossRef]
  51. Flexas, J.; Bota, J.; Escalona, J.M.; Sampol, B.; Medrano, H. Effects of drought on photosynthesis in grapevines under field conditions: An evaluation of stomatal and mesophyll limitations. Funct. Plant Biol. 2002, 29, 461–471. [Google Scholar] [CrossRef] [Green Version]
  52. Nuruddin, M.M.; Madramootoo, C.A.; Dodds, G.T. Effects of water stress at different growth stages on greenhouse tomato yield and quality. HortScience 2003, 38, 1389–1393. [Google Scholar] [CrossRef] [Green Version]
  53. Yin, Y.G.; Kobayashi, Y.; Sanuki, A.; Kondo, S.; Fukuda, N.; Ezura, H.; Sugaya, S.; Matsukura, C. Salinity induces carbohydrate accumulation and sugar-regulated starch biosynthetic genes in tomato (Solanum lycopersicum L. cv. ’Micro-Tom’) fruits in an ABA-and osmotic stress-independent manner. J. Exp. Bot. 2010, 61, 563–574. [Google Scholar] [CrossRef] [PubMed]
  54. Albert, E.; Segura, V.; Gricourt, J.; Bonnefoi, J.; Derivot, L.; Causse, M. Association mapping reveals the genetic architecture of tomato response to water deficit: focus on major fruit quality traits. J. Exp. Bot. 2016, 67, 6413–6430. [Google Scholar] [CrossRef] [PubMed]
  55. Ripoll, J.; Urban, L.; Brunel, B.; Bertin, N. Water deficit effects on tomato quality depend on fruit developmental stage and genotype. J. Plant Physiol. 2016, 190, 26–35. [Google Scholar] [CrossRef]
  56. Nakazato, T.; Bogonovich, M.; Moyle, L.C. Environmental factors predict adaptive phenotypic differentiation within and between two wild Andean tomatoes. Evolution (N. Y.) 2008, 62, 774–792. [Google Scholar] [CrossRef]
  57. Chaves, M.M.; Flexas, J.; Pinheiro, C. Photosynthesis under drought and salt stress: Regulation mechanisms from whole plant to cell. Ann. Bot. 2009, 103, 551–560. [Google Scholar] [CrossRef] [Green Version]
  58. Massaretto, I.L.; Albaladejo, I.; Purgatto, E.; Flores, F.B.; Plasencia, F.; Egea-Fernández, J.M.; Bolarín, M.C.; Egea, I. Recovering tomato landraces to simultaneously improve fruit yield and nutritional quality against salt stress. Front. Plant Sci. 2018, 9, 1–17. [Google Scholar] [CrossRef] [Green Version]
  59. Penella, C.; Nebauer, S.G.; Quiñones, A.; San Bautista, A.; López-Galarza, S.; Calatayud, Á. Some rootstocks improve pepper tolerance to mild salinity through ionic regulation. Plant Sci. 2015, 230, 12–22. [Google Scholar] [CrossRef] [Green Version]
  60. Praxedes, S.C.; de Lacerda, C.; DaMatta, F.M.; Prisco, J.T.; Gomes-Filho, E. Salt tolerance is associated with differences in ion accumulation, biomass allocation and photosynthesis in cowpea cultivars. J. Agron. Crop Sci. 2010, 196, 193–204. [Google Scholar] [CrossRef]
  61. Saleem, A.; Ashraf, M.; Akram, N.A. Salt (NaCl)-induced modulation in some key physio-biochemical attributes in Okra (Abelmoschus esculentus L.). J. Agron. Crop Sci. 2011, 197, 202–213. [Google Scholar] [CrossRef]
  62. Vargas, D.; Rodríguez, E.; Sánchez, J.J.; Montes, S.; Ruiz, A.; Lépiz, R.; Puente, P.; Martínez, J.L. Adaptación climática de Lycopersicum en el occidente de México. (Climatic adaptation of Lycopersicon in west Mexico). In Avances en la Investiación Científica en el CUCBA; Universidad de Guadalajara: Guadalajara, Mexico, 2005; pp. 207–210. ISBN 970-27-0770-6. [Google Scholar]
  63. Sánchez-Peña, P.; Oyama, K.; Núñez-Farfán, J.; Fornoni, J.; Hernández-Verdugo, S.; Márquez-Guzmán, J.; Garzón-Tiznado, J.A. Sources of resistance to whitefly (Bemisia spp.) in wild populations of Solanum lycopersicum var. cerasiforme (Dunal) spooner G.J. Anderson et R.K. Jansen in Northwestern Mexico. Genet. Resour. Crop Evol. 2006, 53, 711–719. [Google Scholar]
Figure 1. Köppen-Geiger climate classification map of Mexico (A), Costa Rica (B), Ecuador (C) and Peru (D) with the collection sites of the eight tomato accessions used in this study marked. Adapted from Beck et al. (2018) [39].
Agronomy 10 01169 g001
Figure 2. Net CO2 assimilation rate (µmol CO2 m−2s−1) (A,B), and leaf stomatal conductance (mol H2O m−2s−1) (C,D) in accessions Pim1, Pim2, Pim3, Pim4, Ceras1, Ceras2 and Ceras3 under control, water stress and salt treatment at 75 (A,B) and 120 (C,D) days after treatment (DAT). Data are mean values ± SE for n = 8 plants. Within each accession, different letters indicate significant differences at p < 0.05 (LSD test). Analysis of two-way ANOVA is provided in supplementary material in Table S1. AN: Net CO2 assimilation rate; gs: stomatal conductance; SE: Standard error.
Agronomy 10 01169 g002
Figure 3. Instantaneous carboxylation efficiency (AN/Ci) (A) and instantaneous water use efficiency (AN/E) (B) in accessions Pim1, Pim2, Pim3, Pim4, Ceras1, Ceras2 and Ceras3 under control, water stress and salt treatment after 120 days of treatment. Data are mean values ± SE for n = 8 plants. Within each accession, different letters indicate significant differences at p < 0.05 (LSD test). Analysis of two-way ANOVA is provided in supplementary material in Table S2. AN: Net CO2 assimilation rate; Ci: internal CO2; E: transpiration; SE: Standard error.
Agronomy 10 01169 g003
Figure 4. Soil Plant Analysis Development (SPAD) chlorophyll meter values in accessions Pim1, Pim2, Pim3, Pim4, Ceras1, Ceras2, and Ceras3 under control, water stress and salt treatment after 120 days of treatment. Data are mean values ± SE for n = 8 plants. Within each accession, different letters indicate significant differences at p < 0.05 (LSD test). Analysis of two-way ANOVA is provided in supplementary material in Table S3. SE: Standard error.
Agronomy 10 01169 g004
Figure 5. Leaf and terminal lobe length and width (cm) in accessions Pim1, Pim2, Pim3, Pim4, Ceras1, Ceras2, and Ceras3 under control, water stress and salt treatment after 75 (A) and 120 (B) days of treatment (DAT). Data are mean values ± SE for n = 8 plants. Within each accession, different letters indicate significant differences at p < 0.05 (LSD test). Analysis of two-way ANOVA is provided in supplementary material in Table S4. SE: Standard error.
Agronomy 10 01169 g005
Figure 6. Number of flowers per truss (A), number of fruits per truss (B) and fruit set (C) in accessions Pim1, Pim2, Pim3, Pim4, Ceras1, Ceras2 and Ceras3 under control, water stress and salt treatments after 75 days of treatment Data are mean values ± SE for n = 8 plants. Within each accession, different letters indicate significant differences at p < 0.05 (LSD test). Analysis of two-way ANOVA is provided in supplementary material in Table S5. SE: Standard error.
Agronomy 10 01169 g006
Figure 7. Days to flowering (A) and days to fructification (B) in accessions Pim1, Pim2, Pim3, Pim4, Ceras1, Ceras2 and Ceras3 under control, water stress and salt treatments after 75 days treatment. Data are mean values ± SE for n = 8 plants. Within each accession, different letters indicate significant differences at p < 0.05 (LSD test). Analysis of two-way ANOVA is provided in supplementary material in Table S6. SE: Standard error.
Agronomy 10 01169 g007
Figure 8. Total soluble solids content (°Brix) (A) and fruit fresh weight (FW, g) (B) in accessions Pim1, Pim2, Pim3, Pim4, Ceras1, Ceras2 and Ceras3 under control, water stress and salt treatments after 4 months exposure. Data are mean values ± SE for n = 8 plants. Within each accession, different letters indicate significant differences at p < 0.05 (LSD test). Analysis of two-way ANOVA is provided in supplementary material in Table S7. SE: Standard error.
Agronomy 10 01169 g008
Table 1. Passport, abbreviation, and environmental data * of the eight tomato accessions used in the experiment.
S. pimpinellifolium AccessionsPim1Pim2Pim3Pim4
Genebank CodeBGV007145BGV006454BGV015382BGV013720
SpeciesS. pimpinellifoliumS. pimpinellifoliumS. pimpinellifoliumS. pimpinellifolium
CountryEcuadorPeruPeruPeru
StateManabíPiuraAmazonasIca
GPS Coordinates0°13′19.0″ S 79°29′20.0″ W5°08′51.0″ S 80°16′13.0″ W5°53′08.0″ S 78°10′34.0″ W14°34′49.0" S 74°53′14.0″ W
Altitude (m)238366371020
Mean Annual Temperature (°C)25242213
Temperature Seasonality (%)39211
Diurnal Temperature Range (°C)81299
Mean Annual Precipitation (mm)280649732258
Precipitation Seasonality (%)8313435140
S. l. var. cerasiforme AccessionsCeras1Ceras2Ceras3Ceras4
Genebank CodeBGV007931LA2251PI487625BGV006769
SpeciesS. l. var. cerasiformeS. l. var. cerasiformeS. l. var. cerasiformeS. l. var. cerasiforme
CountryMexicoPeruCosta RicaEcuador
StateSinaloaSan MartínLos DiamantesNapo
GPS Coordinates26°03′30.0″ N 109°22′30.0″ W6°08′30.0″ S 77°05′30.0″ W9°36′22.0″ N 84°08′27.0″ W1°01′52.0″ S 77°47′10.0″ W
Altitude (m)108831465512
Mean Annual Temperature (°C)24231823
Temperature Seasonality (%)20332
Diurnal Temperature Range (°C)136108
Mean Annual Precipitation (mm)341139422744330
Precipitation Seasonality (%)121277620
* Environmental data source: climate-data.org [38].

