Article

Aluminum-Specific Upregulation of GmALS3 in the Shoots of Soybeans: A Potential Biomarker for Managing Soybean Production in Acidic Soil Regions

by
Raj Kishan Agrahari
1,
Yuriko Kobayashi
1,
Pankaj Borgohain
2,
Sanjib Kumar Panda
3 and
Hiroyuki Koyama
1,*
1
Faculty of Applied Biological Sciences, Gifu University, Gifu 501-1193, Japan
2
Department of Life Science and Bioinformatics, Assam University, Silchar 788011, India
3
Department of Biochemistry, Central University of Rajasthan, Rajasthan 305817, India
*
Author to whom correspondence should be addressed.
Agronomy 2020, 10(9), 1228; https://doi.org/10.3390/agronomy10091228
Submission received: 28 June 2020 / Revised: 18 August 2020 / Accepted: 19 August 2020 / Published: 20 August 2020

Abstract

:
Aluminum (Al) toxicity in acidic soils is a global agricultural problem that limits crop productivity through the inhibition of root growth. However, poor management associated with the application of soil acidity amendments such as lime (CaCO3) in certain crop types can pose a threat to low-input farming practices. Accordingly, it is important to develop appropriate techniques for the management of crop production in acidic soils. In this study, we identified ALS3 (ALUMINUM SENSITIVE 3) in soybeans (Glycine max, cultivar Toyomasari), which is highly expressed in the shoot under Al stress. GmALS3 (Glyma.10G047100) expression was found to be Al-specific under various stress conditions. We analyzed GmALS3 expression in the shoots of soybean plants grown in two different types of acidic soils (artificial and natural acidic soil) with different levels of liming and found that GmALS3 expression was suppressed with levels of liming that have been shown to eliminate soil Al3+ toxicity. Using soybeans as a model, we identified a potential biomarker that could indicate Al toxicity and appropriate liming levels for soybeans cultivated in acidic soils.

1. Introduction

Inadequate fertilizer management is a risk for agricultural ecosystems. Overuse of fertilizers can result in soil-related problems such as salinity, excess and imbalance of nutrients, etc [1]. On the other hand, adequate management of fertilizers can alleviate the stresses found in several soil types. For example, acidic soils (pH < 5.5) contain various stress factors, including aluminum (Al) and proton (H+) rhizotoxicities and phosphorus (P) and calcium (Ca) deficiencies [2,3,4,5,6,7]. Most of these stress factors could be alleviated by the application of fertilizers, which can be expensive. However, this method would be challenging for several farmers in developing countries/regions dominated by acidic soils. For example, crop production in the northeast (NE) region of India is always lower than the national average because of soil acidity. About 80% of arable land in the NE region is acidic owing to its high rainfall; however, most local farmers are not able to apply sufficient fertilizers [8]. A solution to enable sustainable food production in such regions could be achieved by the development of new farming approaches that involve suitable soil management.
Both field and laboratory experiments have shown that the inhibitory effects of acidic soil can be ameliorated by the application of Ca fertilizers, including calcium carbonate (limestone) and gypsum. Liming (application of CaCO3) reduces the amount of soluble Al in the soil solution and exchangeable Al in soil particles. In contrast, the application of gypsum reduces the attraction of rhizotoxic Al3+ to the plasma membrane surface [9,10]. This indicates that a reduction of Al3+ rhizotoxicity in acidic soil can be achieved by the application of Ca fertilizers. However, the application of Ca fertilizers is not feasible for low-input farming practices in developing countries because of its high cost [11,12]. Moreover, it has been reported that excess liming decreases the yield of crops (such as upland rice) grown in some soil types [13]. Excess liming induces soil mineral leaching, which can result in phosphorous (P) and manganese (Mn) deficiencies in the soil [13,14,15] and can inhibit Mg acquisition by plants [16,17]. Taken together, an optimal liming program would be required to establish sustainable production of crops in acidic soil regions of developing countries [18].
A combination of soil and plant analyses can be used to design appropriate fertilizer management protocols; however, accurate and convenient analytical procedures are required. Accurate procedures have been developed to evaluate major nutrients in soils and plants (e.g., available P levels in the soil (e.g., [19])). Handy procedures using electrical impedance are available to quantify nitrogen (N) and potassium (K) levels in crop plants [20,21]. Such procedures have not yet been developed for estimating Al stress in acidic soils. One possible solution would be the application of biomarkers to evaluate various stress factors. Yang et al. [22] developed a transcript biomarker that can estimate N status in maize, while Sadder et al. [23] identified a number of putative biomarkers associated with different sources of abiotic stress in tomato (drought, heat and salinity). These findings suggest that gene expression biomarkers could be useful for managing Ca levels in acidic fields.
Previous studies have found that several Al-tolerance genes are regulated by the zinc finger transcription factor SENSITIVE TO PROTON RHIZOTOXICITY1 (STOP1) [24]. Functional genomics analyses have shown that Al tolerance regulated by STOP1 is conserved in land plants, including bryophytes [25,26,27,28,29,30,31]. On the other hand, studies in the model plant Arabidopsis have demonstrated that several STOP1-regulated genes show a nearly specific response to Al. For example, ALS3, a major Al-tolerance gene whose transcription is regulated by STOP1, shows specific expression under Al-stressed conditions in Arabidopsis. Although the molecular mechanism of ALS3 underlying Al tolerance has not yet been clarified, several interesting characteristics were identified [32]. ALS3 transports UDP-glucose as a bacterial-type ABC transporter [26], which is rare in plants and is encoded as single copy gene in both rice (STAR2) and in the Arabidopsis genome. Most of the STOP1-dependent Al-tolerance genes [e.g., ALUMINUM ACTIVATED MALATE TRANSPORTER1 (AtALMT1) and MULTIDRUG AND TOXIC COMPOUNDS EXTRUSION (AtMATE)] [26] are only inducible in the roots, as these protein-encoding genes play important roles in Al excursion from the roots. On the basis of comparative microarray analyses, we previously demonstrated that ALS3 is also inducible in the shoots of Arabidopsis and tobacco [33]; however, its role in Al tolerance in the shoot remains unexplored. Given that the expression of ALS3 in the shoot is essentially specific to Al in these model plants, we hypothesized that identification of this system would be useful in monitoring the levels of Al toxicity in soybeans grown in acidic soils.
The soybean is a commercially important crop that is widely cultivated in acidic soils, including the NE region of India [12]. In the present study, the soybean was used as a model to analyze GmALS3 expression in shoots grown in acidic soil with different levels of liming. Our analysis suggests that GmALS3 expression in the shoot under Al stress could be a biomarker to determine Al toxicity in soybeans as well as to manage liming in acidic soil.

2. Materials and Methods

2.1. DNA/Protein Sequence, Phylogenetic Analyses

The nucleotide and protein sequences of AtALS3 and other orthologs of Arabidopsis shoot Al-inducible genes (AT5G38200, AT1G09350 and AT5G06860; [33]) were retrieved from Phytozome-12 (https://phytozome.jgi.doe.gov/pz/portal.html) and NCBI (https://www.ncbi.nlm.nih.gov/gene) database. A search for ALS3 orthologs of different plant species (Nicotiana tabacum, Oryza sativa, Triticum aestivum, G. max, Cicer arietinum, Zea mays, Medicago truncatula, Cajanus cajan, Phaseolus vulgaris, Vigna angularis, Vigna mungo, Vigna radiata and Vigna unguiculata) was carried out using the Basic Local Alignment Search Tool (BLASTP) (https://blast.ncbi.nlm.nih.gov/Blast.cgi?PAGE=Proteins). Sequence identity was analyzed by using Clustal Omega (https://www.ebi.ac.uk/Tools/msa/clustalo/). A phylogenetic tree was generated using Phylogeny.fr (http://www.phylogeny.fr/index.cgi) [34].

2.2. Hydroponic Culture

Soybean (G. max L. Merrill) cultivar Toyomasari seeds were surface-sterilized with 1% sodium hypochlorite for 2 min, rinsed with deionized water and kept for 2 days on moist filter paper in the dark at 25 °C in Petri dishes. Germinated seeds were supported on mesh dipped into magenta boxes (growing area of 39.51sq. cm) filled with 250 mL modified MGRL medium which enhances Al rhizotoxicity at the plasma membrane surface according to Gouy–Chapman–Stern model (2% nutrients in the presence of 200 µM CaCl2 [35,36]). Seedlings were grown for 10 days at 25 °C under 12 h illuminations (photosynthetic photon flux density; 37 µmol/m2/s) per day. The initial pH was adjusted to 5.6, and the medium was renewed every 2 days. For the Al-concentration-dependence experiment, plants pregrown for 10days were transferred to a control solution (2% MGRL media with 0 µM AlCl3 (pH 4.5 and 6.0)) and treatment solution (2% MGRL media containing 25, 50 or 100 µM AlCl3 (pH 4.5)) for 24 h [28,33]. During the time-course experiment, plants pregrown for 10days were exposed to 2% MGRL media containing 50 µM AlCl3 for 0, 6, 24, 48 or 72 h (pH 4.5). For the pH experiment, 10-day-old pregrown plants were exposed to 2% MGRL media with different pH (4, 4.5, 5, 5.5, 6, 6.5 or 7.0) for 24 h [26]. To evaluate the effect of nutrients on the expression of GmALS3, 10-day-old pregrown plants were exposed to 2% MGRL media deficient in specific nutrients (nitrogen (N), phosphorus (P) or potassium (K)) for 24 h. For the Al-specific experiment, plants pregrown for 10 days were exposed to 2% MGRL media containing rhizotoxic ions (50-µM AlCl3, 25-µM CdCl2, 10-µM CuSO4 or 75-mM NaCl; pH 4.5; this condition inhibits relative root elongation by 30–50%) or no rhizotoxic ions (pH 4.5 or 6.0) for 24 h [33]. The relative root elongation of soybeans was measured as (net root growth with stress/net root growth without stress) cm × 100%. Plant tissues were harvested without touching the plants in order to avoid the likelihood of wounding. After harvesting, tissues were immediately frozen in liquid nitrogen and stored at −80 °C. These samples were subsequently utilized for RNA isolation and transcript analysis.

2.3. Acidic Soil Experiment

We used two types of acidic soils: an artificial acidic soil, with artificial neutral soil (PROTOLEAF, Tokyo, Japan) as a control and an acidic soil collected from NE region of India, with neutral field soil as a control. To evaluate soil acidity, the pH (1:2.5 w/v soil: water solution) and exchangeable Al content of the soil were quantified using the methods described by Koyama et al. [37]. Acidic soils were neutralized by adding CaCO3 at levels that have been shown to eliminate Al3+ toxicity [36] (5.0 g kg−1 for artificial acidic soil and 6.2 g kg−1 for acidic soil collected from the field). Next, 2 g kg−1 CaCO3 was added to the neutral soil as a mock treatment. Different legumes (G. max (cultivar Toyomasari, Kinshu, Tanbakuro and Tsurunoko), C. arietinum, C. cajan, V. mungo, V. radiata and V. unguiculata) were grown in individual plastic pots filled with 500 g of soil (dry weight). After sowing, the plants were grown for two weeks at the same temperature and light/dark regime as those used in hydroponics. Throughout the experiment, the plants were irrigated each day with deionized water to maintain soil moisture. For gene-expression analysis, plant tissues were harvested without directly touching the plants to avoid potential plant injury. After harvesting, the tissues were immediately immersed in liquid nitrogen and stored at −80 °C for subsequent RNA isolation and transcript analysis.

2.4. RNA Extraction and cDNA Synthesis

Samples of shoot tissues (150 mg) were homogenized using a Shake Master Neo tissue homogenizer (Hirata, Shiga, Japan). Total RNA was isolated using Sepasol-RNA I Super G (Nacalai Tesque, Kyoto, Japan) and a NucleoSpin RNA Plant Kit (Macherey–Nagel, Germany) according to the manufacturer’s instructions. The integrity of the isolated total RNA was evaluated using agarose gels stained with ethidium bromide. The quality of the RNA was analyzed based on A260/A280 and 260/230 absorbance ratios by using a NanoVuePlus spectrophotometer (Biochrom, Holliston, MA, USA). Samples with an RNA integrity (28S/18S ribosomalRNA bands) less than 2.2, a 260/280 ratio of less than 1.9 or a 260/230 ratio of less than 1.8 were not used for the preparation of cDNA. Aliquots (500 ng) of total RNA were reverse-transcribed using ReverTra Ace quantitative PCR master mix (Toyobo, Osaka, Japan) and aPrimeScriptTM 1ststrand cDNA Synthesis Kit (Takara, Japan) containing genomic DNA remover in a final reaction volume of 10 µL, following the manufacturers’ instructions. Prior to usage, all cDNA samples were stored at −80 °C.

2.5. Primer Design

The primers used to amplify all genes were designed using Primer 3 software (http://bioinfo.ut.ee/primer3-0.4.0/) (Table S1) according to Takara Bio real-time PCR primer design guidelines (https://www.takara-bio.co.jp/prt/pdfs/prt3-1.pdf). Briefly, the primer sets had a melting temperature of between 60 and 65 °C, GC content between 40% and 60%, a size between 17 and 25 bp, and amplicon sizes ranging from 80 to 150-bp in length [28]. The primers were synthesized by Eurofins Genomics K.K. (Tokyo, Japan).

2.6. Transcript Analysis

A quantitative polymerase chain reaction (qRT-PCR) was performed using SYBR Premix Ex Taq II (Takara Bio, Otsu, Japan) and SsoFast EvaGreen Supermix (Bio-Rad, Hercules, CA, USA) with a Dice Real Time System II MRQ thermal cycler (Takara, Japan) and CFX96 Real-Time system (Bio-Rad, Hercules, CA, USA) according to the manufacturer’s instructions. Briefly, all quantifications were carried out based on the qRT-PCR standard curve method proposed by Bustin et al. [38], as described by Kobayashi et al. [39,40]. For all quantifications, a standard curve was constructed using a cDNA dilution series. The transcript levels of selected genes [Glyma.10G047100 (GmALS3), Glyma.03G175800, Glyma.13G044600, Glyma.05G124000, Glyma.03G222000, CaALS3, CcALS3, VmALS3, VrALS3, VuALS3 and GmNRAMPs (1a, 1b, 2b)] were normalized to those of the internal standards (Figure S1) (GmUBQ10 [41], CaActin [42], CcActin [28], VmActin [43], VrActin [44] and VuActin [45]) and expressed as relative fold changes (RFCs) compared with the control [40,46]. We included a control with no reverse transcriptase to check for genomic DNA contamination. The amplification efficiencies of the primer pairs used in all qRT–PCR assays were found to be between 93.6% and 112.3% (Table S2) and the standard curve coefficients of determination (R2) were all greater than 0.98. A dissociation curve analysis (60 to 95 °C) was performed after 40 cycles to verify the specificity of the amplicons. The amplicon specificities were confirmed by the presence of a single peak. Each amplification was repeated three times. For semiquantitative RT–PCR, PCR products were separated by 3% agarose gel electrophoresis and visualized with GelRed staining. Gel images were obtained using a Typhoon 9410 image scanner (Amersham Biosciences, NJ, USA).

2.7. Growth and Biomass Assay in Acidic Soil

Growth was measured in terms of shoot and root length, shoot and root fresh weight and shoot and root dry weight. The relative shoot and root elongation of soybeans grown in acidic soil for two weeks was measured as (net shoot or root growth in the acidic soil/net shoot or root growth in neutral soil) cm × 100%. After this two-week period, the plant shoots and roots were separated from the soil. The fresh weight was measured immediately after incubation; thereafter, samples were oven-dried at 80 °C for 48 h in order to determine the dry weight.

2.8. Quantification of Al Content

Three sets of plants were grown in both acidic and non-acidic soil for two weeks, and the shoots and roots were excised and rinsed with deionized water. The samples were oven-dried at 80 °C for 48 h. The samples were then digested with concentrated HNO3 (2 mL; electronic chemical grade; Kanto Chemical, Tokyo, Japan) and concentrated H202 (0.5 mL; semiconductor grade; Santoku Chemical, Tokyo, Japan), and the digestate was dried using a Digi PREP digestion apparatus (SCP science, Baie-D’Urfe, QC, Canada). The samples were then solubilized in 3 mL of 2% (v/v) HNO3 in ultrapure water. The shoot and root Al content were analyzed using inductively coupled plasma–mass spectrometry (ICP-MS; ELAN DRC-e; PerkinElmer, Waltham, MA, USA) according to the manufacturer’s manual [47].

2.9. Statistical Analysis

The experimental design was completely randomized. All data are expressed as the mean (±standard error) of three biologic replicates (3–4 plants per replicate), and three technical replicates were run for each biologic replicate. Differences between the parameters were evaluated using Student’s t-test with Microsoft Excel 2010, and p-values ≤ 0.05 were considered to be statistically significant.

3. Results

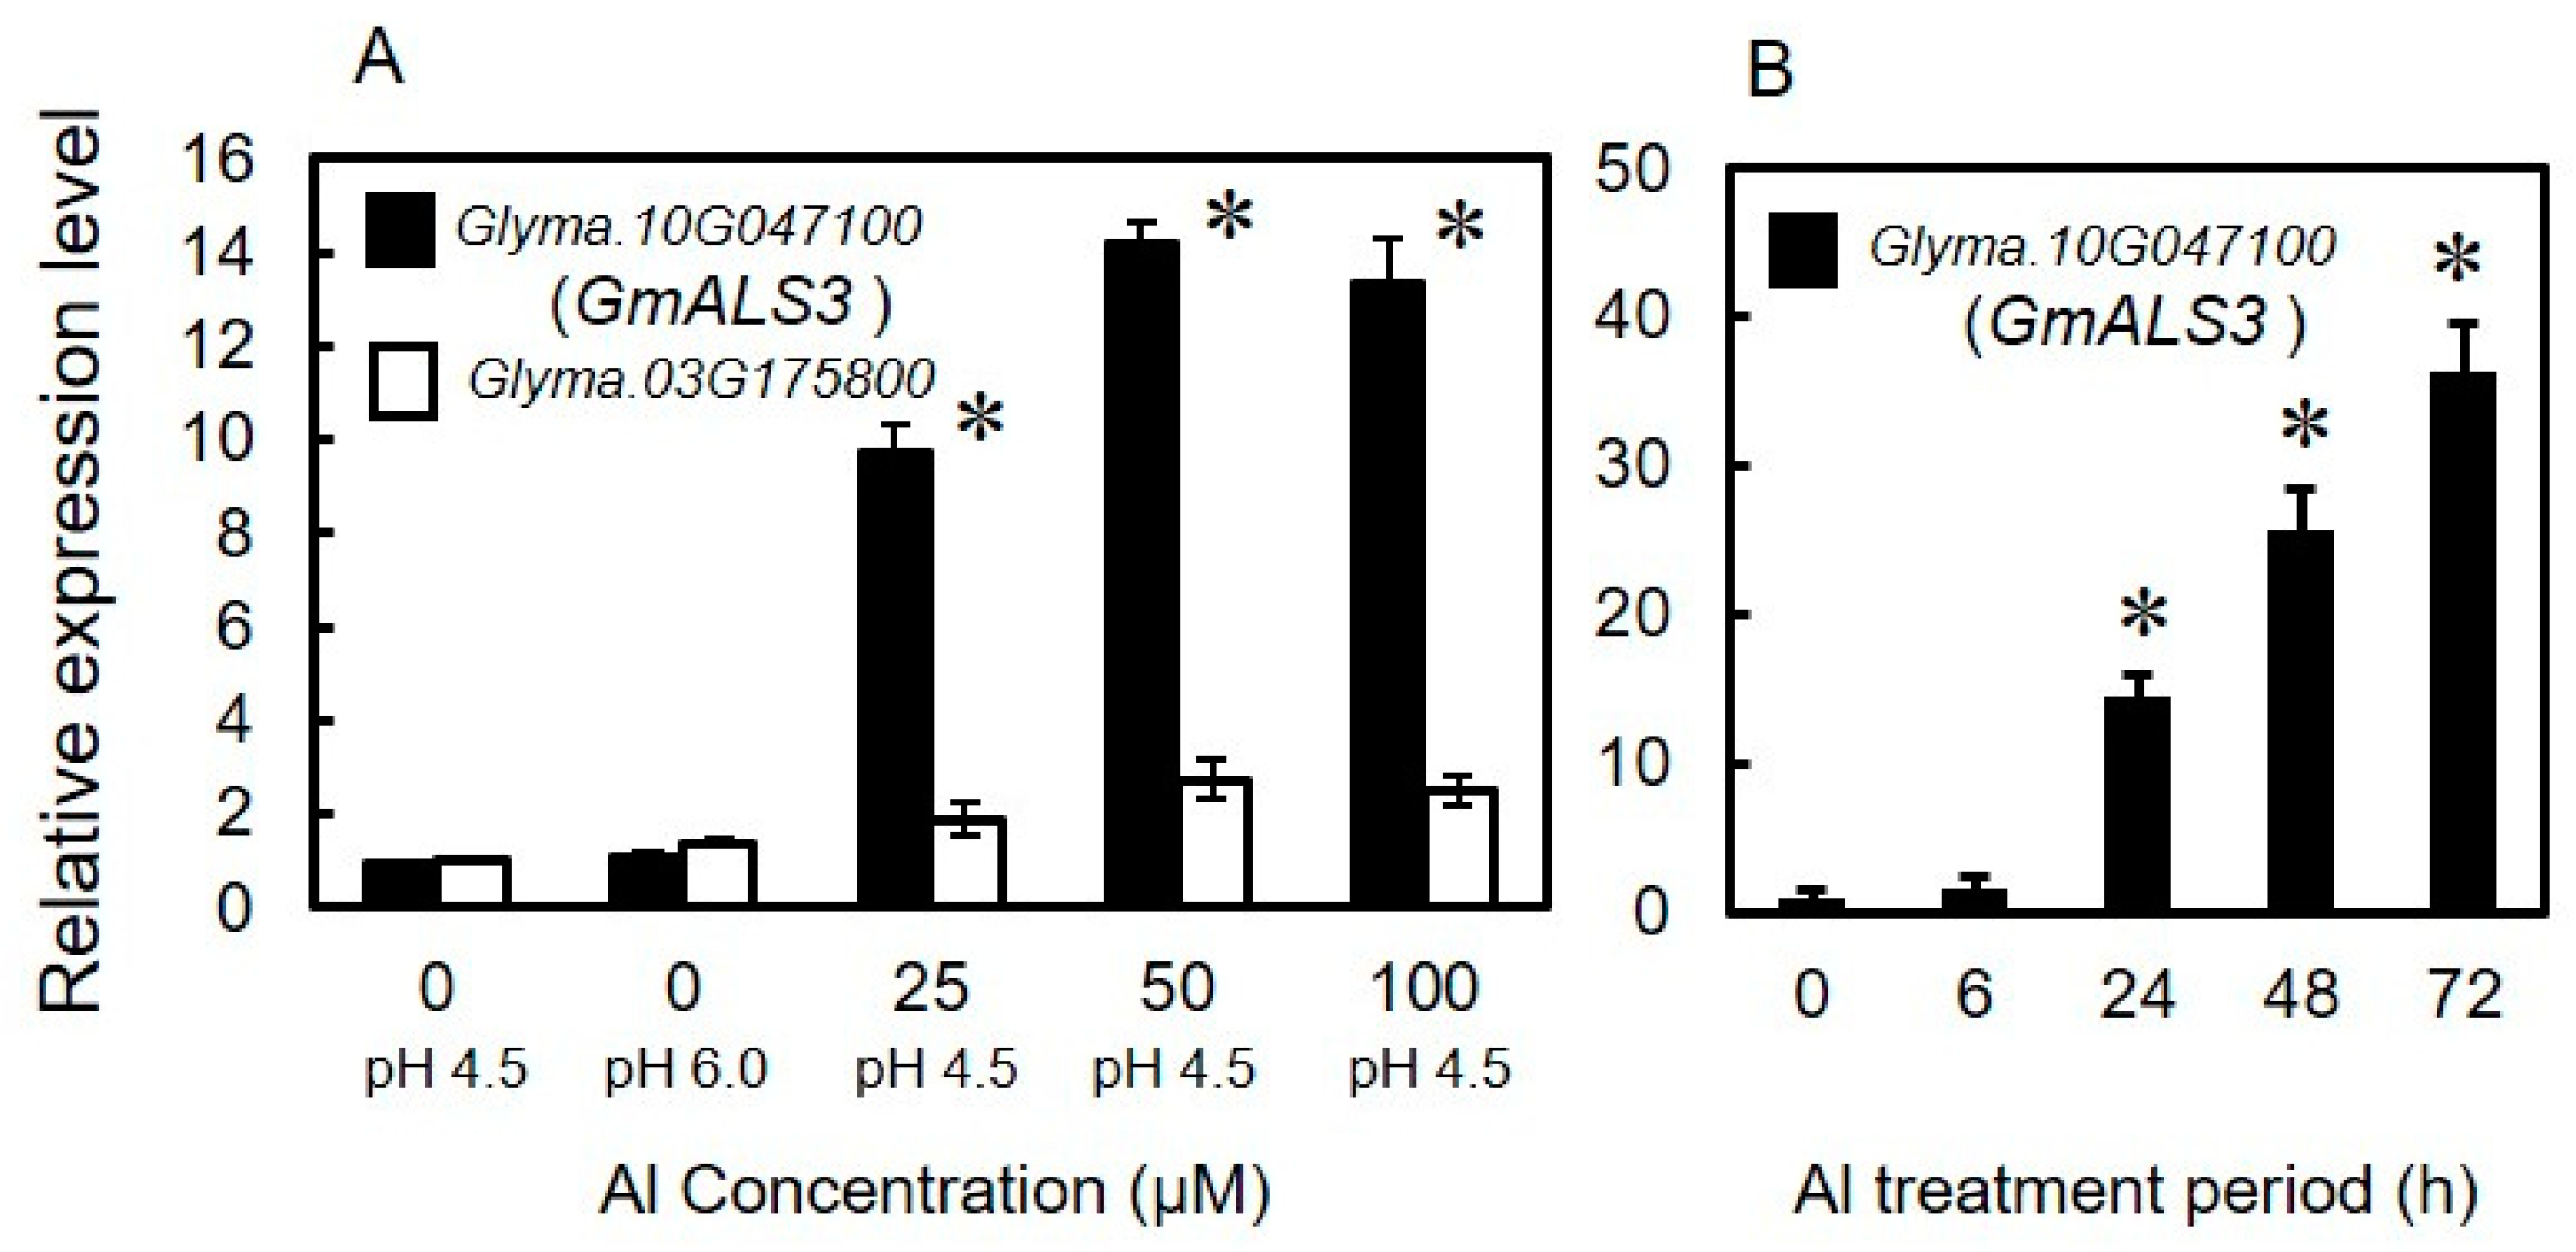
3.1. Identification of Orthologs of AtALS3 in Soybeans That Are Inducible by Aluminum

AtALS3 orthologs in soybeans were identified by the Phytozome 12 with BLASTP program. Based on the scores (S) and expected (E) values of BLASTP (i.e., the E-value decreases exponentially as the S of the orthologs increase), we identified two protein sequences (Table 1) that showed high similarity (90.1% and 89.7%) to AtALS3. We analyzed the expression levels of the genes encoding these orthologs in the shoots after exposing the roots to different concentrations of Al. Neither gene was induced by the low pH treatment (pH 4.5). By contrast, expression of Glyma.10G047100, but not Glyma.03G175800 was significantly induced in the shoots (Figure 1A) during 24 h of Al treatment (Figure 1B). This suggests that Glyma.10G047100 is the Al-responsive orthologue of AtALS3. Hereafter, Glyma.10G047100 is designated as GmALS3.

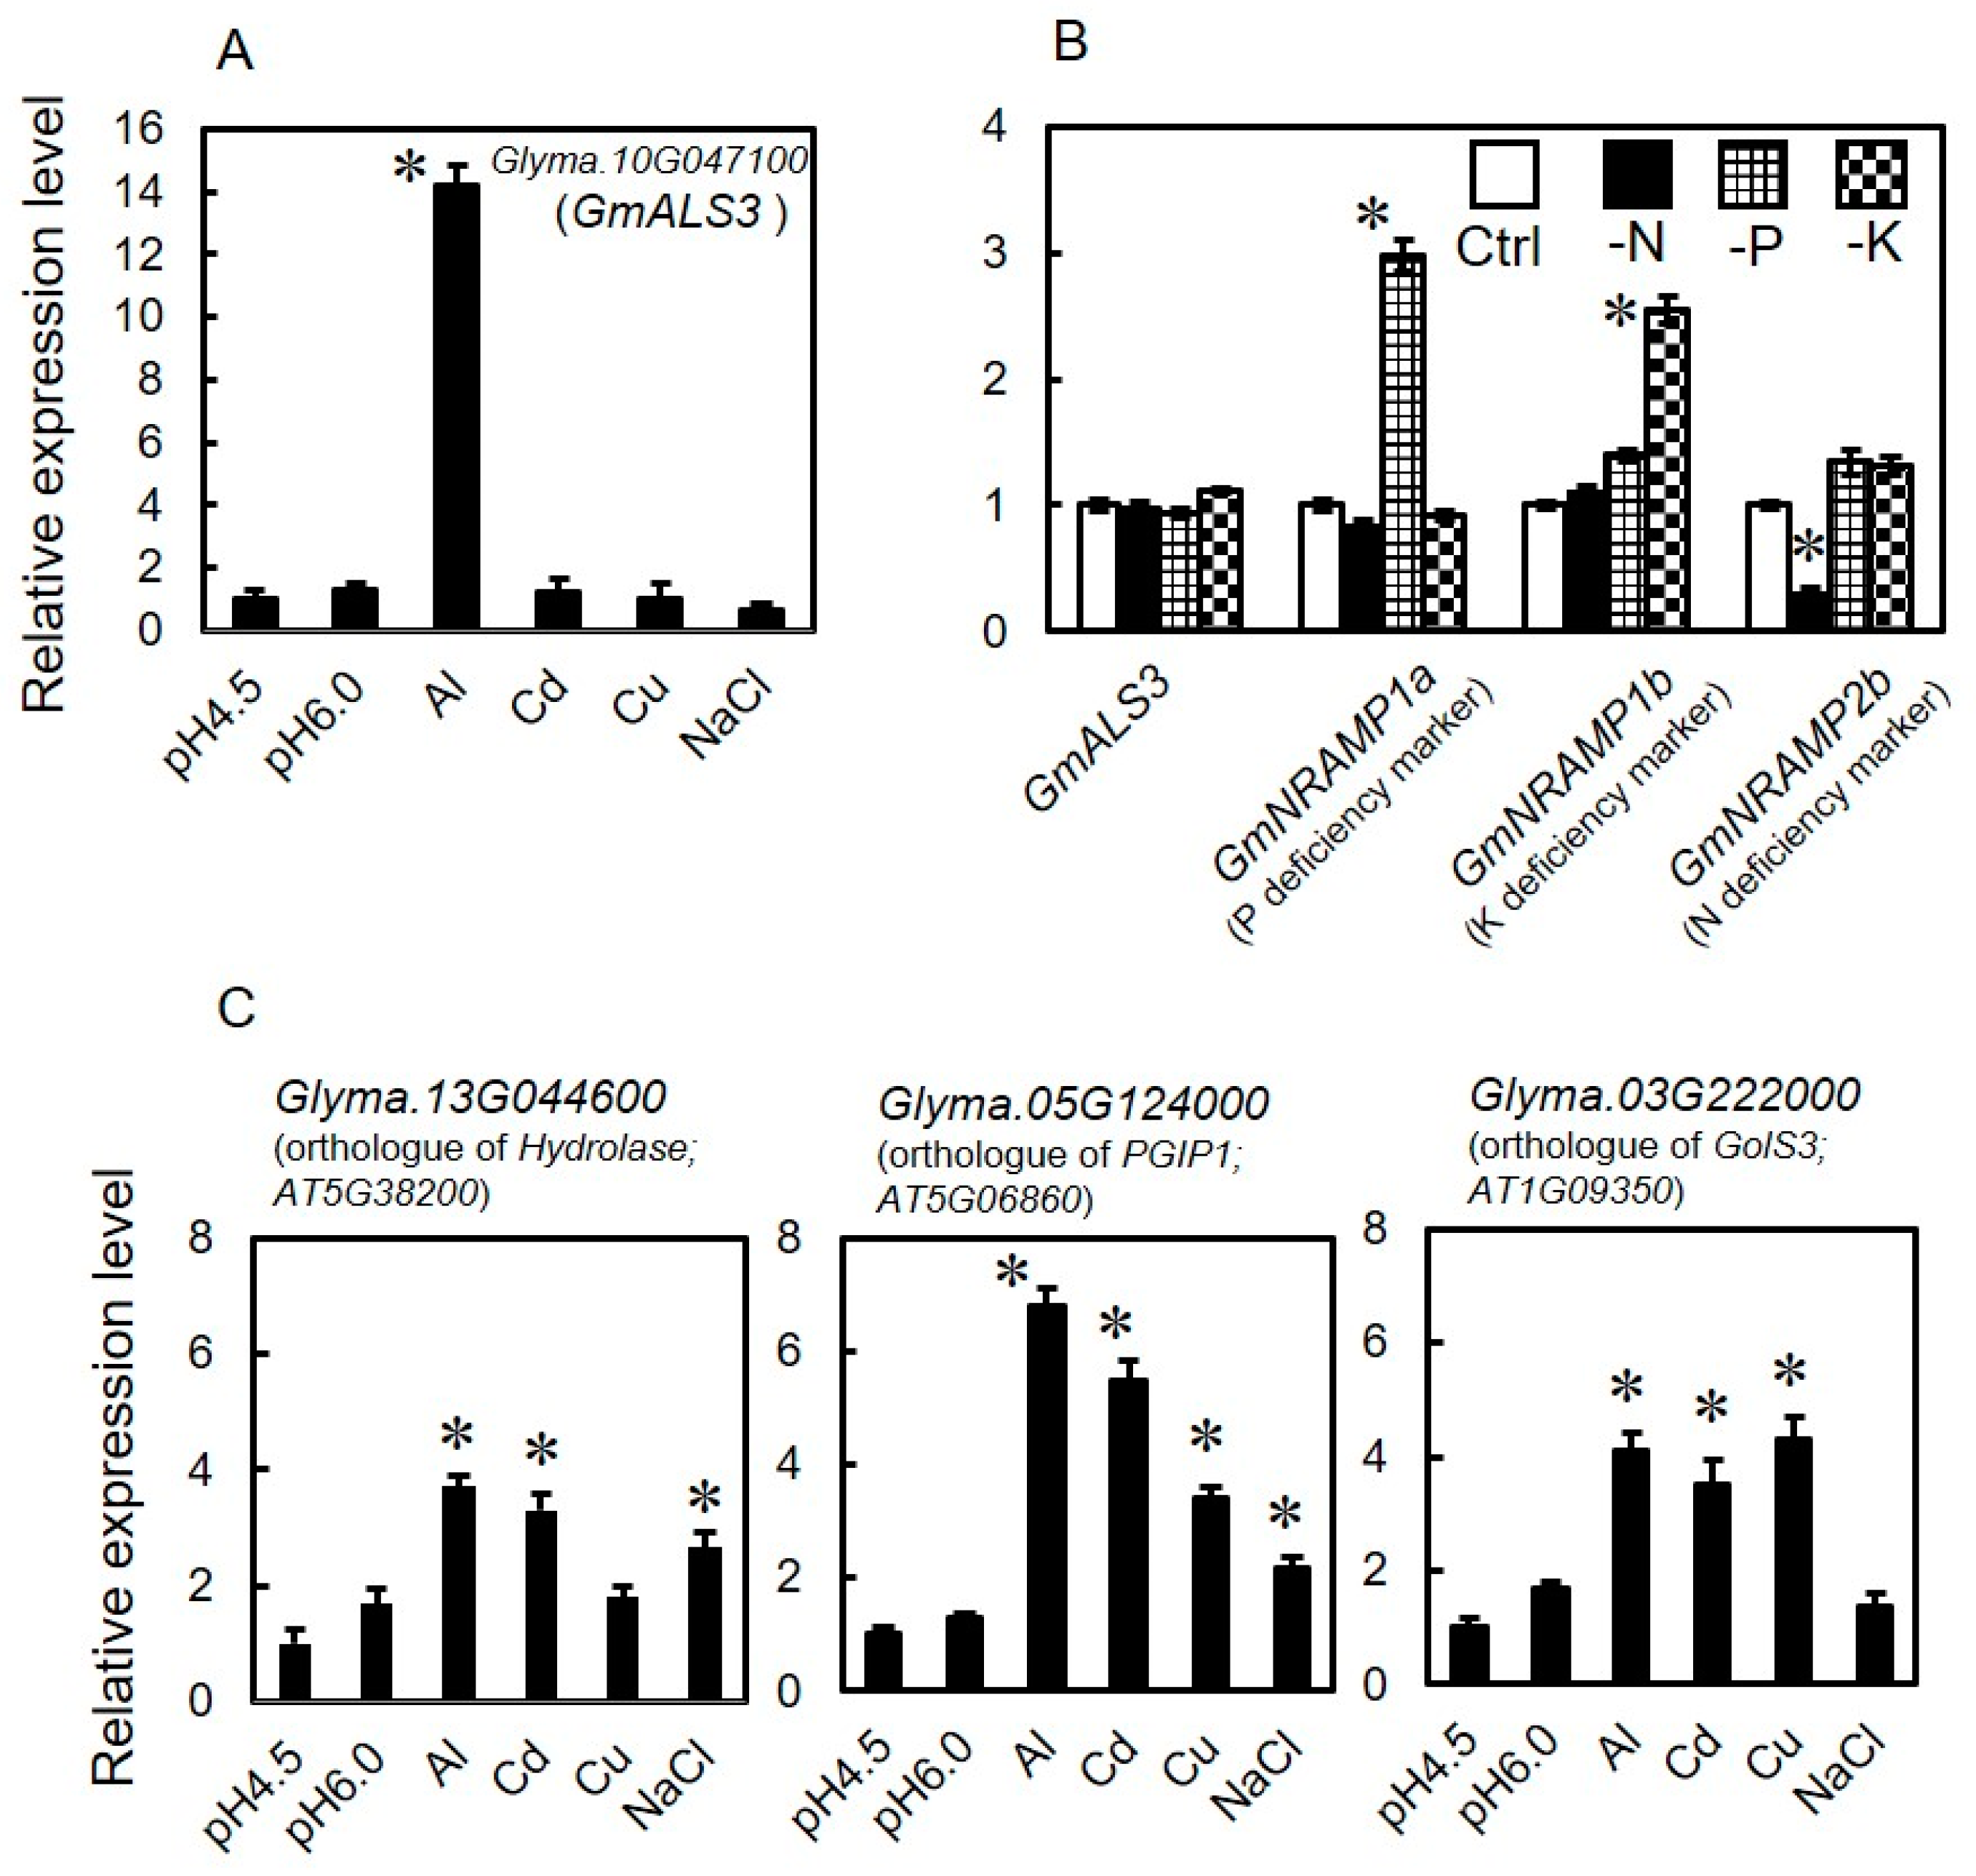
3.2. Expression Profile of GmALS3 in Response to Rhizotoxic Ion Stress and Nutrient-Deficiency Treatments under Hydroponic Culture Conditions

The expression of GmALS3 wasprofiled in the shoots after exposure of the roots to various rhizotoxic stress conditions (Al, Cd, Cu and NaCl). All of the ionic stress conditions induced similar levels of inhibition on the relative root elongation (about 30% of inhibition at 24 h, about 50% at 72 h; Figure S2A). After 24 h of treatment, the expression of GmALS3 was specifically induced by Al in the shoots, but not by the others (Figure 2A). In addition, we also observed that pH alone had no significant effect on the expression of GmALS3 (Figure S2B). These results suggest that expression of GmALS3 is nearly specific to Al among rhizotoxic ion stresses.
To evaluate the responses of GmALS3 to deficiency of macronutrients, we analyzed the expression of GmALS3 in the shoots after exposure of the roots to solutions deficient in nitrogen (N), phosphorus (P) or potassium (K). In these experimental conditions, we found typical altered expression of marker genes of N, P and K deficiencies [48]. GmNRAMP2b (a repressive marker gene of N deficiency) was repressed in N deficiency. GmNRAMP1a (an inducible marker gene of P deficiency) and GmNRAMP1b (an inducible marker gene of K deficiency) were induced in P deficiency and K deficiency, respectively (Figure 2B). By contrast, the expression of GmALS3 was comparable to that in the control solution containing all nutrients (Figure 2B). These results showed that GmALS3 expression was induced by Al stress; other ion-related stresses or nutrient deficiency stress had no significant effect on the expression.
On the other hand, we also analyzed the Al-specific expression of other genes in soybean, which are orthologs of specifically Al-inducible genes in Arabidopsis [33] [Glyma.13G044600 (orthologue of Hydrolase; AT5G38200), Glyma.05G124000 (orthologue of PGIP1; AT5G06860) and Glyma.03G222000 (orthologue of GolS3; AT1G09350)]. Although all of these genes were inducible by Al, they did not show an Al-specific response, as GmALS3 did (Figure 2C). These observations suggest that GmALS3 could be used to evaluate Al rhizotoxicity compared with other Al-inducible genes.

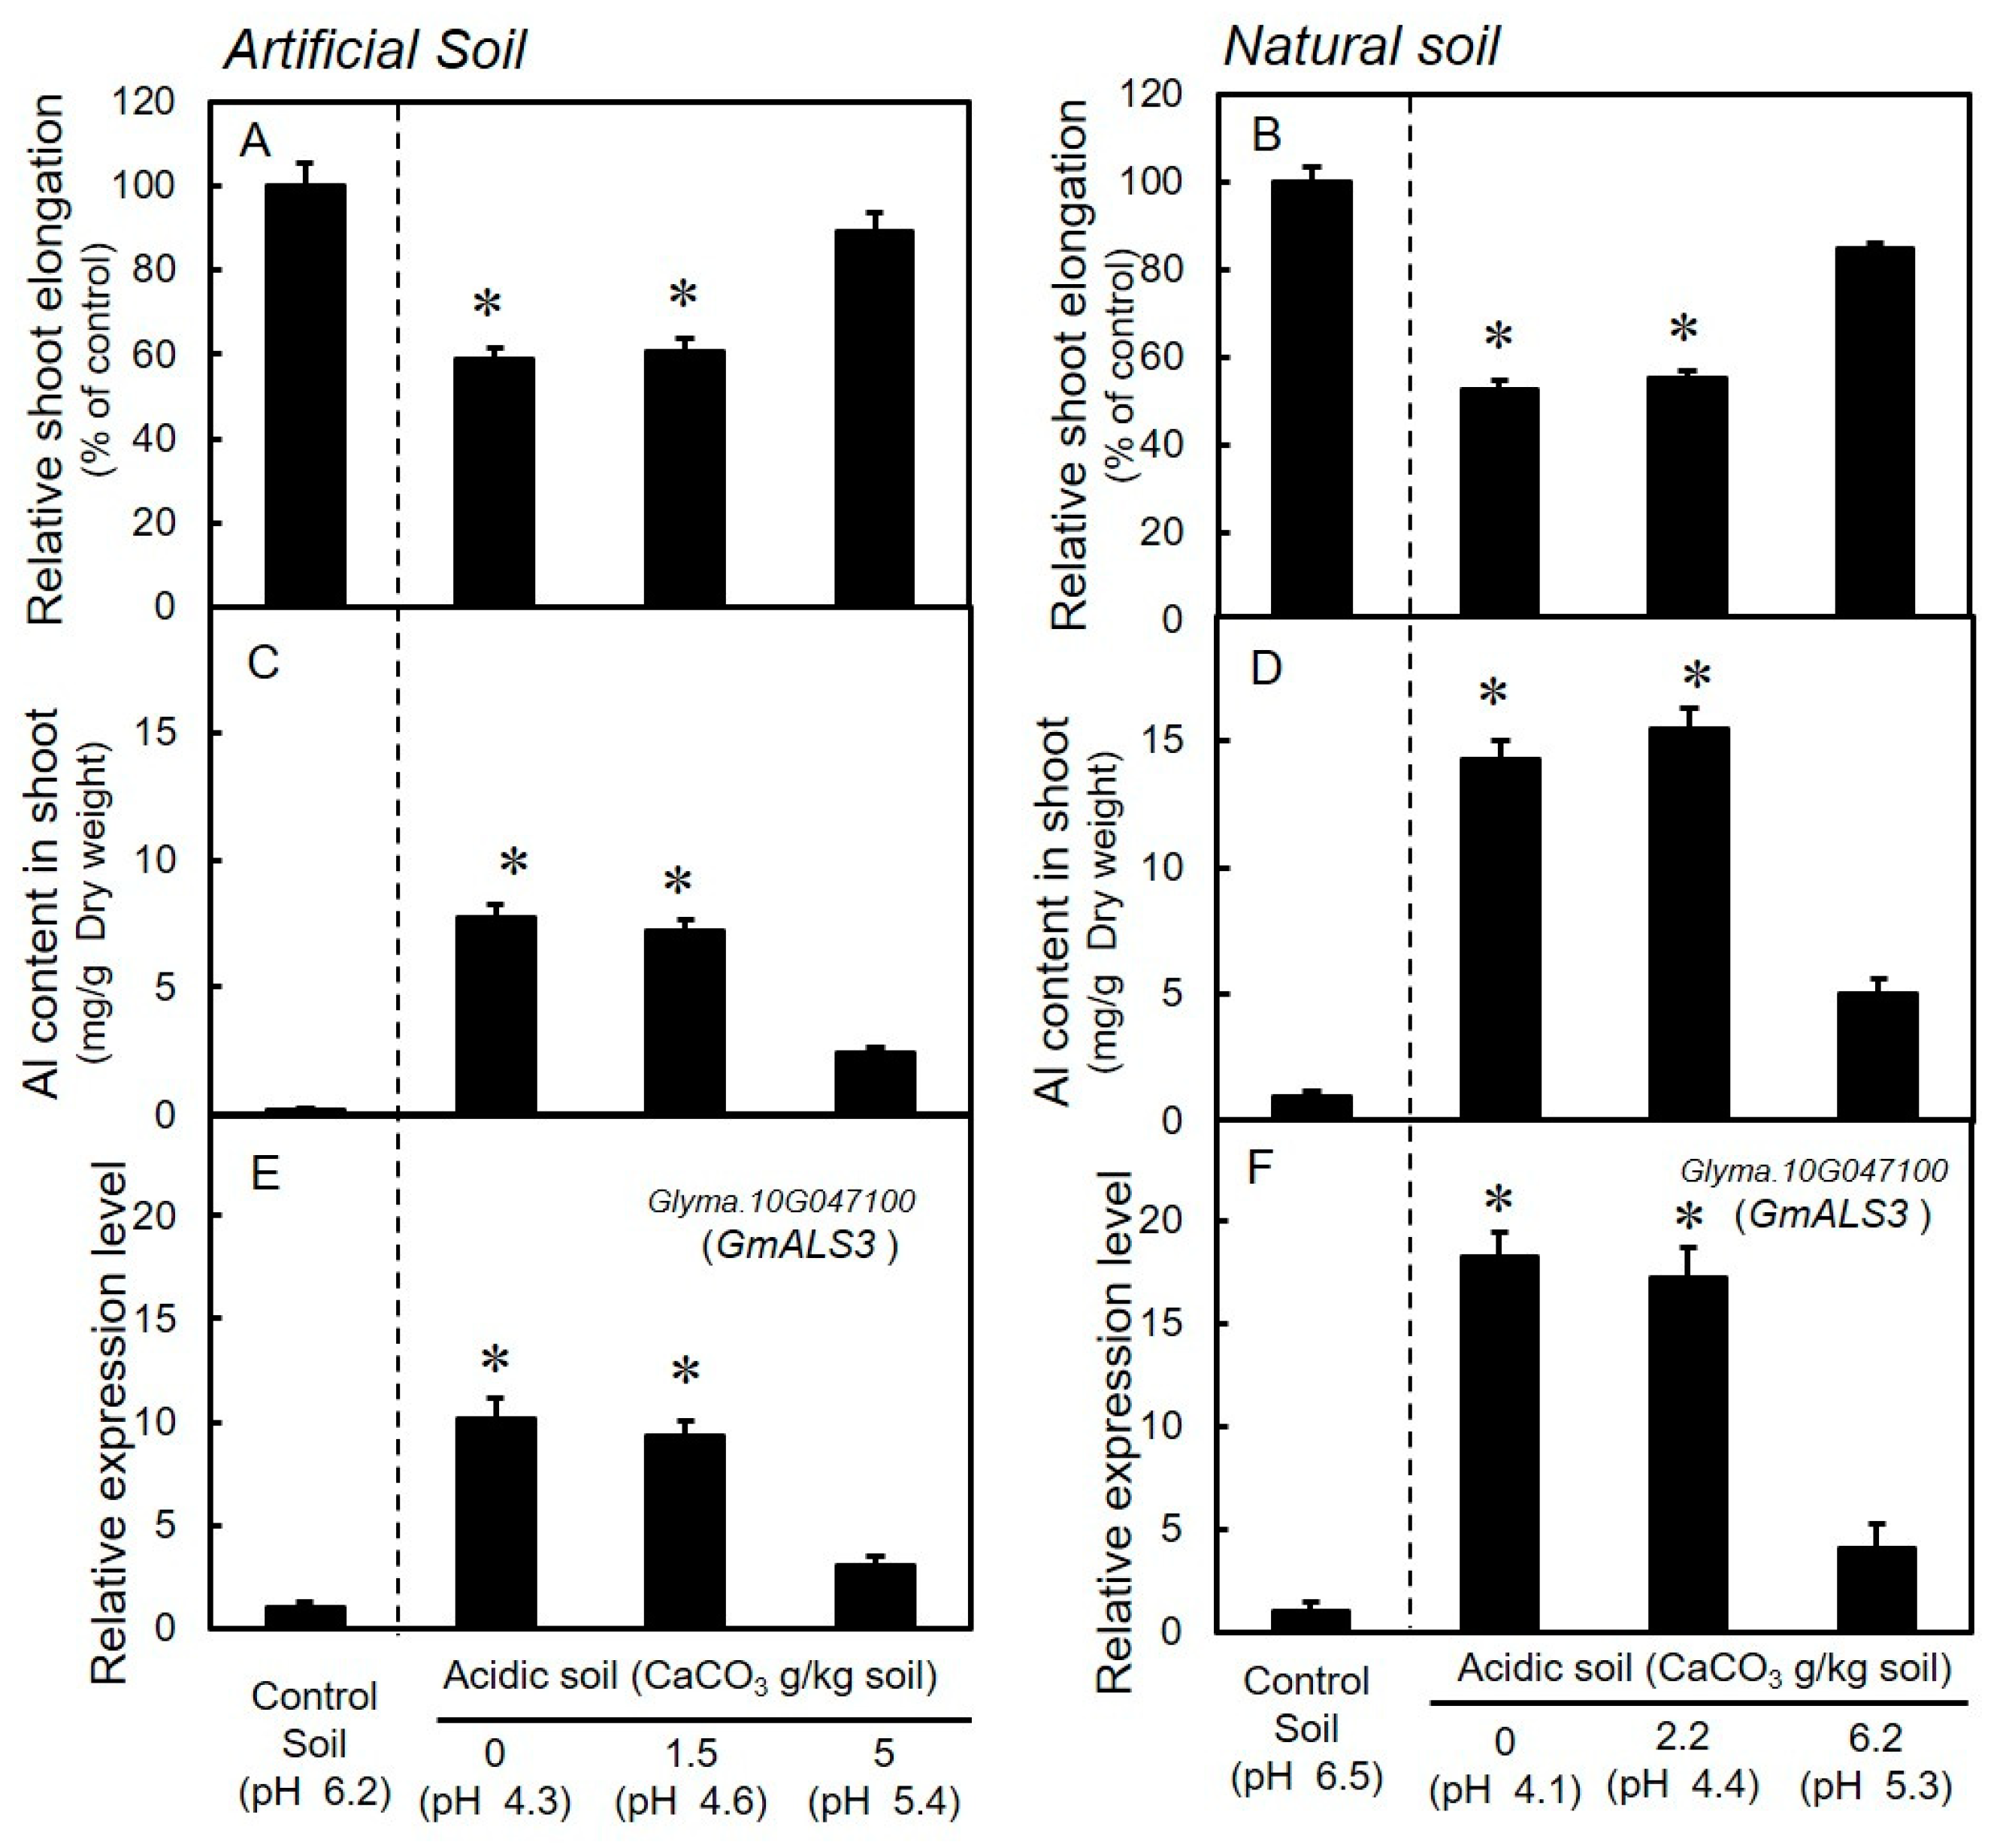
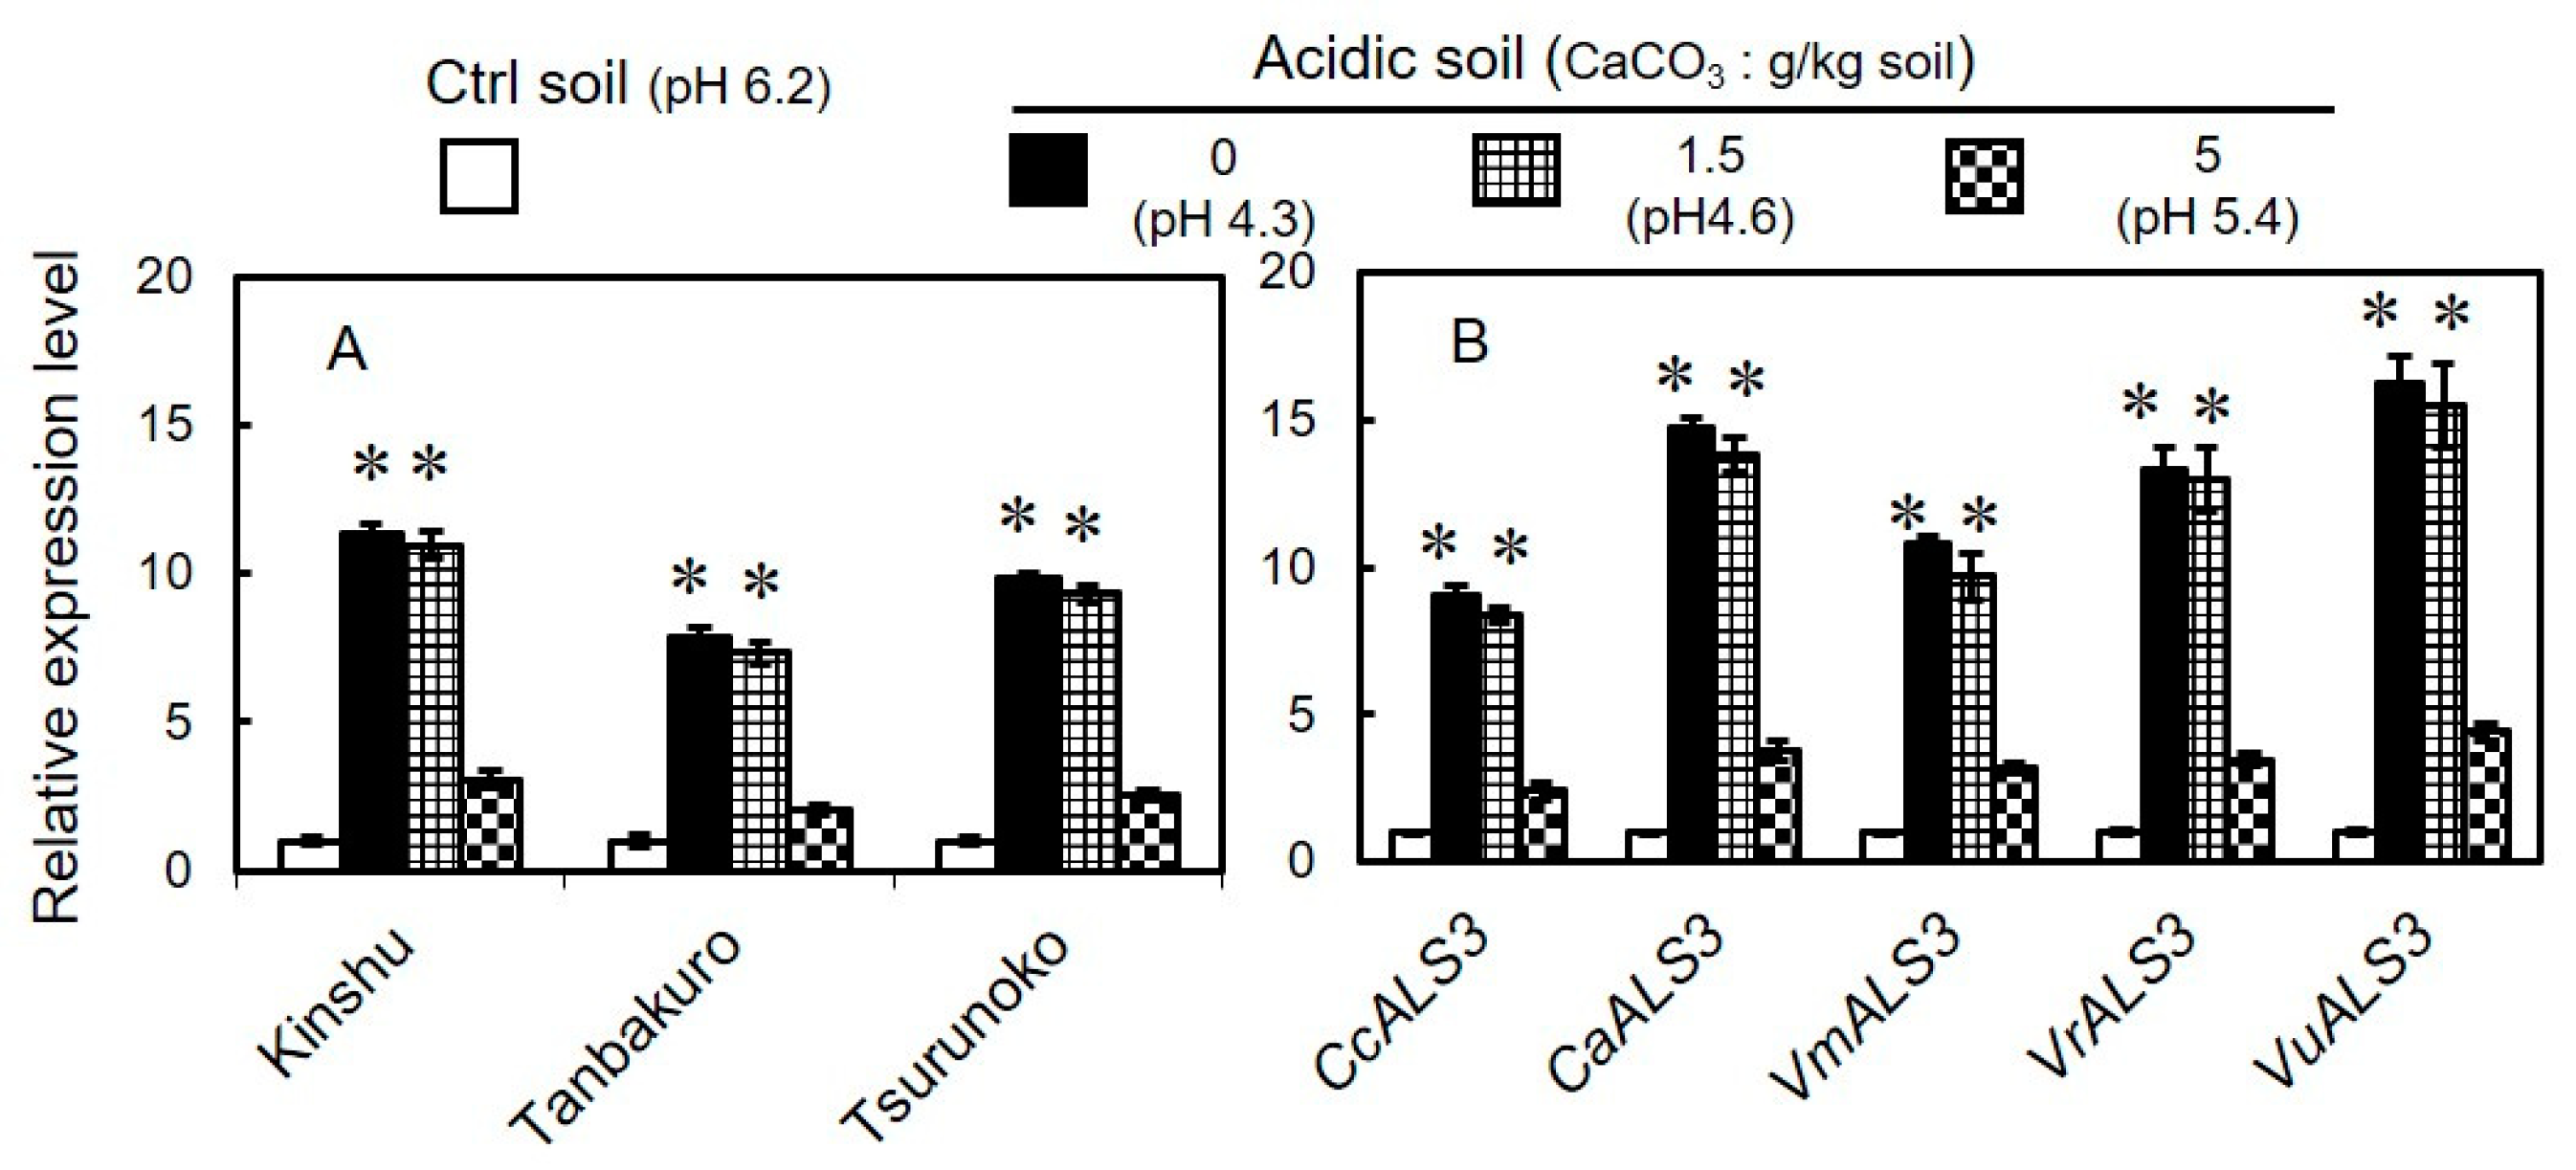
3.3. Growth and Expression Levels of GmALS3 in Soybeans Grown in Acidic Soils with Different Levels of CaCO3

We analyzed the growth recovery and expression of GmALS3 in the shoots of soybeans grown in acidic soils with different levels of CaCO3. In this study, we used two types of acidic soils: an artificial acidic soil (pH 4.3, exchangeable Al 31.2 ± 0.3) used for changing the blue color of hydrangea flowers (Al-dependent reaction) that is sold commercially in Japan and an acidic soil collected from the NE region of India (pH 4.1, exchangeable Al 54.7 ± 0.4) (Table 2). Both acidic soils contained high amounts of exchangeable Al without CaCO3, which was decreased by neutralizing the pH by addition of CaCO3 (Table 2). Toxic effects of Al in the soils were evaluated by two-week growth assay. A neutralization pH of about 4.5 did not show any recovery of growth in either acidic soil (Figure 3A,B, Figures S3 and S4; Tables S3 and S4). By contrast, the addition of CaCO3, which neutralized the pH to above 5.3, almost recovered growth in both soils (Figure 3A,B, Figures S3 and S4; Tables S3 and S4). The growth inhibition was associated with the accumulation of Al in the shoots (Figure 3C,D) and roots (Figure S5), which decreased as the application of CaCO3 increased. The accumulation of Al in the shoots derived from the high CaCO3 treatment (addition of 5 g and 6.2 g CaCO3 kg−1 soil) was significantly lower than that in shoots obtained from the low (1.5 and 2.2 g CaCO3 kg−1 soil)and no CaCO3 treatments (Figure 3C,D). Expression of GmALS3 was induced in the acidic soils, but not in the neutral pH soils. GmALS3 expression was correlated with the amount of exchangeable Al in the acidic soils. The expression level of GmALS3 was comparable in the low and no CaCO3 treatments, but it was decreased when high levels of CaCO3 were applied to both acidic soils (Figure 3E,F). These results suggest that suppression of Al toxicity by CaCO3 for soybeans grown in acidic soils can be evaluated by GmALS3 expression in the shoots.

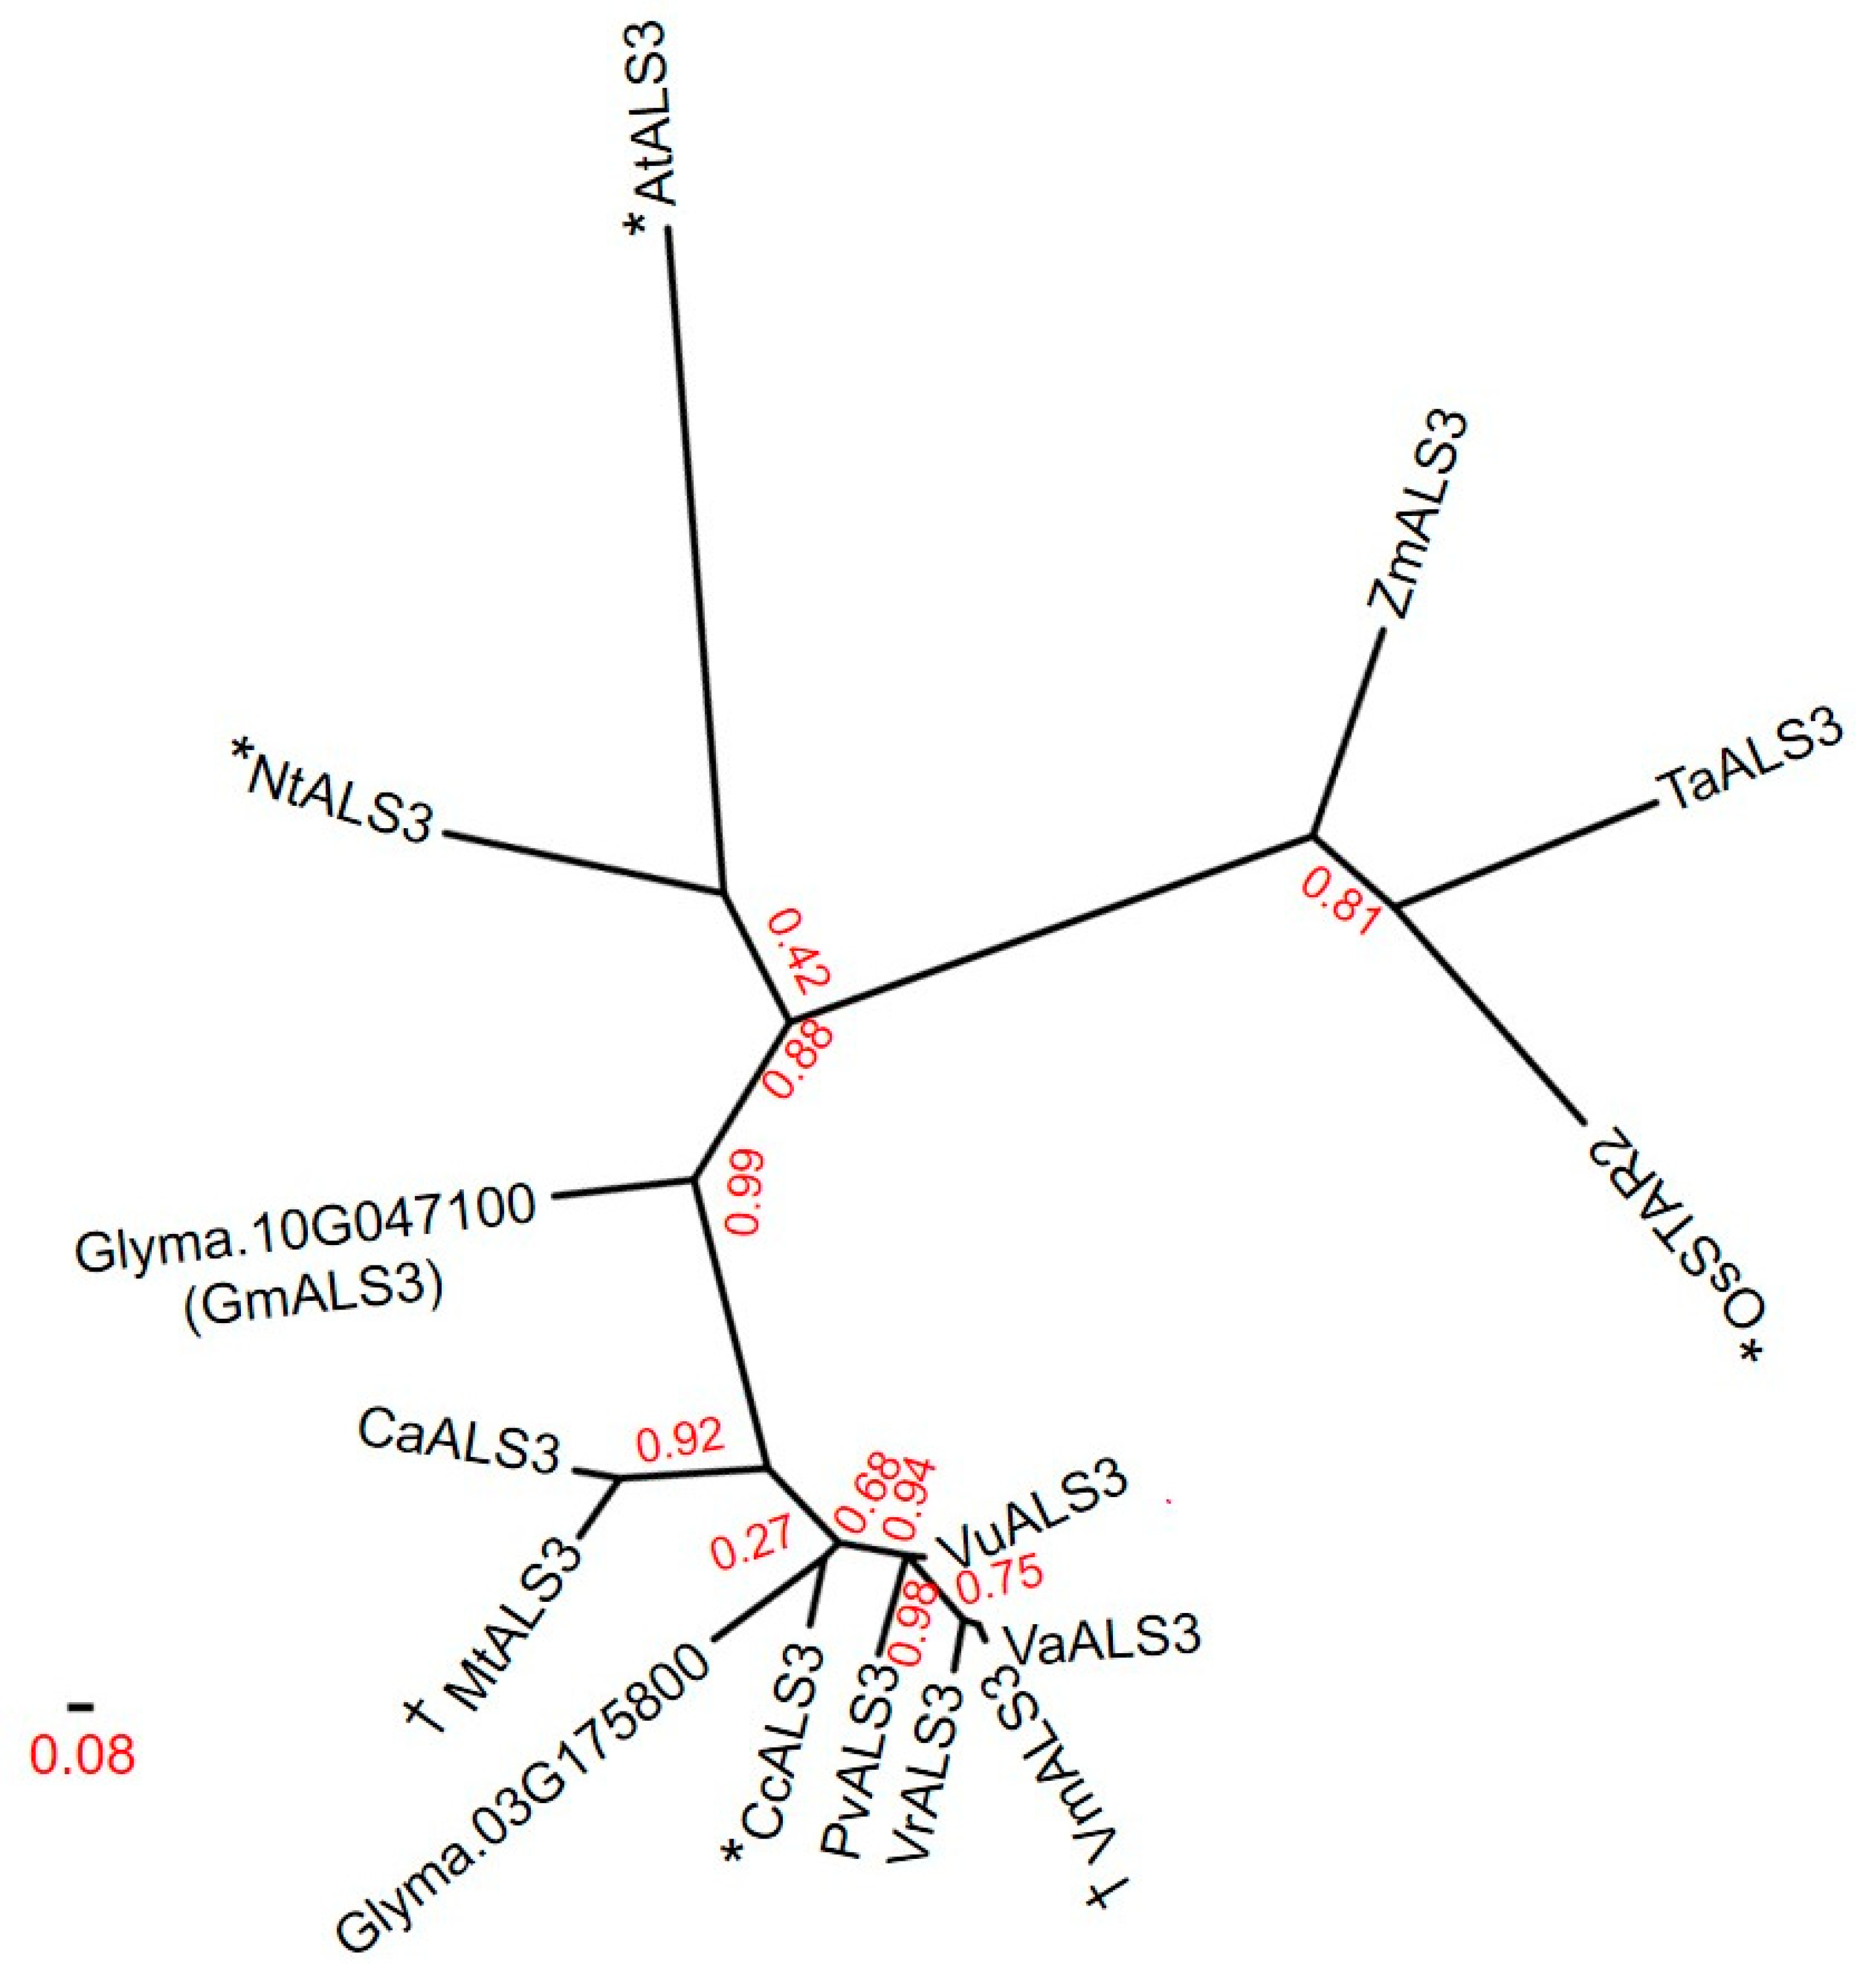
3.4. Protein Sequence and Phylogenetic Analyses for the Identification of GmALS3 Orthologs in Other Crops

To analyze the relationship between orthologous proteins from various plant species, a homology search of GmALS3 was carried out using BLASTP. The phylogeny tree contains ≥75% sequence identity with GmALS3 (Figure 4). AtALS3 was grouped with NtALS3, while GmALS3 (Glyma.10G047100) and Glyma.03G175800 were grouped with putative ALS3 proteins from other legumes. This suggests that G. max has two AtALS3 orthologs, but our wet lab studies showed that only Glyma.10G047100 was responsive to Al stress. On the other hand, OsSTAR2 was grouped with TaALS3 and ZmALS3. These findings show that the genes for ALS3 proteins are conserved in a wide range of plant species.

3.5. Expression of GmALS3 in Different Varieties of Soybeans and Its Orthologs in Other Legumes Grown in Acidic Soils

We analyzed the expression of GmALS3 in the shoots of three different varieties of soybeans (Kinshu, Tanbakuro and Tsurunoko) grown in artificial acidic soil with different levels of CaCO3 (same conditions as in Figure 3E). Relative expression levels were slightly different among varieties, but all three varieties showed suppression of GmALS3 at high levels of CaCO3 (Figure 5A). These results suggest that the expression of GmALS3 is a useful biomarker that is robust and independent among soybean genotypes.
To determine whether GmALS3 orthologs show similar Al-dependent expression in other legumes, we identified the orthologs and quantified their expression levels in five other legumes (C. cajan, C. arietinum, V. mungo, V. radiata and V. unguiculata). A BLASTP search of GmALS3 identified a single copy of the orthologue in the genome of each species (Figure 4). Expression of these orthologs was significantly induced in the shoots of each respective legume grown in acidic soils (Figure 5B). These expression levels were suppressed with high levels of application of CaCO3 (Figure 5B). These results suggest that orthologs of GmALS3 could be utilized to evaluate Al toxicity in other legumes.

4. Discussion

Recently, a number of transcriptional biomarkers have been identified in crop plants. For example, Yang et al. [22] identified a set of specific N-responsive transcriptional biomarkers in different maize genotypes grown under various N conditions, whereas Zhao et al. [49] reported a transcriptional biomarker (miR399) in citrus that can be used for managing HLB-positive (Huanglongbing; Citrus greening disease) plants suffering P starvation. In the present study, we found that an orthologue of ALS3 [32], Glyma.10G047100 (GmALS3; Table 1), is inducible in the shoots of soybeans in response to Al treatments applied to the roots (Figure 1). The expression of GmALS3 was observed to be almost specific to rhizotoxic Al treatment (Figure 2). In addition, GmALS3 expression was induced under acidic soil culture conditions and was suppressed by liming (Figure 3). Although direct transcript analyses would be expensive to adopt for agronomic purposes, our findings indicate that GmALS3 expressioncould be used as a quantitative measure of the response of soybeans to different levels of lime in acidic soils (Figure 3).
Although we detected two orthologs of AtALS3 in the soybean genome based on BLASTP searches (Table 1), we found that only GmALS3 showed Al-dependent expression in the shoot (Figure 1). The expression profiles of shoot GmALS3 in response to rhizotoxic ions (indicating a nearly specific response to Al; Figure 2) are similar to those of ALS3 in Arabidopsis and tobacco [33]. In that study, we also found that several other genes [Hydrolase (Class I glutamine amidotransferase-like superfamily protein), PGIP1 (POLYGALACTURONASEINHIBITING PROTEIN 1) and GolS3 (GALACTINOL SYNTHASE 3)] were also specifically induced by Al in the shoots of Arabidopsis. However, expressions of the orthologs of these genes were not specific to Al in soybeans (Figure 2). These results indicate that unlike other Al-responsive genes, the Al-specific expression of ALS3 orthologs is conserved, which may be attributable to the conservation of STOP1 and ALS3 in different plant species. The STOP1-regulated Al-inducible expression of ALS3 has been experimentally validated in Arabidopsis [26], tobacco [50], Eucalyptus [51] and rice [27]. In addition, ALS3 expression in the shoots has previously been demonstrated to be specific to Al and regulated by STOP1 in Arabidopsis and tobacco [33].
Several genes regulated by STOP1have been found to be upregulated in response to other exogenous factors, including low pH and P deficiency, which are typically co-excising stressors in acidic soils [52]. For example, the expression of AtALMT1, one of the major Al-tolerance genes regulated by STOP1 [53], is induced by P deficiency [54] and low pH [40]. In contrast, however, it has been reported that the expression of ALS3 in Arabidopsis and rice is not induced in response to low pH or other co-excising stressors in acidic soils [55,56]. These observations accordingly indicate that unlike other Al-tolerance genes, the expression of ALS3 is specifically induced by Al. Furthermore, on the basis of our analysis of GmALS3 in the shoots of soybeans exposed to different pH and deficiencies in different macronutrients (N, P and K), we found that the expression of GmALS3 was affected neither by pH nor by macronutrient deficiency (Figure 2 and Figure S2), indicating that GmALS3 expression is specific to Al and could be used to evaluate Al rhizotoxicity in soybeans.
When soybeans were grown in acidic soil treated with levels of liming that have been shown to eliminate soil Al3+ toxicity, we observed that the shoots showed a reduction in Al accumulation (Figure 3), which was correlated with the expression of GmALS3 and equivalent to that in the shoots of soybeans grown under control conditions (unstressed) (Figure 3). We also found that the growth and biomass of these plants were similar to those of the control plants (unstressed) (Figure 3, Figures S3 and S4; Table S3). These results clearly indicate that expression of GmALS3 in the shoots can be used as a biomarker to evaluate the ameliorative effects of lime in acidic soil. In addition, we found the expression of GmALS3 in the shoots to be robust among three genotypes of soybeans (Kinshu, Tanbakuro and Tsurunoko) grown in acidic soil (Figure 5).
We also identified genes having the highest homology with GmALS3 (≥75% sequence identity) in various legumes (Figure 4) and quantified the expression of these genes in the shoots of plants grown in acidic soils amended with levels of lime sufficient to neutralize soil acidity. Based on this analysis, we found that the expression of GmALS3 orthologs in different legumes was correlated with the level of liming in acidic soil (Figure 5). These results indicate that the expression of GmALS3 could be used to monitor the levels of soil Al toxicity in crops (at least in legumes) grown in acidic soils.

5. Conclusions

We found that GmALS3 (Glyma.10G047100) was specifically upregulated by Al in the shoot when exposed to various rhizotoxic stress treatments. In addition, GmALS3 expression was correlated with the amount of exchangeable Al in acidic soils. These results indicate that GmALS3 expression, which has been validated to be Al stress-specific, robust and highly quantitative among soybean genotypes, is generally applicable for managing soybean production in acidic soils. The demand for this type of sensitive biomarker for additional agronomic traits is widespread, and the results reported here provide a model for their continued development in crops.

Supplementary Materials

The following are available online at https://www.mdpi.com/2073-4395/10/9/1228/s1, Figure S1: Semiquantitative PCR expression of internal standards used in this study to normalize the gene of interest in qRT-PCR. Figure S2: Rhizotoxic ions effects on root growth and GmALS3 expression in soybeans. Figure S3: Soybean shoots growth inhibition in neutral and acidic soil. Figure S4: Soybean roots growth inhibition in neutral and acidic soil. Figure S5: Al content of the roots of soybean plants grown in neutral and acidic soil. Table S1: Sequence information of primers used for qRT-PCR. Table S2: Efficiency of designed primer pairs used for qRT-PCR amplification. Table S3: Changes in shoots, fresh and dry weight of soybeans grown in artificial and natural soils. Table S4: Changes in roots, fresh and dry weight of soybeans grown in artificial and natural soils.

Author Contributions

Conceptualization, R.K.A., Y.K. and H.K.; methodology, R.K.A., P.B.; validation, R.K.A., P.B.; data analysis, R.K.A.; writing—original draft preparation, R.K.A. and H.K.; writing—review and editing, H.K., Y.K. and S.K.P.; supervision, H.K. All authors have read and agreed to the published version of the manuscript.

Funding

This work was supported by the Japan Society for the Promotion of Science KAKENHI Grant Number, 18H02113.

Acknowledgments

Author RKA is thankful to the Japanese Government (Monbukagakusho: MEXT) for the scholarship. Authors RKA, YK and HKare thankful to Toshihiro Watanabe, Research Faculty of Agriculture, Hokkaido University, for the Al content experiment. Author HK is thankful to the Japan Society for the Promotion of Science KAKENHI Grant.

Conflicts of Interest

The authors declare no conflict of interest.

References

  1. Komatsuzaki, M.; Ohta, H. Soil management practices for sustainable agro-ecosystems. Sustain. Sci. 2007, 2, 103–120. [Google Scholar] [CrossRef]
  2. Kochian, L.V.; Hoekenga, O.A.; Piñeros, M.A. How do crop plants tolerate acid soils? Mechanisms of aluminum tolerance and phosphorous efficiency. Annu. Rev. Plant Biol. 2004, 55, 459–493. [Google Scholar] [CrossRef] [PubMed]
  3. Kochian, L.V.; Piñeros, M.A.; Liu, J.; Magalhaes, J.V. Plant Adaptation to Acid Soils: The Molecular Basis for Crop Aluminum Resistance. Annu. Rev. Plant Biol. 2015, 66, 571–598. [Google Scholar] [CrossRef]
  4. Khabaz-Saberi, H.; Rengel, Z. Aluminum, manganese, and iron tolerance improves performance of wheat genotypes in waterlogged acidic soils. J. Plant Nutr. Soil Sci. 2010, 173, 461–468. [Google Scholar] [CrossRef]
  5. Porter, G.S.; Bajita-Locke, J.B.; Hue, N.V.; Strand, D. Manganese Solubility and Phytotoxicity Affected by Soil Moisture, Oxygen Levels, and Green Manure Additions. Commun. Soil Sci. Plant Anal. 2004, 35, 99–116. [Google Scholar] [CrossRef]
  6. Wood, M.; Cooper, J.E.; Holding, A.J. Aluminium toxicity and nodulation of Trifolium repens. Plant Soil 1984, 78, 367–379. [Google Scholar] [CrossRef]
  7. Delhaize, E.; Ryan, P.R. Aluminum Toxicity and Tolerance in Plants. Plant Physiol. 1995, 107, 315–321. [Google Scholar] [CrossRef] [PubMed] [Green Version]
  8. Awasthi, J.P.; Saha, B.; Regon, P.; Sahoo, S.; Chowra, U.; Pradhan, A.; Roy, A.; Panda, S.K. Morpho-physiological analysis of tolerance to aluminum toxicity in rice varieties of North East India. PLoS ONE 2017, 12, e0176357. [Google Scholar] [CrossRef] [Green Version]
  9. Carvalho, M.; Van Raij, B. Calcium sulphate, phosphogypsum and calcium carbonate in the amelioration of acid subsoils for root growth. Plant Soil 1997, 192, 37–48. [Google Scholar] [CrossRef]
  10. Mora, M.L.; Schnettler, B.; Demanet, R. Effect of liming and gypsum on soil chemistry, yield, and mineral composition of ryegrass grown in an acidic Andisol. Commun. Soil Sci. Plant Anal. 1999, 30, 1251–1266. [Google Scholar] [CrossRef]
  11. Fageria, N.; Baligar, V. Chapter 7 Ameliorating Soil Acidity of Tropical Oxisols by Liming For Sustainable Crop Production. Adv. Agron. 2008, 99, 345–399. [Google Scholar] [CrossRef]
  12. Von Uexküll, H.R.; Mutert, E. Global extent, development and economic impact of acid soils. Plant Soil 1995, 171, 1–15. [Google Scholar] [CrossRef]
  13. Fageria, N.K.; Zimmermann, F.J.P.; Baligar, V. Lime and phosphorus interactions on growth and nutrient uptake by upland rice, wheat, common bean, and corn in an Oxisol. J. Plant Nutr. 1995, 18, 2519–2532. [Google Scholar] [CrossRef]
  14. Kamprath, E.J. Crop Response to Lime on Soils in the Tropics. In Soil Acidity and Liming, 2nd ed.; Adams, F., Ed.; Agronomy: Madison, WI, USA, 1984; Volume 12, pp. 349–368. [Google Scholar]
  15. Munns, D. Soil acidity and growth of a legume. III. Interaction of lime and phosphate on growth of Medicgo sativa L. in relation to aluminium toxicity and phosphate fixation. Aust. J. Agric. Res. 1965, 16, 757–766. [Google Scholar] [CrossRef]
  16. Grove, J.H.; Sumner, M.E.; Syers, J.K. Effect of Lime on Exchangeable Magnesium in Variable Surface Charge Soils. Soil Sci. Soc. Am. J. 1981, 45, 497–500. [Google Scholar] [CrossRef]
  17. Pavan, M.A.; Bingham, F.T.; Pratt, P.F. Redistribution of Exchangeable Calcium, Magnesium, and Aluminum Following Lime or Gypsum Applications to a Brazilian Oxisol. Soil Sci. Soc. Am. J. 1984, 48, 33–38. [Google Scholar] [CrossRef]
  18. Coventry, D.R.; Farhoodi, A.; Xu, R.K. Management Soil Acidification Through Crop Rotations in Southern Australia. In Handbook of Soil Acidity; Rengel, Z., Ed.; Marcel Dekker: New York, NY, USA, 2003; pp. 407–429. [Google Scholar]
  19. Yli-Halla, M. Comparison of a bioassay and three chemical methods for determination of plant-available P in cultivated soils of Finland. Agric. Food Sci. 1990, 62, 213–219. [Google Scholar] [CrossRef]
  20. Jinyang, L.; Meiqing, L.; Hanping, M.; Wenjing, Z. Diagnosis of potassium nutrition level in Solanum lycopersicum based on electrical impedance. Biosyst. Eng. 2016, 147, 130–138. [Google Scholar] [CrossRef]
  21. Muñoz-Huerta, R.F.; Ortiz-Melendez, A.D.J.; Guevara-Gonzalez, R.G.; Torres-Pacheco, I.; Herrera-Ruiz, G.; Contreras-Medina, L.M.; Prado-Olivarez, J.; Ocampo-Velazquez, R.V. An Analysis of Electrical Impedance Measurements Applied for Plant N Status Estimation in Lettuce (Lactuca sativa). Sensors 2014, 14, 11492–11503. [Google Scholar] [CrossRef] [Green Version]
  22. Yang, X.S.; Wu, J.; Ziegler, T.E.; Yang, X.; Zayed, A.; Rajani, M.S.; Zhou, D.; Basra, A.S.; Schachtman, D.P.; Peng, M.; et al. Gene Expression Biomarkers Provide Sensitive Indicators of in Planta Nitrogen Status in Maize. Plant Physiol. 2011, 157, 1841–1852. [Google Scholar] [CrossRef] [Green Version]
  23. Sadder, M.; Alsadon, A.; Wahb-Allah, M. Transcriptomic analysis of tomato lines reveals putative stress-specific biomarkers. Turk. J. Agric. For. 2014, 38, 700–715. [Google Scholar] [CrossRef]
  24. Iuchi, S.; Koyama, H.; Iuchi, A.; Kobayashi, Y.; Kitabayashi, S.; Ikka, T.; Hirayama, T.; Shinozaki, K.; Kobayashi, M.; Kobayashi, Y.; et al. Zinc finger protein STOP1 is critical for proton tolerance in Arabidopsis and coregulates a key gene in aluminum tolerance. Proc. Natl. Acad. Sci. USA 2007, 104, 9900–9905. [Google Scholar] [CrossRef] [PubMed] [Green Version]
  25. Ohyama, Y.; Ito, H.; Kobayashi, Y.; Ikka, T.; Morita, A.; Kobayashi, M.; Imaizumi, R.; Aoki, T.; Komatsu, K.; Sakata, Y.; et al. Characterization of AtSTOP1 Orthologous Genes in Tobacco and Other Plant Species. Plant Physiol. 2013, 162, 1937–1946. [Google Scholar] [CrossRef] [PubMed] [Green Version]
  26. Sawaki, Y.; Iuchi, S.; Kobayashi, Y.; Kobayashi, Y.; Ikka, T.; Sakurai, N.; Fujita, M.; Shinozaki, K.; Shibata, D.; Kobayashi, M.; et al. STOP1 Regulates Multiple Genes That Protect Arabidopsis from Proton and Aluminum Toxicities. Plant Physiol. 2009, 150, 281–294. [Google Scholar] [CrossRef] [PubMed] [Green Version]
  27. Yamaji, N.; Huang, C.-F.; Nagao, S.; Yano, M.; Sato, Y.; Nagamura, Y.; Ma, J.F. A Zinc Finger Transcription Factor ART1 Regulates Multiple Genes Implicated in Aluminum Tolerance in Rice. Plant Cell 2009, 21, 3339–3349. [Google Scholar] [CrossRef] [Green Version]
  28. Daspute, A.A.; Kobayashi, Y.; Panda, S.K.; Fakrudin, B.; Kobayashi, Y.; Tokizawa, M.; Iuchi, S.; Choudhary, A.K.; Yamamoto, Y.Y.; Koyama, H. Characterization of CcSTOP1; a C2H2-type transcription factor regulates Al tolerance gene in pigeonpea. Planta 2018, 247, 201–214. [Google Scholar] [CrossRef]
  29. Zhou, Y.; Yang, Z.; Gong, L.; Liu, R.; Sun, H.; You, J. Molecular characterization of GmSTOP1 homologs in soybean under Al and proton stress. Plant Soil 2018, 427, 213–230. [Google Scholar] [CrossRef]
  30. Fan, W.; Lou, H.Q.; Gong, Y.L.; Liu, M.Y.; Cao, M.J.; Liu, Y.; Yang, J.L.; Zheng, S.J. Characterization of an inducible C2H2-type zinc finger transcription factor VuSTOP1 in rice bean (Vigna umbellata) reveals differential regulation between low pH and aluminum tolerance mechanisms. New Phytol. 2015, 208, 456–468. [Google Scholar] [CrossRef]
  31. Wang, J.; Hou, Q.; Li, P.; Yang, L.; Sun, X.; Benedito, V.A.; Wen, J.; Chen, B.; Mysore, K.S.; Zhao, J. Diverse functions of multidrug and toxin extrusion (MATE) transporters in citric acid efflux and metal homeostasis inMedicago truncatula. Plant J. 2017, 90, 79–95. [Google Scholar] [CrossRef] [Green Version]
  32. Larsen, P.B.; Geisler, M.; Jones, C.A.; Williams, K.M.; Cancel, J.D. ALS3 encodes a phloem-localized ABC transporter-like protein that is required for aluminum tolerance in Arabidopsis. Plant J. 2005, 41, 353–363. [Google Scholar] [CrossRef]
  33. Sawaki, K.; Sawaki, Y.; Zhao, C.-R.; Kobayashi, Y.; Koyama, H. Specific transcriptomic response in the shoots of Arabidopsis thaliana after exposure to Al rhizotoxicity: Potential gene expression biomarkers for evaluating Al toxicity in soils. Plant Soil 2016, 409, 131–142. [Google Scholar] [CrossRef]
  34. Abdeljalil, S.; Borgi, I.; Carvalho, S.; Jmal-Hammami, L.; Gargouri, A. Molecular and bioinformatics analyses reveal two differentially expressed intracellular GH1 β-glucosidases from the rare alkalophilic fungus Stachybotrys microspora. Gene 2019, 703, 134–144. [Google Scholar] [CrossRef] [PubMed]
  35. Fujiwara, T.; Hirai, M.Y.; Chino, M.; Komeda, Y.; Naito, S. Effects of Sulfur Nutrition on Expression of the Soybean Seed Storage Protein Genes in Transgenic Petunia. Plant Physiol. 1992, 99, 263–268. [Google Scholar] [CrossRef] [PubMed]
  36. Kobayashi, Y.; Watanabe, T.; Shaff, J.E.; Ohta, H.; Kochian, L.V.; Wagatsuma, T.; Kinraide, T.B.; Koyama, H.; Kobayashi, Y.; Kobayashi, Y. Molecular and Physiological Analysis of Al3+ and H+ Rhizotoxicities at Moderately Acidic Conditions. Plant Physiol. 2013, 163, 180–192. [Google Scholar] [CrossRef] [PubMed] [Green Version]
  37. Koyama, H.; Kawamura, A.; Kihara, T.; Hara, T.; Takita, E.; Shibata, D. Overexpression of mitochondrial citrate synthase in Arabidopsis thaliana improved growth on a phosphorus-limited soil. Plant Cell Physiol. 2000, 41, 1030–1037. [Google Scholar] [CrossRef]
  38. Bustin, S.A.; Benes, V.; Garson, J.; Hellemans, J.; Huggett, J.F.; Kubista, M.; Mueller, R.; Nolan, T.; Pfaffl, M.W.; Shipley, G.L.; et al. The MIQE Guidelines: Minimum Information for Publication of Quantitative Real-Time PCR Experiments. Clin. Chem. 2009, 55, 611–622. [Google Scholar] [CrossRef] [Green Version]
  39. Kobayashi, Y.; Hoekenga, O.A.; Itoh, H.; Nakashima, M.; Saito, S.; Shaff, J.E.; Maron, L.G.; Piñeros, M.A.; Kochian, L.V.; Koyama, H. Characterization of AtALMT1 Expression in Aluminum-Inducible Malate Release and Its Role for Rhizotoxic Stress Tolerance in Arabidopsis. Plant Physiol. 2007, 145, 843–852. [Google Scholar] [CrossRef] [Green Version]
  40. Kobayashi, Y.; Ohyama, Y.; Kobayashi, Y.; Ito, H.; Iuchi, S.; Fujita, M.; Zhao, C.-R.; Tanveer, T.; Ganesan, M.; Kobayashi, M.; et al. STOP2 Activates Transcription of Several Genes for Al- and Low pH-Tolerance that Are Regulated by STOP1 in Arabidopsis. Mol. Plant 2014, 7, 311–322. [Google Scholar] [CrossRef] [Green Version]
  41. Yim, A.K.-Y.; Wong, J.W.-H.; Ku, Y.-S.; Qin, H.; Chan, T.F.; Lam, H.-M. Using RNA-Seq Data to Evaluate Reference Genes Suitable for Gene Expression Studies in Soybean. PLoS ONE 2015, 10, e0136343. [Google Scholar] [CrossRef] [Green Version]
  42. Garg, R.; Sahoo, A.; Tyagi, A.K.; Jain, M. Validation of internal control genes for quantitative gene expression studies in chickpea (Cicer arietinum L.). Biochem. Biophys. Res. Commun. 2010, 396, 283–288. [Google Scholar] [CrossRef]
  43. Kundu, A.; Patel, A.; Pal, A. Defining reference genes for qPCR normalization to study biotic and abiotic stress responses in Vigna mungo. Plant Cell Rep. 2013, 32, 1647–1658. [Google Scholar] [CrossRef] [PubMed]
  44. Liu, C.; Fan, B.; Cao, Z.; Su, Q.; Wang, Y.; Zhang, Z.; Wu, J.; Tian, J. A deep sequencing analysis of transcriptomes and the development of EST-SSR markers in mungbean (Vigna radiata). J. Genet. 2016, 95, 527–535. [Google Scholar] [CrossRef] [PubMed]
  45. Amorim, L.L.B.; Ferreira-Neto, J.R.C.; Bezerra-Neto, J.P.; Pandolfi, V.; de Araújo, F.T.; da Silva Matos, M.K.; Santos, M.G.; Kido, E.A.; Benko-Iseppon, A.M. Cowpea and abiotic stresses: Identification of reference genes for transcriptional profiling by qPCR. Plant Methods 2018, 14, 88. [Google Scholar] [CrossRef] [PubMed] [Green Version]
  46. Sadhukhan, A.; Enomoto, T.; Kobayashi, Y.; Watanabe, T.; Iuchi, S.; Kobayashi, M.; Sahoo, L.; Yamamoto, Y.Y.; Koyama, H. Sensitive to Proton Rhizotoxicity1 Regulates Salt and Drought Tolerance of Arabidopsis thaliana through Transcriptional Regulation of CIPK23. Plant Cell Physiol. 2019, 60, 2113–2126. [Google Scholar] [CrossRef]
  47. Watanabe, T.; Urayama, M.; Shinano, T.; Okada, R.; Osaki, M. Application of ionomics to plant and soil in fields under long-term fertilizer trials. SpringerPlus 2015, 4, 1–13. [Google Scholar] [CrossRef]
  48. Qin, L.; Han, P.; Chen, L.; Walk, T.C.; Li, Y.; Hu, X.; Xie, L.; Liao, H.; Liao, X. Genome-Wide Identification and Expression Analysis of NRAMP Family Genes in Soybean (Glycine Max L.). Front. Plant Sci. 2017, 8, 1436. [Google Scholar] [CrossRef] [Green Version]
  49. Zhao, H.; Sun, R.; Albrecht, U.; Padmanabhan, C.; Wang, A.; Coffey, M.D.; Girke, T.; Wang, Z.; Close, T.J.; Roose, M.; et al. Small RNA Profiling Reveals Phosphorus Deficiency as a Contributing Factor in Symptom Expression for Citrus Huanglongbing Disease. Mol. Plant 2013, 6, 301–310. [Google Scholar] [CrossRef] [Green Version]
  50. Ito, H.; Kobayashi, Y.; Yamamoto, Y.Y.; Koyama, H. Characterization of NtSTOP1-regulating genes in tobacco under aluminum stress. Soil Sci. Plant Nutr. 2019, 65, 251–258. [Google Scholar] [CrossRef]
  51. Sawaki, Y.; Kobayashi, Y.; Kihara-Doi, T.; Nishikubo, N.; Kawazu, T.; Kobayashi, M.; Kobayashi, Y.; Iuchi, S.; Koyama, H.; Sato, S. Identification of a STOP1-like protein in Eucalyptus that regulates transcription of Al tolerance genes. Plant Sci. 2014, 223, 8–15. [Google Scholar] [CrossRef]
  52. Liang, C.; Piñeros, M.A.; Tian, J.; Yao, Z.; Sun, L.; Liu, J.; Shaff, J.; Coluccio, A.; Kochian, L.V.; Liao, H. Low pH, Aluminum, and Phosphorus Coordinately Regulate Malate Exudation through GmALMT1 to Improve Soybean Adaptation to Acid Soils. Plant Physiol. 2013, 161, 1347–1361. [Google Scholar] [CrossRef] [Green Version]
  53. Tokizawa, M.; Kobayashi, Y.; Saito, T.; Kobayashi, M.; Iuchi, S.; Nomoto, M.; Tada, Y.; Yamamoto, Y.Y.; Koyama, H. Sensitive to proton rhizotoxicity1, calmodulin binding transcription activator2, and other transcription factors are involved in aluminum-activated malate transporter1 expression. Plant Physiol. 2015, 167, 991–1003. [Google Scholar] [CrossRef] [PubMed] [Green Version]
  54. Balzergue, C.; Dartevelle, T.; Godon, C.; Laugier, E.; Meisrimler, C.-N.; Teulon, J.-M.; Creff, A.; Bissler, M.; Brouchoud, C.; Hagège, A.; et al. Low phosphate activates STOP1-ALMT1 to rapidly inhibit root cell elongation. Nat. Commun. 2017, 8, 15300. [Google Scholar] [CrossRef] [PubMed] [Green Version]
  55. Kobayashi, Y.; Kobayashi, Y.; Sugimoto, M.; Lakshmanan, V.; Iuchi, S.; Kobayashi, M.; Bais, H.P.; Koyama, H. Characterization of the Complex Regulation of AtALMT1 Expression in Response to Phytohormones and Other Inducers. Plant Physiol. 2013, 162, 732–740. [Google Scholar] [CrossRef] [PubMed] [Green Version]
  56. Huang, C.-F.; Yamaji, N.; Mitani, N.; Yano, M.; Nagamura, Y.; Ma, J.F. A Bacterial-Type ABC Transporter Is Involved in Aluminum Tolerance in Rice. Plant Cell 2009, 21, 655–667. [Google Scholar] [CrossRef] [PubMed] [Green Version]
Figure 1. Expression of AtALS3 orthologs in soybeans. Plants were pregrown for 10 and then transferred to –Al (0 µM AlCl3, pH 4.5 and 6.0) or Al-rhizotoxic (AlCl3, 25, 50 or 100-µM (pH 4.5)) solutions. (A) Expression levels of Glyma.10G047100 (GmALS3) and Glyma.03G175800 in the shoots were quantified after 24 h exposure of the roots to the Al-rhizotoxic or –Al (pH 4.5 and 6.0) solutions, asterisks indicate significant differences compare to –Al at pH 4.5 (Student’s t-test, p < 0.05); (B) expression level of Glyma.10G047100 (GmALS3) in the shoots of soybeans after exposure of the roots to Al-rhizotoxic solutions containing 50 μM of AlCl3 (pH 4.5) at various time points, asterisks indicate significant differences compare to 0 h (Student’s t-test, p < 0.05). Expression level quantified using qRT-PCR using GmUBQ10 as an internal standard. Values are mean ±SE (n = 3).
Agronomy 10 01228 g001
Figure 2. Specificity of the GmALS3 (Glyma.10G047100) in response to Al rhizotoxicity in soybeans. (A) Expression of GmALS3 in the shoots of 10-day-old pregrown soybean plants after exposure of the roots to without rhizotoxic ions (0 µM Al, Cd, Cu or NaCl; pH 4.5 or 6.0) or with various rhizotoxic (50 µM AlCl3, 25 µM CdCl2, 10 µM CuSO4 and 75 mM NaCl; pH 4.5; concentrations used in the root growth inhibition study; Figure S2A) solutions for 24 h; (B) GmALS3 expression along with nutrient-responsive marker genes (GmNRAMP1a, GmNRAMP1b and GmNRAMP2b) in the shoots of 10-day-old pregrown soybean plants after exposure of the roots to nutrient solution with deficiencies in nitrate (-N), potassium (-K) or phosphate (-P) for 24 h (pH 6.0); (C) expression of other genes [orthologs of specifically Al-inducible genes in Arabidopsis; Glyma.13G044600 (orthologue of Hydrolase; AT5G38200), Glyma.05G124000 (orthologue of PGIP1; AT5G06860), Glyma.03G222000 (orthologue of GolS3; AT1G09350)] in the shoots of 10-day-old pregrown soybean plants after exposure of the roots to without rhizotoxic ions (0 µM Al, Cd, Cu and NaCl; pH 4.5 or 6.0) or with various rhizotoxic (50-µM AlCl3, 25-µM CdCl2, 10-µM CuSO4 and 75 mM; pH 4.5) solutions for 24 h. Expression levels quantified using qRT-PCR. UBQ10 was used as an internal standard. Data are presented as the means ± SE (n = 3).Asterisks indicate a significant difference (Student’s t-test, p < 0.05) from without rhizotoxic ions (pH 4.5) in panels (A) and (C) and control nutrient solution in panel (B).
Agronomy 10 01228 g002
Figure 3. Growth and expression levels of GmALS3 in soybeans grown in artificial and natural soils with different levels of CaCO3. Plants were grown for two weeks in neutral soil (addition of 2 g CaCO3 g/kg soil) as a control and in acidic soil with the addition of different levels of CaCO3 (0, 1.5 and 5 g/kg soil for artificial acidic soil; 0, 2.2 and 6.2 g/kg soil for natural acidic soil) as a treatment; (A) Relative shoot elongation of soybeans grown in artificial soils; (B) relative shoot elongation of soybeans grown in natural soils; (C) Al content of in the shoots of soybeans grown in artificial soils; (D) Al content in the shoots of soybeans grown in natural soils; (E)expression of GmALS3 (Glyma.10G047100) in the shoots of soybeans grown in artificial soils; (F) expression of GmALS3 (Glyma.10G047100) in the shoots of soybeans grown in natural soils. Al concentration in the shoot was quantified using ICP-MS. Expression levels quantified using qRT-PCR. GmUBQ10 was used as an internal standard. Data given as mean and ± SE (n = 3).Asterisks indicate a significant difference (Student’s t-test p < 0.05) compared to control soil.
Agronomy 10 01228 g003
Figure 4. Protein sequences having ≥75% sequence identity with GmALS3. A phylogenetic tree was generated using Phylogeny.fr. Branch-support values were calculated using the bootstrapping procedure indicated in red. The tree was constructed from a sequence alignment of the following proteins: Arabidopsis thaliana AtALS3 (GenBank: OAP08021), Nicotiana tabacum NtALS3 (GenBank: 107801961), Oryza sativa OsSTAR2 (ALS3) (GenBank: 4337635), Triticum estivum TaALS3 (Phytozome: Tres_1DS_8CA54B2AF), Glycine max Glyma.10G047100 (Phytozome: Glyma.10G047100), Glycine max Glyma.03G175800 (Phytozome: Glyma.03G175800), Cicer arietinum CaALS3(Phytozome: Ca_11996), Medicago truncatula MtALS3 (GenBank: 11431871), Cajanus cajan CcALS3 (GenBank: AWI62593), Phaseolus vulgaris PvALS3 (Phytozome: Phvul.001G172900), Vigna angularis VaALS3 (GenBank: 108328314), Vigna mungo VmALS3 (GenBank: ALX81167), Vigna radiate VrALS3 (GenBank: 106757328), Zea mays ZmALS3 (Phytozome: GRMZM2G053991) and Vigna unguiculata VuALS3 (Phytozome: Vigun01g155100). * Indicates that the proteins have previously been reported as having Al tolerance regulated by STOP1 under Al stress, Indicates that the proteins were previously reported to be inducible under Al stress.
Agronomy 10 01228 g004
Figure 5. Expression level of GmALS3 in soybean varieties and its orthologs in other legumes grown in Al-toxic and nontoxic soils. (A) GmALS3 expression levels were quantified in the shoots of three soybean genotypes (Kinshu, Tanbakuro and Tsurunoko) grown in artificial soils; (B) expression level of GmALS3 orthologs in the shoot of various legumes (Cajanus cajan, Cicer arietinum, Vigna mungo, Vigna radiata and Vigna unguiculata) grown in artificial soils. Plants were grown for two weeks in neutral soil (addition of CaCO3 2 g/kg soil) as a control and in acidic soil with addition of different levels of CaCO3 (0, 1.5 and 5 g/kg soil) as a treatment. Expression level quantified by qRT-PCR. GmUBQ10 and Actin (for other legumes) were used as an internal standard. Data given as mean and ± SE (n = 3). Asterisks indicate significant differences (Student’s t-test, p < 0.05) compared to control soil.
Agronomy 10 01228 g005
Table 1. AtALS3 orthologs in soybeans.
Peptide Sequence ID Score §E-Value SequenceDescription
Similarity Identity ±
Glyma.10G047100428.76.2 × 10−15190.177.94Putative ABC transport system permease protein
Glyma.03G175800413.77.7 × 10−14589.774.26Putative ABC transport system permease protein
peptide sequence ID, § BLAST score, expected value (E), sequence similarity, descriptions were retrieved from the Phytozome-12 database and ± sequence identity was analyzed by Clustal Omega.
Table 2. Effect of CaCO3 supply on pH and exchangeable Al in artificial and natural soils
Soil TypeSoil ConditionCaCO3
(g kg−1 soil)
Soil pH
(H2O)
Exchangeable Al
(meqkg−1 soil)
Neutral soil26.23 ± 0.5
ArtificialAcidic soil04.331.2 ± 0.3
Acidic soil1.54.627.5 ± 0.1
Acidic soil55.48.4 ± 0.6
Neutral soil26.55.2 ± 0.2
FieldAcidic soil04.154.7 ± 0.4
(natural)Acidic soil2.24.448.9 ± 0.7
Acidic soil6.25.313.5 ± 0.1

