Article

Specific Adsorption of Heavy Metals in Soils: Individual and Competitive Experiments

by
Claudia Campillo-Cora
1,2,
Manuel Conde-Cid
1,2,
Manuel Arias-Estévez
1,2,
David Fernández-Calviño
1,2,* and
Flora Alonso-Vega
1,2
1
Soil Science and Agricultural Chemistry, Faculty of Sciences, University of Vigo, 32004 Ourense, Spain
2
CITACA-Agri-Food Research and Transfer Cluster, Campus Auga, University of Vigo, 32004 Ourense, Spain
*
Author to whom correspondence should be addressed.
Agronomy 2020, 10(8), 1113; https://doi.org/10.3390/agronomy10081113
Submission received: 12 July 2020 / Revised: 28 July 2020 / Accepted: 30 July 2020 / Published: 1 August 2020

Abstract

:
The partitioning between the soil solid phase and the soil solution determines the mobility of pollutants like heavy metals. If nonspecific sorption takes place, the reactions are easily reversible and heavy metals are released to soil solution increasing the probability of leaching through soil profile. Mobility and leaching are also favoured if other metals are in the system and competition for specific adsorption sites takes place. In this study, desorption equilibrium experiments were conducted after adsorption ones. The specific adsorption was evaluated through the amounts of the still adsorbed Cu, Pb, Cr, Ni and Zn after desorption experiments in ten different soils. In addition, competition adsorption and desorption binary experiments were conducted for evaluating the metal competition in three of the soils. Pb and Cu are the metals adsorbed and retained in higher amounts in all the studied soils. In slightly neutral soils, Cr is retained in lesser amounts while in acidic soils Zn is the metal less retained. Results showed that despite the high and variable amounts of organic matter in the soils, soil pH is the most important variable in neutral soils. In acidic soils, soil properties different than pH play important roles and specific sorption of Pb is related to the cationic exchange capacity of the soils while that of Zn to the clay content. Instead, the release of Cu during desorption experiments is probably due to the more soluble organic fraction of the soils. The individual retention of Cu, Zn, Ni and Pb is higher than when they are in competition, except if Cr is present. In this case, the amount of those four metals and that of Cr increased. Therefore, the presence of Cr together with cationic heavy metals favoured the adsorption of those metals in multi-metal polluted areas. Specific adsorption is also important during competition as soil affinities increase during competition experiments.

1. Introduction

Soils play a very important role in the environment as, among other important functions, they control the mobility of pollutants like heavy metals mainly through sorption process directly related to the partitioning between the solid phase and soil solution [1,2].
Mobility of heavy metals in soils is of special concern as although some of them can play important roles in biological processes, when concentrations are above certain thresholds mainly due to anthropogenic sources, all can pose significant risks to ecological receptors and human health ([3,4,5,6] or contaminate groundwater by leaching [7].
Although several environmental factors influence the soil capacities for adsorbing heavy metals, colloidal soil constituents are the final agents determining soils act as sinks or sources of contamination. In addition, factors like soil pH, dissolved organic matter, ionic strength or the nature and number of different metals present also influence the extent of the adsorption capacity of soils [5,8,9,10,11,12]. The mineral and organic colloidal particles of the solid phase are the most active soil components in the adsorption processes [3,5,13,14,15,16] nevertheless, their high heterogeneity and variability among soils makes their exact role during heavy metal adsorption remains not clearly understood.
Soil adsorption capacities are commonly studied through experimental conditions designed to achieved equilibrium between soil solid and soil solution phase [1,17], providing information on the soil affinities and therefore on the potential mobility of metal in concern. Although the adsorption or desorption curve does not provide automatically information about the reactions involved in the sorption phenomenon [18] different tools and models such as Freundlich or Langmuir are used to estimate the adsorption and desorption capacities that are later mainly statistically related to routinely analysed soil constituents and properties.
Heavy metals from soil solution react with soil constituents by different mechanisms [4] such as truly adsorption, surface precipitation or fixation [3]. Surface precipitation and fixation are three-dimensional processes where new solid phase or diffusion in an already existing phase occur, respectively. Instead, adsorption is the two-dimensional accumulation of matter after the interactions between solid and solute phases [3]. If the reactions are selective and low reversible the complexes formed are identified as of inner-sphere and it is recognised as specific adsorption while if rather weak and less selective (nonspecific adsorption) they are outer-sphere complexes formed mainly through ion exchange process [3,19].
Among the mechanisms explaining soil adsorption affinities, the nonspecific metal sorption is considered the main responsible for the easily reversible reactions in soils [14] and if weakly adsorbed, heavy metals are susceptible to leaching increasing their potential mobility in the soil profile [20]. If desorption experiments are conducted after adsorption ones, the potential released metal concentration can be used for investigating the strength of bonding between metals still adsorbed and soil [21]. Considering the still adsorbed metal after desorption experiments stronger bound it can be assimilated as specific sorption [19] and the released concentration during desorption experiments as nonspecific sorbed as it was weaker bound.
Moreover, if competition among metals for the same available adsorption sites takes place, the mobility or environmental availability can be enhanced [1,4,5,17,22]. As a result, competition experiments between two or more metals is important for understanding their relativity affinity of soil as sorbent as in soils many elements are present and compete for the surface sites [19].
In the current work, single and multi solutions of Cu, Zn, Ni, Pb and Cr were added to ten different soils for estimating, based on equilibrium experimental conditions, their single and competitive sorption capacities. The selected soils present high and variable amounts of organic matter, but also other variable characteristics like soil pH and clay content. Therefore, we hypothesize that the specific adsorption of Cr, Cu, Ni, Pb and Zn will be dependent of soil organic matter but also of other characteristics. Also, we hypothesize that the studied heavy metals will compete for adsorption sites reducing the specific adsorption of other metals. The goals of the present study were (1) to estimate the sorption capacities of Cu, Zn, Ni, Pb and Cr of ten soils with different properties, (2) to evaluate the specific adsorption of the still adsorbed metals and the reversibility of the adsorption after desorption experiments and (3) to study the influence of competing ions when binary solutions are added to selected soils.

2. Material and Methods

2.1. Soil Sampling and Soil Analysis

Ten soil samples that cover wide ranges of pH, organic matter and clay contents, were sampled from surface horizons (0–20 cm) in natural areas of Galicia (NW Iberian Peninsula) using an Edelman auger. Sampling was performed in areas were no agronomic practices are developed. The samples were dried at lab temperature and sieved through 2 mm mesh sieve and stored prior to further analysis. Soil pH (pHw) was measured after 10 min contact time of soil:distilled water (1:2.5 ratio) and potential soil pH (pHKCl) after 2 h contact time of soil and concentrated KCl (1:2.5 ratio) by using a combined glass electrode (model 2001, Crison, Barcelona, Spain) [23]. Organic matter content was estimated after loss on ignition during 3 h at 550 °C [24]. Total C (TC) and N (TN) were quantified by elemental analysis (LECO CHN-1000, LECO Corporation, St. Joseph, MI, USA) after pulverizing soil samples. A 1:5 soil:water suspension was prepared for measuring DOC, the suspension was centrifuged during 25 min at 4000 rpm (2665× g) using a Rotina 35R (Hettich Zentrifugen, Tuttingen, Germany). After filtration, DOC was determined using a Total Carbon Analyser Multi N/C 2100 (Mettler Toledo, OH, USA). The effective cation exchange capacity (eCEC) was estimated as the sum of the exchangeable basic cations (Nae, Ke, Cae and Mge), after displacement with 0.2 M NH4Cl [25], and of exchangeable aluminium (Ale), obtained by displacement with 1 M KCl [26]. Na and K were quantified by atomic emission spectroscopy and Ca, Mg and Al by atomic absorption spectroscopy (Thermo Solaar AA, Thermo, MA, USA). The eCEC of the soils was calculated by summing the amount of charge of these cations. Regarding texture, the percentages of sand (2–0.05 mm), silt (0.05–0.002 mm) and clay (<0.002 mm) in the inorganic fraction of the soils were calculated after wet sieving and the pipette method [23].

2.2. Single Adsorption and Desorption Experiments

Different metal solutions of Cu(NO3)2·3H2O, Ni(NO3)2·6H2O, Pb(NO3)2, Zn(NO3)2·6H2O, or K2Cr2O7 (0, 6.25, 12.5, 25, 50, 75, 100 and 200 mg L−1) with NaNO3 (0.01 M) as background electrolyte [27] were prepared for conducting adsorption experiments. Batch method was used and three replicates of each soil sample and metal-concentration solution were suspended (1:10 w/v) in propylene bottles and gently shaken for 24 h in a rotatory shaker. Afterwards, they were centrifuged for 15 min at 4000 rpm (2665× g) using a Rotina 35R (Hettich Zentrifugen, Tuttingen, Germany) and filtered with acid washed paper. The pH of the adsorption equilibrium solution was registered using a combined glass electrode (model 2001, Crison, Barcelona, Spain) and the total metal concentrations in the extract were determined by flame atomic absorption spectrophotometry (AAnalyst 200, PerkinElmer, Boston, MA, USA). Metal adsorbed amount (mg kg−1) was calculated by subtracting the metal concentration in the equilibrium solution from that of the added solution.
Once filtered, the weight of the humid soil sample was registered and desorption experiments were performed adding 10 mL of background solution to the humid sample. These suspensions were shaken, centrifuged, filtered and analysed in the same way as in the adsorption experiments. The metal retained in soils (the one kept adsorbed after desorption experiments) was calculated after subtracting the released metal concentration from the previously adsorbed. The amount of metal still adsorbed (retained) was calculated as the difference between the initially adsorbed and the corresponding desorbed amount. All these analyses were performed in triplicate.

2.3. Competitive Adsorption and Desorption Experiments

The second adsorption experiment was conducted with three soil samples (S1, S6 and S7 in Table 1) as they differ in soil pH and TC and clay contents. Pair metal solutions (Cu(NO3)2·3H2O + Ni(NO3)2·6H2O, Cu(NO3)2·3H2O + Pb(NO3)2, Cu(NO3)2·3H2O + Zn(NO3)2·6H2O, Cu(NO3)2·3H2O + K2Cr2O7, Ni(NO3)2·6H2O + Pb(NO3)2, Ni(NO3)2·6H2O + Zn(NO3)2·6H2O, Ni(NO3)2·6H2O + K2Cr2O7, Pb(NO3)2 + Zn(NO3)2·6H2O, Pb(NO3)2 + K2Cr2O7 and Zn(NO3)2·6H2O + K2Cr2O7) were prepared and in each one, the concentration of each metal was equal to that of single adsorption experiments (0, 6.25, 12.5, 25, 50, 75, 100 and 200 mg L−1). The procedure is already described in Section 2.2. All the analyses were performed in triplicate.

2.4. Data Analysis and Statistical Treatment

Experimental data corresponding to adsorption and desorption from single and competitive experiments were adjusted to the Freundlich (Equation (1)) and Langmuir (Equation (2)) models:
Q = KF Cn
Q = (KL C β)/(1 + KL C)
where Q is the amount adsorbed of metal (after adsorption experiments, mg kg−1) or the amount of metal still adsorbed (retained after desorption experiments, mg kg−1); C is the concentration of metal at equilibrium solution (after adsorption or desorption experiments, mg L−1); n is the Freundlich’s linearity index (dimensionless); KF is the Freundlich’s affinity coefficient (Ln mg1−n kg−1) or the partition coefficient (if n ≈ 1) (L kg−1); KL is the Langmuir’s constant referred to adsorption energy (L mg−1); and β is the maximum sorption capacity of the soil (mg kg−1).
Competitive adsorption data was also described with the Murali–Aylmore model (Equations (3) and (4)) [28]:
Q 1 = K F 1 C 1 n 1 + 1 C 1 + a 12 C 2
Q 2 = K F 2 C 2 n 2 + 1 C 2 + a 21 C 1
where Q1 and Q2 (mg kg−1) and C1 and C2 (mg L−1) are the concentration of the two species in the soil and in the solution at equilibrium, respectively; KF1 and KF2 (Ln mg1−n kg−1) and n (dimensionless) are the Freundlich parameters for the adsorption of the species 1 and 2 in the absence of competitors; and a12 and a21 are additional parameters that account for competition between the two species.
All statistical analyses were performed using Microsoft excell or IBM SPSS (Statistical Package for the Social Sciences) Statistics software. Average and standard deviation of adsorption and desorption experiments were performed with Excell. The sorption and desorption data were fitted to the Freundlich, Langmuir and Murali–Aylmore model equations through non-linear regression analysis of SPSS. Pearson correlation and principal component analysis were also performed using SPSS software.

3. Results and Discussion

3.1. Soil Properties

Table 1 shows the main physicochemical properties of the studied soils. The pHw of the soils ranges from 4.0 (S1) to 7.5 (S7) covering a wide range of soil pH values. Both soils have also the lowest and highest pHKCl values (3.0 and 6.9, respectively). Organic matter contents range from 10% (S8) to 29% (S10) and TC contents from 3.7% (S4) to 14.3% (S10). Soil samples S9 and S10 are those with the highest proportions of organic matter and C contents but also N contents (Table 1). S2 and S1 presented the highest values for Dissolved Organic Carbon (139.6 and 123.7 mg·kg−1, respectively), while the lowest value was determined for S4: 27.9 mg·kg−1. According to eCEC measurements, soil samples range from 1.9 cmolc kg−1 (S5) to 29.1 cmolc kg−1 (S7), although only S6 and S7 are higher than 10 cmolc kg−1 (23.4 and 29.1 cmolc kg−1, respectively). Except for these cases, the soil with the highest eCEC value is S2 (9.1 cmolc kg−1). Calcium is the main exchangeable cation in almost all soil samples but not in S1, S3 and S5 where Al accounts for more than 50% of the measurable charge and Ca for 23, 32 and 20%, respectively. In S6 and S7, calcium represents more than 90% of the eCEC. Around 50% of the exchangeable complex of S4, S8, S9 and S10 is determined for Cae. The other exchangeable cations account in a similar way for the eCEC of these soils: Ke and Nae (≈5% each one), Mge (≈7%) and Ale (≈30%). In S2, the soil with the highest eCEC after S6 and S7, Ale also represents around 30% of the eCEC and Cae, although is the main exchangeable cation (37%) does not reach the 50% but Mge reaches 13%. Sand proportion in the mineral fractions ranges from 19% (S6) to 71% (S1) and the soils with highest clay contents are S7 and S8 (28 and 32%, respectively) while the lowest proportions are in S6 (14%).

3.2. Sorption and Desorption Experiments

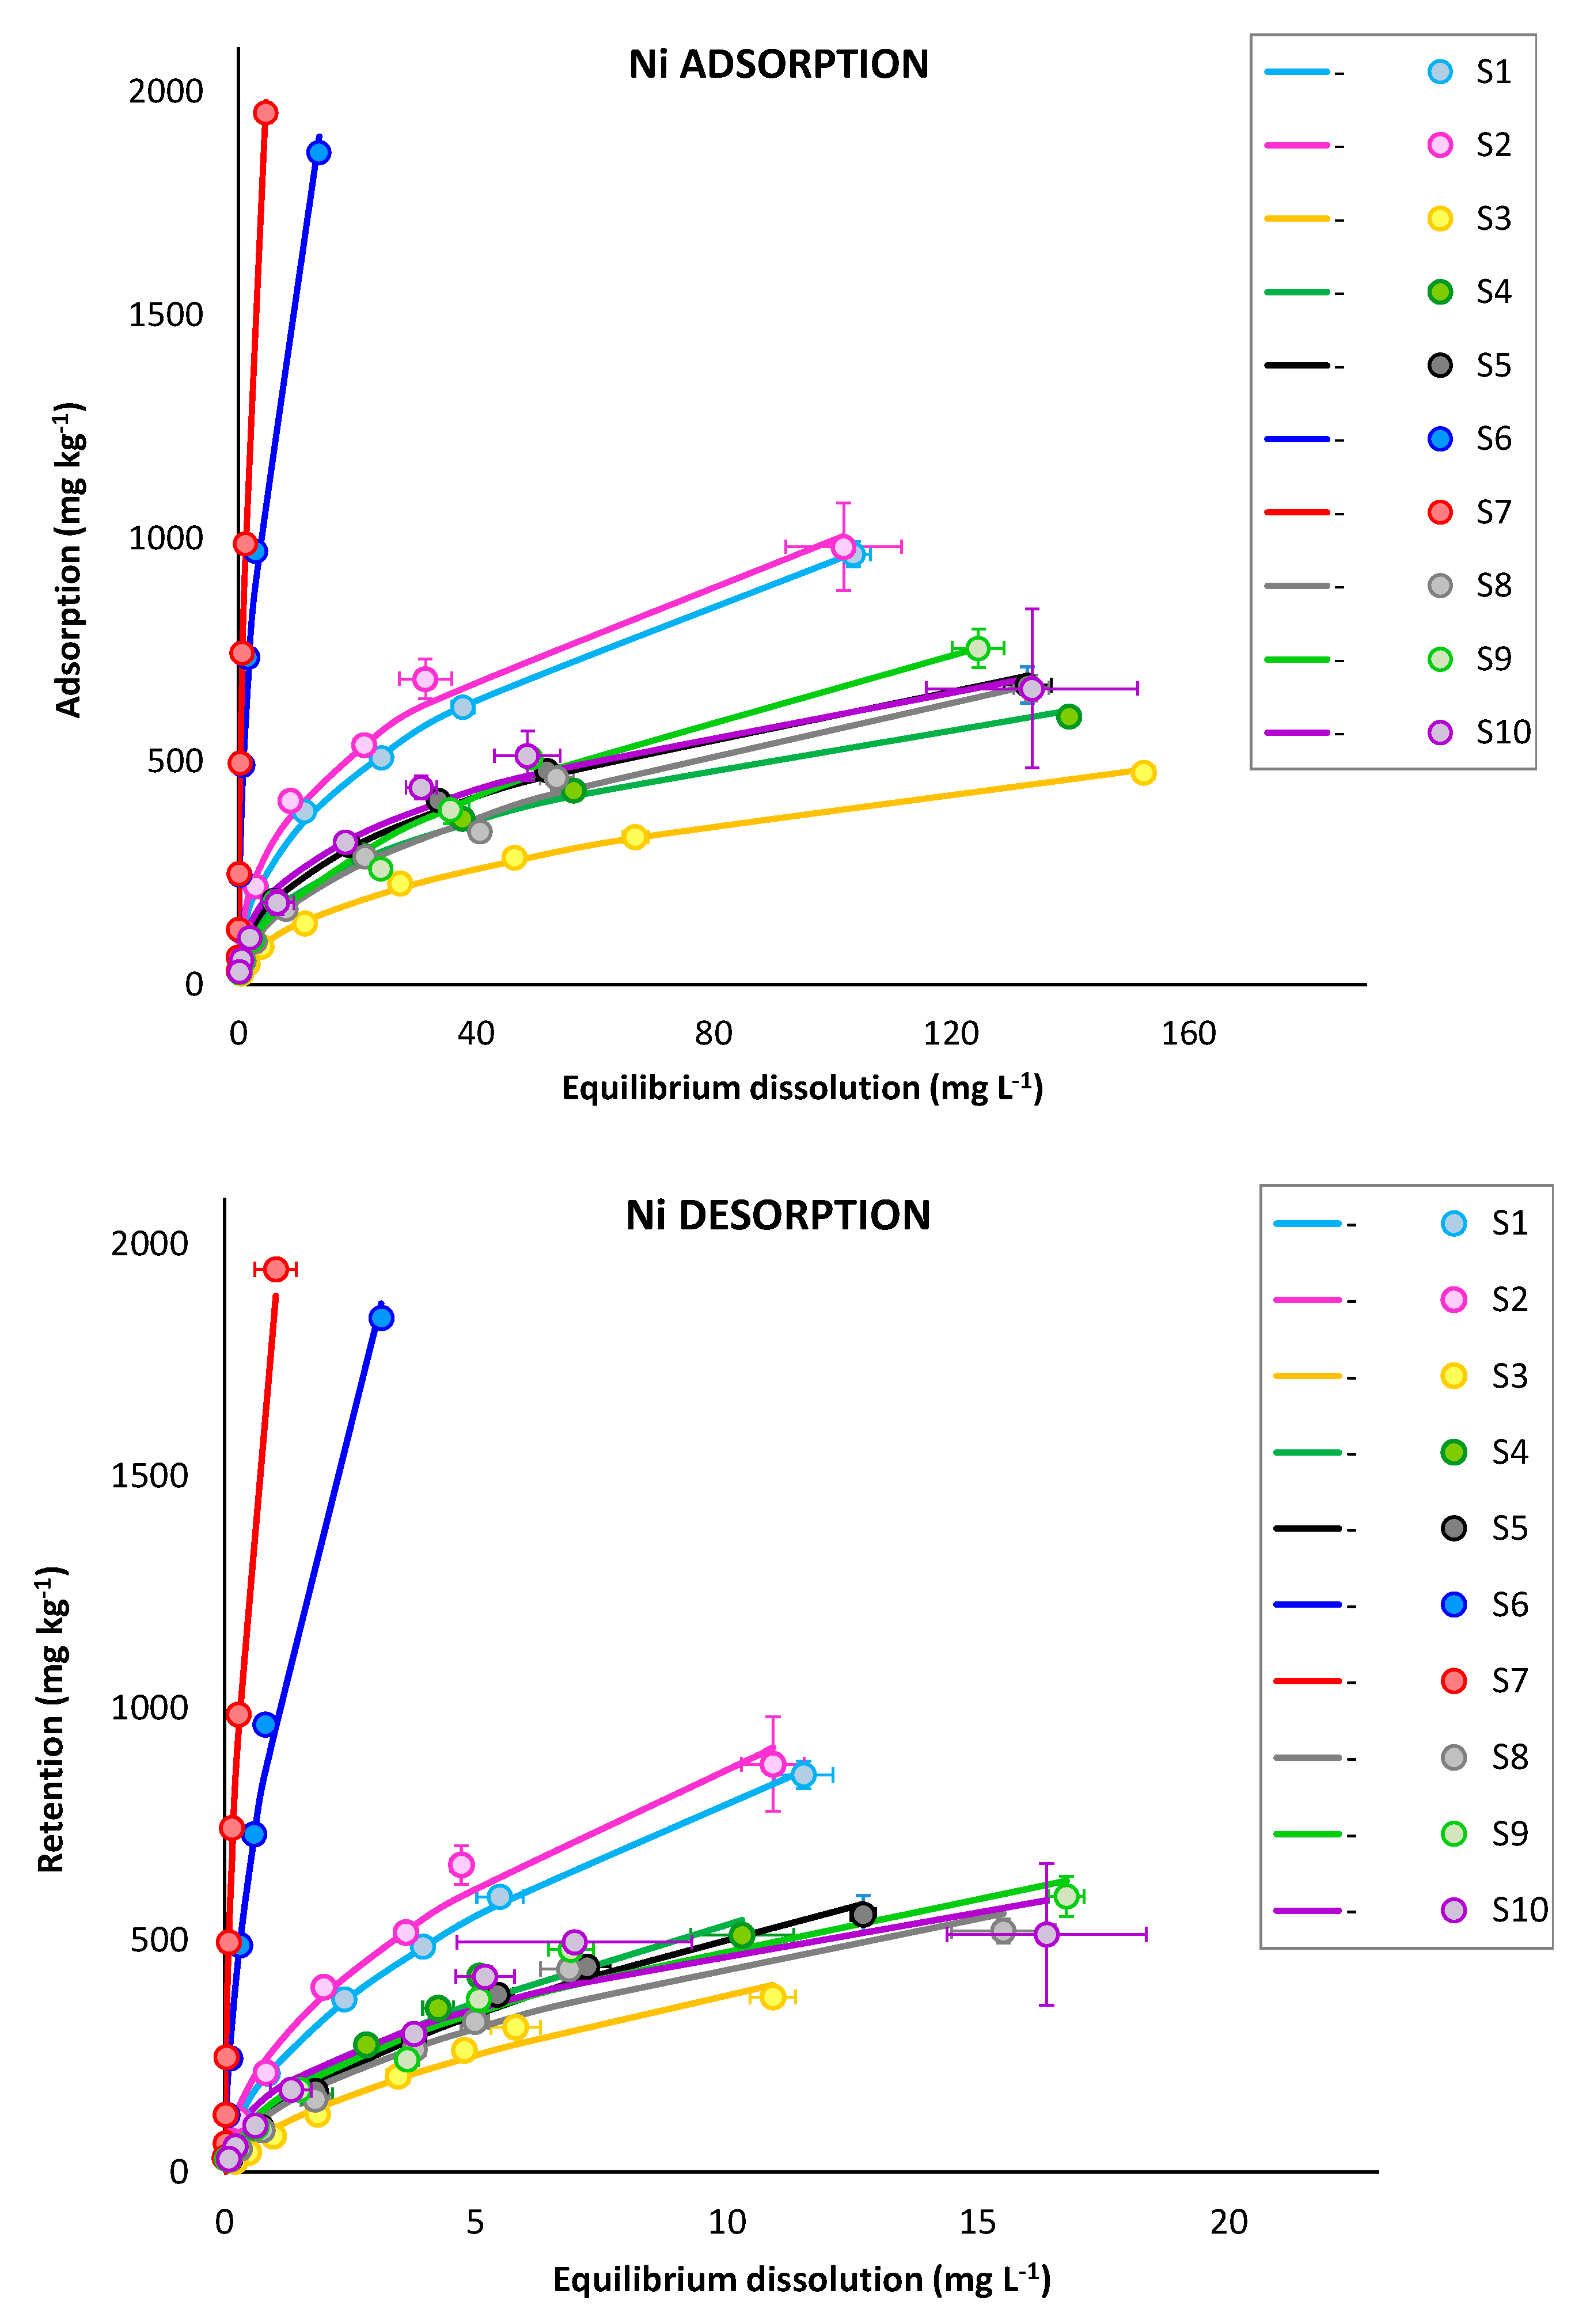
3.2.1. Adsorption and Retention Curves

Figure 1 shows the adsorption and desorption curves for Ni in the all ten soil samples (as an example), while for Cu, Zn, Pb and Cr are shown in Figures S1–S4. In all of them, dotted curves show the experimental data while continuous lines show the Freundlich modelled curved. Although most of data fitted well both Freundlich and Langmuir models (except that from S6 and S7 samples), in general, data from adsorption and desorption experiments better fit Freundlich (Table 2) than Langmuir model (Table S1) as was also found by other authors [21]. Most of the determination coefficients (R2) derived from the adjustments to Freundlich models are higher than 0.90 or even 0.95 (Table 2). In most of the 50 fitted curves n Freundlich parameter for adsorption was lower than 0.5 (41 cases) or around this value (2 cases), showing high heterogeneity in the adsorption sites. With the exception of S2 for Pb (n = 0.74) values significantly higher than 0.5 were found for S6 and S7 for Cr and Cu. For Pb adsorption data didn’t fit to Freundlich equation due extremely high adsorption (probably due to precipitation processes). Results from S6 and S7 samples for Cr and Cu show linearity of the adsorption processes or homogeneous sorption sites but also probably revealing irreversible reactions or precipitation for Cu, a probable process due to neutral pH values [29,30]. For most of the cases, the parameter n slightly varies from adsorption to desorption processes, or even remains the same (for Cr experiments) showing consistent pattern for n among adsorption and desorption curves and revealing heterogeneous sites for adsorption and retention after desorption (Table 2).
The corresponding KF values derived from Freundlich data fitting are also shown in Table 2. The KF values for adsorption of Cu (8407.2 and 2539.8 Ln mg1−n kg−1), Zn (1332.3 and 700.4 Ln mg1−n kg−1) and Ni (867.1 and 537.1 Ln mg1−n kg−1) in S7 and S6 soils, respectively, are the highest in agreement with the high adsorption. These results are consistent with those reported by Elbana et al. [20] after 1 day adsorption experiments for soils with pH higher than 7. Pb adsorption does not fit Freundlich model due to the high adsorbed amounts (equilibrium dissolution concentration is close to zero values). This strong Pb adsorption is indicative of irreversibility process and probably precipitation [20]. The affinities of S6 and S7 for Cr adsorption are the lowest of the studied soils as with high soil pH values the sorption of anions is usually low due to the low positive charge of the minerals among other processes that may occur simultaneously [19].
After desorption experiments, KF values are also very high for S7 and S6 samples (Cu: 19,664.5 and 9244.2 Ln mg1−n kg−1; Zn: 2416.0 and 876.3 Ln mg1−n kg−1; and Ni: 1866.7 and 976.0 Ln mg1−n kg−1).
When comparing KF values from the more acidic soils, values are lower than those just mentioned before and soil affinities are clearly depending on both metal on concern and treatment applied (adsorption and desorption). KF values for Cu adsorption range from 204.6 (S3) to 491.4 Ln mg1−n kg−1 (S10), those for Zn increase from 60.8 (S3) to 148.3 Ln mg1−n kg−1 (S2); Ni affinities vary from 46.6 (S3) to 157.4 Ln mg1−n kg−1 (S2) and for Pb from 673.6 (S3) to 2100.9 Ln mg1−n kg−1 (S2). Elbana et al. [20] reported compatible results for Cu, Zn, Ni and Pb adsorption in acid soils. Those from Zn and Ni adsorption shown in Antoniadis and Tsadilas [14] are also compatible. Focussing on Cr adsorption, KF from S7 is the lowest (3.3 Ln mg1−n kg−1) while the highest is in S1 (186.2 Ln mg1−n kg−1) and they are compatible with those obtained for different pH sorbents by Otero et al. [31] and Choppala et al. [32].
Affinities of soils for Pb, Cu, Ni and Cr increase after desorption experiments as KF desorption values are always higher than the corresponding KF adsorption values. During desorption process the easily reversible adsorbed metal is released while that remaining at soil surface is probably under high selective or specific adsorption reason why soils affinities increase. In addition, soil order affinities for metal retention suffer some changes after desorption process. The Cu retention affinities range from 455.3 (S3) to 800.5 Ln mg1−n kg−1 (S10), those of Ni increase from 95.2 (S3) to 268.2 Ln mg1−n kg−1 (S2), the KF for Pb retention varies from 1100.7 (S3) to 5082.4 Ln mg1−n kg−1 (S2) and, again, the lowest retention KF for Cr results is in S7 (38.3 Ln mg1−n kg−1) while the highest is in S1 (442.2 Ln mg1−n kg−1).
In the case of Zn, due to the comparatively higher amounts desorbed during desorption experiments the opposite happens. The higher released amounts of Zn during the desorption process indicate an important process to be investigated, especially in acidic soils [33] as part of adsorbed Zn is susceptible to leaching. When comparing with the corresponding adsorption KF values there is a decrease of the soil retention affinities except for S8. Therefore, S6, S7 and S8 are the only samples where KF of Zn retention is higher to the corresponding KF for Zn adsorption. In the rest of soil samples retention KF range from 9.6 (S4) to 35.6 Ln mg1−n kg−1 (S10).
According to KF values derived from adsorption and desorption data, especially from the acidic soils, it is possible to deduce a probably selectivity or preference of the soils for each metal. In contrast, in the slightly neutral soils the preferential selectivity only comes out for anion or cation adsorption.

3.2.2. Selectivity Sequences

Despite the different values among KF values (both from adsorption and retention data) some trends in metal selectivity sequences are identified. There is lower variety of retention selectivity sequences compared to the adsorption ones as during desorption experiments part of the previously adsorbed concentrations are released suggesting metals would probably remain retained in truly specific adsorption sites.
Pb and Cu are in all soils the metals adsorbed and retained with higher affinity. Zn is always the last metal in the selectivity sequence from desorption experiments in most acid soils while in soils with higher pH (S6 and S7) is Cr. The general sequence for acidic soils (Pb > Cu > Ni > Cr) agrees with that from Basta and Tabatabai [34] and Gomes et al. [35] where the metal affinity for the soils is Pb > Cu > Ni > Zn. In the case of studied acidic soils, Cr and Ni are the metals that change the position in the sequence. Only for S1 the selectivity sequence for desorption process remains as the previous adsorption selectivity sequence (Pb > Cu > Cr > Ni > Zn). This one was also established for desorption process in S2, S8 and S10 samples. The retention selectivity sequence for S3, S4, S5 and S9 is the same (Pb > Cu > Ni >Cr > Zn) and was never obtained during adsorption process. Accordingly, the still adsorbed amount calculated after desorption process indicates less selective or nonspecific adsorption as metals are susceptible to be leached. Although, regardless soil pH, soils show high affinities for Pb and Cu adsorption.

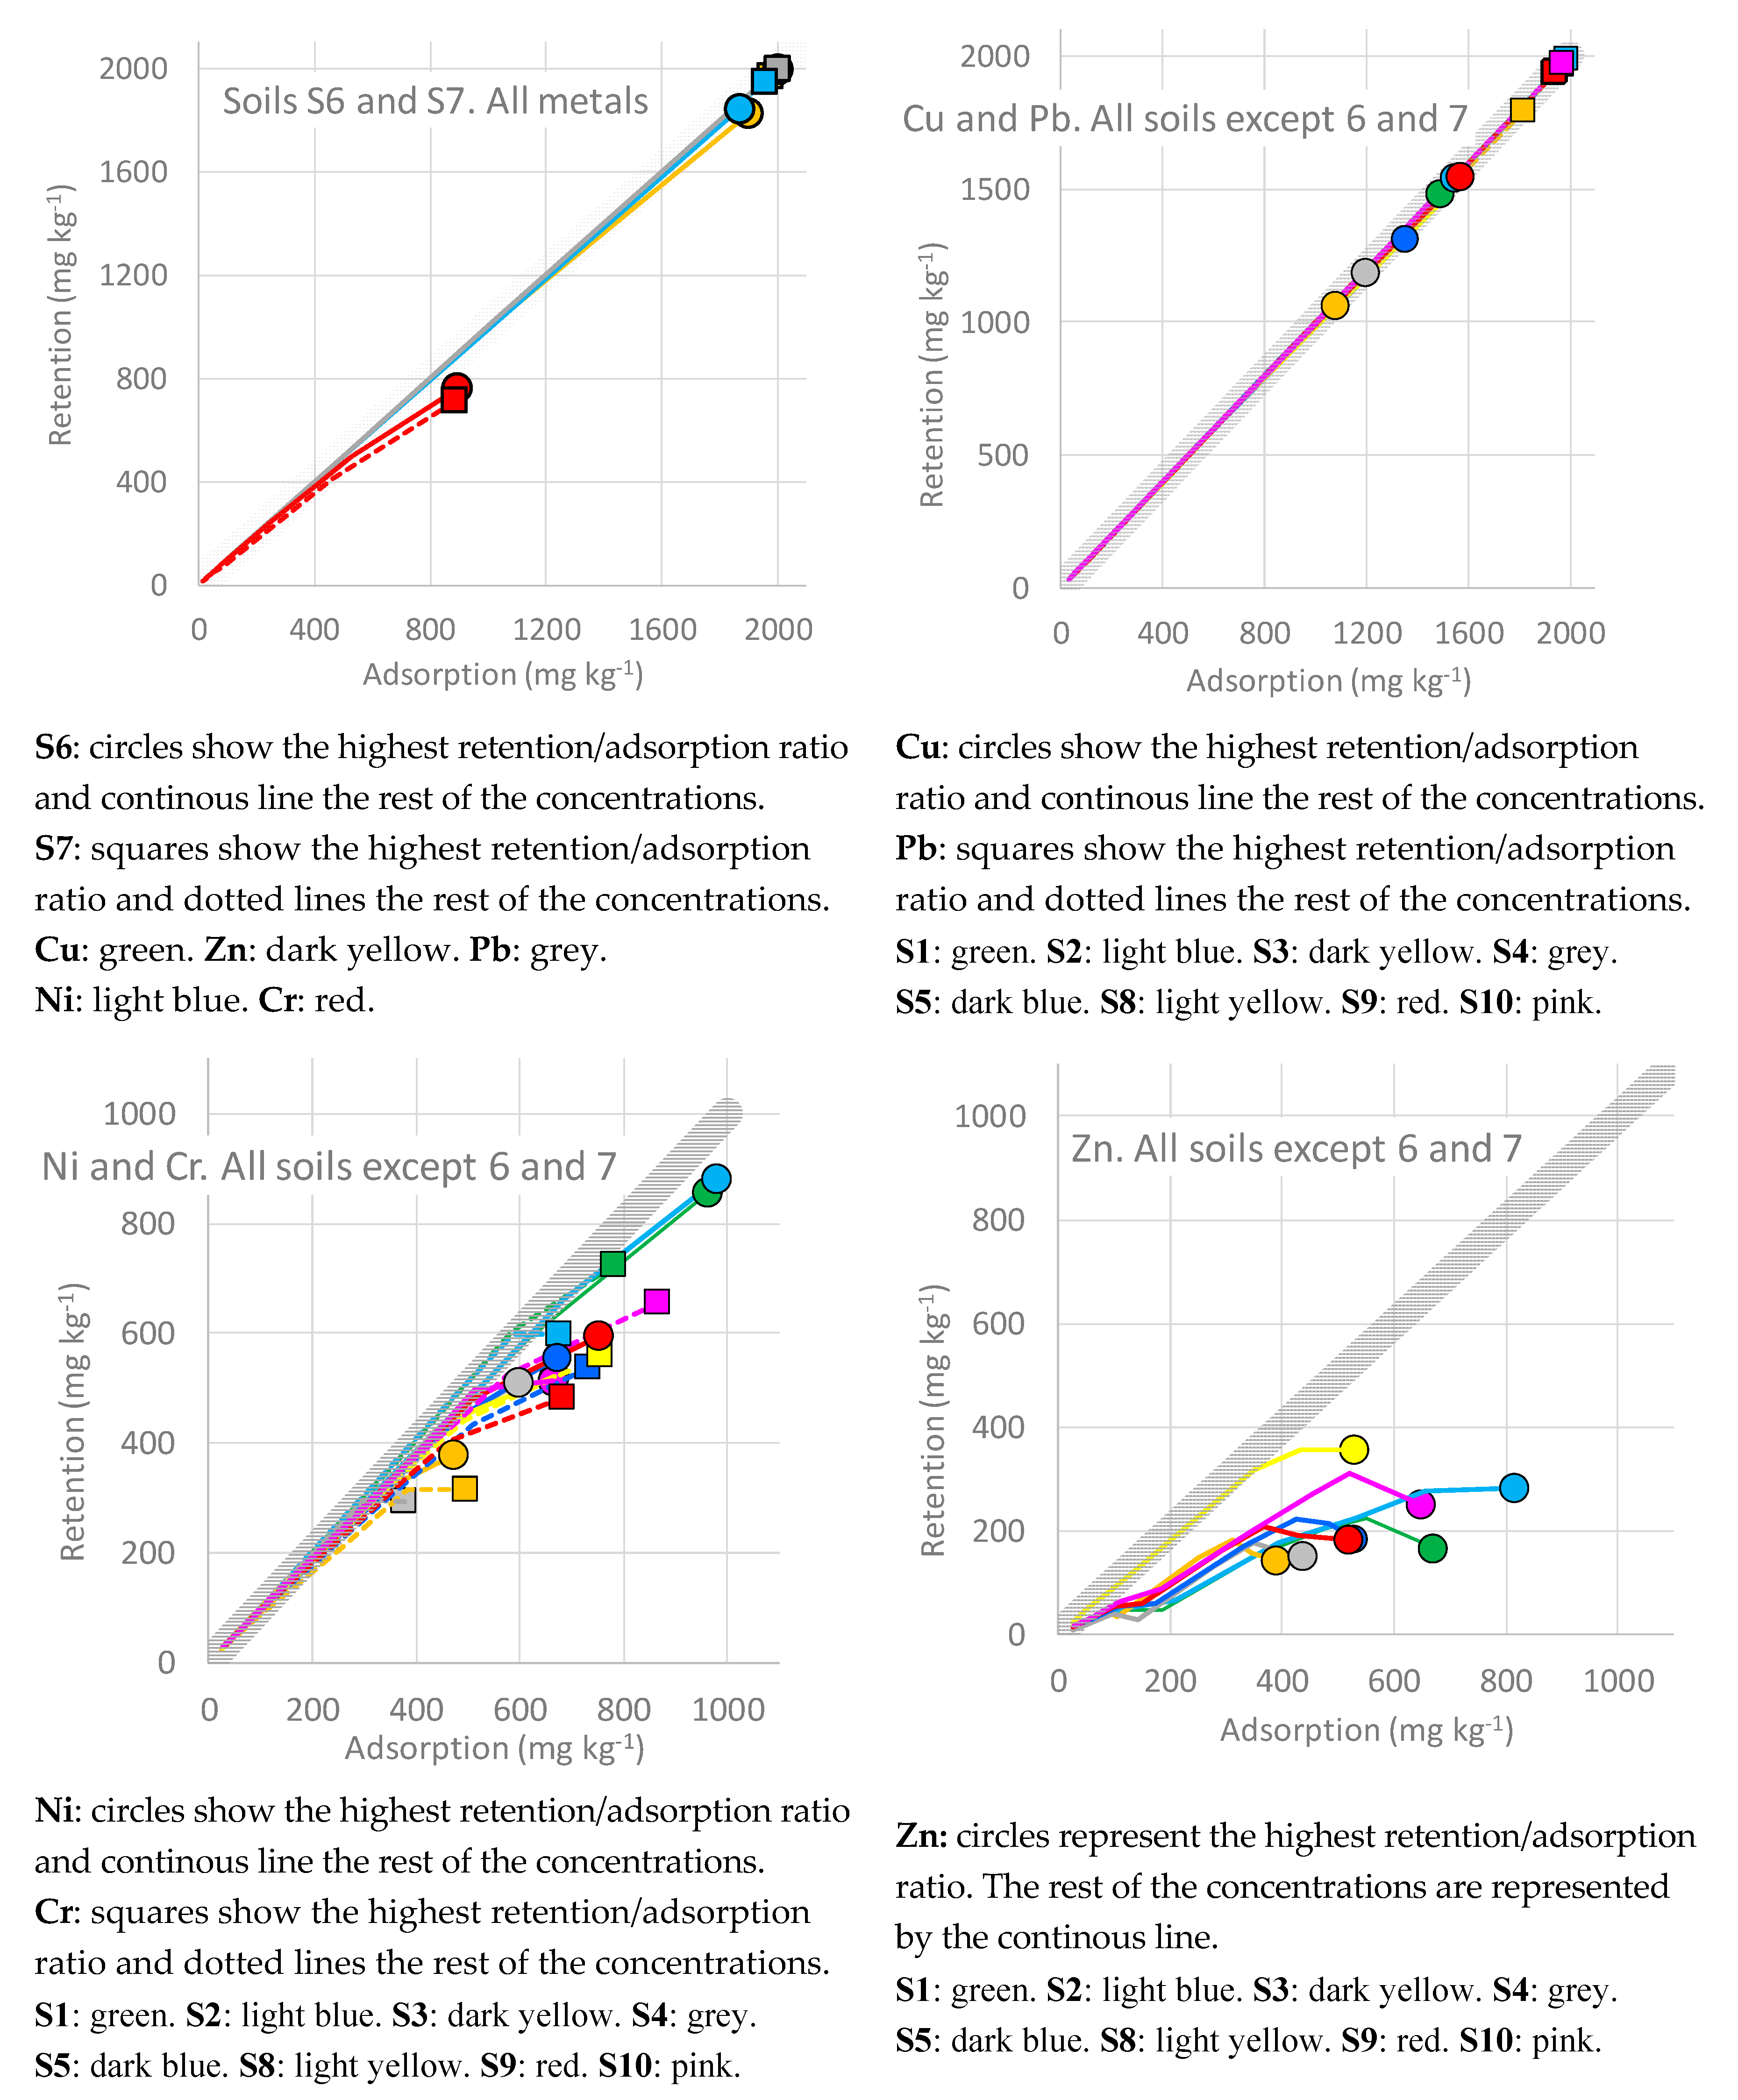
3.2.3. Adsorption Versus Retention Concentrations

The adsorbed and retained (still adsorbed in soil fraction after desorption experiments) amounts for each added concentration are represented in Figure 2.
If soils do not release the previously adsorbed cation after desorption experiments, the retained concentration will be equal (or very similar) to the adsorbed one and this will be noticed in the graphs (Figure 2) as that representation will overlap the thick grey line (retention: adsorption, 1:1). If retained concentrations are lower than previously adsorbed (i.e., the soil releases the previously adsorbed cations during desorption experiments) the corresponding representation in the graph will not overlap the grey strip showing up at the lower right of the graph. After representing all studied cases (10 soils and 5 metals) when comparing the concentration retained of each metal versus the adsorbed one several trends where identified. Generally, soils S6 and S7 (pH close to neutral) retained almost all the previously adsorbed amount of metal. The colour lines fitting the grey strip indicate that there is almost not released concentration after desorption experiments. The colour lines (green, yellow, grey, blue and red) indicate the ratio (retained/adsorbed) for each metal concentration (Cu, Zn, Pb, Ni and Cr, respectively) for soil S6 (normal lines) and soil S7 (dotted lines). Circles and squares show the highest adsorbed and retained concentration of each metal in S6 and S7, respectively, which in most of cases are comparable to the parameter β derived from Langmuir model data adjustment (Table S1). This parameter describes the maximum adsorption or retention amounts when the fitting is good. S6 and S7 are in most of cases the soils with the highest β values for Cu, Ni, Zn and Pb adsorption and retention (Table S1) and also those with the highest KF values from Freundlich model (Table 2) as it was already indicated. S6 adsorbs and retains a relative less amount of Ni and Zn than S7 and the concentrations of Cr adsorbed and retained in both soils are the lowest as β (Table S1) and KF (Table 1) also indicate. In addition, when the highest concentration of Cr is added, part of the adsorbed concentration is released after desorption experiments in both soils (the red lines do not fit the grey strip, Figure 2).
Focusing on the other and more acidic soils (S1–S5 and S8–S10), the trends identified are more related to the metal studied. In all cases, almost all the adsorbed Cu and Pb remain retained after desorption experiments as the corresponding lines fit on the grey strip (Figure 2). All soils adsorb and retain higher amounts of Pb than Cu as β from Langmuir model also shows (Table S1). Almost all Pb added remains retained in the soils (coloured squared overlap in the graph) but not the case for Cu and soil affinities are noticeable as the colored circles do not overlap. S3, followed by S4 and S5 adsorbed and retained the lowest Cu concentrations while no differences are identified among Cu concentrations fixed by S2 and S8–S10. In these cases, desorption remains low suggesting that is controlled by the previous adsorption process [36].
Similar interpretations can be derived after diluted concentrations of Ni and Cr are added but the opposite happens after adding the highest concentrations as it shows the lower right part of the corresponding graph (Figure 2). For Zn cases, although the adsorbed amounts are similar to those of Ni and Cr in the corresponding soils, after desorption experiments the concentration of Zn retained is much lower for most of the concentrations added suggesting nonspecific adsorption during adsorption experiments vs. specific retention of Zn after desorption ones. In addition, both β and KF parameters derived from Langmuir and Freundlich models also indicate lower retained amounts and lower soil affinities for Zn after desorption experiments (Table S1 and Table 1, respectively). Due to in all cases they are high affinities at low concentrations (Figure 2) the concentration level chosen for adsorption experiments will contribute to not overestimate the affinity coefficient [20].

3.2.4. Pearson Correlation: Soil Properties vs. KF

In order to avoid precipitation influence (soil pH influence) and to better understand the role of the soil components and properties in metal adsorption and retention affinities, two different Pearson correlation analysis were performed between KF values (obtained from both adsorption and desorption process) and soil components or properties. In the first one, all soil samples were included but in the second one the values corresponding to S6 and S7 samples were removed due to previously explained results and as according to Visual Minteq 3.1 program (software provided by Gustafsson [37] calculations, precipitation mainly of Pb and Cu took place during adsorption and desorption experiments in these samples (pH of dissolution equilibrium was always higher than 6.5).
Table 3 shows the significant correlation coefficients between soil properties and KF values from adsorption (ADS) and desorption data (DES). In both cases, when “all soils” or without S6 and S7 samples (No. S6&S7), Pearson correlation analysis showed no significant correlation with TC, TN and Ke, this is reason why they are not shown in Table 3.
When all soils are included in the analysis, properties like pH (both measured in water and KCl) and eCEC together with contents of Cae, show high and significant correlation values with most of metal adsorption and desorption affinities (KF). Although these results are in agreement with previous studies [7,20,38,39] they are mainly derived from S6 and S7 soil properties as they have the highest sorption capacities for most of metals and also very high pH and eCEC together with the high proportion of Cae. In fact, when these soils are not included in the analysis other soil properties show up depending on metal or treatment, except for Cr due to the similar order of magnitude of KF values among soils.
In this context, adsorption of Cu is only correlated (positively) with organic matter content while retained amount does not correlate with any of the soil parameters evaluated. When S6 and S7 are not included, the pH is only correlated (negatively) with adsorption and retention of Cr. The exchangeable complex seems to play a specific role on Ni retention as it correlates with both eCEC and Mge and Ale contents. These contents also influence Pb adsorption and retention soil affinities. According to Bradl [3] and Tiller and Hodgson [40], the adsorption of Zn to clay is characterized as dominantly reversible although part of the Zn retained is lattice entrapped in an irreversible nonexchangeable form, these results probably explain that only retention of Zn correlates with clay contents (Table 3). In addition, Yang et al. [33] argue that the higher desorption of Zn, compared to that of Cu or Cd, is probably due to Zn forms very weak complexes with organic matter that are easily released during desorption process.
Soil pH is a very important parameter determining the soil affinities and capacities for heavy metal retention. If soils are acidic or slightly acidic, heavy metal retention will be more influenced by soil components and other properties as organic matter and clay contents and eCEC.

3.2.5. Sorption Reversibility. Principal Component Analysis

Released concentrations during desorption experiments probably depend on the metal studied, especially in the more acidic soils as it was previously described. For understanding this process, the sorption irreversibility was studied by principal component analysis (PCA) in order to reduce the variables involved during the process. The ratio KF retention/KF adsorption (KFDES/KFADS, Table 2) is commonly used as an indicator of the adsorption irreversibility or hysteresis. Zn is the more mobile metal in all cases as most of KFDES/KFADS indexes are lower than 0.4 (Table 2) while the hysteresis indices for Cu, Ni, Pb and Cr vary depending on soils.
In order to synthetize the influence of soil properties and understand the underlying factors on specific adsorption (irreversibility), the hysteresis indices were included in the PCA together with soil properties. S6 and S7 results were not included in the principal component analysis as mainly precipitation and not real soil properties influence takes place. Principal component analysis was run in correlation mode and varimax rotation for maximizing the loadings of the variables on the components of the PCA [41].
Five components explain 92.4% of the variance of the soil metal adsorption irreversibility (Table 4). The first component (PC1-Pb) explains 32.72% of the variance and shows large positive loadings for hysteresis of Pb (His-Pb) and Mge, Ale, DOC, eCEC as well as large negative loadings for soil pH. The high positive loadings of exchangeable cations, even those of Cae, indicate the importance of the cation exchange on soil Pb adsorption irreversibility. According to Vidal et al. [1] retention of Pb is based mainly in specific sorption and Rosen and Chen [42] indicated that exchangeable fraction of soils adsorbed Pb, specially at high metal loading rates. In agreement to eCEC values (Table 1), S1 and S2 soil samples show the largest factor scores for the extracted PC1-Pb while the lowest are in S4 and S5 samples (Table 5) showing the important role that cation exchange capacity plays in Pb adsorption and its irreversibility after desorption takes place.
The second component (PC2-Cu) explains 22.32% of the variance and shows large negative loadings for the hysteresis of Cu as well as large positive loadings for OM, K and Cae (Table 4). Organic matter is known as a high affinity component for Cu adsorption even in acid soils [1] but after desorption process, part of the Cu adsorbed in OM in exchangeable positions is released and S10, the soil with highest OM contents (Table 1) shows the highest factor scores for PC2-Cu (Table 5). The high affinities of Cu-organic matter are well known as it accumulates preferably in surface horizons [43] but the soluble organic complexes can also influence the release of the Cu previously adsorbed. Therefore, Cu is adsorbed in the organic fraction of the soils but its solubilisation is also enhanced due to the mobilization of organometallic complexes [42].
The third component (PC3-Zn) explains 17% of the variance and only shows large loadings for hysteresis of Zn and clay contents (Table 4). S8 is the only acidic soil sample with retention KF values higher than adsorption ones due to the high clay content (Table 1) as the factor score of S8 for PC3-Zn shows (Table 5). Veli and Alyüz [44] already shown the efficiency of clay adsorption for Cu but specially for Zn removal from metal concentrated solutions. Kabata-Pendias and Pendias [43] have also indicated that clays are capable of holding Zn quite strongly.
The fourth (PC4-Cr) and fifth (PC5-Ni) components explain 10.72% and 9.64% of the variance and show large loadings for hysteresis of Cr and Ni, respectively. The close to zero loadings for OM are in agreement with results from Bloomfield in Kabata-Pendias and Pendias [43] as they indicate the bonding of Ni to the organic ligands could be not particularly strong. They are also related to the hysteresis of Pb and Cu as they show the moderately large loadings (Table 4).
Soil adsorption irreversibility measures soil affinities for the previously adsorbed metal and can be used as an indicative of more specific adsorption as higher irreversibility values indicate less nonspecific adsorption and lower susceptibility for leaching. Although higher eCEC and clay and organic matters are responsible of higher specific adsorption, in the case of Cu, organic matter may also account for adsorption reversibility.

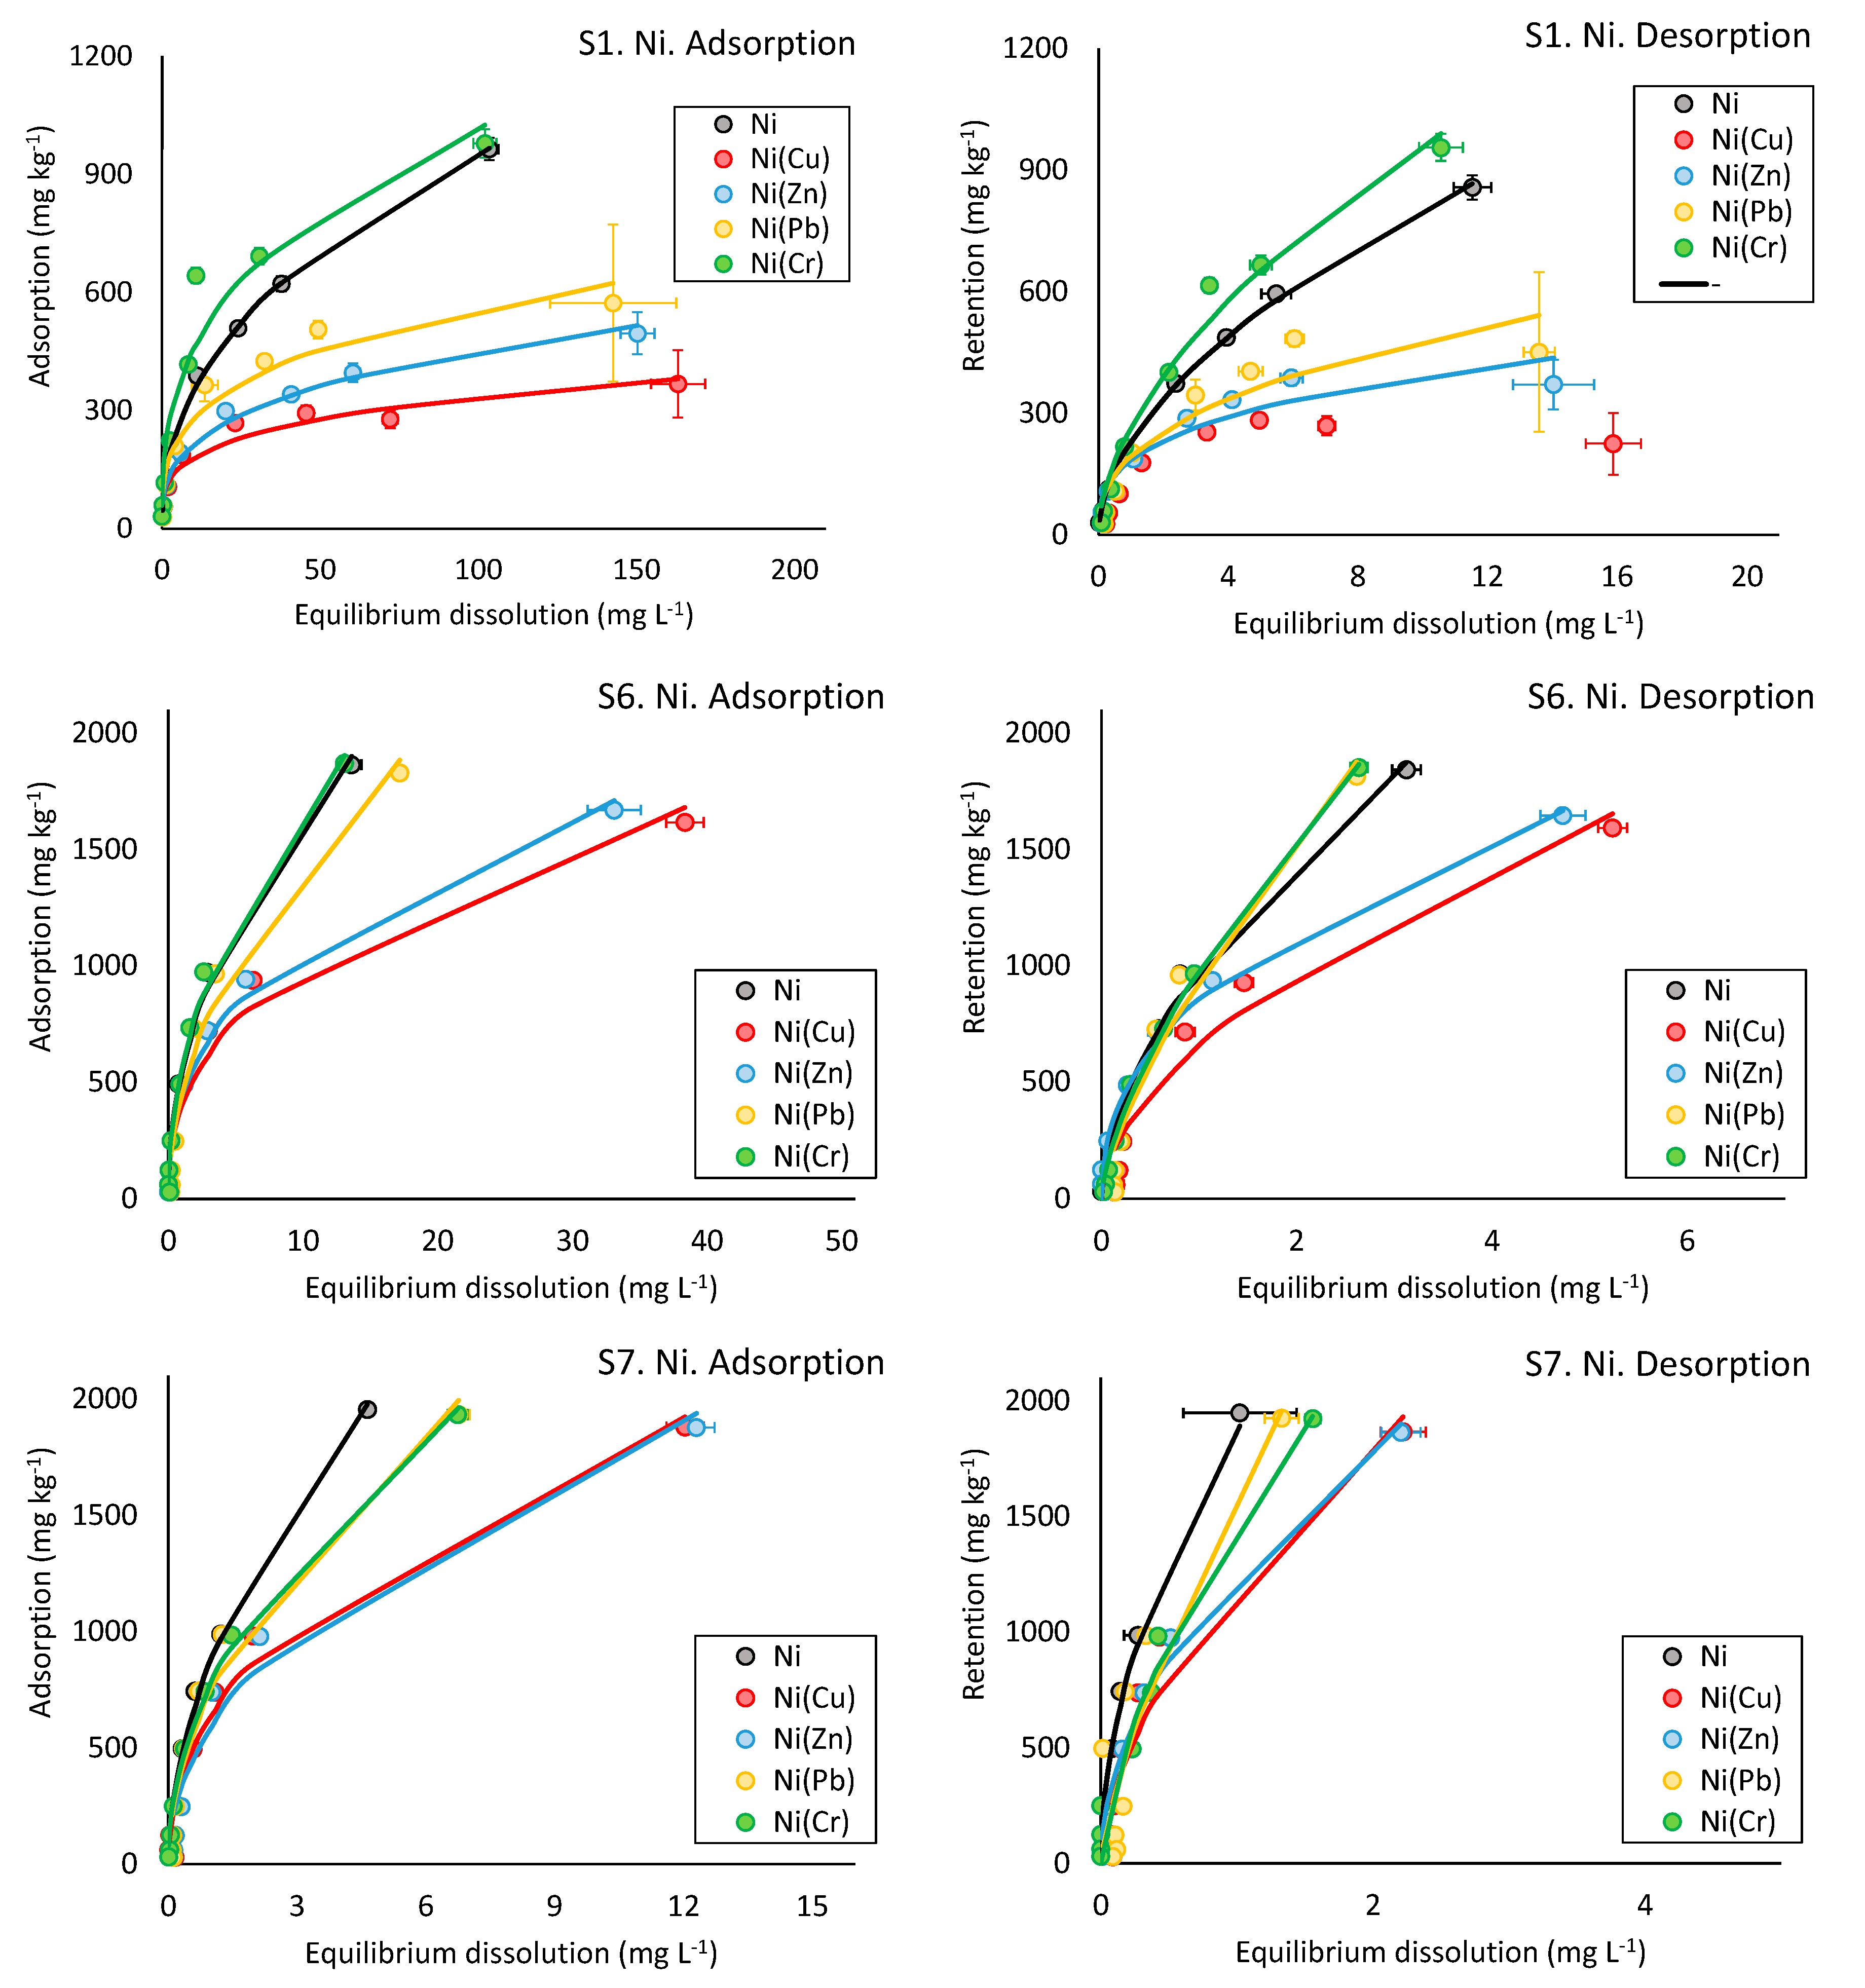
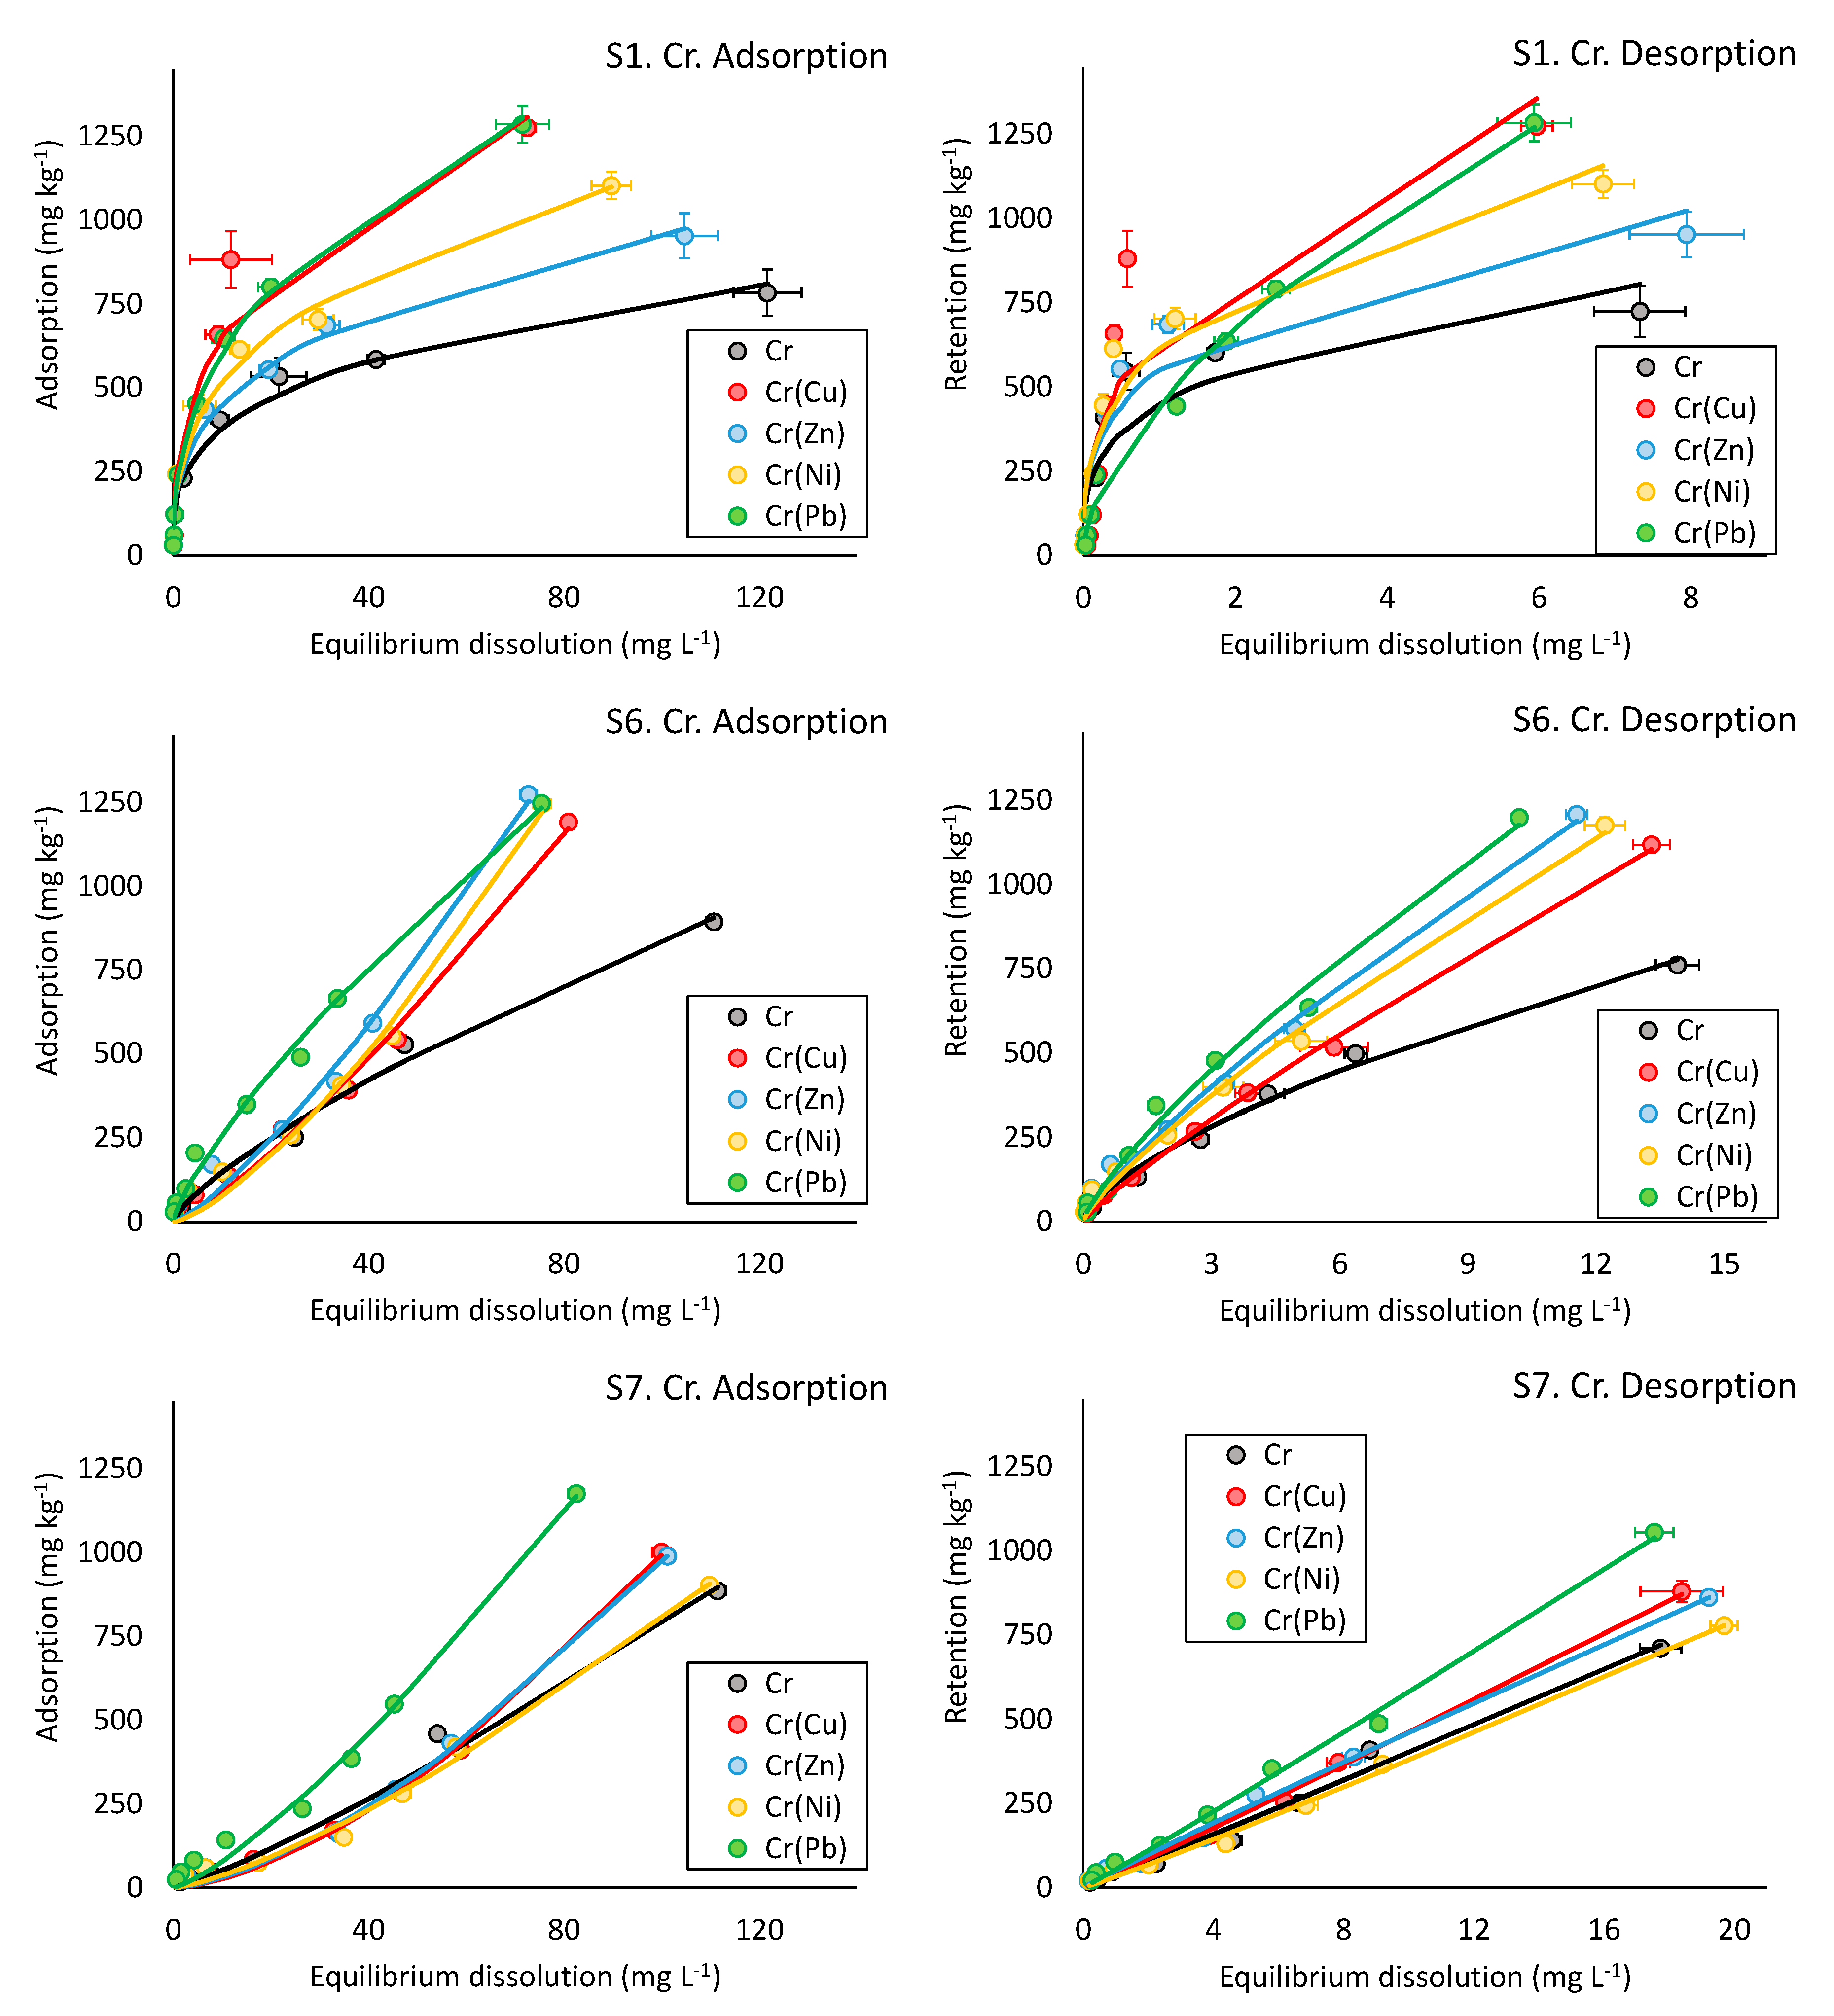
3.2.6. Competitive Adsorption and Desorption Experiments

Pair metal competitive experiments were conducted in S1, S6 and S7 samples. Figure 3 shows the adsorption and desorption curves of Ni when one other metal is added during adsorption experiments as well that curve derived from single solution experiments (black lines). The corresponding competitive curves of Cr are shown in Figure 4 and those of Cu, Zn and Pb are shown in the Supplementary Materials (Figures S5–S7, respectively).
The competitive adsorption and desorption results derived from S1, S6 and S7 samples show that compared to single experiments, competition resulted in decreased metal adsorption as for Echeverría et al. [38] and Antoniadis and Tsadilas [14]. Generally, individual adsorption and retention of Cu, Zn, Ni and Pb is always higher than competitive one except if Cr is in competition (see Figure 3 and Figure 4 as an example). In the latter case, competitive adsorbed or retained amounts of metal are even higher than in individual experiments, especially in S1 and S6 samples. Single adsorption and retention of Cr is lower than the obtained during competitive experiments in most of the cases (Figure 4).
In order to synthetize these results, competitive adsorption and desorption data were also compared to Freundlich model. In addition, the Murali-Aylmore model was also applied, and the corresponding derived parameters from good fittings are shown in Table 6.
In most of cases the competitive adsorption of Pb in samples S6 and S7 did not fit to the models applied mainly due to the low equilibrium dissolution concentration. This means that in the partitioning, most of added Pb is moved to the soil solid phase. For S1 samples, both Freundlich and Murali-Aylmore models [45] indicates that Pb is preferably sorbed than any of the metals added in competition. KF-Pb(m2) is always higher than KF-m2(Pb) and am2(Pb) is always higher than aPb(m2) (Table 6).
Except if Pb is present as competing ion, soil affinities for Cu adsorption are higher than those of Ni, Zn or Cr in S1, S6 and S7 samples. If Cr is the competing ion, the affinities for Cu adsorption are even higher than when no competition takes place. The promoted adsorption of Cr when other competing ion is present (Figure 4) is well described by the model as KF of competitive adsorption of Cr are similar to those of individual sorption in S1 samples and n values from Freundlich model obtained in S6 and S7 samples are higher than 1.24. The parameter aCr(m2) show large negative values indicative of promoted adsorption. In fact, after desorption occurs, the specific adsorption sites play important roles during competitive experiments as the affinities of desorption KF of competitive experiments (Table S2) are even higher than those of individual experiments. In addition to the ones already identified during adsorption experiments, adsorption of other elements is also promoted if Zn, Ni and mainly Pb are present as competing ion in S1, S6 and S7 samples. The inhibition in adsorption of a metal in presence of other heavy metals is an usual finding [46]. However, the synergistic effect between heavy metals in adsorption is not frequently reported. The competition/synergic adsorptions may be related with the cationic or anionic nature of the heavy metals. When two metals in competition are cations the competition seems clear [47]. However, when a cationic metal is in solution with an anionic metal, synergistic effect may occur as suggest results of this study. Adsorption synergistic effects between cations and anions were previously found between Cu-P [48,49].

4. Conclusions

The slightly neutral soils adsorb and retain the highest amounts of Pb, Cu, Ni and Zn and generally almost all the previously adsorbed amount of metal is kept in the soil after desorption experiments. Instead, the amounts of Cr adsorbed and retained are the lowest.
The trends in adsorption and desorption affinities identified in the more acidic soils are more related to the metal studied and differ depending on soil properties. Although both Langmuir and Freundlich models fitted most of the results, Freundlich model provided better adjustments and derived constants were used for estimating soil properties influence. Selectivity sequences show Pb and Cu in the first terms of all soils while Zn is the last in sequences of more acidic soils and Cr in the slightly neutral soils.
Specific sorption of Pb and irreversibility is related to the cationic exchange capacity of the soils and that of Zn to the clay content. Instead, Cu sorption reversibility is probably due to the more soluble organic fraction of the soils.
Competitive experiments show that individual retention of Cu, Zn, Ni and Pb is always higher than competitive ones except if Cr is in competition showing synergistic effects and that specific adsorption is of great importance during competitive experiments.

Supplementary Materials

The following are available online at https://www.mdpi.com/2073-4395/10/8/1113/s1, Table S1: Langmuir parameters β (mg kg−1), KL (L mg−1) and R2 after adsorption and desorption model data adjustment, Table S2: Competitive desorption results. Parameters derived from Freundlich model fitted with competitive desorption data, Figure S1: Single adsorption and desorption curves of Cu by soil samples, Figure S2: Single adsorption and desorption curves of Zn by soil samples, Figure S3: Single adsorption and desorption curves of Pb by soil samples, Figure S4: Single adsorption and desorption curves of Zn by soil samples, Figure S5: Competitive (coloured) and single (black) adsorption and desorption curves of Cu by soil S1, S6 and S7 samples, Figure S6: Competitive (coloured) and single (black) adsorption and desorption curves of Zn by soil S1, S6 and S7 samples, Figure S7: Competitive (coloured) and single (black) adsorption and desorption curves of Pb by soil S1, S6 and S7 samples.

Author Contributions

Conceptualization, M.A.-E., D.F.-C.; methodology, M.A.-E., F.A.-V.; formal analysis, C.C.-C. and M.C.-C.; investigation, C.C.-C. and F.A.-V.; writing—original draft preparation, C.C.-C. and M.C.-C.; writing—review and editing, M.A.-E. and F.A.-V.; funding acquisition, M.A.-E., and D.F.-C.; data curation: M.C.-C.; supervision: M.A.-E.; project administration: D.F.-C. All authors have read and agreed to the published version of the manuscript.

Funding

This work was supported by the Spanish Ministry of Economy and Competitiveness and Xunta de Galicia through the projects CTM2015-73422-JIN and ED431F 2018/06). Also it was supported by Xunta de Galicia via CITACA Strategic Partnership (ED431E 2018/07) and funding for research groups (ED431C 2017/62-GRC). M. Conde-Cid holds a pre-doctoral FPU contract (Ministry of Education, Culture and Sports). D. Fernández-Calviño holds a Ramón y Cajal contract (Ministry of Economy, Industry and Competitiveness). C. Campillo-Cora holds a pre-doctoral fellowship funded by the University of Vigo.

Conflicts of Interest

The authors declare no conflict of interest. The funders had no role in the design of the study, in the collection, analyses, or interpretation of data; in the writing of the manuscript, or in the decision to publish the results.

References

  1. Vidal, M.; Santos, M.J.; Abrão, T.; Rodríguez, J.; Rigol, A. Modeling competitive metal sorption in a mineral soil. Geoderma 2009, 149, 189–198. [Google Scholar] [CrossRef]
  2. Elbana, T.A.; Selim, H.M. Modeling of cadmium and nickel release from different soils. Geoderma 2019, 338, 78–87. [Google Scholar] [CrossRef]
  3. Bradl, H.B. Adsorption of heavy metal ions on soils and soils constituents. J. Colloid Interface Sci. 2004, 277, 1–18. [Google Scholar] [CrossRef] [PubMed]
  4. Selim, H.M.; Zhang, H. Modeling approaches of competitive sorption and transport of trace metals and metalloids in soils: A review. J. Environ. Qual. 2013, 42, 640–653. [Google Scholar] [CrossRef] [PubMed] [Green Version]
  5. Ming, H.; Naidu, R.; Sarkar, B.; Lamb, D.T.; Liu, Y.; Megharaj, M.; Sparks, D. Competitive sorption of cadmium and zinc in contrasting soils. Geoderma 2016, 268, 60–68. [Google Scholar] [CrossRef]
  6. Wu, Z.; Chen, Y.; Han, Y.; Ke, T.; Liu, Y. Identifying the influencing factors controlling the spatial variation of heavy metals in suburban soil using spatial regression models. Sci. Total Environ. 2020, 717, 137212. [Google Scholar] [CrossRef]
  7. Huang, B.; Li, Z.; Huang, J.; Guo, L.; Nie, X.; Wang, Y.; Zhang, Y.; Zeng, G. Adsorption characteristics of Cu and Zn onto various size fractions of aggregates from red paddy soil. J. Hazard. Mater. 2014, 264, 176–183. [Google Scholar] [CrossRef]
  8. Fernández-Calviño, D.; Pérez-Novo, C.; Bermúdez-Couso, A.; López-Periago, E.; Arias-Estévez, M. Batch and stirred flow reactor experiments on Zn sorption in acid soils Cu competition. Geoderma 2010, 159, 417–424. [Google Scholar] [CrossRef]
  9. Violante, A.; Cozzolino, V.; Perelomov, L.; Caporale, A.G.; Pigna, M. Mobility and bioavailability of heavy metals and metalloids in soil environments. J. Soil Sci. Plant Nutr. 2010, 10, 268–292. [Google Scholar] [CrossRef] [Green Version]
  10. Dinić, Z.; Maksimović, J.; Stanojković-Sebić, A.; Pivić, R. Prediction Models for Bioavailability of Mn, Cu, Zn, Ni and Pb in Soils of Republic of Serbia. Agronomy 2019, 9, 856. [Google Scholar] [CrossRef] [Green Version]
  11. Huang, Y.; Fu, C.; Fang, F.; Ouyang, W.; Gou, J. Effect of dissolved organic matters on adsorption and desorption behavior of heavy metals in a water-level-fluctuation zone of the Three Gorges Reservoir, China. Ecotoxico. Environ. Saf. 2019, 185, 109695. [Google Scholar] [CrossRef]
  12. Abdin, Y.; Usman, A.; Ok, Y.S.; Tsnag, Y.F.; Al-Wabel, M. Competitive sorption and availability of coexisting heavy metals in mining-contaminated soil: Contrasting effects of mesquite and fishbone biochars. Environ. Res. 2020, 181, 108846. [Google Scholar] [CrossRef] [PubMed]
  13. Sparks, D.L. Environmental Soil Chemistry, 2nd ed.; Academic Press: San Diego, CA, USA, 2003; p. 352. [Google Scholar]
  14. Antoniadis, V.; Tsadilas, C.D. Sorption of cadmium, nickel, and zinc in mono- and multimetal systems. Appl. Geochem. 2007, 22, 2375–2380. [Google Scholar] [CrossRef]
  15. Silva-Yumi, J.; Escudey, M.; Gacitua, M.; Pizarro, C. Kinetics, adsorption and desorption of Cd(II) and Cu(II) on natural allophane: Effect of iron oxide coating. Geoderma 2018, 319, 70–79. [Google Scholar] [CrossRef]
  16. Sipos, P.; Tóth, A.; Kis, V.K.; Balázs, R.; Kovács, I.; Németh, T. Partition of Cd, Cu, Pb and Zn among mineral particles during their sorption in soils. J. Soils Sedim. 2019, 19, 1775–1787. [Google Scholar] [CrossRef]
  17. Shaheen, S.M.; Tsadilas, C.D.; Rupp, H.; Rinklebe, J.; Melssner, R. Distribution coefficients of cadmium and zinc in different soils in mono-metal and competitive sorption systems. J. Plant Nutr. Soil Sci. 2015, 178, 671–681. [Google Scholar] [CrossRef]
  18. Limousin, G.; Gaudet, J.P.; Charlet, L.; Szenknect, S.; Barthès, V.; Krimissa, M. Sorption isotherms: A review on physical bases, modelling and measurement. Appl. Geochem. 2007, 22, 249–275. [Google Scholar] [CrossRef]
  19. Caporale, A.G.; Violante, A. Chemical processes affecting the mobility of heavy metals and metalloids in soil environments. Curr. Pollut. Rep. 2016, 2, 15–27. [Google Scholar] [CrossRef] [Green Version]
  20. Elbana, T.A.; Selim, H.M.; Akrami, N.; Newman, A.; Shaheen, S.M.; Rinklebe, J. Freundlich sorption parameters for cadmium, copper, nickel, lead, and zinc for different soils: Influence of kinetics. Geoderma 2018, 324, 80–88. [Google Scholar] [CrossRef]
  21. Bogusz, A.; Oleszczuk, P.; Dobrowolski, R. Adsorption and desorption of heavy metals by the sewage sludge and biochar-amended soil. Environ. Geochem. Health 2019, 41, 1663–1674. [Google Scholar] [CrossRef] [Green Version]
  22. Liao, L.; Selim, H.M. Competitive sorption of nickel and cadmium in different soils. Soil Sci. 2009, 174, 549–555. [Google Scholar] [CrossRef]
  23. Guitián, F.; Carballas, T. Técnicas de Análisis de Suelos; Pico Sacro: Santiago de Compostela, Spain, 1976. [Google Scholar]
  24. Hoogsteen, M.J.J.; Lantinga, E.A.; Bakker, E.J.; Groot, J.C.J.; Tittonell, P.A. Estimating soil organic carbon through loss on ignition: Effects of ignition conditions and structural water loss. Eur. J. Soil Sci. 2015, 66, 320–328. [Google Scholar] [CrossRef]
  25. Sumner, M.E.; Miller, W.P. Cation exchange capacity and exchange coefficients. In Methods of Soil Analysis Part 3: Chemical Methods; Sparks, D.L., Page, A.L., Helmke, P.A., Loeppert, R.H., Soltanpour, P.N., Tabatabai, M.A., Johnston, C.T., Sumner, M.E., Eds.; Soil Science Society of America, Inc.: Madison, WI, USA, 1996. [Google Scholar]
  26. Bertsch, P.M.; Bloom, P.R. Aluminium. In Methods of Soil Analysis Part 3: Chemical Methods; Sparks, D.L., Page, A.L., Helmke, P.A., Loeppert, R.H., Soltanpour, P.N., Tabatabai, M.A., Johnston, C.T., Sumner, M.E., Eds.; Soil Science Society of America, Inc.: Madison, WI, USA, 1996. [Google Scholar]
  27. Harter, R.D.; Naidu, R. An assessment of environmental and solution parameter impact on trace-metal sorption by soils. Soil Sci. Soc. Am. J. 2001, 65, 597–612. [Google Scholar] [CrossRef]
  28. Murali, V.; Aylmore, A.G. Competitive adsorption during solute transport in soils: 1. Mathematical models. Soil Sci. 1983, 135, 143–150. [Google Scholar] [CrossRef]
  29. Macías-Vázquez, F.; Calvo de Anta, R. Niveles genéricos de referencia de metales pesados y otros elementos traza en suelos de Galicia. In Consellería de Medio Ambiente e Desenvolvemento Sostible; Xunta de Galicia: Santiago, Spain, 2009. [Google Scholar]
  30. Komonweeraket, K.; Cetin, B.; Aydilek, A.H.; Benson, C.H.; Edil, T.B. 2015. Effects of pH on the leaching mechanisms of elements from fly ashmixed soils. Fuel 1984, 140, 788–802. [Google Scholar] [CrossRef]
  31. Otero, M.; Cutillas-Barreiro, L.; Nóvoa-Muñoz, J.C.; Arias-Estévez, M.; Fernández-Sanjurjo, M.J.; Álvarez-Rodríguez, E.; Núñez-Delgado, A. Cr(VI) sorption/desorption on untreated and mussel-shell-treated soil materials: Fractionation and effects of pH and chromium concentration. Solid Earth 2015, 6, 373–382. [Google Scholar] [CrossRef] [Green Version]
  32. Choppala, G.; Kunhikrishnan, A.; Seshadri, B.; Park, J.H.; Bush, R.; Bolan, N. Comparative sorption of chromium species as influenced by pH, surface charge and organic matter content in contaminated soils. J. Geochem. Explor. 2018, 184, 255–260. [Google Scholar] [CrossRef]
  33. Yang, Z.; Liang, J.; Tang, L.; Zeng, G.; Yu, M.; Li, X.; Li, X.; Qian, Y.; Wu, H.; Luo, Y.; et al. Sorption-desorption behaviors of heavy metals by biochar-compost amendment with different ratios in contaminated wetland soil. J. Soils Sedim. 2018, 18, 1530–1539. [Google Scholar] [CrossRef]
  34. Basta, N.T.; Tabatabai, M.A. Effect of cropping systems on adsorption of metals by soils: III. Competitive adsorption. Soil Sci. 1992, 153, 331–337. [Google Scholar] [CrossRef]
  35. Gomes, P.C.; Fontes, M.P.F.; da Silva, A.G.; Mendonça, E.d.S.; Netto, A.R. Selectivity sequence and competitive adsorption of heavy metals by Brazilian soils. Soil Sci. Soc. Am. J. 2001, 65, 1115–1121. [Google Scholar] [CrossRef]
  36. Conde-Cid, M.; Fernández-Calviño, D.; Nóvoa-Muñoz, J.C.; Núñez-Delgado, A.; Fernández-Sanjurjo, M.J.; Arias-Estévez, M.; Álvarez-Rodríguez, E. Experimental data and model prediction of tetracycline adsorption and desorption in agricultural soils. Environ. Res. 2019, 177, 108607. [Google Scholar] [CrossRef]
  37. Gustafsson, J.P. Visual Minteq 3.1; KTH Royal Institute of Technology: Stockholm, Sweden, 2013. [Google Scholar]
  38. Echeverría, J.C.; Morera, M.T.; Mazkiarán, C.; Garrido, J.J. Competitive sorption of heavy metal by soils. Isotherms and fractional factorial experiments. Environ. Pollut. 1998, 101, 275–284. [Google Scholar] [CrossRef]
  39. Arias, M.; Pérez-Novo, C.; Osorio, F.; López, E.; Soto, B. Adsorption and desorption of copper and zinc in the surface layer of acid soils. J. Colloid Interface Sci. 2005, 288, 21–29. [Google Scholar] [CrossRef] [PubMed]
  40. Tiller, K.G.; Hodgson, J.F. The specific sorption of cobalt and zinc by layer silicates. In Clays and Clay Minerals; Swineford, A., Ed.; Pergamon Press: New York, NY, USA, 1962. [Google Scholar]
  41. Martínez-Cortizas, A.M.; Muñiz, I.R.; Taboada, T.; Toro, M.; Granados, I.; Giralt, S.; Pla-Rebés, S. Factors controlling the geochemical composition of Limnopolar Lake sediments (Byers Peninsula, Livingston Island, South Shetland Island, Antarctica) during the last ca. 1600 years. Solid Earth 2014, 5, 651–663. [Google Scholar] [CrossRef] [Green Version]
  42. Rosen, V.; Chen, Y. Effects of compost application on soil vulnerability to heavy metal pollution. Environ. Sci. Pollut. Res. 2018, 25, 35221–35231. [Google Scholar] [CrossRef] [PubMed]
  43. Kabata-Pendias, A.; Pendias, H. Trace Elements in Soils and Plants; CRC Press Inc.: Boca Raton, FL, USA, 1984; p. 315. [Google Scholar]
  44. Veli, S.; Alyüz, B. Adsorption of copper and zinc from aqueous solutions by using natural clay. J. Hazard. Mater. 2007, 149, 226–233. [Google Scholar] [CrossRef] [PubMed]
  45. Arias, M.; Pérez-Novo, C.; López, E.; Soto, B. Competitive adsorption and desorption of copper and zinc in acid soils. Geoderma 2006, 133, 151–159. [Google Scholar]
  46. Hossain, M.A.; Furumai, M.A.; Nakajima, F. Competitive adsorption of heavy metals in soil underlying an infiltration facility installed in an urban area. Water Sci. Technol. 2019, 59, 303–310. [Google Scholar] [CrossRef]
  47. Garrido-Rodriguez, B.; Cutillas-Barreiro, L.; Fernández-Calviño, D.; Arias-Estévez, M.; Fernández-Sanjurjo, M.J.; Álvarez-Rodríguez, E.; Núñez-Delgado, A. Competitive adsorption and transport of Cd, Cu, Ni and Zn in a mine soil amended with mussel Shell. Chemosphere 2014, 107, 379–385. [Google Scholar] [CrossRef]
  48. Pérez-Novo, C.; Bermúdez-Couso, A.; López-Periago, E.; Fernández-Calviño, D.; Arias-Estévez, M. The effect of phosphate on the sorption of copper by acid soils. Geoderma 2009, 150, 166–170. [Google Scholar] [CrossRef]
  49. Pérez-Novo, C.; Fernández-Calviño, D.; Bermúdez-Couso, A.; López-Periago, J.E.; Arias-Estévez, M. Phosphorus effect on Zn adsorption-desorption kinetics in acid soils. Chemosphere 2011, 83, 1028–1034. [Google Scholar] [CrossRef] [PubMed]
Figure 1. Single adsorption and desorption curves of Ni by soil samples (S1–S10).
Agronomy 10 01113 g001
Figure 2. Retention vs. adsorption metal amount (mg kg−1). Grey line shows the 1:1 ratio.
Agronomy 10 01113 g002
Figure 3. Competitive (coloured) and single (black) adsorption and desorption curves of Ni by soil S1, S6 and S7 samples.
Agronomy 10 01113 g003
Figure 4. Competitive (coloured) and single (black) adsorption and desorption curves of Cr for soil S1, S6 and S7 samples.
Agronomy 10 01113 g004
Table 1. Main physicochemical properties of the soil samples.
S1S2S3S4S5S6S7S8S9S10
pHW 4.04.64.84.94.96.47.55.04.74.9
pHKCl 3.03.84.24.54.25.86.94.54.34.4
OM%14141212111415102029
TC7.06.78.233.75.06.65.56.710.314.3
TN0.50.40.60.30.50.50.40.40.81.0
DOCmg kg−1123.7139.665.227.959.1111.7106.153.950.688.5
eCECcmolc kg−18.09.15.83.11.923.429.14.16.86.9
Cae1.93.41.91.70.421.427.82.13.33.7
Mge1.01.20.40.30.11.21.10.40.40.4
Ke0.10.20.20.10.10.70.10.30.20.4
Nae0.21.60.20.20.10.20.10.20.30.5
Ale4.82.73.20.91.2<0.2<0.21.12.61.9
Sand%71625047681920324631
Silt13192535166752373545
Clay16192517161428321924
pHW and pHKCl are pH measured in water and KCl, respectively; OM: organic matter content; TC: total carbon; TN: total nitrogen DOC: dissolved organic carbon; eCEC: effective cation exchange capacity; Cae, Mge, Ke, Nae, Ale: exchangeable cations; Sand, Silt and Clay are soil texture fractions.
Table 2. Results derived from Freundlich model: KF (Ln mg1−n kg−1), n (dimensionless) and R2 values from individual adsorption and desorption data.
ADSORPTIONDESORPTION-RETENTIONHISTERESIS
KFnR2KFnR2KFDES/KFADS
CuS1403.6 ± 12.50.34 ± 0.010.99749.9 ± 22.60.45 ± 0.020.971.86
S2425.2 ± 21.70.35 ± 0.020.97763.4 ± 27.60.47 ± 0.030.961.80
S3204.6 ± 12.00.36 ± 0.020.99455.3 ± 08.70.43 ± 0.010.992.23
S4240.6 ± 08.30.37 ± 0.010.99542.2 ± 00.40.43 ± 0.020.982.25
S5343.0 ± 07.10.33 ± 0.011.00599.8 ± 11.50.36 ± 0.110.991.75
S62539.8 ± 86.80.91 ± 0.040.989244.0 ± 8721.22 ± 0.060.973.64
S78407.2 ± 6541.28 ± 0.060.9819665 ± 36381.23 ± 0.090.952.34
S8347.0 ± 09.50.37 ± 0.011.00638.5 ± 09.60.39 ± 0.011.001.84
S9461.9 ± 08.50.33 ± 0.011.00783.5 ± 18.10.38 ± 0.010.981.70
S10491.4 ± 35.20.29 ± 0.020.93800.5 ± 19.70.41 ± 0.020.981.63
ZnS1115.9 ± 12.70.38 ± 0.030.9418.9 ± 07.20.64 ± 0.110.780.16
S2148.3 ± 15.40.37 ± 0.030.9413.1 ± 03.70.81 ± 0.080.920.09
S360.8 ± 09.70.39 ± 0.040.9022.1 ± 08.20.65 ± 0.130.700.36
S479.6 ± 10.20.36 ± 0.030.929.6 ± 04.50.88 ± 0.150.790.12
S5115.8 ± 14.00.33 ± 0.030.9220.8 ± 07.90.69 ± 0.120.780.18
S6700.4 ± 24.20.44 ± 0.020.98876.3 ± 46.00.37 ± 0.030.921.25
S71332.3 ± 35.50.44 ± 0.020.972416.0 ± 96.50.59 ± 0.030.971.81
S868.3 ± 08.30.42 ± 0.030.95115.2 ± 13.60.44 ± 0.050.861.69
S980.0 ± 08.80.39 ± 0.030.9526.5 ± 07.70.61 ± 0.100.800.33
S10112.4 ± 10.80.37 ± 0.020.9635.6 ± 10.20.60 ± 0.090.810.32
NiS1128.4 ± 05.30.44 ± 0.010.99229.6 ± 05.60.54 ± 0.011.001.79
S2157.4 ± 14.10.40 ± 0.020.97268.2 ± 14.90.51 ± 0.030.971.70
S346.6 ± 02.80.47 ± 0.010.9995.2 ± 06.90.60 ± 0.040.962.05
S479.8 ± 03.80.41 ± 0.010.99150.7 ± 09.00.55 ± 0.030.971.89
S589.2 ± 05.40.42 ± 0.020.99134.8 ± 06.90.57 ± 0.030.981.51
S6537.1 ± 17.00.48 ± 0.010.99976.0 ± 17.40.57 ± 0.020.991.82
S7867.1 ± 16.40.54 ± 0.010.991866.7 ± 92.50.53 ± 0.040.922.15
S861.3 ± 04.80.49 ± 0.020.99134.1 ± 09.90.52 ± 0.030.962.19
S962.0 ± 06.70.52 ± 0.030.98152.2 ± 11.50.50 ± 0.030.952.45
S10106.2 ± 18.10.38 ± 0.040.89174.7 ± 18.40.43 ± 0.050.881.65
PbS11239.8 ± 41.10.47 ± 0.030.963427.3 ± 176.10.91 ± 0.050.972.76
S22100.9 ± 70.00.74 ± 0.040.975082.4 ± 375.41.21 ± 0.070.972.42
S3673.6 ± 12.90.35 ± 0.010.991100.7 ± 17.90.40 ± 0.010.991.63
S4779.7 ± 39.20.33 ± 0.020.941646.7 ± 59.80.53 ± 0.030.952.11
S51186.2 ± 41.80.33 ± 0.020.952084.6 ± 103.20.41 ± 0.030.931.76
S6 4957.0 ± 552.10.62 ± 0.050.92NA
S7 NA
S8924.1 ± 49.70.42 ± 0.030.921890.2 ± 50.10.43 ± 0.020.982.05
S9945.1 ± 49.20.43 ± 0.030.932021.3 ± 52.70.43 ± 0.020.982.14
S101337.5 ± 82.80.45 ± 0.040.852599.9 ± 1280.41 ± 0.030.961.94
CrS1186.2 ± 14.80.31 ± 0.020.96442.5 ± 29.10.30 ± 0.040.782.38
S2135.8 ± 19.40.34 ± 0.040.90352.8 ± 25.40.30 ± 0.040.792.60
S361.3 ± 04.40.43 ± 0.020.9886.3 ± 8.80.48 ± 0.040.921.41
S441.4 ± 04.90.45 ± 0.030.96147.3 ± 7.60.36 ± 0.030.933.56
S591.2 ± 04.40.44 ± 0.010.99120.0 ± 6.20.52 ± 0.020.991.32
S625.8 ± 02.70.76 ± 0.020.99135.8 ± 6.80.66 ± 0.020.995.27
S73.3 ± 00.81.19 ± 0.050.9838.3 ± 4.41.02 ± 0.040.9811.75
S885.4 ± 03.50.45 ± 0.011.00178.0 ± 6.60.39 ± 0.020.992.09
S968.0 ± 03.10.47 ± 0.011.00128.0 ± 6.00.45 ± 0.020.981.88
S10109.1 ± 06.10.44 ± 0.010.99208.5 ± 9.10.39 ± 0.020.981.91
Table 3. Significative correlation coefficients (at 0.01 * or 0.05 ** levels) from correlation analysis between soil properties and KF values (adsorption and desorption). N = 10, except for PbADS All soils (N = 8) and S6 and S7 soils not included.
pHpHKClOMDOCeCECCaMgNaAlSandSiltClay
CuAll soilsADS0.913 **0.858 ** 0.890 **0.913 **
DES0.948 **0.891 ** 0.943 **0.967 ** −0.635 *
No. S6&S7ADS 0.709 *
DES
ZnAll soilsADS0.944 **0.881 ** 0.953 **0.972 **
DES0.939 **0.886 ** 0.912 **0.940 **
No S6&S7ADS 0.786 *
DES 0.846 **
NiAll soilsADS0.931 **0.861 ** 0.970 **0.982 ** 0.643 *
DES0.933 **0.868 ** 0.957 **0.971 **
No. S6&S7ADS 0.857 ** 0.819 *0.722 *
DES 0.847 **0.709 * 0.897 **0.748 *
PbAll soilsADS 0.828 * 0.754 *0.875 **
DES0.776 **0.672 * 0.651 *0.896 **0.863 **0.761 *
No. S6&S7ADS 0.828 * 0.754 *0.875 **
DES 0.887 ** 0.892 **0.845 **
CrAll soilsADS−0.790 **−0.869 ** −0.639 * 0.813 **0.722 *−0.724 *
DES −0.734 * 0.698 *
No. S6&S7ADS−0.766 *−0.866 ** 0.887 ** 0.800 *
DES−0.781 *−0.856 ** 0.858 ** 0.900 **
Table 4. Factor loadings of the soil properties in each principal component extracted. The loading of the component with the highest value for each soil property is in bold.
LoadingsPC1-PbPC2-CuPC3-ZnPC4-CrPC5-NiCommunality
Mge0.8520.0150.0000.0500.0360.954
Ale0.7680.0000.0530.0830.0620.966
DOC0.7320.0530.0010.0020.1690.957
pH0.7190.0400.1520.0010.0020.914
eCEC0.6730.2580.0010.0030.0190.954
His-Pb0.6480.0000.0070.1940.0040.853
OM0.0020.8870.0470.0040.0010.941
Cae0.0830.7610.0160.0570.0500.966
Ke0.0000.6670.2550.0470.0010.969
His-Cu0.0270.3930.0120.0970.1600.689
His-Zn0.0320.0060.9010.0020.0130.954
Clay0.0320.0310.8030.0110.0500.927
His-Cr0.0100.0100.0160.9490.0020.987
His-Ni0.0020.0030.1150.0000.7830.902
% of variance explained32.7222.3217.0010.729.64
Table 5. Factor scores of the extracted principal components.
ScoresPC1-PbPC2-CuPC3-ZnPC4-CrPC5-Ni
S11.84−0.63−0.46−0.14−0.06
S21.130.380.070.83−0.85
S3−0.08−0.610.02−1.101.10
S4−1.03−0.73−0.781.890.35
S5−0.96−0.87−0.67−1.16−1.42
S8−0.32−0.392.350.190.01
S9−0.100.86−0.47−0.331.57
S10−0.471.98−0.07−0.18−0.69
Table 6. Competitive adsorption results. Parameters derived from Freundlich model fitted with competitive adsorption data and parameters derived from Murali-Aylmore model fitted with single adsorption experiments.
Metal 1Metal 2
Competitive Adsorption Freundlich Metal 1 (Metal 2)Murali-Aylmore Metal 1 (Metal 2)Competitive Adsorption Freundlich Metal 2 (Metal 1)Murali-Aylmore Metal 2 (Metal 1)
KF-m1(m2)nR2am1(m2)R2KF-m2(m1)nR2am2(m1)R2
Cu (Zn)Zn (Cu)
S1339.27 ± 13.380.36 ± 0.010.990.02 ± 0.010.9884.71 ± 10.230.23 ± 0.030.829.24 ± 0.860.93
S61705.76 ± 55.130.78 ± 0.040.960.02 ± 0.000.96508.51 ± 21.450.36 ± 0.010.9814.50 ± 5.430.73
S73014.59 ± 100.760.91 ± 0.030.980.25 ± 0.020.981126.38 ± 34.500.45 ± 0.020.970.37 ± 0.200.95
Cu (Ni)Ni (Cu)
S1299.93 ± 10.170.38 ± 0.010.990.04 ± 0.010.9997.03 ± 11.210.27 ± 0.030.887.50 ± 0.580.95
S61624.25 ± 48.580.79 ± 0.040.960.02 ± 0.000.97397.88 ± 26.360.40 ± 0.020.9616.99 ± 6.200.74
S74343.61 ± 263.521.30 ± 0.070.980.08 ± 0.010.98635.11 ± 29.850.45 ± 0.020.979.11 ± 3.450.78
Cu (Pb)Pb (Cu)
S1334.83 ± 15.670.31 ± 0.010.980.96 ± 0.160.98540.61 ± 12.740.36 ± 0.010.99NANA
S62263.07 ± 89.360.90 ± 0.050.96ndnd ndnd
S74622.01 ± 249.331.07 ± 0.050.98ndnd ndnd
Cu (Cr)Cr (Cu)
S1533.81 ± 37.960.34 ± 0.020.93−0.06 ± 0.010.94281.84 ± 32.800.36 ± 0.040.88−1.03 ± 0.160.85
S62697.76 ± 65.991.18 ± 0.040.990.00 ± 0.000.955.00 ± 0.981.24 ± 0.050.99−25.82 ± 6.950.90
S72715.07 ± 215.350.99 ± 0.090.900.01 ± 0.000.970.67 ± 0.151.59 ± 0.050.99−26.44 ± 5.320.96
Zn (Ni)Ni (Zn)
S165.72 ± 04.240.40 ± 0.020.990.65 ± 0.050.99100.64 ± 07.770.33 ± 0.020.971.00 ± 0.160.87
S6546.25 ± 19.350.36 ± 0.010.980.42 ± 0.090.94438.05 ± 16.970.39 ± 0.010.990.80 ± 0.020.98
S71175.36 ± 17.800.41 ± 0.010.990.04 ± 0.010.99585.18 ± 36.890.48 ± 0.030.952.32 ± 0.570.89
Zn (Pb)Pb (Zn)
S197.49 ± 08.230.37 ± 0.020.975.24 ± 1.470.95816.52 ± 12.190.38 ± 0.011.000.04 ± 0.010.81
S6700.48 ± 25.970.42 ± 0.020.98ndnd ndnd
S71277.42 ± 52.450.46 ± 0.030.94ndnd ndnd
Zn (Cr)Cr (Zn)
S1157.54 ± 18.700.39 ± 0.030.93−0.32 ± 0.030.97209.98 ± 14.640.33 ± 0.020.97−0.08 ± 0.040.94
S6803.83 ± 22.080.47 ± 0.020.99−0.00 ± 0.000.965.48 ± 1.361.27 ± 0.060.98−5.11 ± 0.190.99
S71441.87 ± 25.430.40 ± 0.010.990.00 ± 0.000.980.94 ± 0.191.51 ± 0.040.99−8.34 ± 1.240.99
Ni (Pb)Pb (Ni)
S1138.03 ± 21.840.30 ± 0.040.8313.18 ± 1.100.98772.02 ± 15.880.39 ± 0.010.990.05 ± 0.010.84
S6444.12 ± 28.350.51 ± 0.030.96ndnd ndnd
S7737.65 ± 36.460.52 ± 0.030.96ndnd ndnd
Ni (Cr)Cr (Ni)
S1203.11 ± 21.090.35 ± 0.030.94−0.14 ± 0.070.92228.67 ± 18.090.35 ± 0.020.96−0.14 ± 0.040.89
S6550.03 ± 22.180.48 ± 0.020.98−0.00 ± 0.000.993.26 ± 0.921.37 ± 0.070.98−2.58 ± 0.100.992
S7768.96 ± 14.080.49 ± 0.010.990.01 ± 0.000.951.62 ± 0.361.35 ± 0.050.99−0.17 ± 0.730.98
Pb (Cr)Cr (Pb)
S1 0.00 ± 0.000.76238.33 ± 13.310.40 ± 0.020.98NANA
S6 ndnd44.14 ± 4.160.77 ± 0.020.99ndnd
S7 ndnd4.05 ± 0.791.28 ± 0.050.99ndnd

