Article

Comparison among Different Rewetting Strategies of Degraded Agricultural Peaty Soils: Short-Term Effects on Chemical Properties and Ecoenzymatic Activities

1
Scuola Superiore Sant’Anna, Institute of Life Sciences, Via Santa Cecilia 3, 56127 Pisa, Italy
2
Department of Agricultural Sciences, University of Sassari, Viale Italia 39, 07100 Sassari, Italy
3
National Council of Research, Research Institute on Terrestrial Ecosystem, CNR-IRET, Via Moruzzi 1, 56124 Pisa, Italy
4
Department of Agriculture, Food and Environment, University of Pisa, Via del Borghetto 80, 56124 Pisa, Italy
*
Author to whom correspondence should be addressed.
Agronomy 2020, 10(8), 1084; https://doi.org/10.3390/agronomy10081084
Submission received: 6 June 2020 / Revised: 17 July 2020 / Accepted: 23 July 2020 / Published: 27 July 2020
(This article belongs to the Special Issue Soil Degradation Prevention and Restoration at Farm and Field Scale)

Abstract

:
In 2013, a pilot experimental field of about 15 ha was set up within the basin of Lake Massaciuccoli (Tuscany, Italy) in order to compare different management strategies—a paludicultural system (PCS), a constructed wetland system (CWS), a nearly-natural wetland system (NWS)—for peatland restoration after almost a century of drainage-based agricultural use (CS). After five years, changes in peat soil quality were investigated from a chemical, biochemical, and ecoenzymatic perspective. The soil in CS was mainly characterized by oxidant conditions, higher content of overall microbial activity, low levels of easily available phosphorus for vegetation, and medium total carbon content ranging from 25.0% to 30.7%. In PCS, the levels of total carbon and the content of bioavailable P were higher, while the oxidant conditions were lower compared to the other systems. As expected, the soils in CWS and NWS were characterized by the most reduced conditions and by the highest levels of arylsulphatase activity. It was noteworthy that soils in the NWS systems were characterized by the highest level of nonavailable P. Outputs from ecoenzymatic activity confirmed the physico-chemical and biochemical results.

Graphical Abstract

1. Introduction

Peatlands are the most diffused stock of organic carbon on the planet, containing in the boreal zone up to seven times, and in the tropics up to ten times, more carbon per hectare than ecosystems on mineral soils [1].
In peatlands with an active peat production (mires), carbon accumulation is due to the higher rate of production than decomposition of biomass, involving interactions with plant productivity and carbon losses (decay, fire, leaching). Peat build-up results from the contribution of about 5–10% of the biomass annually produced and about 5% of the carbon coming from the additional carbon sink constituted by the mineral subsoil under mires [2].
Besides carbon, peatlands are important nitrogen and phosphorus stocks. The large stock of organic nitrogen present in peatlands is removed from active cycling and is not available in the short term for plant uptake [3]. Two main factors contribute to this highly effective nitrogen storage in peat and peatlands: (i) waterlogged and anaerobic conditions lead to extremely low organic matter decomposition and nutrient mineralization rates, and (ii) high C:N ratios, which first stimulate microbial growth and then nitrogen immobilization in microbial tissue [4].
The behavior of phosphorus, which is the third main element of peatland ecosystems, is more complex since the phosphate form may be more or less strongly adsorbed to Ca, Fe, and Al minerals, [5,6] depending on the environmental conditions.
For instance, phosphate is adsorbed more strongly onto Fe(III)-hydroxides than Fe(II)-hydroxides so that phosphate availability in weakly-acid to neutral conditions is affected by the redox potential, which determines the oxidation status of iron [7]. The redox potential is, in turn, dependent on oxygen availability and then on the groundwater table level.
All these hydrogeochemical aspects considered, it is evident that in these ecosystems that are largely characterized by the presence of water, hydrological conditions play a key role and a high water table level (soil saturation) represents an important driver in peatland conservation; all activities substantially altering the water table level have detrimental results. From the given background, it is clear that the damage of long-term drainage of peatlands all over the world, justified by agricultural and forestry purposes, have determined and modified the original structure of these ecosystems, affecting the biogeochemical cycles of C, N, and P and depleting the ecosystem services they are able to provide.
Among the most evident consequences are (i) the acceleration of organic-matter oxidation, with a consequent increase in greenhouse gas (GHG) emissions into the atmosphere [8,9], (ii) an increase in NO3 concentrations in pore water due to higher oxygen availability and the consequent mineralization and nitrification of organic N [10], and (iii) the mineralization of P compounds and increase in absorbed and Fe-bound P pools [11].
To counteract these effects, several restoration approaches, implying peatland rewetting, have been tested all over the world, and the impact of those practices on soil, vegetation, and biodiversity have been deeply studied [12,13,14,15,16].
In a research project started in 2013, among the restoration strategies tested in different case studies, three were chosen for the Massaciuccoli Lake basin to face both eutrophication and subsidence, namely, (i) a constructed wetland (CWS), (ii) a paludicultural system (PCS), and (iii) a nearly-natural wetland system (NWS), which were put to comparison with the conventional drainage-based management of peatlands (CS).
The reason behind the choice of the three above-mentioned systems was the comparison among systems characterized by different severities of soil handling, moving from a nearly-natural system (implying low anthropogenic pressure on the land; NWS) to PCS (implying an innovative way of cultivating peatlands) and then to CWS (a widely studied system that is quite complex to design).
The present study investigates the effects of the different management strategies on peat biogeochemical properties by highlighting the differences occurring in the soil profile (0–20, 20–40, 40–60 cm) after four years of experimentation.
Among the different parameters investigated, a consistent role in explaining the restoration process is attributed to ecoenzyme activities.
Indeed, it is already well-known that soil enzymes are the key drivers of nutrient cycling in soils and are produced by both microbes and plants as root exudates; they are responsible for decomposition, turnover and mineralization of soil organic matter [17].
The ecoenzymatic stoichiometry already used for other ecosystems [18,19] is an efficient method of indicating the relative resource limitation of soil microorganisms. It is used to assist in understanding which resources limit microbial growth and activity [19]. Recently, several authors also applied the stoichiometric approach to different peatland ecosystems [20,21,22]. In our case study, this tool helped in highlighting how differently the restoration process is occurring in the different rewetting strategies.

2. Materials and Methods

2.1. Case Study

Our case study is located in a reclamation district on the coastal plain of west-central Italy and is characterized by large-scale, intensive agriculture and the presence of a vulnerable receiving waterbody, Lake Massaciuccoli. Since the 1930s, a complex network of artificial drains and pumping stations has been used to drain the superficial aquifer and excess rainfall, thus ensuring a water table depth suitable for cultivation [23]. The lake and surrounding bogs are wetlands of international importance according to the Ramsar Convention since 2014; however, their status is seriously harmed by severe eutrophication.
Indeed, the report provided by the River Basin Management Plan of Northern Apennines District in 2016 defines the qualitative status of Lake Massaciuccoli as “not good” and “poor” for the chemical and environmental status, respectively. The lake is classified as eutrophic and heavily modified, and it presents the worst chemical/environmental conditions when compared to the other 27 lakes in Tuscany and shows a warning status when compared to other European basins.
Moreover, as a consequence of subsidence (the second major problem of the area), traditional agricultural activities are becoming severely compromised, given the increasing difficulties in maintaining an unsaturated zone for crop growth [24].
For these reasons, it was necessary to identify innovative solutions for more sustainable management of severely degraded peatlands that would be able to reduce both eutrophication and subsidence and contribute to restoring the nutrient pools of peat.

2.2. Field Site Setup

The field site is a large scale phytotreatment system (15 ha) located in Vecchiano, about 10 km from Pisa, Italy (43°49′59.5″ N; 10°19′50.7″ E), within the Migliarino San Rossore Massaciuccoli Natural Park.
The climate is Mediterranean (Csa), according to the Köppen–Geiger climate classification map [25]. Summers are dry and hot, rainfall is mainly concentrated in autumn and spring (mean annual rainfall = 945 mm), and the mean monthly air temperature at 2 m ranges from 7 °C in February to 30 °C in August (mean = 14.8 °C)
The soils of the phytotreatment system were classified as Histosol according to the USDA system [26] and as Rheic Histosol according to the FAO system [27].
The site was cultivated with maize up to 15 years before the start of the field experiment (2013) when agricultural practices were abandoned in the area, and natural succession vegetation were left to develop. The surrounding area (about 15 ha) is still cultivated with maize in a drained condition [28], which represents conventional management (CS) and thus the control of our field experiment. As already reported by [28], 15 years of agricultural abandonment did not significantly modify soil quality, as measured by its main chemical parameters, compared with maize cultivation (CS).
This 15 ha experimental area was used to compare the efficiency of three different systems in treating the eutrophic drainage water coming from a subwatershed in the reclamation district: a constructed wetland system (CWS) [29], a paludiculture system (PCS) [23], and a nearly-natural wetland system (NWS) [30].
CWS was constructed by excavating five treatment cells and linking them to each other by a short underground pipeline, which enabled the water (that is to be treated) to flow from the nearby agricultural district through the system, following a serpentine path. The average depth of the cells was about 0.40 m. The topsoil removed (≈40 cm) was used to construct the dikes to separate each cell. The system has been spontaneously colonized by several plant species, among which Phragmites australis (Cav.) Trin. ex Steud. and Typha latifolia L. are the most abundant [29].
PCS was not dammed and was crossed by a dense network of small channels (about 8 m apart) that supplied both drainage (in autumn and winter) and irrigation (in spring and summer) for the crops through lateral infiltration. The water table depth in PCS is kept higher than in the conventional cultivated areas (thanks to the weirs, which are not moved except for management needs, e.g., harvest or maintenance of drainage ditches) because of the continuous supply of water to be treated. This means the water table depth results are only dependent on the meteorological conditions (e.g., rainfalls or dry periods), which range from 0.00 to −0.05 m during the winter and from −0.10 to −0.25 m during the summer. In PCS, five plant species have been cropped: (1) Populus × canadensis Moench. var. “Oudemberg”, (2) Salix alba L. var. “Dimitrios”, (3) Arundo donax L., (4) Miscanthus × giganteus Greef et Deuter, (5) Phragmites australis (Cav.) Trin. ex Steud. [23,31].
NWS was set up as a nearly-natural rewetted area, with a surface area of 2.7 ha surrounded by small, built embankments and the topsoil (~10 cm) removed only along the area’s borders. Natural elevation differences within NWS helped in creating zones with a variable sheet of water in order to promote the colonization of a large variety of plant species. Indeed, geobotanical surveys conducted in the area showed the presence of 24 plant species, among which Phragmites australis (Cav.) Trin. ex Steud., Myriophyllum aquaticum (Vell.) Verdc., and Typha latifolia L. were the most represented [30].
The groundwater level in absolute terms (piezometric height of the water table) was the same for all the systems. The difference was that the water level in each system depended on the soil handling method used during the setting up of the systems. Thus, regardless of seasonal fluctuations (quite limited), the average groundwater levels were +0.40 m in CWS, 0.00 m in PCS, and from 0.00 to +0.40 m in NWS (accordingly to the soil level).

2.3. Peat Sampling and Lab Analyses

In February 2018, soil samples were collected at three different depths: 0–20, 20–40, 40–60 cm in each system (PCS, CWS, NWS, CS). For CWS, it was possible to sample only the deepest layer (40–60 cm) since the upper two layers were excavated and removed.
For each depth, any field sample replicate was obtained by pooling three subsamples. Thus, per each system at each depth, 9 soil samples were collected to obtain 3 field replicates (Figure 1).
Table 1 summarizes the equipment and methods used for chemical and biochemical analyses.
To investigate microbial resource limitation, ratios of different enzyme activities were calculated by the proportional activity of C-, N-, P-, and S-acquiring enzymes, according to [32], and reported in a scatterplot of ecoenzymatic stoichiometry, according to [18].

2.4. Data Analysis

Each management system was represented by just one site; thus, we assumed that differences among the sites arose from the different management strategies they were subjected to. Consequently, the variation amongst the measured chemical properties of samples collected from each site reflects within-rewetting strategy variation only.
The differences in each measured peat property amongst rewetting strategies and sampling depths by a two-way analysis of variance followed by Tukey’s post hoc test have already been published in [33].
STATISTICA 6.0 software (StatSoft Inc., Tulsa, OK, USA) was used for all statistical analyses.

3. Results

3.1. Effects of Different Strategies of Rewetting on Chemical Properties of Peat

The main differences in peat properties among the four management strategies were observed for both the upper and lower layers (Table 2).
Redox potential and pH were the only two parameters significantly changing among the different management strategies in each soil layer.
In the 0–20 cm layer, the redox potential in NWS was statistically different from that registered in PCS and CS. In both deeper layers, the redox potential registered in NWS and PCS did not differ between them, but they were statistically different from the value registered in CS.
In addition, the pH of the 0–20 cm layer was significantly higher in NWS than in PCS and CS. In the 20–40 cm layer, the pH registered in NWS was significantly different from that of CS, while in the 40–60cm layer, the pH observed in NWS, CWS, and PCS was almost similar and only differed significantly from CS.
Electrical conductivity (EC) and total phosphorus varied significantly only in the 0–20 and 40–60 cm layers.
Both the total carbon and the total nitrogen differed significantly only in the deeper layer, while for total phosphorus, significant differences were observed in both the upper and deeper layers.
With total carbon, the values registered in PCS and CWS were significantly higher than those of CS and NWS. Total nitrogen in PCS had the highest value, and it was significantly different from the values registered in CS and in NWS.
Focusing on the molar ratios between the main macronutrients investigated (C/N, C/P, N/P), they differed significantly only in the deeper layer (Table 2).

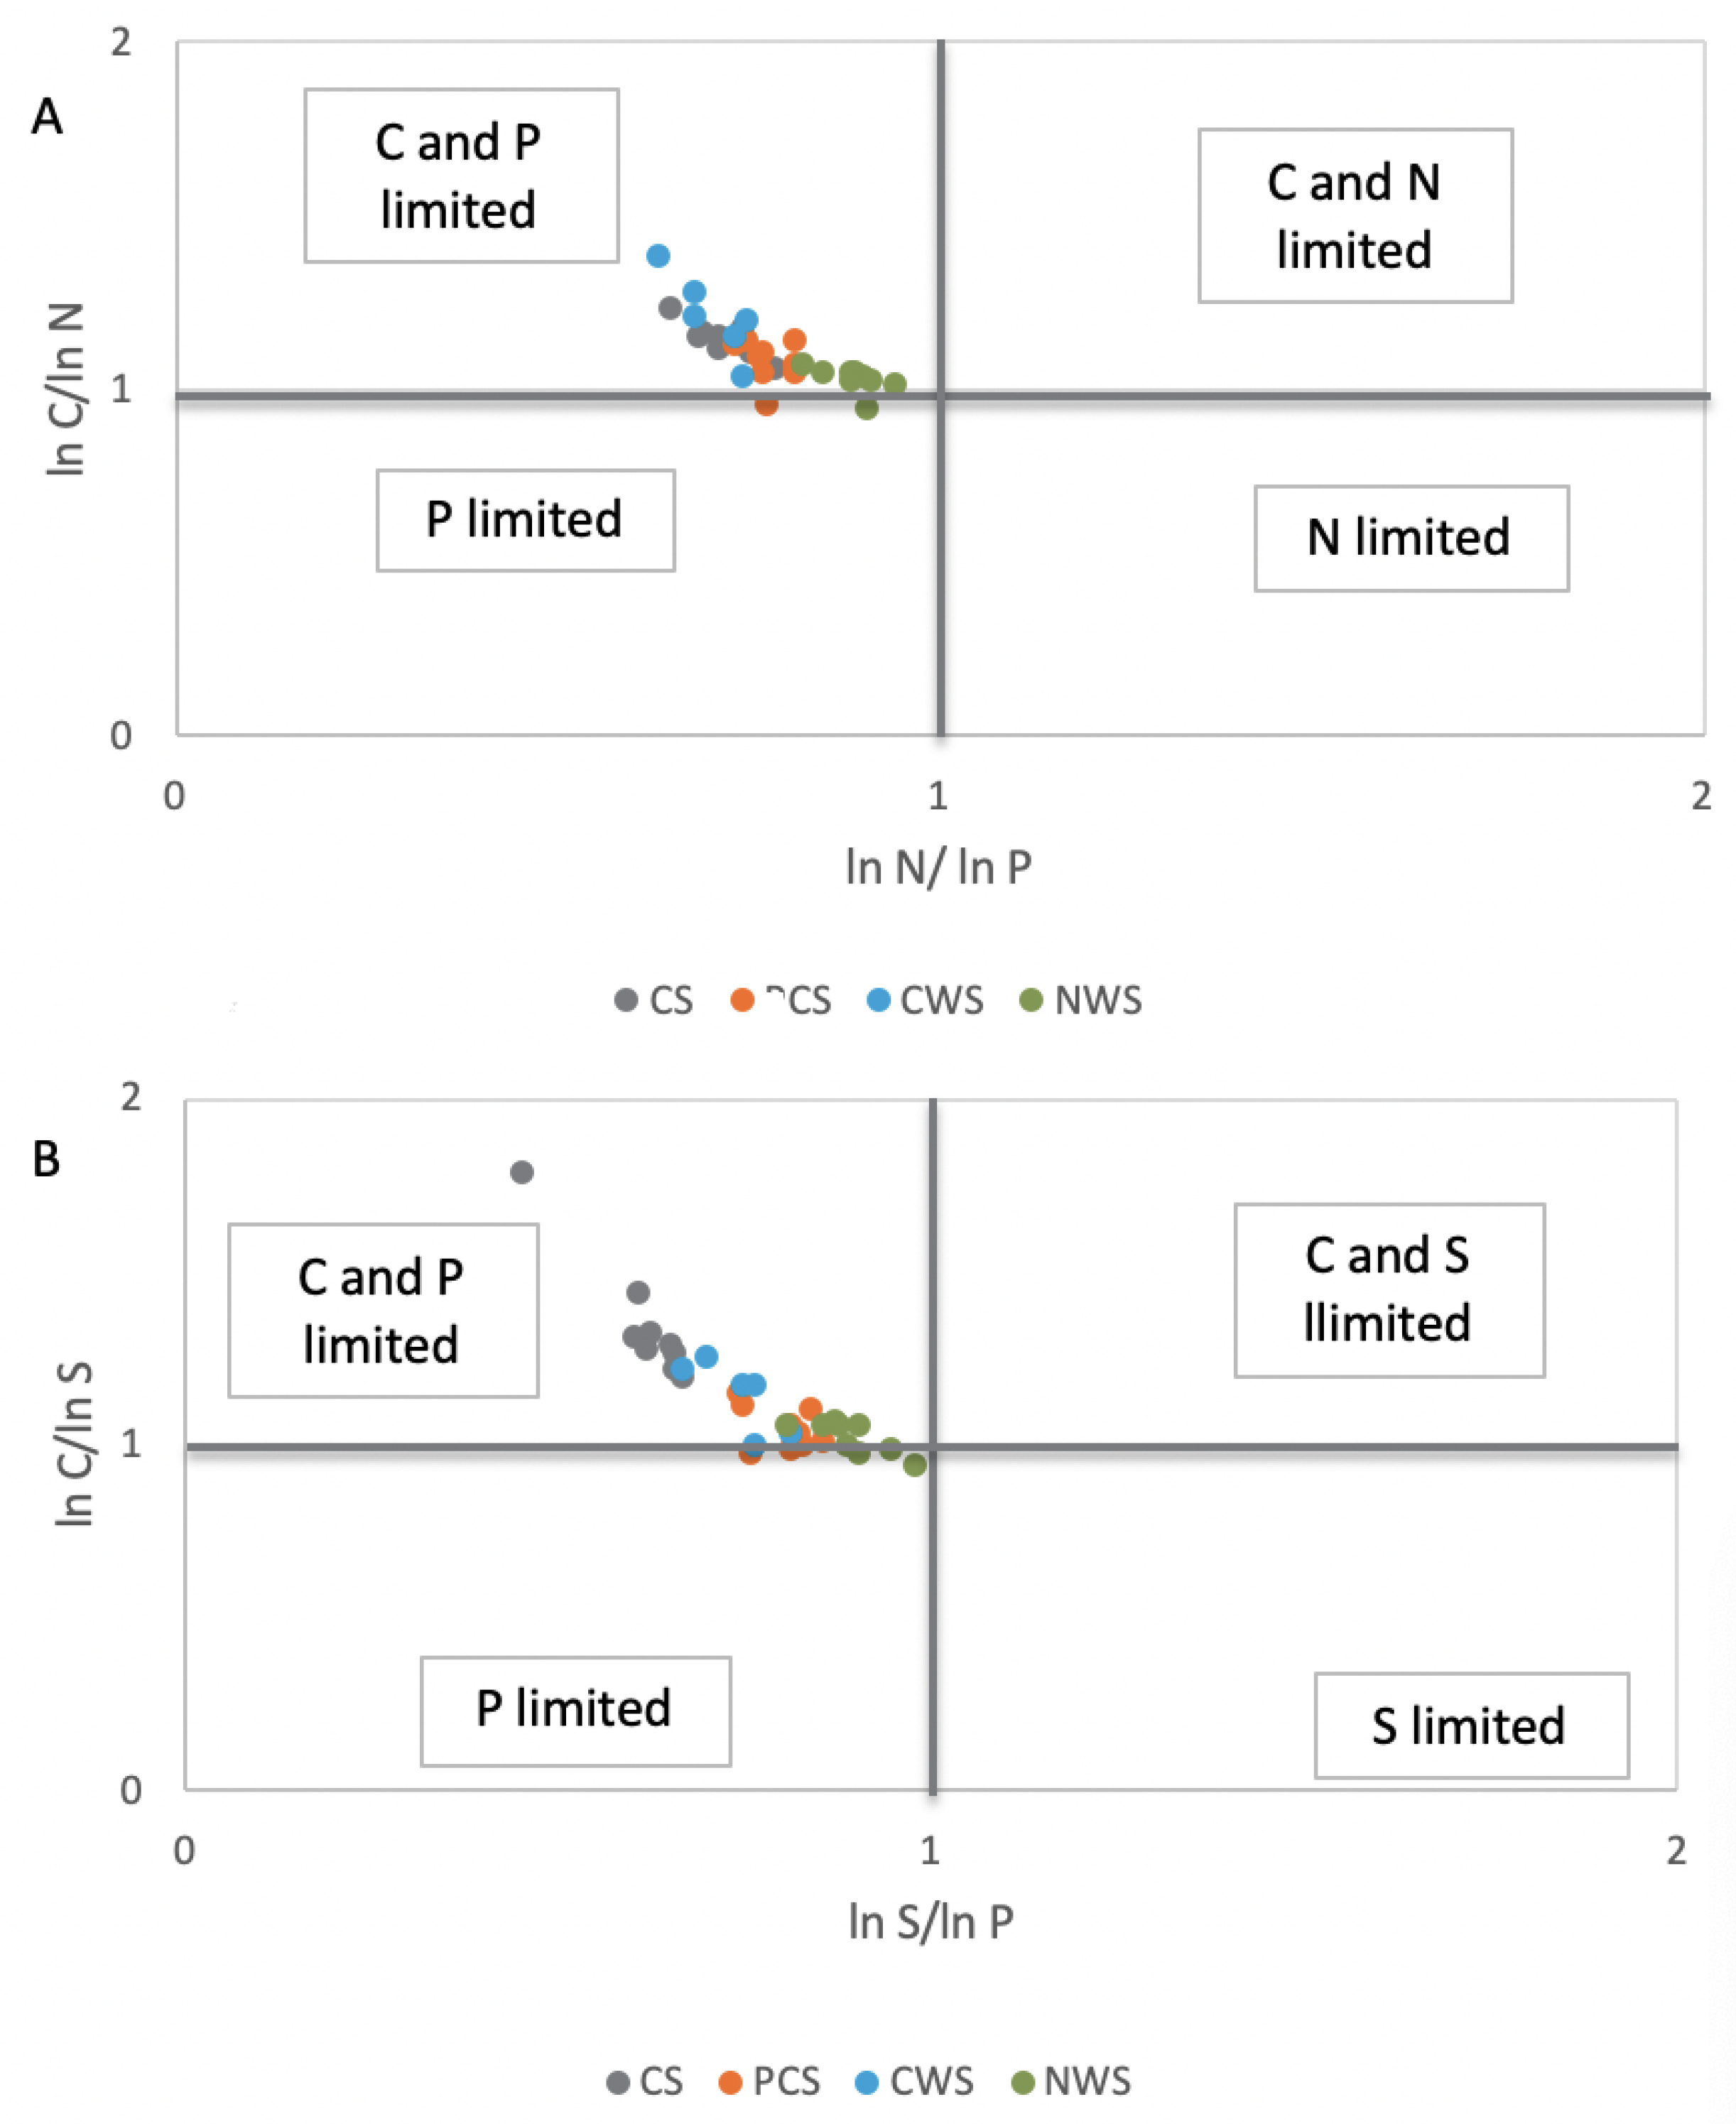
3.2. Effects of Different Strategies of Rewetting on Soil Enzymes Activities

With the exception of β-glucosidase showing significant differences among rewetting strategies only in the 0–20 cm layer, the other hydrolytic enzymes showed significant differences in all the investigated layers (Table 3).
Indeed, in the upper layer, β-glucosidase in PCS was significantly higher than that recorded in NWS and CS.
For both phosphatase and butyrate esterase, there were significant differences in each of the analyzed layers, indicating that the enzymatic activity in NWS was significantly different from that of the other strategies.
Butyrate esterase activity in each layer of NWS was statistically different from that recorded in the other management strategies.
In contrast, arylsulphatase in the first two layers showed values in CS that were statistically different from those recorded in both PCS and NWS. In the 40–60 cm layer, the value recorded in CS was statistically different from those recorded in PCS, NWS, and CWS. For protease, it had the same pattern of significance level already observed for arylsulphatase. To better quantify the enzymatic activity in each soil profile, the sum of hydrolytic enzymes was split in percentages among β-glucosidase, phosphatase, arylsulphatase and protease (Table 4). In each layer, the percentage of β-glucosidase on the overall enzymatic activity changed significantly among management strategies, while the percentage of phosphatase activity on the overall enzymatic activity was generally higher than the others (Table 4).
On the percentage of arylsulphatase, the values registered in CS were always significantly different from the ones registered in both NWS and PCS.
The scatterplots of ecoenzymatic activities show six different groups of resource allocation (P limitation, N limitation, S limitation, C and P limitation, C and N limitation, and C and S limitation) that are based on the deviation from the theoretically expected enzyme ratio of C:N:P:S (1:1:1:1) [39,40]. These plots clearly indicate that the CS system was characterized by C and P limitation (Figure 2A,B), with evidence of P limitation of microbial metabolism and a shift of the microbial community to P acquisition.

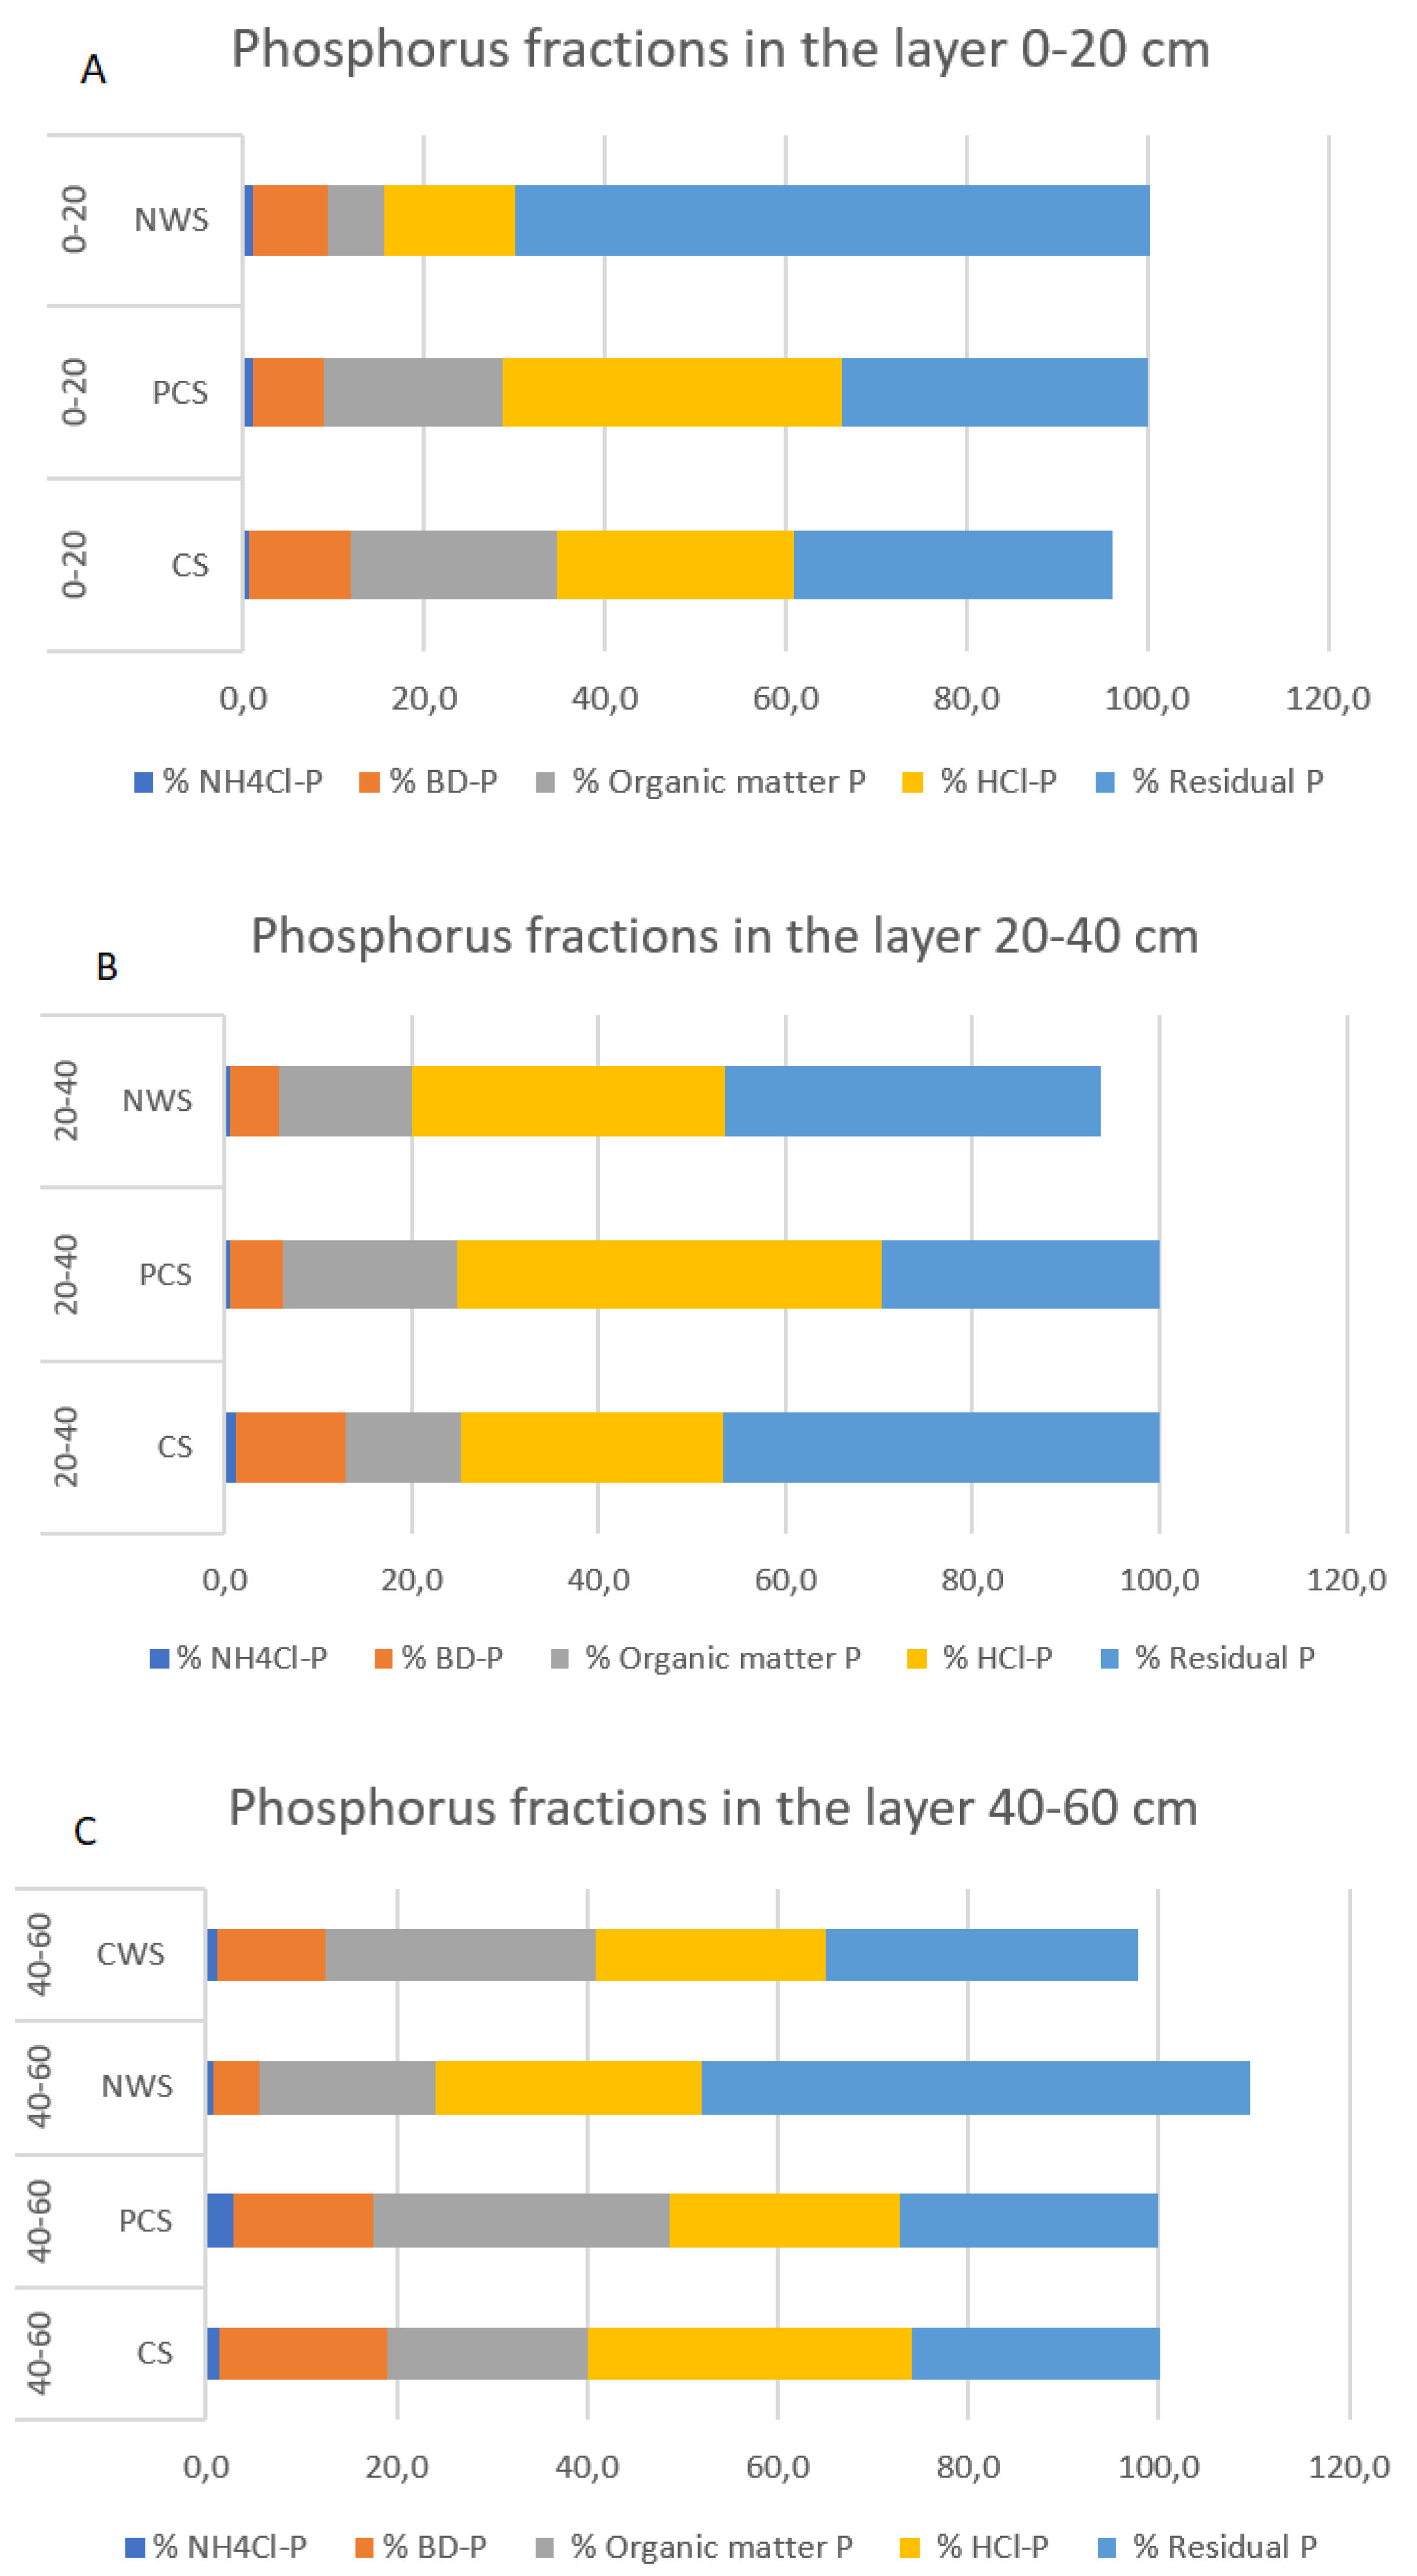
3.3. Effects of Different Strategies of Rewetting on Different Phosphorus Fractions

About the different phosphorus fractions obtained after the extraction procedure, it was possible to observe significant differences mainly in the 0–20 cm layer (Table 5).
About “desorbable P” (NH4Cl-P), the only significant difference was observed in the 0–20 cm layer between CS and PCS, while for “reductant-soluble P” (BD-P), no statistical differences were observed.
In contrast, for “base-soluble P” (NaOH-P), the quantity of extracted phosphorus in NWS was statistically different from those extracted in both CS and PCS in the 0–20 cm layer.
“Acid-soluble P” (HCl-P) in the 0–20 cm layer was statistically different between PCS and NWS.
The residual phosphorus changed significantly among the management strategies in both the 0–20 and 40–60 cm layers.
In detail, in the upper layer, the quantity registered in NWS was statistically higher than those found in both CS and PCS, while in the 40–60 cm layer, the value found in NWS was statistically different from all the values found in the other management strategies.
In Figure 3A–C, an overview of the percentage represented by each phosphorus fraction on the overall phosphorus amount, layer by layer, is reported.

3.4. Principal Component Analysis

Principal component analysis (PCA) of the data set indicated that 67.9% of the data variance was contained in three components (Table 6). PC1 (19.0%) was associated with parameters that described nutrient content, such as total carbon, total nitrogen, nutrient ratios (C/N, C/P, and N/P mol), and electrical conductivity. PC2 (29.1%) was linked to all parameters associated with biochemical properties, namely, enzymatic activities, to redox potential and humic carbon. Conversely, PC3 (19.8%) was associated with the different phosphorus fractions. The three-dimensional bubble plot (Figure 4) provides a graphical representation of the different peat samples, identifying the parameters that appear to be more associated with each management strategy.
The different management strategies are clearly discriminated in the plot: the control samples are at the bottom-left of the plot, the NWS samples are at the top-left, while the PCS samples are in the middle. In general, the 40–60 cm layers are in the right of the plot, regardless of the management strategy.

4. Discussion

The strategies of rewetting the drained peatlands and land-use change provoked marked modifications in the main chemical properties of the peats.
Redox potential is a useful indicator to evaluate the intensity of anaerobic soil conditions. All the analyzed peat samples presented values typically observed in wetland soils (−300 mV < Eh < +700 mV), as stated by [41]. Eh values higher than +300 mV, as found in CS, are typical of aerobic conditions, where oxygen is used as the dominant electron acceptor. The different management strategies resulted in marked changes in reducing–oxidizing conditions, given that PCS was in a moderately reduced state (50 mV < Eh < 300 mV), while CWS and NWS were in reduced and intensely anaerobic states (Eh < 50 mV) [41,42]. These noticeable changes in saturated soil conditions of PCS, CWS, and NWS also resulted in increased pH and electrical conductivity [41] with respect to CS. However, the relatively higher value of EC found in the deepest layer of PCS was probably due to the presence of some spot of brackish water closed to the water table level [43].
It is well known that the long-term drainage of peatlands causes considerable modifications in SOM (Soil organic matter) quality and that a significant recovery of peat characteristics is only attained over decades [42]. Hence, it was expected that the main nutrient content would not significantly differ between the different strategies since they had only been applied for five years. The values found for total nutrients (TC, TN, and TP) and their molar ratios revealed the high level of peat degradation, as reported by [41], for surface and subsurface layers (0–20 and 20–40 cm) in all strategies applied for peatland restoration. Moreover, [16] also reported no significant changes in these parameters after the rewetting of drained bogs.
The different approaches applied in rewetting the drained peatlands resulted in a different biological status, as highlighted by the trend of several soil enzymes. The activities of soil ecoenzymes provide a reliable measure of functional stoichiometry that integrates enzymatic stoichiometry (enzymatic ratios) and the metabolic theories of ecology [39,44,45,46]. In view of this concept, in the last ten years, ecoenzymatic stoichiometry has become a clear indicator of microbial nutrient demand and limitation. β-D-glucosidase (BG), L-leucine aminopeptidase (LAP), β-N-acetylglucosaminidase (NAG), phosphatase (AP), and arylsulphatase (AS) are assumed to be proxy indicators of overall C, N, P, and S acquisition [47,48], given that microorganisms optimally shape their metabolite production, namely, exoenzymes, to acquire relatively limited nutrient resources.
The pattern of the hydrolytic enzymes was in line with the results reported by [49] for an ombrotrophic bog (Mer Bleue) situated in Ottawa, Canada.
On the one hand, the relatively higher level of phosphatase activity in both cultivated systems (CS and PCS) and CWS, with respect to NWS, could be expected, given that microbial P-demand (phosphatase activity) is expected to increase when fertilization or sources of nutrient and energy are applied to peatland [50,51]. On the other hand, other authors have reported that phosphatase activities decreased under flooded conditions in rewetting drained peatlands [52] and in the presence of anoxic conditions changing iron hydr(oxide) solubility, which, in turn, influences phosphate bioavailability [53,54]. To investigate microbial resource limitation, ratios of different enzyme activities were calculated by the proportional activity of C-, N-, P-, and S-acquiring enzymes, according to [32], and reported in a scatterplot of ecoenzymatic stoichiometry, according to [23]. The scatterplots show six different groups of resource allocation (P limitation, N limitation, S limitation, C and P limitation, C and N limitation, and C and S limitation), which are based on the deviation from the theoretically expected enzyme ratio of C:N:P:S (1:1:1:1), [20,21,22,39,40,55]. The scatter plots of ecoenzymatic stoichiometry indicated that the CS system was characterized by C and P limitation, with evidence for P limitation of microbial metabolism and a shift of the microbial community to P acquisition. It was noteworthy that the microbial metabolisms of PCS and NWS were in a condition of biogeochemical equilibrium between the availability of nutrients and the resource allocation of microorganisms. Moreover, it has to be considered that the peat soils with NWS management were also in equilibrium for the S cycle. A significantly higher level in arylsulfatase activity was noticed at the sites where there was less redox potential; this finding was also noticed by [56] for paddy-field soils. This fact is probably due to sulfate reduction that is energetically favorable with respect to methanogenesis and fermentative processes and caused by redox reactions in anaerobic conditions [57]. The anaerobic and anoxic conditions in NWS had probably influenced the content of humic carbon in the peatlands, which resulted in a higher percentage of TC, with respect to the other management strategies applied. Humic substances are, in fact, identified as organic terminal electron acceptors, which can be preferentially used by microbes during anaerobic respiration in peatlands [58]. The level of overall microbial activity, which can be inferred by the level of butyrate esterase activity [59], revealed that NWS was in a less active state, with respect to the other systems. This less active state probably saved humic carbon from anaerobic C mineralization, resulting in a significantly higher value with respect to literature values reported for natural peatlands (16–25% HC/TOC, [60]).
Moreover, the lower microbial activity and related hydrolytic enzyme activities for C, P, and N cycles, the anoxic state, together with the high content of humic carbon, are all conditions that seemed to give evidence of the “enzymic latch theory” proposed by [61,62,63]. The enzymic latch theory implies that the increase in phenols, due to a decrease of phenoloxidase activity, inhibits the activity of hydrolytic enzymes, and thereby facilitates the accumulation of organic matter. In recent years, this theory has been widely discussed, with studies that have provided both positive and negative evidence [53,64]. Although the present research is focused on verifying this theory, the differences found seemed to provide evidence for the recovery of the “enzymic latch” in NWS with respect to CS.
Among the different macronutrients studied in the ecosystems, phosphorus is crucial in restoration processes in peatland. Indeed, with peatland rewetting, there is a considerable risk of P mobilization and eutrophication of the peatland and downstream areas [35]. Several authors have proposed the removal of the most degraded upper layer, namely, topsoil removal (TSR), in order to counteract this effect [65,66]. This shrewd move was considered in this study, although with different technical precautions for each rewetting strategy [17,29,30]. Results from P fractionation confirmed that the risk of P mobilization was mitigated since the most mobile fractions (NH4-P; BD-P) were in insignificant and minor quantities, especially in NWS with respect to CS. This was in line with the P-acquiring enzyme result, thus highlighting that the system followed the evolutionary–economic principles of balance between resource demand and supply [67]. The pattern of P fractionation of the CS system was similar to the value found by [35] for highly degraded peats (van Post degree H10), while PCS and CWS were comparable to low degradation peats (H3). The results for NWS were instead comparable to pristine peatlands (H1), thus confirming the good status of peats in NWS.

5. Conclusions

Peatland restoration and rewetting represent a global urgency, given the importance of the nutrient stocks that these ecosystems store.
Nevertheless, we cannot expect that restoration can provide immediate results after management changes.
Our experiment tried to focus on what can already be captured after five years from the beginning of rewetting. From this short-term restoration perspective, it was already possible to highlight different pathways for each of the rewetting strategies taken into account.
The paludicultural system (PCS), aimed at keeping the agricultural identity of the catchment and characterized by almost permanently saturated soil, showed a condition of biogeochemical equilibrium between the availability of nutrients and the resource allocation of microorganisms. This result is particularly interesting since it seems that this strategy is able to cope with recovery and productive issues.
The same condition was observed in the natural wetland system (NWS), which represents the rewetting strategy with the lowest anthropogenic impact on the land. In this specific case, it was possible to report the highest ratio between humic carbon over total carbon compared to the other management strategies due to the reducing conditions present. Moreover, it showed the “best conservation pattern” of P fractions in terms of the reduction of phosphorous mobility.
From the ecoenzymatic scatter plot, the constructed wetland (CWS), representing the most studied system in literature for phytotreatment purposes, seems to be the system farthest from a recovered equilibrium.
From this short-term analysis of management changes in a drained peatland, there is an evident change in ecoenzymatic activities, mainly suggesting a change in microbial community that could contribute to changes in the pool of the main macronutrients in the coming years.
For that reason, periodic measurements will be required in the future to assess the success of the restoration and observe further details that would be interesting to explore from a 10- or 15-year perspective.

Author Contributions

Conceptualization, V.G., N.S., G.M., and E.B.; methodology, V.G., N.S., G.M., E.P., C.M., and S.D.; software, E.P.; formal analysis, E.P. and V.G.; resources, E.B., G.M., and N.S.; writing—original draft preparation, V.G. and E.P.; writing—review and editing, E.P., V.G., N.S., and G.M.; supervision, E.B. and N.S.; project administration, E.B. and N.S.; funding acquisition, E.B. and N.S. All authors have read and agreed to the published version of the manuscript.

Funding

This study was supported by the “Consorzio di Bonifica Versilia Massaciuccoli”, later the “Consorzio di Bonifica 1 Toscana Nord”, and was funded by the “Regione Toscana”.

Conflicts of Interest

The authors declare no conflict of interest.

References

  1. Joosten, H. Peatlands, Climate Change Mitigation and Biodiversity Conservation: An Issue Brief on the Importance of Peatlands for Carbon and Biodiversity Conservation and the Role of Drained Peatlands as Greenhouse Gas Emission Hotspots; Nordic Council of Ministers: Copenhagen, Denmark, 2015; Volume 2015727. [Google Scholar]
  2. Joosten, H.; Clarke, D. Wise Use of Mires and Peatlands Background and Principles Including A Framework for Decision-Making; International Mire Conservation Group and International Peat Society: Saarijarvi, Finland, 2002. [Google Scholar]
  3. Lamb, D. Patterns of nitrogen mineralization in the forest floor of stands of pinus radiata on different soils. J. Ecol. 1975, 63, 615. [Google Scholar] [CrossRef]
  4. Damman, A.W.H. Regulation of nitrogen removal and retention in Sphagnum bogs and other peatlands. Oikos 1988, 51, 291. [Google Scholar] [CrossRef]
  5. Liu, H.; Zak, D.; Rezanezhad, F.; Lennartz, B. Soil degradation determines release of nitrous oxide and dissolved organic carbon from peatlands. Environ. Res. Lett. 2019, 14. [Google Scholar] [CrossRef]
  6. Nichols, D.S.; Keeney, D.R. Nitrogen and phosphorus release from decaying water milfoil. Hydrobiologia 1973, 42, 509–525. [Google Scholar] [CrossRef]
  7. Richardson, C.J.; Marshall, P.E. Processes controlling movement, storage, and export of phosphorus in a fen peatland. Ecol. Monogr. 1986, 56, 279–302. [Google Scholar] [CrossRef]
  8. Zak, D.; Gelbrecht, J. The mobilisation of phosphorus, organic carbon and ammonium in the initial stage of fen rewetting (a case study from NE Germany). Biogeochemistry 2007, 85, 141–151. [Google Scholar] [CrossRef]
  9. Wichtmann, W.; Wichmann, S. Environmental, social and economic aspects of a sustainable biomass production. J. Sustain. Energy Environ. Spec. Issue. 2011, 77–81. [Google Scholar]
  10. Tiemeyer, B.; Frings, J.; Kahle, P.; Köhne, S.; Lennartz, B. A comprehensive study of nutrient losses, soil properties and groundwater concentrations in a degraded peatland used as an intensive meadow—Implications for re-wetting. J. Hydrol. 2007, 345, 80–101. [Google Scholar] [CrossRef]
  11. Zak, D.; Gelbrecht, J.; Steinberg, C.E.W. Phosphorus Retention at the Redox Interface of Peatlands Adjacent to Surface Waters in Northeast Germany. Biogeochemistry 2004, 70, 357–368. [Google Scholar] [CrossRef]
  12. Budiman, I.; Sari, E.N.; Hadi, E.E.; Siahaan, H.; Januar, R.; Hapsari, R.D. Progress of paludiculture projects in supporting peatland ecosystem restoration in Indonesia. Glob. Ecol. Conserv. 2020, 23, e01084. [Google Scholar] [CrossRef]
  13. Cougnon, M.; De Frenne, P.; Bommelé, L.; De Cauwer, B.; Verheyen, K.; Reheul, D. The short term agronomic impact of raising canal water levels in grassland areas: A case study in the Belgian polders. Agric. Ecosyst. Environ. 2011, 144, 159–166. [Google Scholar] [CrossRef]
  14. Nurulita, Y.; Adetutu, E.M.; Gunawan, H.; Zul, D.; Ball, A.S. Restoration of tropical peat soils: The application of soil microbiology for monitoring the success of the restoration process. Agric. Ecosyst. Environ. 2016, 216, 293–303. [Google Scholar] [CrossRef]
  15. Peacock, M.; Gauci, V.; Baird, A.; Burden, A.; Chapman, P.; Cumming, A.; Evans, J.G.; Grayson, R.; Holden, J.; Kaduk, J.; et al. The full carbon balance of a rewetted cropland fen and a conservation-managed fen. Agric. Ecosyst. Environ. 2019, 269, 1–12. [Google Scholar] [CrossRef]
  16. Urbanová, Z.; Straková, P.; Kastovska, E. Response of peat biogeochemistry and soil organic matter quality to rewetting in bogs and spruce swamp forests. Eur. J. Soil Boil. 2018, 85, 12–22. [Google Scholar] [CrossRef] [Green Version]
  17. Allison, S.D. Cheaters, diffusion and nutrients constrain decomposition by microbial enzymes in spatially structured environments. Ecol. Lett. 2005, 8, 626–635. [Google Scholar] [CrossRef]
  18. Hill, B.H.; Elonen, C.M.; Seifert, L.R.; May, A.A.; Tarquinio, E. Microbial enzyme stoichiometry and nutrient limitation in US streams and rivers. Ecol. Indic. 2012, 18, 540–551. [Google Scholar] [CrossRef]
  19. Chen, H.; Li, D.; Xiao, K.; Wang, K. Soil microbial processes and resource limitation in karst and non-karst forests. Funct. Ecol. 2018, 32, 1400–1409. [Google Scholar] [CrossRef]
  20. Hill, B.; Elonen, C.; Jicha, T.; Kolka, R.; Lehto, L.; Sebestyen; Seifert-Monson, L. Ecoenzymatic stoichiometry and microbial processing of organic matter in northern bogs and fens reveals a common P-limitation between peatland types. Biogeochemistry 2014, 120, 203–224. [Google Scholar]
  21. Li, T.; Bu, Z.; Liu, W.; Zhang, M.; Peng, C.; Zhu, Q.; Shi, S.; Wang, M. Weakening of the ‘enzymatic latch’ mechanism following long-term fertilization in a minerotrophic peatland. Soil Biol. Biochem. 2020, 136, 107528. [Google Scholar] [CrossRef]
  22. Yan, Z.; Li, Y.; Wu, H.; Zhang, K.; Hao, Y.; Wang, J.; Zhang, X.; Yan, L.; Kang, X. Different responses of soil hydrolases and oxidases to extreme drought in an alpine peatland on the Qinghai-Tibet Plateau, China. Eur. J. Soil Boil. 2020, 99, 103195. [Google Scholar] [CrossRef]
  23. Giannini, V.; Silvestri, N.; Dragoni, F.; Pistocchi, C.; Sabbatini, T.; Bonari, E. Growth and nutrient uptake of perennial crops in a paludicultural approach in a drained Mediterranean peatland. Ecol. Eng. 2017, 103, 478–487. [Google Scholar] [CrossRef]
  24. Pistocchi, C.; Silvestri, N.; Rossetto, R.; Sabbatini, T.; Guidi, M.; Baneschi, I.; Bonari, E.; Trevisan, D. A Simple Model to Assess Nitrogen and Phosphorus Contamination in Ungauged Surface Drainage Networks: Application to the Massaciuccoli Lake Catchment, Italy. J. Environ. Qual. 2012, 41, 544–553. [Google Scholar] [CrossRef] [PubMed]
  25. Kottek, M.; Grieser, J.; Beck, C.; Rudolf, B.; Rubel, F. World Map of the Köppen-Geiger climate classification updated. Meteorol. Z. 2006, 15, 259–263. [Google Scholar] [CrossRef]
  26. USDA-SCS Agric. Soil Survey Staff. In Soil Taxonomy: A Basic System of Soil Classification for Making and Interpreting Soil Surveys; U.S. Govt. Print. Office: Washington, DC, USA, 1975; Agric. Handb., Number 436. [Google Scholar]
  27. IUSS Working Group WRB. World Reference Base for Soil Resources; World. Soil Resources Reports, Number 103; FAO: Rome, Italy, 2006. [Google Scholar]
  28. Pellegrino, E.; Bosco, S.; Ciccolini, V.; Pistocchi, C.; Sabbatini, T.; Silvestri, N.; Bonari, E. Agricultural abandonment in Mediterranean reclaimed peaty soils: Long-term effects on soil chemical properties, arbuscular mycorrhizas and CO2 flux. Agric. Ecosyst. Environ. 2015, 199, 164–175. [Google Scholar] [CrossRef]
  29. Giannini, V.; Bertacchi, A.; Bonari, E.; Silvestri, N. Recolonisation by Spontaneous Vegetation of a Rewetted Peatland after Topsoil Removal: A Focus on Biomass Production and Nutrient Uptake. Wetlands 2019, 39, 1079–1087. [Google Scholar] [CrossRef]
  30. Giannini, V.; Bertacchi, A.; Bonari, E.; Silvestri, N. Rewetting in Mediterranean reclaimed peaty soils and its potential for phyto-treatment use. J. Environ. Manag. 2018, 208, 92–101. [Google Scholar] [CrossRef] [Green Version]
  31. Silvestri, N.; Giannini, V.; Dragoni, F.; Bonari, E. A multi-adaptive framework for the crop choice in paludicultural cropping systems. Ital. J. Agron. 2016, 11, 69–76. [Google Scholar] [CrossRef] [Green Version]
  32. Moorhead, D.L.; Sinsabaugh, R.L.; Hill, B.H.; Weintraub, M.N. Vector analysis of ecoenzyme activities reveal constraints on coupled C, N and P dynamics. Soil Boil. Biochem. 2016, 93, 1–7. [Google Scholar] [CrossRef]
  33. Könönen, M.; Jauhiainen, J.; Laiho, R.; Kusin, K.; Vasander, H. Physical and chemical properties of tropical peat under stabilised land uses. Mires Peat 2015, 16, 1–13. [Google Scholar]
  34. Murphy, J.; Riley, J. A modified single solution method for the determination of phosphate in natural waters. Anal. Chim. Acta 1962, 27, 31–36. [Google Scholar] [CrossRef]
  35. Zak, D.; Gelbrecht, J.; Wagner, C.; Steinberg, C.E.W. Evaluation of phosphorus mobilization potential in rewetted fens by an improved sequential chemical extraction procedure. Eur. J. Soil Sci. 2008, 59, 1191–1201. [Google Scholar] [CrossRef]
  36. Ciavatta, C.; Govi, M.; Antisari, L.; Sequi, P. Characterization of humified compounds by extraction and fractionation on solid polyvinylpyrrolidone. J. Chromatogr. A 1990, 509, 141–146. [Google Scholar] [CrossRef]
  37. Vepsäläinen, M.; Kukkonen, S.; Vestberg, M.; Sirviö, H.; Niemi, R.M. Application of soil enzyme activity test kit in a field experiment. Soil Boil. Biochem. 2001, 33, 1665–1672. [Google Scholar] [CrossRef]
  38. Marx, M.-C.; Wood, M.; Jarvis, S. A microplate fluorimetric assay for the study of enzyme diversity in soils. Soil Boil. Biochem. 2001, 33, 1633–1640. [Google Scholar] [CrossRef]
  39. Sinsabaugh, R.L.; Hill, B.H.; Shah, J.J.F. Ecoenzymatic stoichiometry of microbial organic nutrient acquisition in soil and sediment. Nature 2009, 462, 795–798. [Google Scholar] [CrossRef]
  40. Fujita, K.; Miyabara, Y.; Kunito, T. Microbial biomass and ecoenzymatic stoichiometries vary in response to nutrient availability in an arable soil. Eur. J. Soil Boil. 2019, 91, 1–8. [Google Scholar] [CrossRef]
  41. Inglett, P.; Reddy, K.; Corstanje, R. Anaerobic Soils: Encyclopedia of Soils in the Environment; Elsevier: Amsterdam, The Netherlands, 2005; pp. 72–78. [Google Scholar]
  42. Harpenslager, S.F.; Elzen, E.V.D.; Kox, M.A.R.; Smolders, A.J.; Ettwig, K.F.; Lamers, L.P. Rewetting former agricultural peatlands: Topsoil removal as a prerequisite to avoid strong nutrient and greenhouse gas emissions. Ecol. Eng. 2015, 84, 159–168. [Google Scholar] [CrossRef]
  43. Barbagli, A. Analisi delle Interazioni Acqua-Suolo nella Fitodepurazione delle Acque di Drenaggio e nella Ricarica delle Falde Analysis of Water-Soil Interaction in Drainage Water Phyto-Treatment and in Aquifer Recharge Schemes. Ph.D. Thesis, Scuola Superiore Sant’Anna, Pisa, Italy, 2017. [Google Scholar]
  44. Höll, B.S.; Fiedler, S.; Jungkunst, H.F.; Kalbitz, K.; Freibauer, A.; Drösler, M.; Stahr, K. Characteristics of dissolved organic matter following 20 years of peatland restoration. Sci. Total Environ. 2009, 408, 78–83. [Google Scholar] [CrossRef]
  45. Chen, H.; Li, D.; Mao, Q.; Xiao, K.; Wang, K. Resource limitation of soil microbes in karst ecosystems. Sci. Total Environ. 2019, 650, 241–248. [Google Scholar] [CrossRef]
  46. Zhang, Y.; Sun, C.; Chen, Z.; Zhang, G.; Chen, L.; Wu, Z. Stoichiometric analyses of soil nutrients and enzymes in a cambisol soil treated with inorganic fertilizers or manures for 26 years. Geoderma 2019, 353, 382–390. [Google Scholar] [CrossRef]
  47. Sinsabaugh, R.S. Enzymic analysis of microbial pattern and process. Boil. Fertil. Soils 1994, 17, 69–74. [Google Scholar] [CrossRef]
  48. Bünemann, E.K.; Condron, L.M. Phosphorus and Sulphur Cycling in Terrestrial Ecosystems. In Soil Biology; Springer: Berlin/Heidelberg, Germany, 2007; Volume 10, pp. 65–92. [Google Scholar]
  49. Pinsonneault, A.; Moore, T.R.; Roulet, N.T.; Lapierre, J. Biodegradability of Vegetation-Derived Dissolved Organic Carbon in a Cool Temperate Ombrotrophic Bog. Ecosystems 2016, 19, 1023–1036. [Google Scholar] [CrossRef]
  50. Pinsonneault, A.; Moore, T.R.; Roulet, N.T. Effects of long-term fertilization on peat stoichiometry and associated microbial enzyme activity in an ombrotrophic bog. Biogeochemistry 2016, 129, 149–164. [Google Scholar] [CrossRef]
  51. Brouns, K.; Keuskamp, J.A.; Potkamp, G.; Verhoeven, J.T.; Hefting, M. Peat origin and land use effects on microbial activity, respiration dynamics and exo-enzyme activities in drained peat soils in the Netherlands. Soil Boil. Biochem. 2016, 95, 144–155. [Google Scholar] [CrossRef]
  52. Romanowicz, K.J.; Kane, E.S.; Potvin, L.R.; Daniels, A.L.; Kolka, R.K.; Lilleskov, E.A. Understanding drivers of peatland extracellular enzyme activity in the PEATcosm experiment: Mixed evidence for enzymic latch hypothesis. Plant Soil 2015, 397, 371–386. [Google Scholar] [CrossRef]
  53. Saraswati, S.; Parsons, C.T.; Strack, M. Access roads impact enzyme activities in boreal forested peatlands. Sci. Total Environ. 2019, 651, 1405–1415. [Google Scholar] [CrossRef]
  54. Parsons, C.T.; Rezanezhad, F.; David, W.; David, W.; O’Connell; Van Cappellen, P.; O’Connell, D.W. Sediment phosphorus speciation and mobility under dynamic redox conditions. Biogeosciences 2017, 14, 3585–3602. [Google Scholar] [CrossRef] [Green Version]
  55. Wang, S.; Zhou, K.; Mori, T.; Mo, J.; Zhang, W. Effects of phosphorus and nitrogen fertilization on soil arylsulfatase activity and sulfur availability of two tropical plantations in southern China. For. Ecol. Manag. 2019, 453, 117613. [Google Scholar] [CrossRef]
  56. Kunito, T.; Shiroma, T.; Moro, H.; Sumi, H. Annual variation in soil enzyme activity in a paddy field: Soil temperature and nutrient availability are important for controlling enzyme activities. Appl. Environ. Soil Sci. 2018, 2018, 1–7. [Google Scholar] [CrossRef]
  57. Lu, S.; Han, S.; Du, Y.; Liu, H.; Nie, H.; Luo, X.; Huang, Q.; Chen, W. The shift of sulfate-reducing bacterial communities from the upland to the paddy stage in a rapeseed-rice rotation system, and the effect from the long-term straw returning. Appl. Soil Ecol. 2018, 124, 124–130. [Google Scholar] [CrossRef]
  58. Ye, R.; Jin, Q.; Bohannan, B.; Keller, J.K.; McAllister, S.A.; Bridgham, S.D. pH controls over anaerobic carbon mineralization, the efficiency of methane production, and methanogenic pathways in peatlands across an ombrotrophic–minerotrophic gradient. Soil Boil. Biochem. 2012, 54, 36–47. [Google Scholar] [CrossRef]
  59. Wittmann, C.; Kähkönen, M.A.; Ilvesniemi, H.; Kurola, J.; Salkinoja-Salonen, M.S. Areal activities and stratification of hydrolytic enzymes involved in the biochemical cycles of carbon, nitrogen, sulphur and phosphorus in podsolized boreal forest soils. Soil Boil. Biochem. 2004, 36, 425–433. [Google Scholar] [CrossRef]
  60. Grasset, C.; Rodriguez, C.; Delolme, C.; Marmonier, P.; Bornette, G. Can soil organic carbon fractions be used as functional indicators of wetlands? Wetlands 2017, 37, 1195–1205. [Google Scholar] [CrossRef]
  61. Freeman, C.; Fenner, N.; Shirsat, A.H. Peatland geoengineering: An alternative approach to terrestrial carbon sequestration. Philos. Trans. R. Soc. A Math. Phys. Eng. Sci. 2012, 370, 4404–4421. [Google Scholar] [CrossRef] [PubMed]
  62. Freeman, C.; Ostle, N.; Kang, H.; Ostle, N. An enzymic ’latch’ on a global carbon store. Nature 2001, 409, 149. [Google Scholar] [CrossRef] [PubMed]
  63. Freeman, C.; Ostle, N.; Fenner, N.; Kang, H. A regulatory role for phenol oxidase during decomposition in peatlands. Soil Boil. Biochem. 2004, 36, 1663–1667. [Google Scholar] [CrossRef]
  64. Zak, D.; Roth, C.; Unger, V.; Goldhammer, T.; Fenner, N.; Freeman, C.; Jurasinski, G. Unraveling the importance of polyphenols for microbial carbon mineralization in rewetted riparian peatlands. Front. Environ. Sci. 2019, 7, 147. [Google Scholar] [CrossRef]
  65. Emsens, W.-J.; Aggenbach, C.J.; Smolders, A.J.; Van Diggelen, R. Topsoil removal in degraded rich fens: Can we force an ecosystem reset? Ecol. Eng. 2015, 77, 225–232. [Google Scholar] [CrossRef]
  66. Zak, D.; Meyer, N.; Cabezas, A.; Gelbrecht, J.; Mauersberger, R.; Tiemeyer, B.; Wagner, C.; McInnes, R. Topsoil removal to minimize internal eutrophication in rewetted peatlands and to protect downstream systems against phosphorus pollution: A case study from NE Germany. Ecol. Eng. 2017, 103, 488–496. [Google Scholar] [CrossRef]
  67. Allison, S.D.; Weintraub, M.N.; Gartner, T.B.; Waldrop, M.P. Evolutionary-Economic Principles as Regulators of Soil Enzyme Production and Ecosystem Function. In Heavy Metal Contamination of Soils; Springer: Berlin/Heidelberg, Germany, 2010; Volume 22, pp. 229–243. [Google Scholar]
Figure 1. Overview of the experimental field (CWS: constructed wetland system, PCS: paludiculture system, NWS: natural wetland system, CS: conventional system). For each system, sampling points are represented with different shapes.
Agronomy 10 01084 g001
Figure 2. Scatterplots of soil ecoenzymatic stoichiometry for studied sites. (A) Proteases/phosphatase (N-acquiring enzymes/P-acquiring enzymes) as x-axis, and β-glucosidase/proteases (C-acquiring enzymes/N-acquiring enzymes) as y-axis. (B) Arylsulphatase/phosphatase (S-acquiring enzymes/P-acquiring enzymes) as x-axis, and β-glucosidase/arylsulphatase (C-acquiring enzymes/S-acquiring enzymes) as y-axis. CS, in grey color; PCS, in orange color; CWS, in light blue color; NWS in green color.
Agronomy 10 01084 g002
Figure 3. Phosphorus fractions for different soil layers and management. (A) Phosphorus fractions in the 0–20 cm layer; (B) phosphorus fractions in the 20–40 cm layer; (C) phosphorus fractions in the 40–60 cm layer.
Agronomy 10 01084 g003
Figure 4. Principal component analysis. Bubble-plot of scores: PC1 (x-axis) vs. PC2 (y-axis) vs. PC3 (area of each bubble). CS, in grey color; PCS, in orange color; CWS, in light blue color; NWS, in green color. PC3 positive values, white background with colorful square lines; PC3 negative values, colored background with white square lines. Label a: 0–20 cm layer; label b: 20–40 cm layer; label c: 40–60 cm layer.
Agronomy 10 01084 g004
Table 1. Methods and equipment for soil analyses.
ParametersMethodsInstruments
C, H, NGas chromatography after dry combustion at 1150 °C DIN EN 15104 (2010)LECO Truspec CHN Analyzer (LECO Corporation, Saint Joseph, Michigan, USA)
Total P[34]Spectrophotometer—UNICAM UV 500 Thermo (Thermo Fisher Scientific, Waltham, Massachusetts, USA)
P fractionation[35]Spectrophotometer—UNICAM UV 500 Thermo (Thermo Fisher Scientific, Waltham, Massachusetts, USA)
Redox potential—ORPRedox potential was measured in a slurry of soil:water (1:1, w/v)InLab Redox Pro Argenthal TM (Mettler—Toledo, Columbus, Ohio USA)
pHpH was measured in a soil: water extract (1:5, w/v)Seven Multi—InLab pH Pro (Mettler—Toledo, Columbus, Ohio USA)
Electrical conductivityElectrical conductivity was measured in a soil: water extract (1:2.5, w/v)Seven Multi—In Lab EC Pro (Mettler—Toledo, Columbus, Ohio USA)
% Humic substances[36]LECO RC-412 multiphase carbon (LECO Corporation, St. Joseph, Michigan, USA)
Butyrate esterase, BE (EC 3.1.1.1)[37,38] Substrate: 4-MUB–butyrateUltra-Turrax homogenizer, (IKA®-Werke GmbH & Co. KG, Staufen, Germany), Fluorimeter—Infinite F200 pro —plate reader (TECAN Männedorf, Zürich, Switzerland)
β-glucosidase, BG (EC 3.2.1.21)[37,38] Substrate: 4-MUB-βd-glucoside
Acid phosphatase, AP (EC 3.1.3.2)[37,38] Substrate: 4-MUB-phosphate
Proteases—Leucine aminopeptidase, LAP (EC 3.4.11.1); N-acetyl-b-D-glucosaminidase, NAG (EC 3.2.1.14)[37,38]
Substrate: Leucine-7-amino-4methylcoumarine; 4-MUB-N-acetyl-β-D-glucosaminide
Arylsulphatase, AS (EC 3.1.6.1)[37,38]
Substrate: 4-MUB-sulphate
Table 2. ANOVA of main physicochemical properties and the molar ratios between the main macronutrients. Statistically significant differences between the respective sites and depths are indicated by superscript indices that denote the significantly different site: a = CS; b = PCS; c = CWS; d = NWS. Statistically significant differences, with p < 0.01, are indicated by uppercase letters and those with 0.01 < p < 0.05 are indicated by lowercase letters.
Management
LayerCS (a)PCS (b)CWS (c)NWS (d)
pH0–204.26 bD4.92 ad 5.79 Ab
20–404.29 D5.09 5.28 A
40–604.51b Cd5.30 a5.60 A5.31 a
EC
dS/m
0–200.282 D0.609 d 1.70 Ab
20–400.2900.920 1.08
40–600.707 B3.17 ACD1.97 B1.08 B
Redox Potential
mV
0–20337 BD110 AD −56.1 AB
20–40327 BD113 A -2.4 A
40–60313 BCD113 A30.6A9.7 A
Total Carbon
% C
0–2024.823.0 24.9
20–4024.524.8 25.4
40–6028.7 BC39.4 AD37.4 AD27.5 BC
Total Nitrogen
% N
0–201.421.44 1.47
20–401.391.50 1.50
40–601.66 B2.04 AD1.90 D1.57 BC
Total Phosphorus
% P
0–200.078 B0.122 AD 0.095 B
20–400.0790.090 0.094
40–600.0550.044 D0.0600.071 B
Humic C
%/TC
0–2035.2 D44.4 D 59.3 AB
20–4031.9 D37.6 D 59.5 AB
40–6028.120.223.539.7
C/N mol0–2020.418.6 19.8
20–4020.519.2 19.7
40–6020.2 C22.523.0 Ad20.5 c
C/P mol0–20831487 675
20–40801758 695
40–601626 BD2444 ACD1665 BD1015 ABC
N/P mol0–2041.126.2 34.2
20–4039.540.4 35.5
40–6081.3b D108a CD73.3 Bd50.7 ABc
Table 3. ANOVA of soil enzyme activities expressed in mmol MUB kg−1 dw h−1. Statistically significant differences between the respective sites and depths are indicated by superscript indices that denote the significantly different site: a = CS; b = PCS; c = CWS; d = NWS. Statistically significant differences, with p < 0.01, are indicated by uppercase letters, and those with 0.01 < p < 0.05 are indicated by lowercase letters.
Management
LayerCS (a)PCS (b)CWS (c)NWS (d)
β-glucosidase
mmol MUB kg−1 dw h−1
0–20318 B627 Ad 376 b
20–40321412 295
40–60322375466326
Phosphatase
mmol MUB kg−1 dw h−1
0–201407 D1560 D 624 AB
20–4014691930 D 918 B
40–601729 D1488 D1746 D684 ABC
Butirate esterase
mmol MUB kg−1 dw h−1
0–201759 D1943 D 865 AB
20–401929 D2173 D 828 AB
40–602145 D1621 d2078 D733 AbC
Aryl sulphatase
mmol MUB kg−1 dw h−1
0–2049.5 BD293 A 318 A
20-4059.7 BD319 A 250 A
40–6084.3 BCD317 Ac207 Ab397 Ac
Protease
mmol AMC kg−1 dw h−1
0–2082.5 bD124 a 159 A
20–4058.0 BD110 A 151 A
40–6072.1 bd114 aC68.2 BD119 aC
Table 4. ANOVA of soil enzyme activities expressed in percentage. Statistically significant differences between the respective sites and depths are indicated by superscript indices that denote the significantly different site: a = CS; b = PCS; c = CWS; d = NWS. Statistically significant differences, with p < 0.01, are indicated by uppercase letters and those with 0.01 < p < 0.05 are indicated by lowercase letters.
Management
LayerCS (a)PCS (b)CWS (c)NWS (d)
% β-glucosidase0–2017.1 D21.3 25.5 A
20–4016.814.9 d 20.2 b
40–6014.4 D13.6 cD19.2 b21.8 AB
% Phosphatase0–2076.1 BD60.6 AD 43.1 AB
20–4077.1 D69.6 D 52.8 AB
40–6078.6 BCD67.0 AD68.4 AD44.6 ABC
% Arylsulphatase0–202.49 BD12.9 A 21.6 A
20–403.07 BD11.5 Ad 16.9 Ab
40–603.83 BcD14.0 AcD9.27 abD25.6 ABC
% Protease0–204.38 D5.14 D 10.8 AB
20–402.97 D2.97 D 10.2 AB
40–603.18 D3.18 cD3.16 bD8.06 ABc
Table 5. ANOVA of the different phosphorus fractions expressed in mg P/kg dw. Statistically significant differences between the respective sites and depths are indicated by superscript indices that denote the significantly different site: a = CS; b = PCS; c = CWS; d = NWS. Statistically significant differences, with p < 0.01, are indicated by uppercase letters and those with 0.01 < p < 0.05 are indicated by lowercase letters.
Management
LayerCS (a)PCS (b)CWS (c)NWS (d)
NH4Cl-P
mg P/kg dw
0–204.95 B13.7 A 9.30
20–408.725.53 6.11
40–606.6912.26.915.68
BD-P
mg P/kg dw
0–2086.194.1 74.2
20–4089.652.8 47.9
40–6097.760.673.529.3
NaOH-P
(OM-P)
mg P/kg dw
0–20172 d236 D 61.5 aB
20–4097.4157 135
40–60117141179122
HCl-P
mg P/kg dw
0–20204459 d 141 b
20–40221388 311
40–60168108155172
Residual P
mg P/kg dw
0–20281 d416 D 663 aB
20–40378294 381
40–60164 d114 D181 D426 aBC
Table 6. Principal component analysis (PCA) loadings. *, parameters used for PCA interpretation.
PC1PC2PC3
pH0.5800.570−0.039
Electrical conductivity0.662 *0.2380.502
Overall microbial activity (butirate esterase)0.125−0.781 *0.051
C enzyme (% b-glucosidase activity)−0.2650.712 *−0.155
P enzyme (% phosphatase activity)0.003−0.929 *0.202
S enzyme (% arylsulphatase activity)0.1760.836 *−0.184
N enzyme (% protease activity)−0.1080.832 *−0.145
Total Phosphorus−0.5130.223−0.480
Redox Potential−0.322−0.628 *0.158
Total Nitrogen–Total Carbon0.747 *−0.0920.303
C/N mol0.738 *−0.1040.109
C/P mol–N/P mol0.748 *−0.2030.499
Humic carbon−0.3060.704 *−0.011
% NH4Cl-P0.2060.0230.872 *
% BD-P0.044−0.2400.800 *
% Organic matter P0.336−0.1450.680 *
% Not available P−0.2240.334−0.716 *
Explained variance3.2324.9413.359
Total proportionality0.1900.2910.198

