Article

Impact of Effective Microorganisms (EM) Application on the Physical Condition of Haplic Luvisol

Institute of Soil Science, Engineering and Environment Management, University of Life Sciences, 20-069 Lublin, Poland
*
Authors to whom correspondence should be addressed.
Agronomy 2020, 10(7), 1049; https://doi.org/10.3390/agronomy10071049
Submission received: 21 May 2020 / Revised: 13 July 2020 / Accepted: 15 July 2020 / Published: 21 July 2020
(This article belongs to the Special Issue Soil Degradation Prevention and Restoration at Farm and Field Scale)

Abstract

:
The study set out to determine changes in the soil air-water properties, the water-stable aggregate share and organic carbon content as effects of a five-year application of effective microorganisms (EM-A). The hypothesis that long-term applied EM-A biopreparations have a positive effect on the soil physical condition has not been confirmed. Haplic Luvisols originating from silt were studied in a field experiment after EM-A biopreparation treatment. The soil samples with the natural structure preserved intact were collected three times each year. The properties of the soil determined in the study were: particle density, total organic carbon content, bulk density, total porosity, air capacity, air permeability, soil moisture at sampling, field water capacity, available water content, unavailable water content, and water-stable aggregate content. The ratio of field water capacity and total porosity (FC/TP) was calculated. It was found that EM-A application primarily leads to a decrease in the content of organic carbon and water-stable aggregates. This was an adverse effect. Total organic carbon (TOC) and water-stable aggregates proved to be very sensitive indicators for assessing the soil physical condition. However, changes in soil compaction and air–water properties did not show significant deterioration. Our research addresses the data gaps about EM application to soil.

1. Introduction

Environmental soil data indicate that arable lands are increasingly exhibiting various forms of soil degradation, thus the implementation of special measures is needed [1]. Preventing degradation is considered to be a far better solution than soil remediation. Such a procedure is especially important in the context of sustainable development, the circular economy, and ensuring food safety for the world [2,3,4,5,6].
Soil microorganisms display high metabolic activity, which translates into their substantial impact on most of the processes that take place in the soil, e.g., the detoxification of xenobiotics and the inhibition of pest and plant pathogen development [7,8,9,10]. The degradation and mineralization of soil organic matter are regarded as the most important among these processes. Therefore, the soil application of such biopreparations with effective microorganisms (e.g., EM-A) requires serious consideration [7,8,11,12]. The transformation of soil organic matter also proceeds with the participation of mesofauna inhabiting the soil, whose activity leads to the breaking down and mixing of organic residues. The humus formed as a result is one of the elements which determines the capacity of soil to store water and dissolved plant nutrients. It also affects the formation of the soil structure and its functional properties. Depending on soil texture, and with a sufficient humus content, a stable granular-type soil structure is formed. This type of soil structure ensures the availability and usability of nutrients for plants and correct gas exchange between the soil and the atmosphere [13,14,15,16,17,18].
The role played by soil microorganisms in the prevention of soil degradation and the enhancement of its fertility has encouraged numerous academics to research the use of certain groups of microorganisms in agricultural practice. As a result, towards the end of the 20th century, the technology of effective microorganisms (EMs) was developed in Japan [19]. An EM preparation is a biological mixture composed of microorganisms of natural origin, however, its manufacturers tend not to provide information on the specific content of microbial groups. The composition is known to include lactic bacteria (Lactobacillus casei, Streptococcus lactis), photosynthesizing bacteria (Rhodopseudomonas palustris, Rhodobacter sphaeroides), yeasts (Saccharomyces albus, Candida utilis), actinomycetes (Streptomyces albus, S. griseus), and molds (Aspergillus oryzae, Mucor hiemalis). Apart from microorganisms, EMs typically contain organic N [20,21,22,23].
Making use of the assumptions of the EM technology, a number of microbiological preparations have been developed, often referred to as soil improvers or amendments. In Polish agriculture, regardless of the skepticism of, e.g., microbiologists and ecologists [11,21], the production and application of biopreparations based on EM technology has begun. Two products widely used in Poland are EM-A and UGmax. The fairly common use of these preparations in agricultural production in Poland has raised questions concerning the effects of the use of EMs on soil properties and the yield of crop plants. The effect of EM application to soil has been intensively investigated, both in the laboratory [24,25,26,27,28] and in the field in typical agricultural conditions [29,30,31,32]. The studies in question were typically one-year projects predominantly concerned with the biological and chemical properties of soil and the yield-forming effect of EMs. The results from the studies have shown that EM application leads to the reduction in the content of organic carbon (TOC) [29,33]. On the other hand, the studies conducted in Poland have failed to determine the positive or negative effects of soil inoculation with EMs on the quantity and quality of the yield of the cultivated test plants, e.g., winter wheat, maize, spring barley, buckwheat, pea, potatoes, lettuce, or sweet basil. Most frequently, the observed differences were negligible and statistically insignificant [23,29,30,31,34]. The authors of several experiments [24,25,26,27,28,35] incubated two different soil types (Haplic Luvisol and Gleyic Chernozem) in 2000 cm3 containers for 9 or 12 months. The soils were inoculated with three doses (0.05, 0.10, or 0.30 m3 ha−1) of an EM biopreparation and enriched with an admixture of muck and/or manure. After the period of incubation, cylindrical samples with a volume of 1 cm3 were collected from the soil in order to determine the water stability of the structure and selected physical properties of the soil. It was found that the application of EMs had a beneficial effect on the analyzed properties of the soil. Soil compaction decreased, and the hydraulic conductivity and soil resistance to the scouring effect of water increased. The effect of EMs on the capillary and field water capacity and the retention properties of the soil, though positive, was considered to be only marginal.
Dutch studies were reported in a paper [36] presenting a pot experiment with a sandy soil, demonstrating the absence of an effect of EMs on the level of grass yield. In Switzerland, Mayer et al. [37] observed an increase in the yields of crop plants cultivated in the crop rotation: potato–spring barley–alfalfa–winter wheat. In that study, either EMs, or EMs in combination with another biopreparation (bokashi) and/or manure were applied. Those authors noted that the effect of the applied additives to the soil was insignificant. In the Central European climate, statistically insignificant yield-forming effects, impacts on soil microbial biomass, soil microbial activity parameters, substrate turnover, and microbial community structure in the soil were observed [37]. A similar study, however, conducted in dissimilar soil climate conditions in Pakistan [38], showed that EMs added to the soil had a beneficial impact on cotton yield and the plant nutrient content in soil. That effect was evident when EMs were complemented, in coordinated doses, with mineral fertilization (NPK) and organic fertilization with manure (OM). In a two-year study [39] conducted in Saudi Arabia under arid climate conditions, an effect of the application of an EM biopreparation, green manure (GM), and the combination of EM + GM on sandy loam soil was observed. Ismail [39] demonstrated that the best yield-forming effects on alfalfa and pearl millet were noted on plots undergoing combined fertilization –EM + GM. The reported results also proved a distinctly beneficial effect of fertilization on the content of minerals (N, P, K, Fe, and Mg) in soil. The content of soil organic matter increased, while the compaction and the hydraulic conductivity of the soil decreased. Another recorded favorable change in soil properties was the increase in the water retention capacity of the soil. The author of that study [39] indicated that soil inoculation with the EM biopreparation alone caused only insignificant changes.
One can note, therefore, that there have been few studies representing a comprehensive approach to the estimation of the physical status of soils, especially in the conditions of the long-term application of EMs in typical agricultural production. It should be emphasized that the physical status of soil (e.g., compaction, air–water properties, distribution and openness of soil pores, stable aggregate structure) affects the functioning of the entire pedosphere [2,6,14,40,41,42,43,44]. It shapes the conditions for the occurrence of chemical reactions or biochemical and microbiological transformations (e.g., processes of oxidation and reduction, values of redox potential, transfer or immobilization of pollutants in soil) [45]. The authors of numerous studies, e.g., Gajewski et al. [25], Kaczmarek et al. [28], Dziamba et al. [29], Tyburski and Łachacz [32], Khaliq et al. [38], Ismail [39], and Cóndor-Golec et al. [46], emphasize that the full assessment of the effect of EM biopreparations on the soil environment requires multi-year research in various soil climate conditions.
In view of the above, a five-year study was undertaken, the objective of which was to comprehensively assess the effect of EM-A biopreparations (Greenland Technologia EM Sp. z o.o., Trzcianki, Poland) on the air–water properties of Haplic Luvisol (LVha) [47] and on the resistance of the soil structure to the scouring effect of water. We put forward the hypothesis that long-term applied EM-A biopreparations have a positive effect on the soil physical condition. The study was performed as a field experiment in a typical production area with an established crop rotation (spring barley-buckwheat-winter wheat-pea-spring barley). The field experiment was conducted in the climate conditions of southeastern Poland. The results of the study call into question existing, often controversial, opinions on the effect of EM-based biopreparations on the soil environment.

2. Materials and Methods

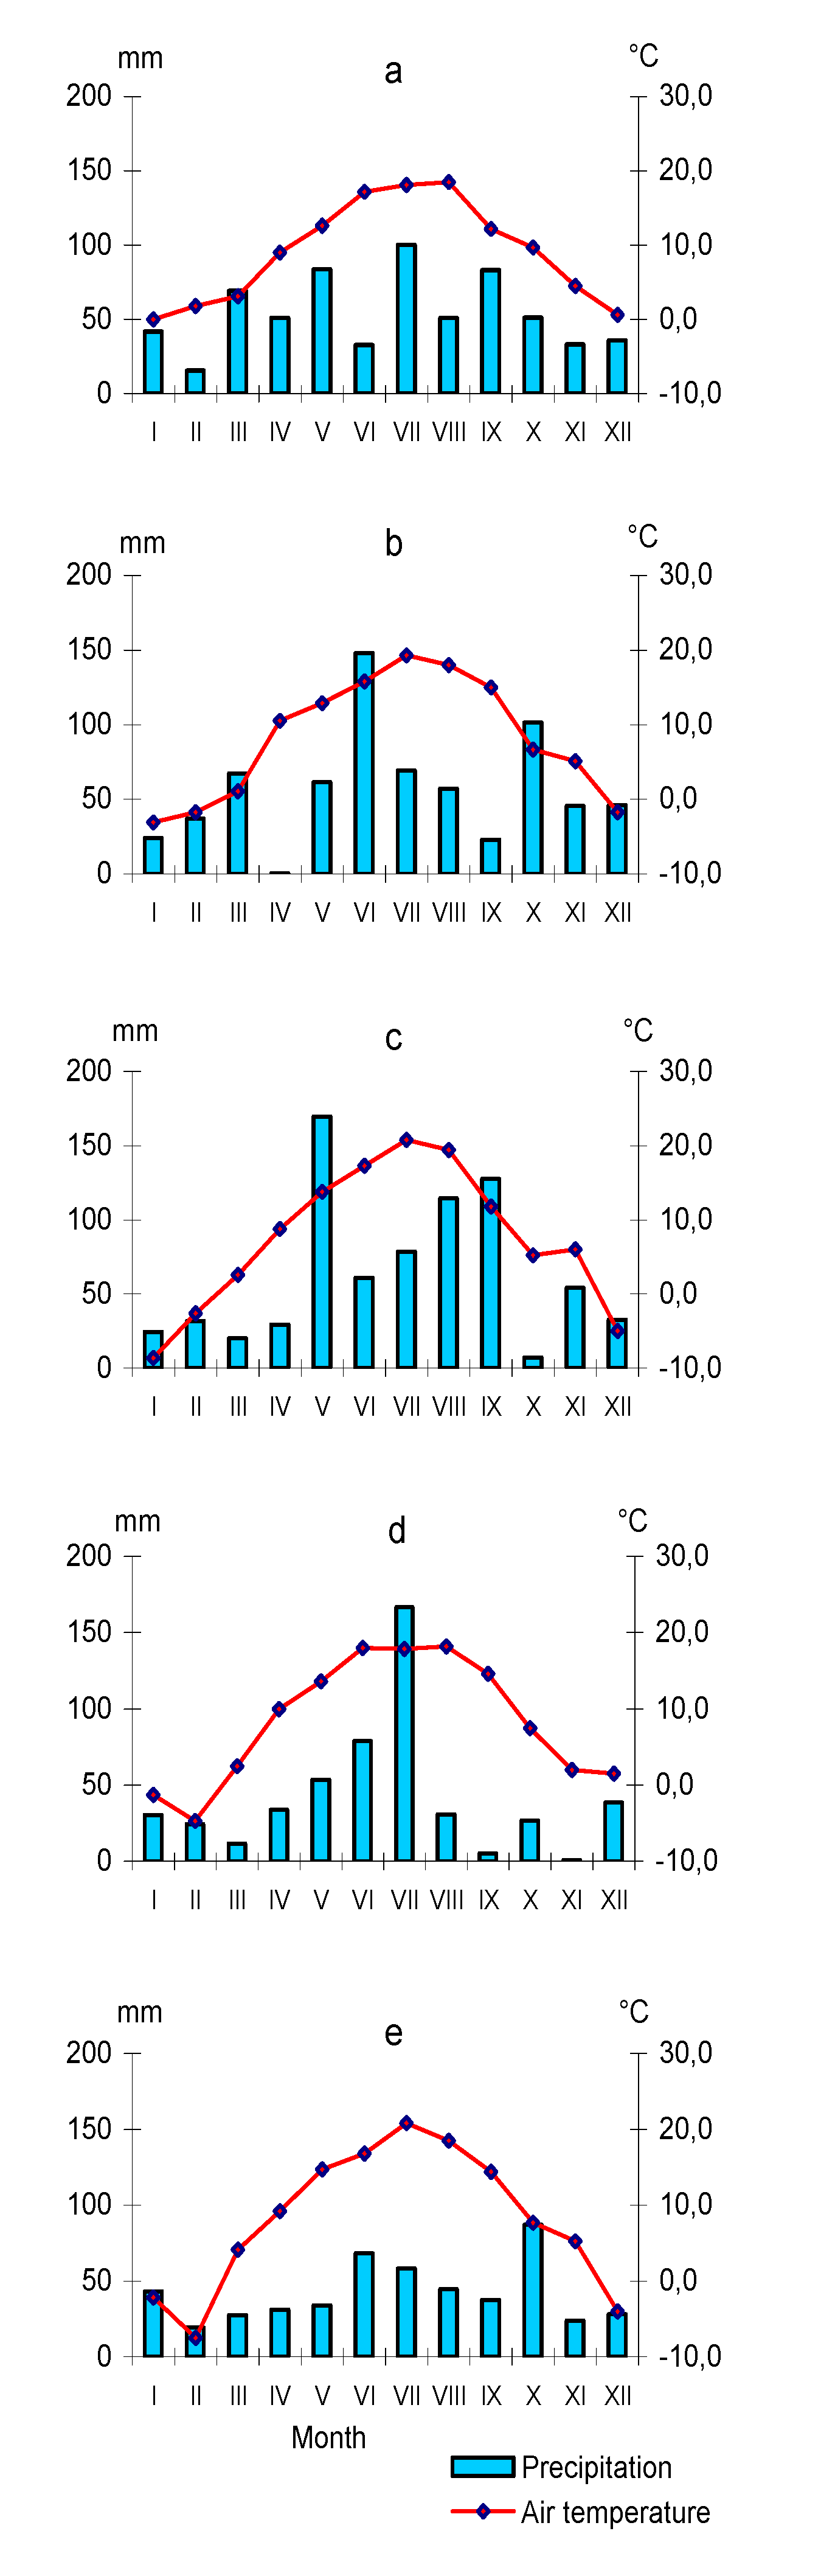
2.1. Study Area and Sampling

The study was carried out in Central Europe, in southeastern Poland. The field experiment was conducted in typical soil and climatic conditions for this area. The study area was situated in a temperate/transitional zone, with a strong influence of the continental climate. Over the study period, the average annual precipitation was 617.2 mm (751.4–501.7 mm) and the average annual temperature was +8.2 °C (7.5–8.9 °C). The average temperature of the warmest month (July) over the fallow period was +19.4 °C, whereas the temperature of the coldest month (January) was −3.1 °C (Figure 1). The five-year (2011–2015) study on the physical properties of Haplic Luvisol [47,48] originating from silt (SiL) was performed at the Experimental Agricultural Station in Felin—51°14′ N; 22°38′ E (the macro-region of the Lubelska Upland, a mesoregion of the Świdnicki Plateau). The particle size distribution of the arable layer of this soil was constant, as follows: 2.0–0.05 mm fraction—29%; 0.05–0.002 mm fraction—57%, and <0.002 mm fraction—14%. Particle density (PD) was in the 2.61–2.62 Mg × m−3 range; total organic carbon content TOC = 7.37 g × kg−1; soil reaction pHKCl = 4.7; and CaCO3 content ≈ 0.0%.
In the field experiment, the biopreparation EM-A, based on the technology of effective microorganisms (EMs), was used. The field experiment was set up in a randomized block design with five replicates, on plots 10 × 20 m in size. Five test plots were treated with an EM-A biopreparation (0.02 m3 × ha−1) and five Control plots were left untreated (Figure 2).
In the study, the following crop rotation was adopted: spring barley (Hordeum sativum L.)—plant density 680–700 plants per m2; buckwheat (Fagopyrum esculentum M.)—320–350 plants per m2; winter wheat (Triticum aestivum L.)—70–400 plants per m2; pea (Lathyrus sativus L.)—110–120 plants per m2; spring barley (Hordeum sativum L.).
The manufacturer of EM-A guaranteed the maintenance of a constant microbiological composition of the biopreparation. The first application was done in April 2011, before sowing spring barley. Soil inoculation with EM-A was performed each year in early spring (March/April), prior to the sowing of spring crops. In the case of winter wheat, EM-A was applied at the beginning of the vegetation season, in the phase of tillering. In research year III, after the winter wheat harvest, the entire experimental field (2000 m2) was fertilized with manure at a dose of 30 t × ha−1. Subsequently, in the post-harvesting period in year IV, a pea aftercrop (white mustard, Sinapis alba) was used as a green fertilizer.
The soil under study has been in use as arable land for over 100 years. The applied primary soil tillage system was the conventional plough tillage system: stubble cultivator (10 cm) + harrowing, moldboard ploughing (18–20 cm) + harrowing, sowing + harrowing.
Soil samples with preserved structure were collected three times during the vegetation season on the following dates: i—April–May (after the emergence of spring crops, and in the case of winter wheat, in the heading phase); ii—June–July (phase of milk or wax maturity); iii—July–August (prior to harvest, in the phase of hull ripeness). Soil samples were extracted from the 0–10 cm layer with 100 cm3 metal cylinders, in two replicates from five TEM and five Control plots (Figure 2), on each sampling date (n = 20). Three hundred soil samples were collected over 5 years. Bulk soil samples for the determination of aggregate stability were collected in six replicates in 250 cm3 boxes.

2.2. Analysis

Physical soil properties, such as particle density (PD), bulk density (BD), total porosity (TP), air capacity (at −15.5 kPa) (FAC), air permeability (at −15.5 kPa) (FAP), soil moisture at sampling (SM), field water capacity (FC), available water content (AWC), unavailable water content—permanent wilting point (UWC), and FC/TP ratio, were studied. A soil water retention curve was determined in the soil samples in cylinders (100 cm3) with the use of a pressure plate apparatus (Soilmoisture Equipment Corp, Goleta, CA, USA). The level of field soil saturation with water was calculated for soil moisture level at a potential value of −15.5 kPa and permanent wilting point (UWC) of −1550.0 kPa.
The soil physical properties were determined according to the following procedures [49]:
  • particle density (PD), with the pycnometric method [50] (Mg × m−3);
  • bulk density (BD), with the gravimetric method, from the ratio of the mass of soil dried at 105 °C to the initial soil volume of 100 cm3 [51] (Mg × m−3);
  • total porosity (TP) was calculated from the results of particle density (PD) and bulk density (BD), TP = 1 − BD/PD [52] (m3 × m−3);
  • air capacity at the potential of −15.5 kPa (FAC) was derived from the results of total porosity (TP) and field water capacity (FC) (−15.5 kPa), FAC = TP − FC [52] (m3 × m−3);
  • air permeability at the potential of -15.5 kPa (FAP) was measured using an apparatus for the measurement of the permeability of molding sand, LPiR-2e. The measurements were conducted on vertical (upward) airflow through the soil sample. The pressure head in the measurement chamber was 0.981 kPa (100 mm H2O), and the ambient temperature was stabilized (20 ± 1.0 °C). The relative air humidity was 40 ± 5%. The dynamic air viscosity (10−8 × m2 × Pa−1 × s−1) was not taken into account in the measurement results. The apparatus was produced by MULTISERW-Morek (Poland);
  • soil moisture at sampling (SM) was calculated from the ratio of the mass of water contained in the soil during the sampling to the dry matter of soil dried at 105 °C [53] (kg × kg−1);
  • field water capacity (FC) was calculated from the ratio of the volume of water contained in the soil at the potential of −15.5 kPa to the soil volume [54,55] (m3 × m−3);
  • available water content (AWC) was obtained from FC (−15.5 kPa) and unavailable water content (−1550.0 kPa)—permanent wilting point (UWC), AWC = FC − UWC [54,55] (m3 × m−3);
  • unavailable water content (UWC) was calculated from the ratio of the volume of water contained in the soil at the potential of −1550.0 kPa to the soil volume [54,55] (m3 × m−3).
Air–water relations of the soil were analyzed by determining the values of the FC/TP ratio [56,57,58]. For the analysis of the water stability of aggregates, 50 g of air-dried soil were used (at approx. 20 °C), after preliminary screening through a sieve with 10 mm mesh. Subsequently, the soil was wet-sieved for 12 min using a set of flat sieves of 5-mm and 1-mm apertures in 1-L cylindrical containers. The containers were rotated at a tilt (45°), at a frequency of two rotations per minute. The aggregates remaining on each sieve were dried at room temperature and weighed to obtain the percentage of water-stable aggregate fractions of 5–10, 1–5, and <1 mm. The mean weight diameters (MWD) of water-stable aggregates were calculated from the screening [59].
The content of organic carbon (TOC) was measured with the use of a Shimadzu TOC-VCSH analyzer with an SSM-5000A adapter for solid sample combustion.

2.3. Statistical Analysis

The results were processed statistically with the use of analysis of variance (ANOVA). The normality of the distribution and homogeneity of variance by Shapiro–Wilk and Levene’s tests were investigated. To normalize the distribution of the FAP results, the natural logarithm (ln) was calculated. All pairs of means were compared with Tukey’s test and the lowest significant difference (LSD) test. One- and two-way ANOVA was performed. The factors for one-way ANOVA were (i) Control and (ii) TEM, and for two-way ANOVA (i) treatment of TEM and Control and (ii) study year. Analysis was performed on the results from five study years (I–V) for each soil property.
The statistical variation of the results obtained in the experiment was found by calculating the coefficient of variation (CV = standard deviation (SD)/ arithmetic mean (X) (n = 150)), and the coefficient of correlation (r) for the studied soil properties (n = 30). The statistical evaluation (ANOVA–LSD) and the correlation estimation (r) were conducted at the significance level α = 0.05.
Statistica 11 by Statsoft and ARSTAT by the University of Life Sciences in Lublin were used for the statistical analyses.

3. Results and Discussion

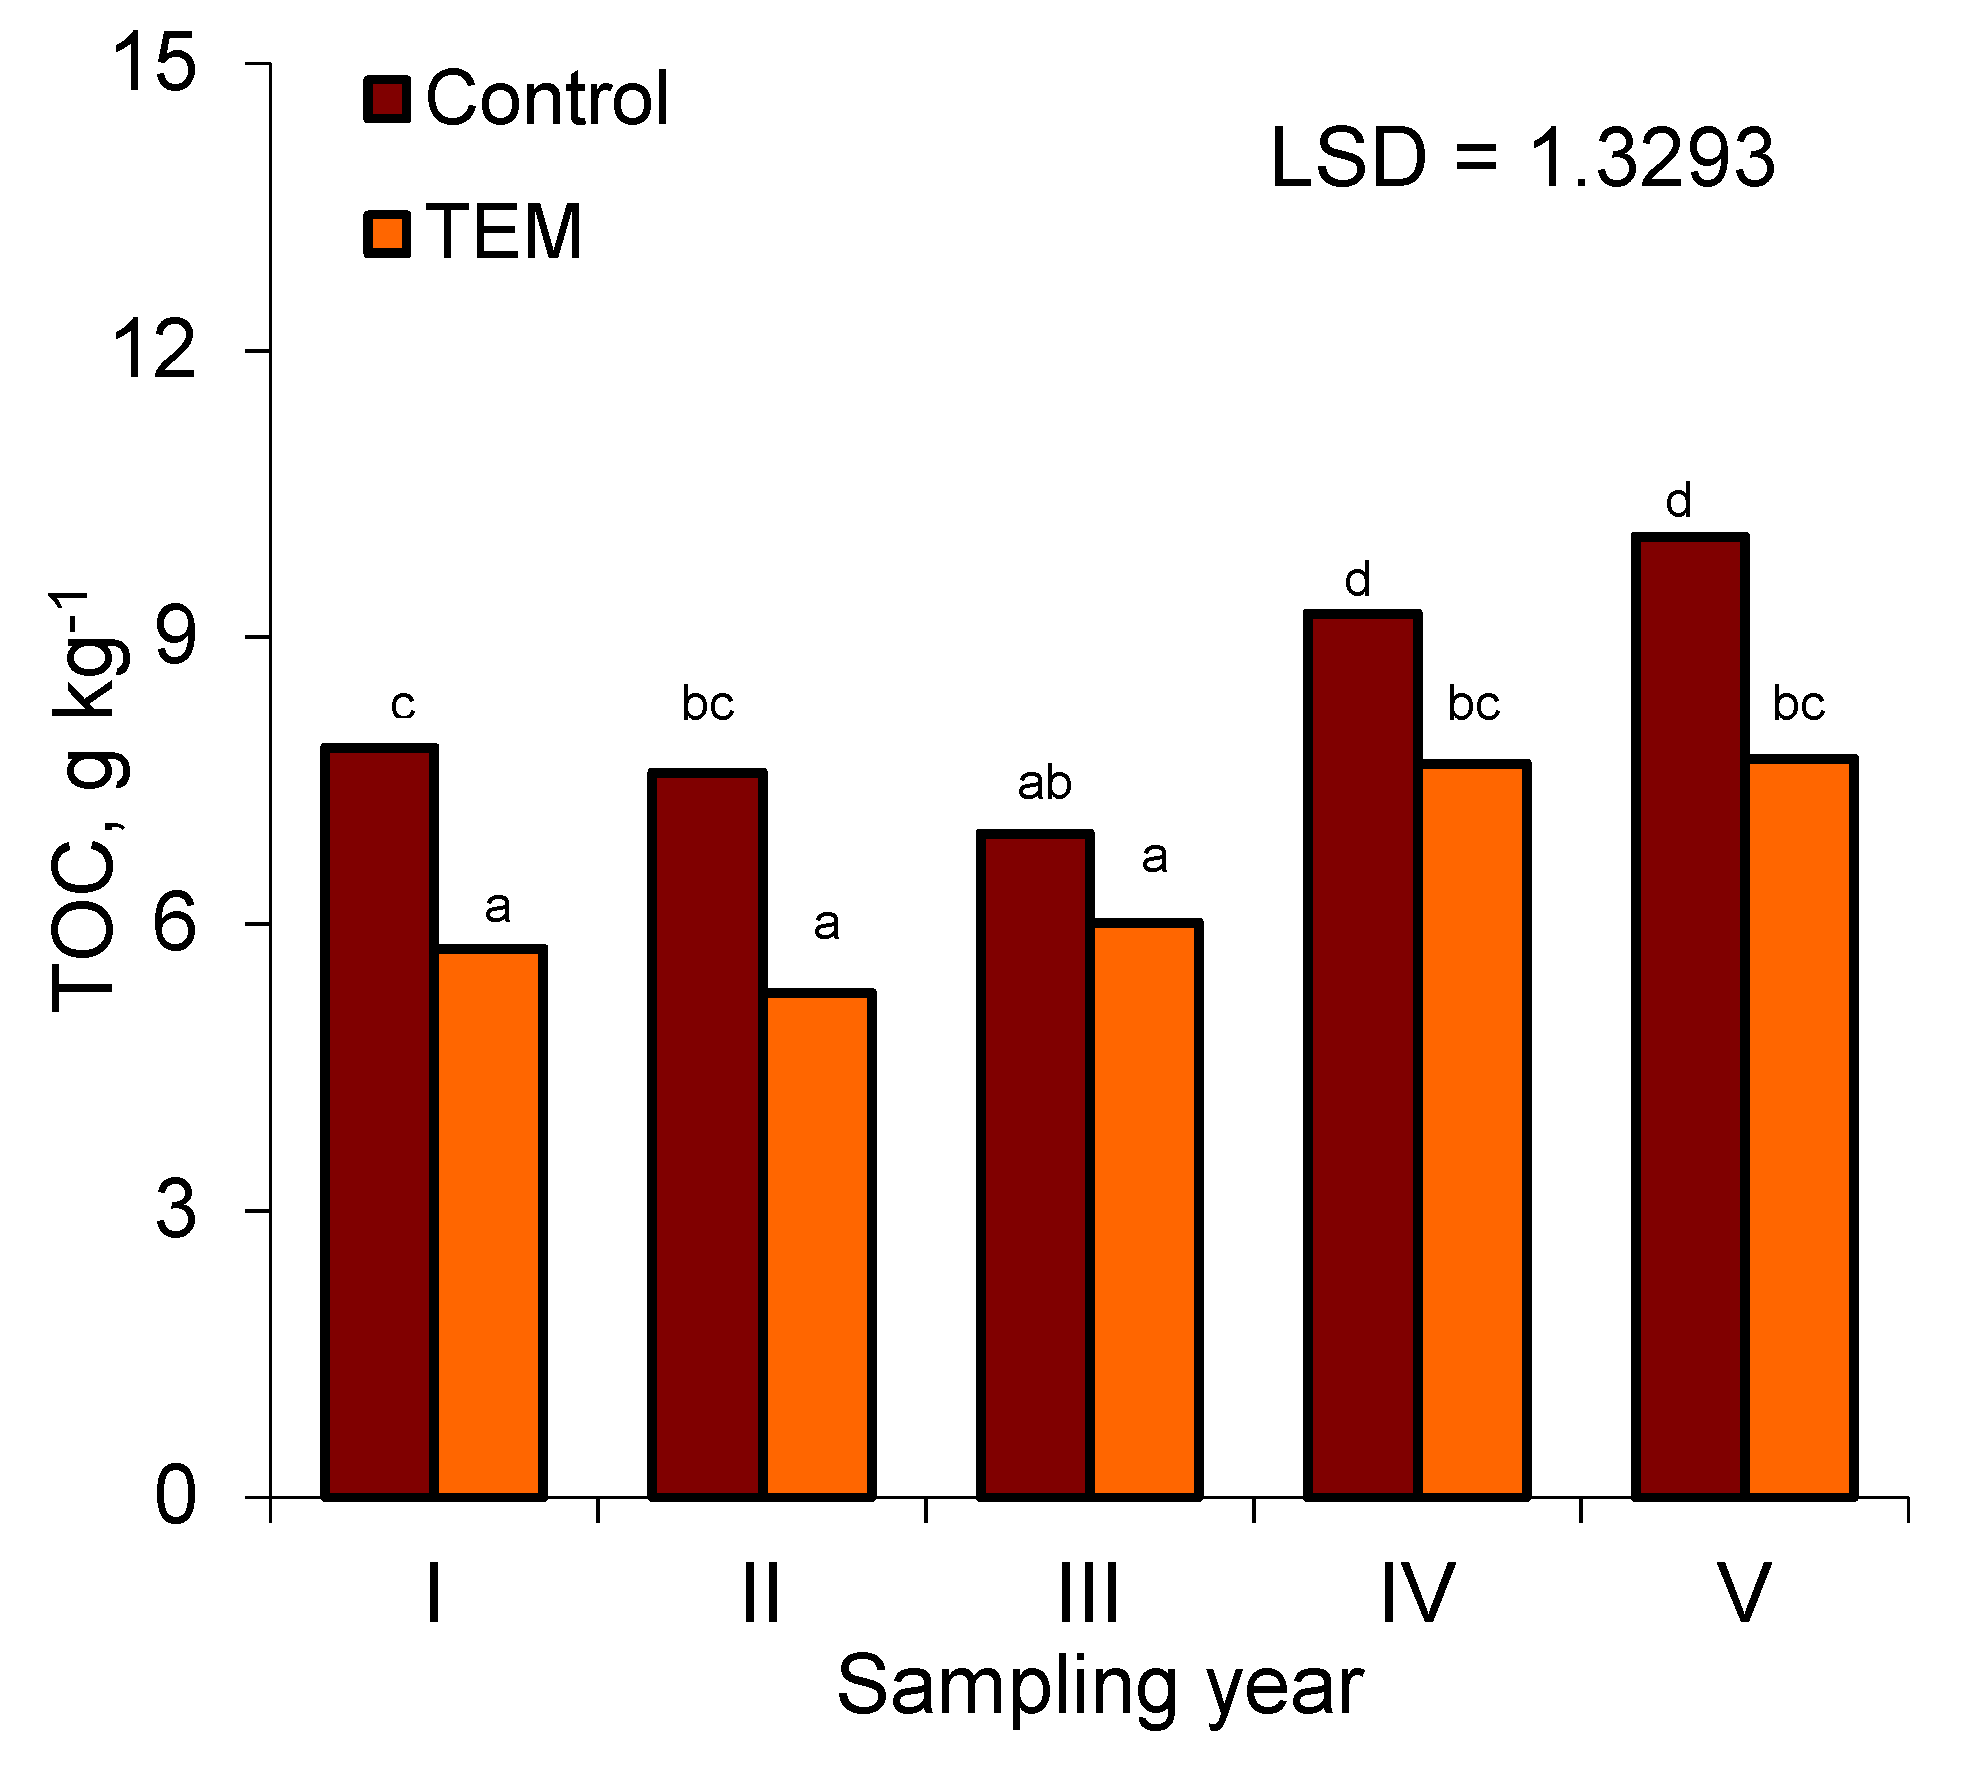
3.1. Total Organic Carbon (TOC)

The content of total organic carbon (TOC) in the soil was characterized by medium variability (CV = 0.17), and it was shown to drop from 4.86 g × kg−1 (EM) to 10.11 g × kg−1 (Control) (Table 1).
The application of the EM-A preparation to the soil at a dose of 0.02 m3 × ha−1 caused a distinct decrease in TOC. That was true for each of the dates of the analyses (Table 1). The decrease in the content of TOC was largely statistically significant (Figure 3; Table 2). There was also an observable variation in the TOC results between the individual years of the study (Figure 3; Table 1). The highest mean annual content of TOC was noted in year V of the study when it amounted to 10.05 g × kg−1 (Control) and 7.73 g × kg−1 (EM). The increase in TOC content (years IV and V) (Figure 3; Table 1) was probably caused by manure fertilization (year III) and the use of an aftercrop as a green fertilizer (year IV).
The lowest organic carbon content was noted in year III: 6.49 g × kg−1 (Control) and 6.01 g × kg−1 (EM), which in the latter case can be attributed to the accelerated mineralization of the organic matter. It is likely to have decreased as a result of an increase in the size of the population of soil microorganisms. Such effects of the application of TEM have also been reported by the authors of similar studies, e.g., Damh et al. [7], Martyniuk and Księżak [11], Gajewski et al. [25], Dziamba et al. [29], Tołoczko et al. [33], Mayer et al. [37], and Cóndor-Golec et al. [46]. As numerous studies emphasize, the reduction in the content of organic carbon in soil will typically lead to numerous changes in the physical properties of soil, including increased compaction [17,44,45,60,61,62,63]. The increased soil compaction hinders tillage treatment and has a negative effect on the distribution and openness of soil pores [18,63,64,65,66]. As a result, the storage of agriculturally valuable categories of water in soil deteriorates and gas flow between the soil and the atmosphere is limited [62,63,67,68,69,70]. It needs to be stressed that soil organic carbon plays an important role in the formation of aggregate structure. Humus stabilizes and holds elementary soil particles together. Thus, it also determines the resistance of soil aggregates to the scouring effect of water [13,14,71,72,73,74]. The correlation analysis conducted in this experiment confirmed the existence of correlations between the physical properties of soil and its content of TOC (Table 3). The content of organic carbon in the studied soil had a beneficial effect on the amount of water available for plants—AWC (r = 0.489)—and on the water stability of aggregates of 5–10 mm–A5–10 (r = 0.511) and the weight mean diameter of aggregates—MWD (r = 0.383) (Table 3).

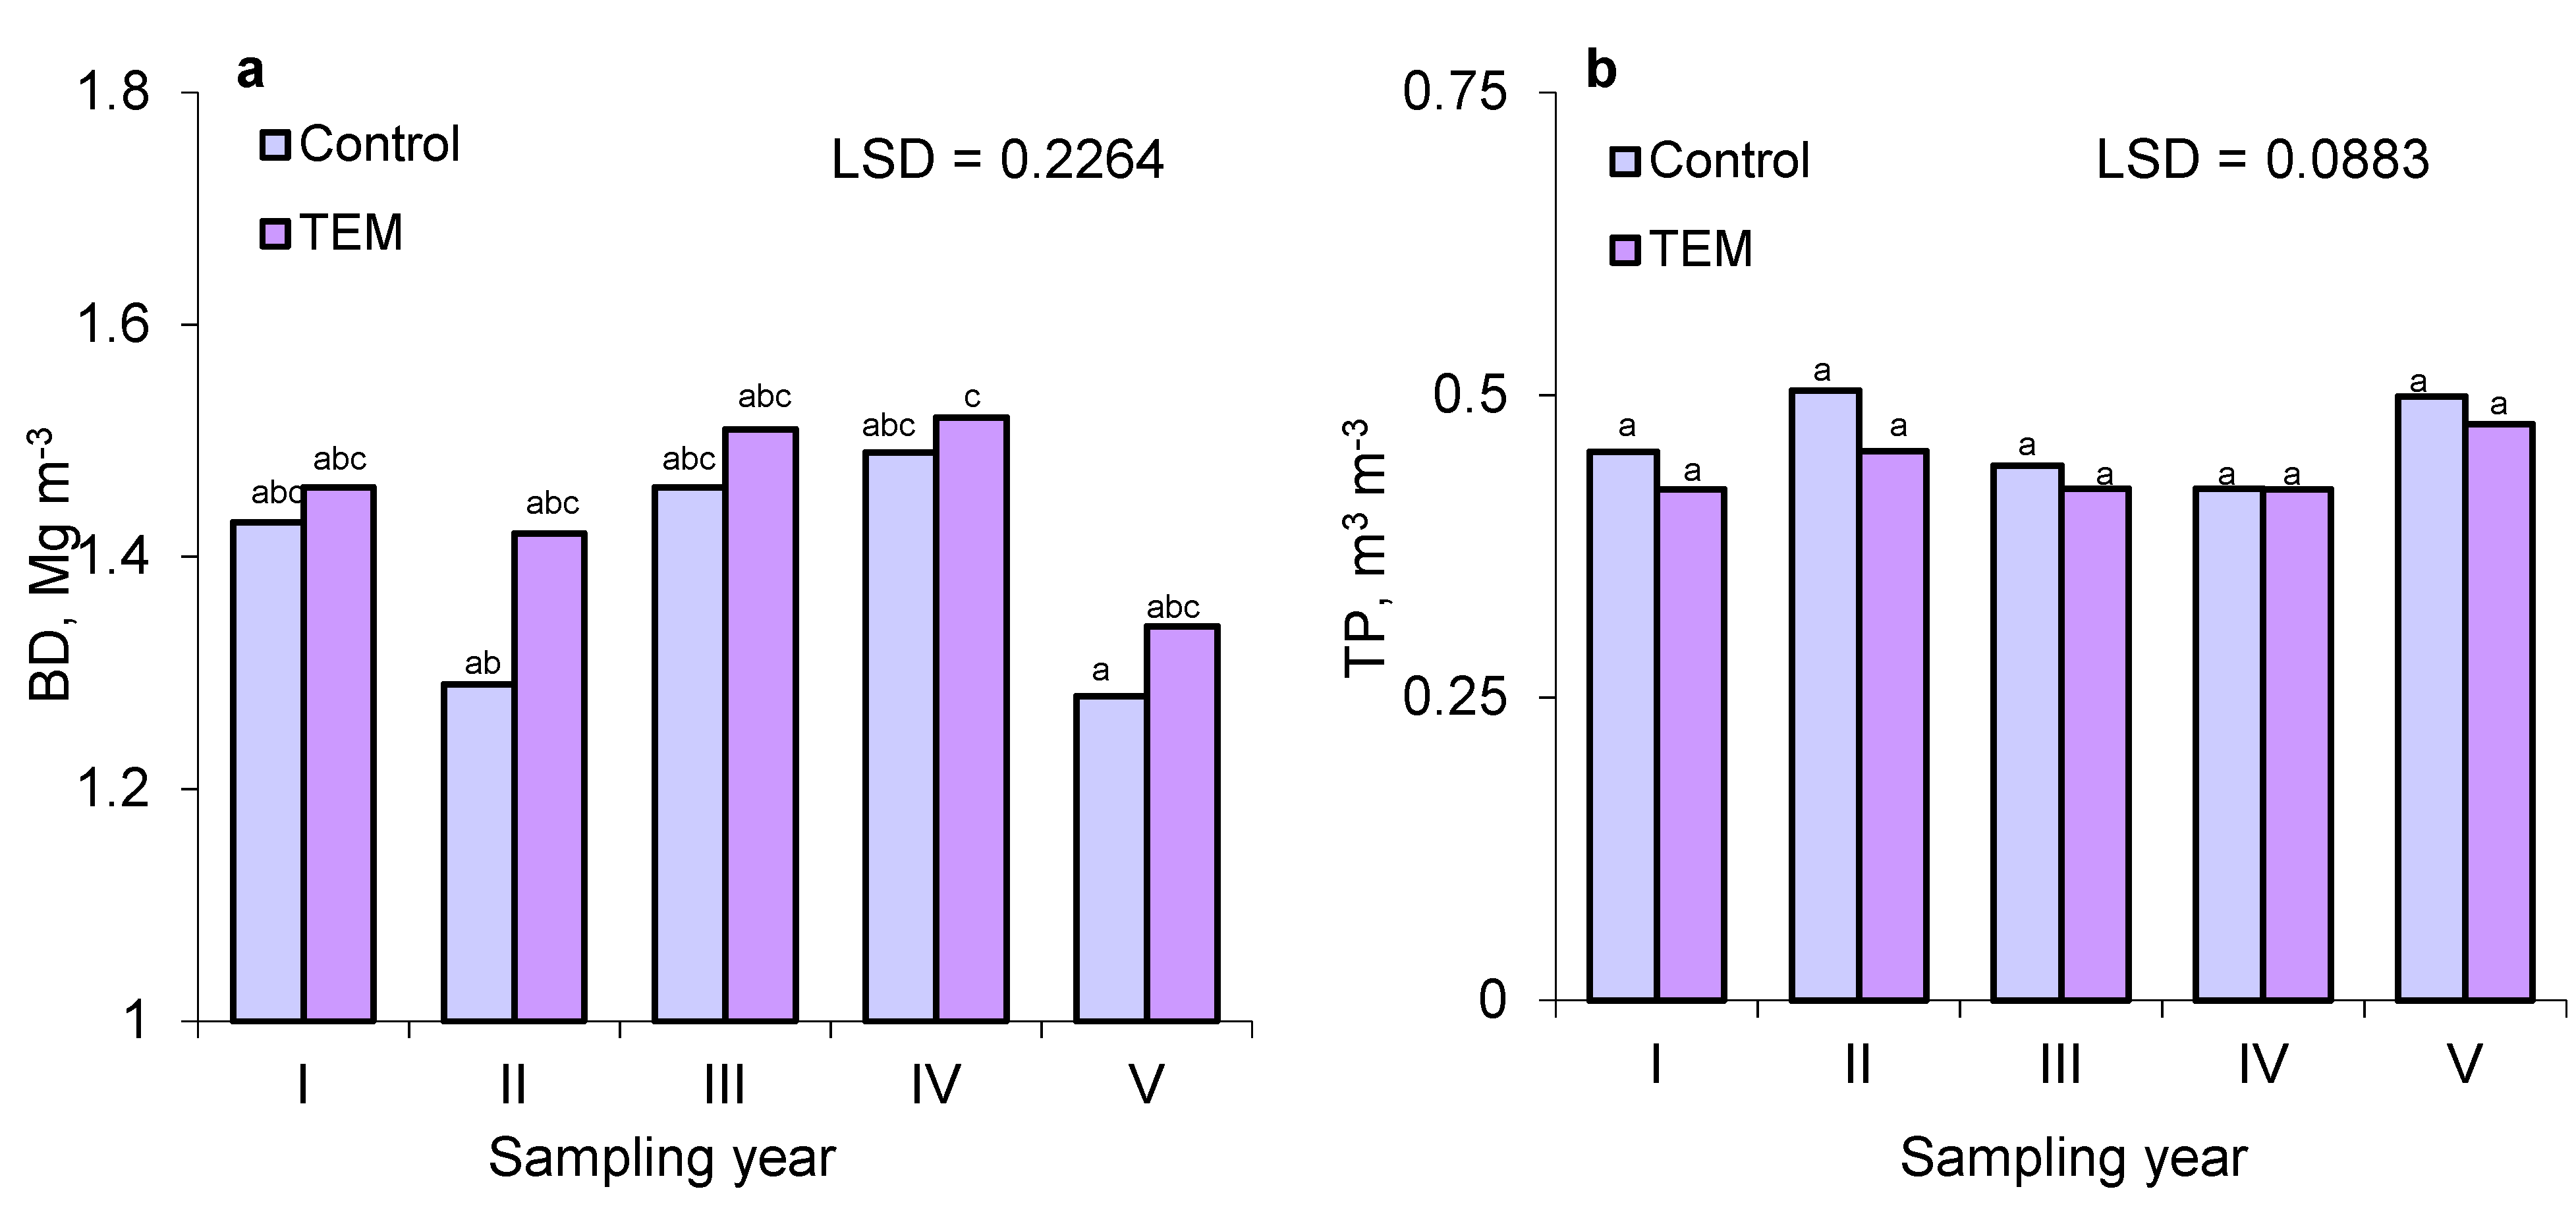
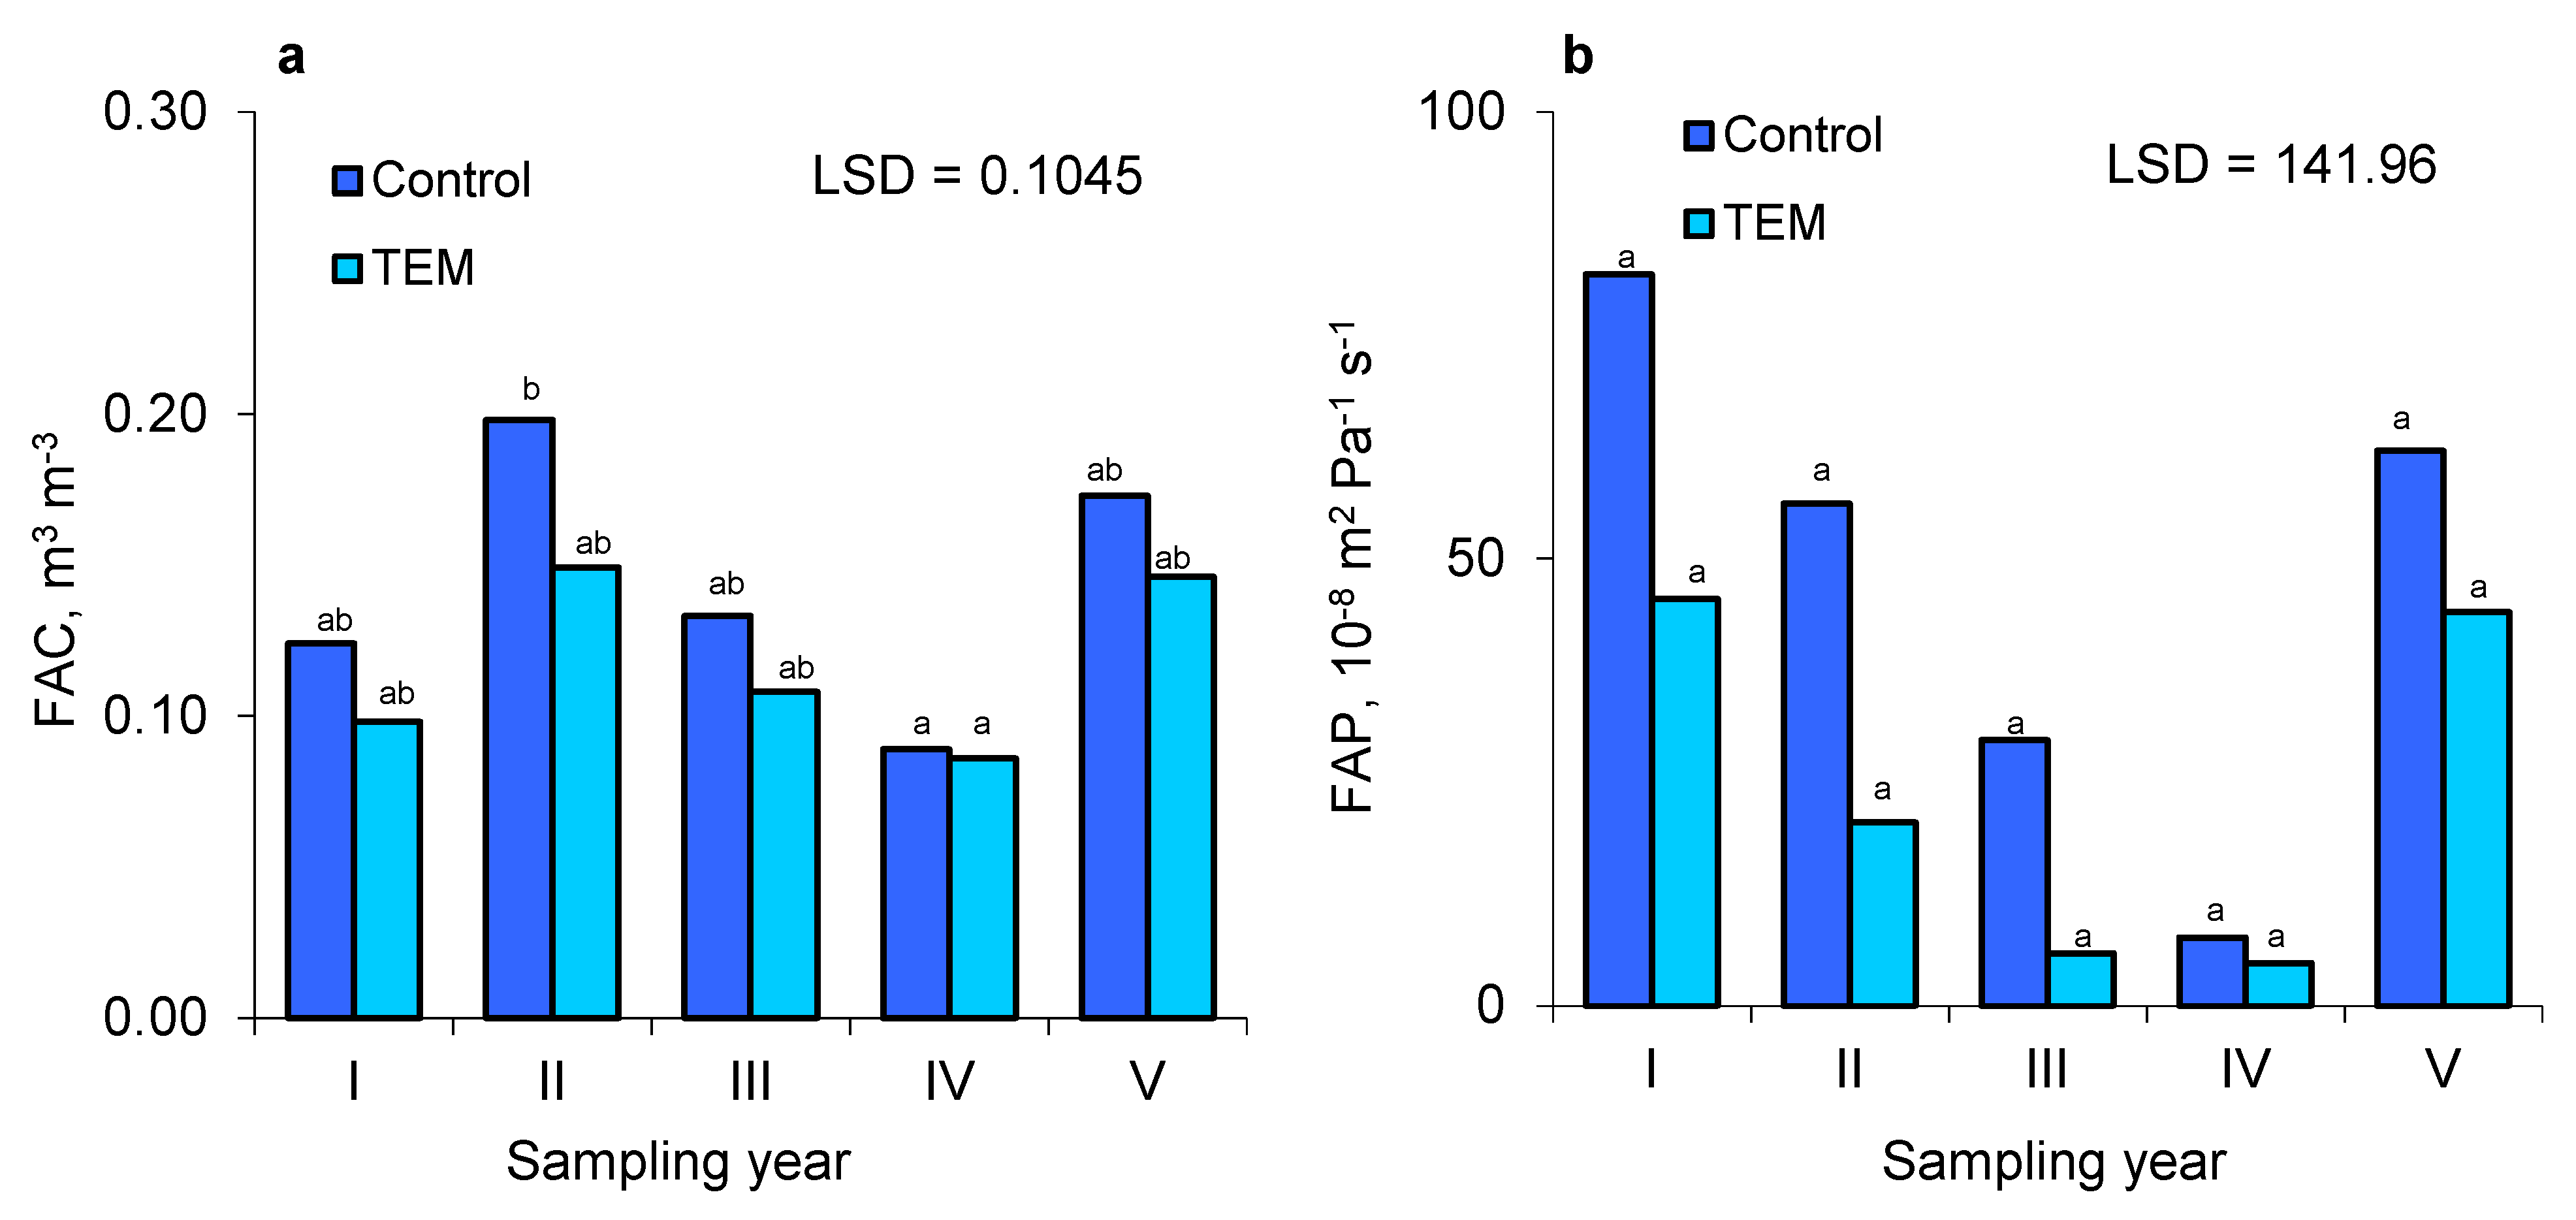
3.2. Bulk Density (BD), Total Porosity (TP), and Soil Air Properties (FAC and FAP)

Throughout the entire measurement period, the values of soil density (BD) displayed low variability (CV = 0.08), which ranged from 1.15 Mg × m−3 (Control) to 1.55 Mg × m−3 (EM) (Table 1). The observed differences were most often statistically insignificant (Figure 4a, Table 2). Additionally, in the multi-year comparison, a minor variation was recorded (Table 1). The lowest mean annual value of BD was noted in year V of the experiment, when it amounted to 1.28 Mg × m−3 (Control) and 1.34 Mg × m−3 (EM).
The lowest BD in year V (Table 1; Figure 4a) may be explained by the increase in TOC after soil organic fertilization (years III and IV). The highest bulk density of the soil was noted in year IV: 1.49 Mg × m−3 (Control) and 1.52 Mg × m−3 (EM) (Figure 4a). Soil inoculation with EM-A caused only a slight change in BD, however, it typically resulted in an increase in its value. Different observations can be found in studies by other researchers [28,35,39], who indicated a decrease in soil density as a result of the application of EMs. From the obtained results for BD, it can be seen that they corresponded with the changes in the content of TOC (r = −0.284). It should be emphasized that over 2/3 of all the results of soil density were higher than 1.40 Mg × m−3. According to the studies by Jones [75], Drewry et al. [60], and Reynolds et al. [44], the studied soil was characterized by moderate density. The calculations of Pranagal [63] indicate that, after taking into account the limit value of the parameter S > 0.035 [42,76] in maintaining a good physical quality of soil, the BD of silty soils should be less than 1.48 Mg × m−3. However, according to the classification of the density of soil developed from silts proposed by Paluszek [62], the analyzed soil is characterized primarily by “high” and “very high” values of BD. As indicated in the studies by Reynolds et al. [44,57], Drewry et al. [60], Pranagal [63], Jones [75], Carter [77], and McQueen and Shepherd [78], at a given a level of bulk density, the following should be expected: difficulties in soil aeration, limited access to soil for plants, increased mechanical resistance to root movement within the soil mass, and disturbance in the development of the root systems of plants. These disturbances in the functioning of the soil–plant–atmosphere system lead, in consequence, to a reduction in yields. That deterioration of the properties of the soil also found confirmation in the conducted analysis of correlation (Table 3). The increase in bulk density of the analyzed soil strongly reduced the field air capacity (FAC, at −15.5 kPa) (r = −0.892), limited the flow of gases through the soil (FAP) (r = −0.565), and caused an increase in the content of water unavailable for plants (UWC) (r = 0.653) (Table 3).
The volume of all soil pores—total porosity (TP)—did not vary strongly (CV = 0.09), and its value varied from 0.406 m3 × m−3 (EM) to 0.559 m3 × m−3 (Control) (Table 1). The effect of the application of the EM inoculant was unfavorable, as in nearly every case (13/15) it was seen to cause a decrease in the volume of soil pores. However, the analyzed differences (ANOVA–LSD) were not confirmed by statistical significance (Figure 4b, Table 4). The lowest mean value of TP was calculated for year IV of the experiment, when it amounted to 0.422 m3 × m−3 (EM) and 0.423 m3 × m−3 (Control). The highest volume of free spaces in the soil was noted in year II, in the case of the control soil (0.504 m3 × m−3) and in the soil with EM-A in year V of the study (TP = 0.476 m3 × m−3) (Figure 4b). Kowda [79] and Thompson and Troeh [80] accepted that the optimum value of TP is at least 0.500 m3 × m−3. In the reported study, only in three out of 15 cases was mean TP higher (Table 1) than the indicated minimum [79,80]. According to the classification proposed by Paluszek [62], the TP of the analyzed soil was usually “low” or “very low”. It should be emphasized that ensuring air–water conditions in soil that are beneficial for plants depends to a large extent on, not only the value of TP, but also on the favorable distribution of soil pores and their openness [16,17,56,57,58,81,82]. The observations of these researchers are supported by the analysis of correlation in the present study (Table 3). It was demonstrated that total porosity is a property whose value depends on the same factors that determine soil density. It is a nearly linear relation (r = −0.988), and the correlation between TP and BD was negative. Analogously, as in the case of BD, every change in TP had a strong impact on the air properties of soil (FAC, FAP) and on the numerical value of UWC—permanent wilting point (Table 3).
Air capacity (FAC), determined at the value of field water capacity (−15.5 kPa), is also equivalent to the content of macropores (Φ > 20 μm). Over the course of the five-year experiment, it varied considerably (CV = 0.35), and its values ranged from 0.069 m3 × m−3 (EM) to 0.278 m3 × m−3 (Control) (Table 1). The application of the biopreparation EM-A contributed to a decrease in the air content in soil, observed in 12 out of 15 cases, shown by the compared pairs of mean values. According to Tukey’s lowest significant difference (LSD) test, the statistical significance was established only in the case of two pairs (Figure 5a).
The lowest mean annual value of FAC was observed in year IV of the study: 0.086 m3 × m−3 (EM) and 0.089 m3 × m−3 (Control), and the highest in year II: 0.149 m3 × m−3 (EM) and 0.198 m3 × m−3 (Control) (Figure 5a). The air capacity of soil (FAC) at the level of field water capacity is an important criterion, of great use in the estimation of the physical quality of soil. The value of FAC provides information on the conditions prevailing in the soil, concerning, e.g., oxygenation, gas exchange, nutrient uptake by plants, microbial activity, and the processes of oxidation and reduction. An air deficit in soil usually leads to plant growth inhibition, as reported in numerous studies [45,62,81,82,83,84,85,86]. The researchers above indicated that the value of FAC = 0.100 m3 × m−3 is a critical value—below that value, the soil conditions become highly unfavorable, resulting from an air deficit in the zone of plant root development. In the analyzed soil, in the majority of measurements (19/30) FAC > 0.100 m3 × m−3. Air deficits occurred more often (7/15 cases) in the soil with EM-A, compared to Control—four cases out of 15 (Table 1). The specialist literature provides different critical values of FAC. Drewry [83] and Mueller et al. [86] claim that, in loamy soils, critical conditions occur when FAC < 0.140 m3 × m−3. Walczak et al. [82] maintained that FAC < 0.120 m3 × m−3 should be considered as a low value, at which a distinct disturbance in soil respiration can occur. These critical values of the air capacity of soil relate primarily to its state of field saturation with water (e.g., −15.5 kPa). In natural conditions, such a level of soil moisture occurs sporadically over the entire vegetation season, and when it appears, it is usually short-lived [16,17,45,62,63]. The analysis of correlation revealed that, apart from the strong correlation of FAC with BD, TP and UWC, FAC was shown to correlate with the field water capacity–FC (r = −0.444) (Table 3).
The air permeability of soil at the state of field saturation with water (FAP) (at a soil potential of −15.5 kPa) is an important parameter describing the air properties of soil. FAP is a physical indicator of soil pore space, describing the actual vertical transport of gases in the soil and their exchange between the soil and the atmosphere [18,64,66,69]. The results of the FAP measurements differed from the other analyzed properties, as they showed high variation (CV > 1) in a broad range from 1.8 × 10⁻⁸ × m2 × Pa−1 × s−1 (EM) to 195.9 × 10⁻⁸ × m2 × Pa−1 × s−1 (Control) (Table 1). The variation of the results was not only found with respect to different years of study (I–V), but also to the particular dates of soil sampling (i–iii). The lowest mean annual FAP was noted in year IV of the experiment: 4.8 × 10⁻⁸ × m2 × Pa−1 × s−1 (EM), and 7.6 × 10⁻⁸ × m2 × Pa−1 × s−1 in Control, whereas the highest value of air permeability was measured in year I: 81.1 × 10⁻⁸ × m2 × Pa−1 × s−1 (Control) and 45.5 × 10⁻⁸ × m2 × Pa−1 × s−1 (EM) (Figure 5b). The application of EM-A to the soil caused a marked decrease in FAP, which was, furthermore, true for all of the compared pairs of mean values (Control–EM) (Table 1). Nevertheless, the conducted statistical analysis (ANOVA) did not reveal significant differences. The lowest significant difference determined for the mean annual values was LSD = 141.96 × 10⁻⁸ × m2 × Pa−1 × s−1. Such a high value of LSD resulted probably from a very high variation in the fragmentary measurements of FAP (Table 1), and, in consequence, a high standard deviation (SD = 48.03). Air permeability at FC (at −15.5 kPa) is a highly sensitive parameter of changes in the state of the soil environment. It changes rapidly in response to modifications of the proportions of the individual components forming the soil, oscillations of moisture, and density [66,70,87]. In studies by Paluszek [62] and Pranagal [63], it was demonstrated that sufficient gas flow in soil occurs when FAP amounts to the minimum of 35.0 × 10⁻⁸ × m2 × Pa−1 × s−1. According to the quality classes proposed by Paluszek [62], Pranagal [63], and Pranagal et al. [45], with respect to FAP values, the soils inoculated with EM-A (EM), in 10 cases out of 15 represent the classes “very low” and “low”. However, the soil without EM-A (Control) could be classified, also in 10/15 cases, in the “medium” and “high” classes of permeability. It should be stressed that the soil with EM-A was usually characterized (13/15) by a lower FAP than the indicated limit value [45,62,63]. The distribution of FAP results clearly showed how the application of EM-A affected the value of that soil property in the individual years of the study (Table 1 and Table 2, Figure 4b). The statistical analysis revealed a significant correlation of air permeability (FAP) with, primarily, soil density (BD–r = −0.565), total porosity (TP–r = 0.573), air capacity (FAC at −15.5 kPa–r = 0.486), and the ratio FC/TP–r = 0.422 (Table 3).
Among the threats rooted in a substantial increase in the air permeability of soils, other studies in the field [18,64,66,69,87] investigated factors that may deteriorate the soil condition, thus fostering excessive “ventilation” and, in consequence, drying. In the case of the analyzed soil, the risk of excessive drying as a result of a FAP increase is small. Soils with the particle size distribution of silts are usually characterized by very good water properties and far worse air properties.

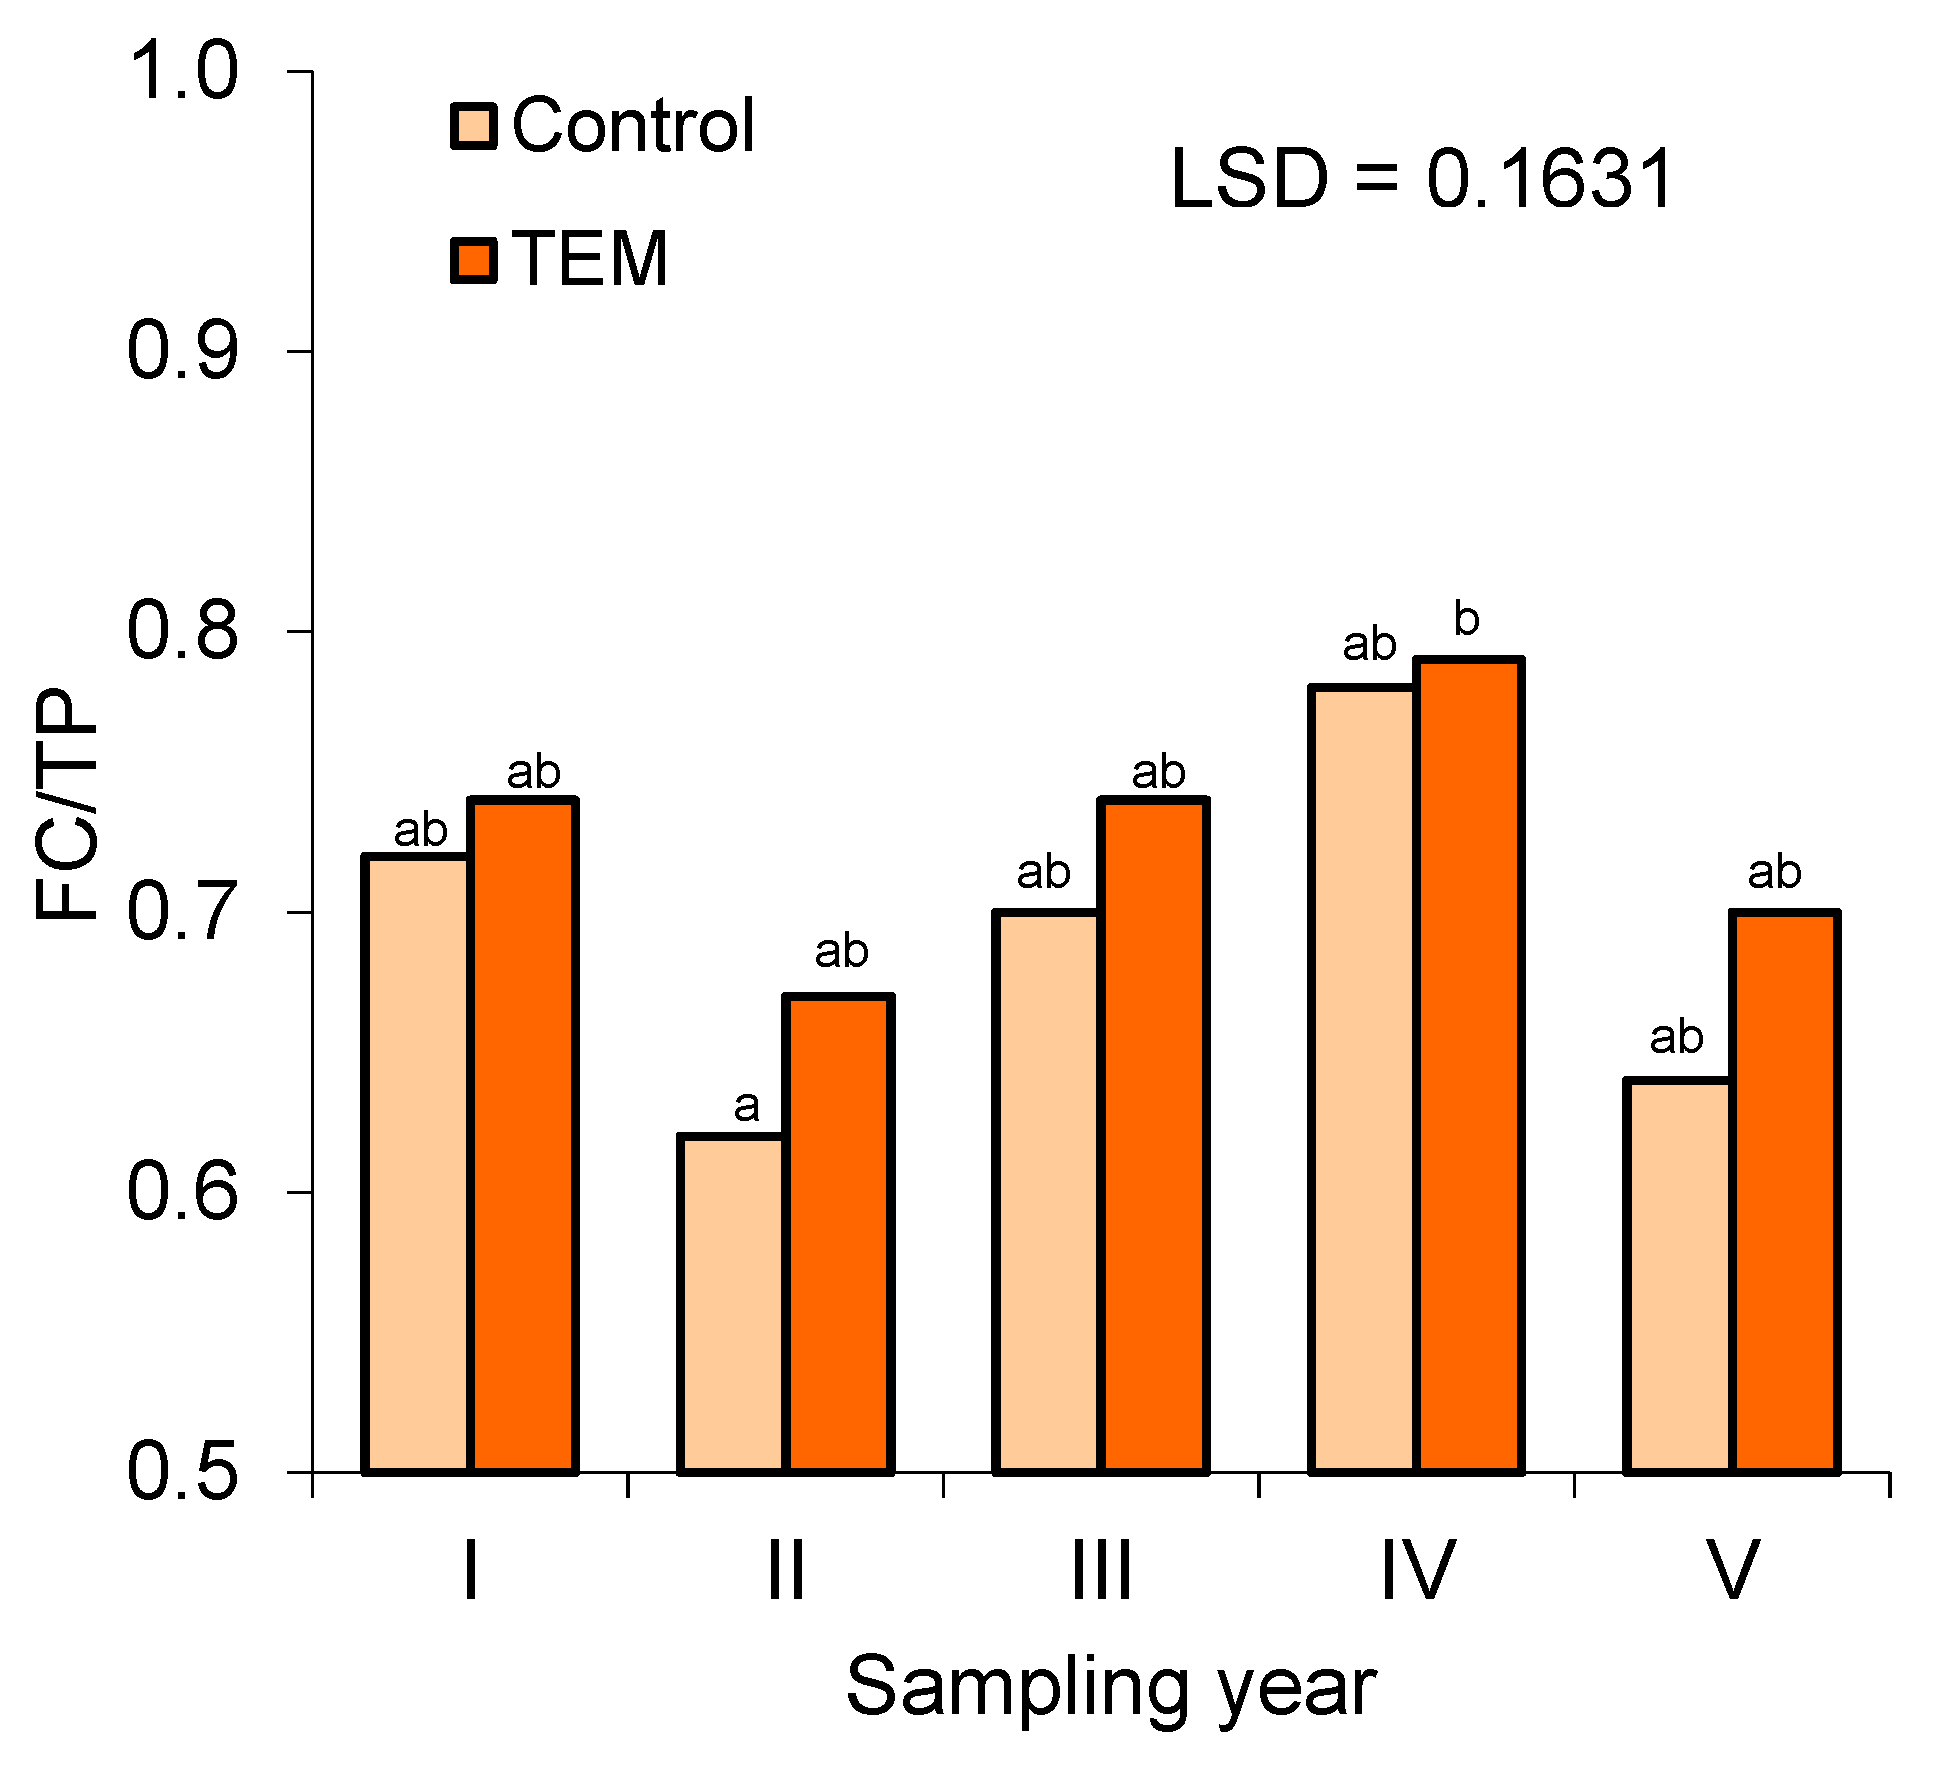
3.3. Soil Water Properties (SM, FC, AWC, and UWC) and the FC/TP Ratio

Soil moisture at sampling (SM) is a highly dynamic property, primarily affected by changes in atmospheric precipitation, transpiration/water evaporation from the soil surface, and tillage treatments. In addition, SM has been found to display a relationship with particle size distribution, soil structure, and its state of compaction during precipitation deficits [88,89,90,91]. In the course of the experiment, SM showed considerable variation (CV = 0.23), especially between the individual dates of the measurements (i–iii), where the values of SM varied from 0.081 kg × kg−1 (EM) to 0.216 kg × kg−1 (Control) (Table 2). The lowest mean annual value of SM was noted in year V of the study. In the case of the soil with EM-A, it was 0.134 kg × kg−1, and of the control soil, 0.144 kg × kg−1. The highest water content in the soil during sampling was observed in year II of the experiment: 0.194 kg × kg−1 (Control) and 0.174 kg × kg−1 (EM) (Figure 6a).
The conclusion could therefore be that the effect of the application of EM-A to the soil is unfavorable, as in all compared pairs (15/15 (Control/EM) results), the soil with EM-A contained less water. An analogous effect of such a comparison was obtained for the mean annual values of SM (Figure 6a). The statistical analysis (ANOVA) showed no significant differences (LSD) resulting from the addition of the biopreparation EM-A to the soil (Figure 6a, Table 2). Finally, the analysis of correlation revealed a significant correlation of SM only with the content of water available for plants (AWC) (r = −0.392) (Table 3).
What may additionally explain the scatter in the values of SM is the effect of cultivated plant species and the related cultivation treatments. The highest value of SM was recorded under buckwheat and pea (years II and III) and the lowest under spring barley (years I and V). The differences could also result from changes in the density of vegetation and water interception by plants: the higher the density of plants, the higher the water uptake from the soil (Figure 6a, Table 4). It needs to be taken into account that SM is also subject to spatial variation, even over small areas, which was indicated by, e.g., Kutílek [88], Leśny [89], Petrosyants [90], White [91], and Usowicz and Usowicz [92]. It should be emphasized that the experiment was conducted in an area with a dominant precipitation-type water economy (Figure 1). Therefore, SM depended primarily on the volume and distribution of atmospheric precipitation and air temperature [89,90]. Those factors cause repeated soil wetting–drying cycles, and, in the winter period, freeze–thaw cycles. The cyclic character of those processes is conducive to the formation of natural soil aggregates [13,14,62,63,93].
The variation in the results of field water capacity (FC) (at −15.5 kPa) [54,55,82] was low (CV = 0.06)—FC ranged from 0.284 m3 × m−3 (Control) to 0.347 m3 × m−3 (Control) (Table 4). The lowest mean annual value of FC was noted in year II of the study, in the soil with EM-A (0.305 m3 × m−3) and 0.308 m3 × m−3 in Control soil. The highest value of FC was noted in year IV, when it amounted to 0.334 m3 × m−3 and was equal in both experimental treatments (Control and EM) (Figure 6b). The mean value for the five-year period (I–V) showed no difference in both analyzed soils, amounting to 0.321 m3 × m−3 (Table 2). The results indicate that soil inoculation with EM-A biopreparation did not have any significant effect on the value of FC, and the seasonal variation was also negligible. Furthermore, the latter was reflected by the results from the statistical analysis (ANOVA) (Figure 6b, Table 2), which indicated a strong correlation of FC with the soil content of organic carbon (TOC) (r = 0.355), the content of water available for plants (AWC) (r = 0.751), air content (FAC, at −15.5 kPa)) (r= −0.444), and FC/TP (r = 0.610) (Table 3). In 24 out of 30 cases (Table 4), the field water capacity (FC) of the analyzed soil (0.300–0.350 m3 × m−3) was optimal, according to Reynolds et al. (2008). However, following the classifications proposed by Walczak et al. [82] and Paluszek ([62,94]), the soil would be primarily classified in the “high” class of FC. A similar assessment and a minor effect of soil inoculation with EM-A on the value of FC were also indicated by Gajewski [26], Ismail [39], and Kaczmarek et al. [28,35,95] in their respective studies.
Another important parameter describing the physical status of soil is the retention of water available for plants (AWC) [17,45,62,63,65,67]. Over the five-year period of measurements, AWC was characterized by low variability (CV = 0.09), and its results varied from 0.210 m3 × m−3 (Control) to 0.288 m3 × m−3 (EM) (Table 4). Analyzing the results, it was noted that in 11 out of the 15 cases of compared pairs (Control–EM), higher AWC occurred in the soil with EM-A (Table 4). Considering the mean annual values, the lowest capacity for the accumulation of water available for plants was found in year II of the study, where in the control soil, AWC = 0.218 m3 × m−3, while the soil inoculated with EM-A performed better, with AWC = 0.244 m3 × m−3. The highest value of AWC was noted in year V of the experiment, amounting to 0.266 m3 × m−3 in the control soil, and in the soil with EM-A, 0.268 m3 × m−3 (Figure 6c). The differences in AWC indicated a positive effect of the biopreparation EM-A on the capacity for water storage in the soil. The analysis of variance (ANOVA), however, disproved the hypothesis of significance between the observed differences (Figure 6c, Table 2). The value of AWC was significantly determined by the content of organic carbon (TOC) (r = 0.489), soil moisture at sampling (SM) (r = −0.392), and field water capacity (FC) (r = 0.751). AWC was shown to substantially reduce the unavailable water content (UWC) (r = −0.468) and the content of 1–5 mm (A1–5) water-stable aggregates (r = −0.372) (Table 3). A similar increase in the amount of water resources available for plants as a direct effect of the application of effective microorganism technology (EM) was described in the works referenced in the preceding sections [26,28,35,39,95]. As compared with the studies by Cockroft and Olsson [81] and Craul [96], the analyzed soil exhibited very good retention properties—in the AWC results (Table 4) for both the control soil (Control) and the soil inoculated with EM-A (EM). The AWC value of the studied soils can be classified in the “high” class according to the criteria by Walczak et al. [82], in the “very high” class by Paluszek [62], and in the “ideal” class by Reynolds et al. [57].
The content of water unavailable for plants (UWC) (at −1550 kPa) [54,55] shows moderate variability (CV = 0.15). During the five-year period of measurements, the value of UWC varied from m 0.053 m3 × m−3 (EM) to 0.098 m3 × m−3 (EM) (Table 4). According to Walczak et al. [82] the values are typical (0.050–0.100 m3 × m−3) for soils developed from silts with a low content of organic carbon (TOC < 10.0 g × kg−1). The effect of applying EM-A to soil on the value of UWC was hard to identify. The differences in the value of UWC were subject mainly to seasonal variation. In the mean annual approach, the largest amounts of adsorbed water were noted in year I of the experiment, at 0.090 m3 × m−3 (EM) and 0.089 m3 × m−3 (Control). The lowest mean annual UWC was noted in year V of the study. In the case of the soil with EM-A, it was 0.062 m3 × m−3, and in the control soil, it was 0.060 m3 × m−3 (Figure 6d). The values of UWC obtained in the final year of the experiment were significantly lower in comparison with the results from years I, III, and IV (ANOVA–LSD) (Figure 6d). The analyzed Haplic Luvisol was characterized by a small contribution of UWC to FC. On average, that amounted to approx. 24.5%. From the comparison of the results of FC, AWC, and UWC, it can be seen that soil inoculation with an EM-A biopreparation contributed to an increase in AWC [26,28,35,39,95] as a result of the decrease in UWC, while simultaneously maintaining constant FC (Figure 6b–d). The statistics calculated for the criteria in question have confirmed a close correlation between UWC and BD (r = 0.653), TP (r = −0.605), AWC (r = −0.468), and FAC (r = −0.586) (Table 3). Similar relations between the values of FC, AWC, and UWC in soils with silt and a loamy particle size distribution were also indicated by the authors of other studies [17,18,44,63,82,94].
The scope of the five-year experiment included an evaluation of the air–water relations in the soil. For that purpose, the FC/TP ratio was calculated [45,56,57,58,62,94]. The value of that index for the analyzed soil varied from 0.51 (Control) to 0.83 (EM), at low statistical variation (CV = 0.10) (Table 4). In terms of the mean annual values, the lowest value was noted in year II of the study in the control soil (FC/TP = 0.62) and in the soil with EM-A, the value of the index was 0.67 (Figure 7). According to the criteria given in Olness et al. [56], Reynolds et al. [57], and Paluszek [94], this particular soil property was optimal for plants. However, in most cases, the FC/TP ratio was >0.70, and attained the highest mean values in year IV, amounting to 0.79 in EM-A, and 0.78 in Control (Figure 7).
As reported by the authors of other studies [45,57,62,94], the optimal relation between the liquid phase and the gaseous phase in soil occurs when FC/TP is in the range of 0.60–0.70. Exceeding the optimal level (FC/TP > 0.70) is indicative of an air deficit and inhibited aeration in the plant root zone of the soil. Values of FC/TP < 0.60, in turn, provide an indication of the excessive aeration of soil and a water deficit. The application of EM-A to the soil caused an increase in the values of the index (Table 4, Figure 7). Therefore, the resulting deterioration of the air properties of the analyzed soil determines the soil conditions to be unfavorable [56,57,58]. The only statistically significant difference derived from the statistical analysis (ANOVA–LSD) was observed between the extreme values of FC/TP (maximum–minimum) (Figure 7). The determined coefficients of correlation revealed that the value of the FC/TP ratio is strongly correlated with soil density (BD: r = 0.814; TP: r = −0.828), water properties (FC: r = 0.610; UWC: r = 0.536), and the air properties of the soil (FAC: r = −0.952; FAP: r = −0.422) (Table 3). The results from the correlation analysis fully support the suitability of the FC/TP ratio as an index for the estimation of the air–water relations in soil.

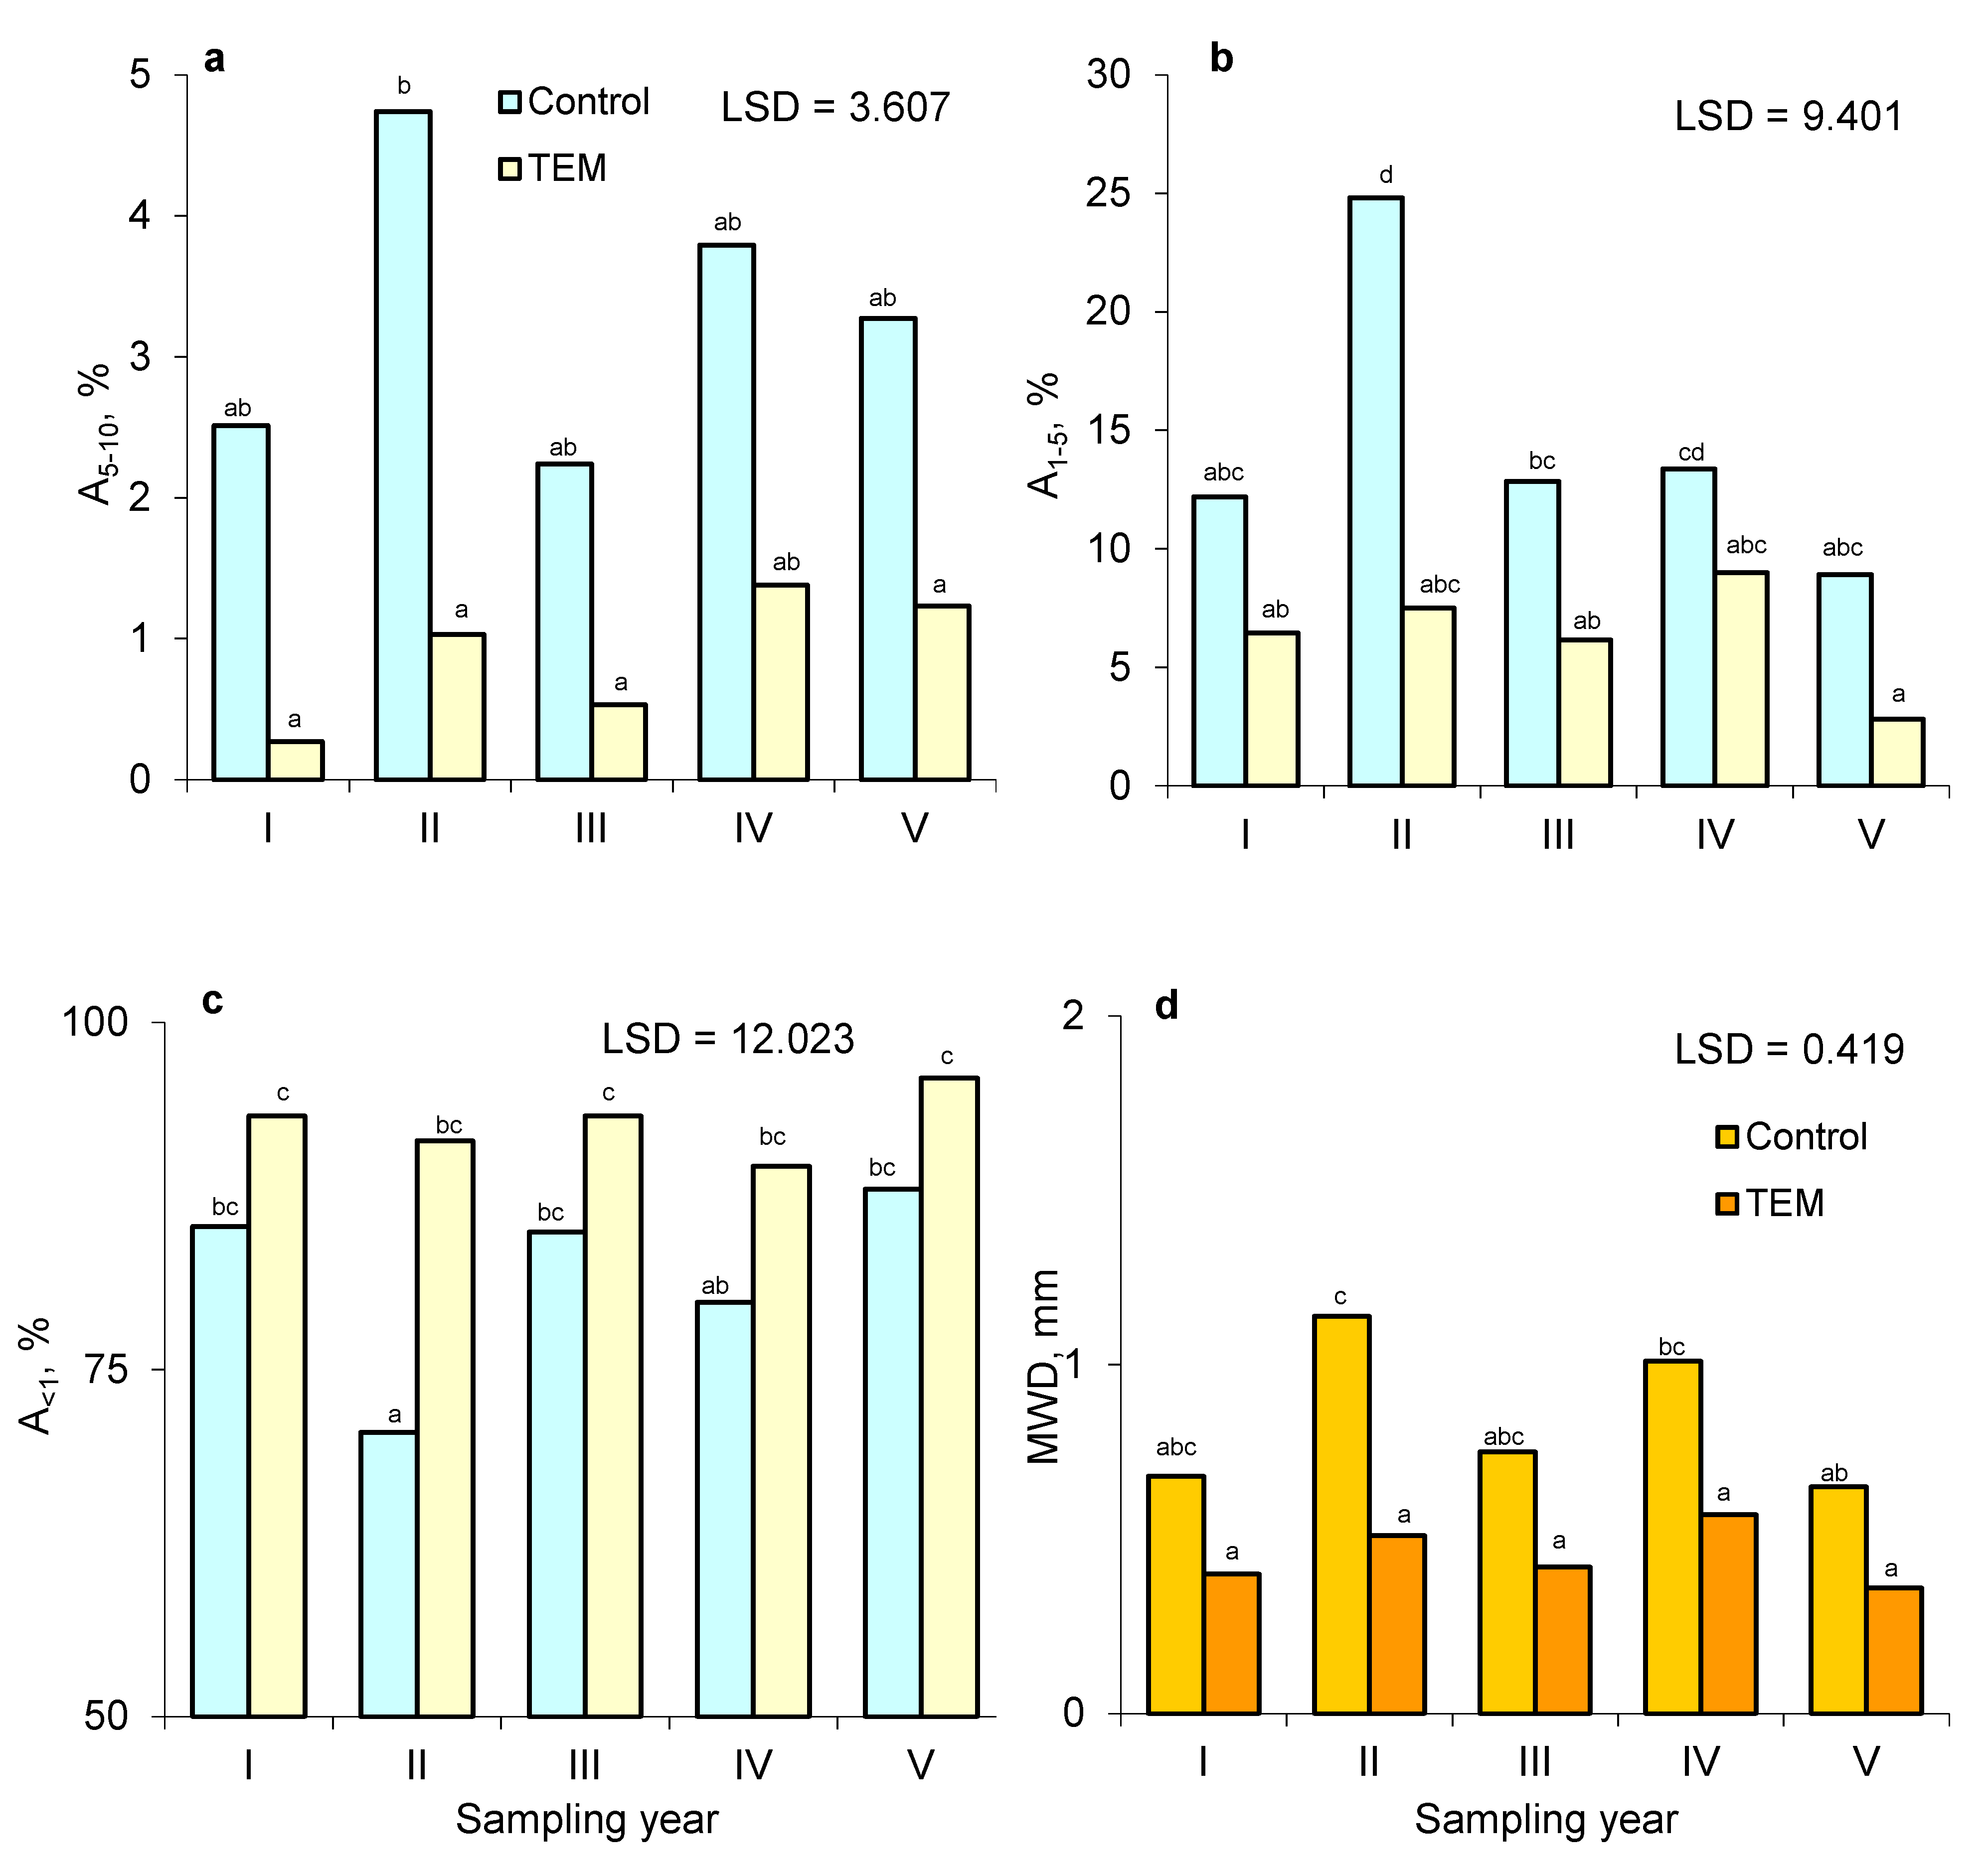
3.4. Aggregate Stability (A5–10, A1–5, and A<1) and Mean Weight Diameter (MWD) of Aggregates

The stable aggregate structure of soil depends on the content of water-stable aggregates, especially those of 5–10 and 1–5 mm in size. The presence of water-stable 1–10-mm aggregates ensures access to water and nutrients for plants, the free movement of roots in the soil mass, and proper gas exchange between the soil and the atmosphere, as well as the reduction of soil susceptibility to water erosion [13,14,97]. In the course of the five-year experiment, the content of of 5–10-mm (A5–10) aggregates ranged from 0.12% (EM) to 7.02% (Control) with medium variation (CV = 0.20) (Table 5).
The lowest mean annual content of A5–10 was measured in the soil with EM-A in year I of the study (0.27%) and in Control soil in year III (2.24%). The highest means of A5–10 were noted in the soil inoculated with the biopreparation addition (EM, 1.38%) (year IV) and in the soil without EM-A (Control, 4.74%) (year II) (Figure 8a). From the obtained results, it can be observed that soil inoculation with EM-A caused a notable weakening of the stability of the soil structure, which applied to all the compared pairs of mean values (Control-EM) (Table 2 and Table 5). The statistical analysis (ANOVA-LSD) revealed significant differences between the levels of A5–10 (Figure 8a; Table 2).
The correlation analysis supported the literature reports [13,14,63,97,98,99,100,101] that the content and stability of soil aggregates is determined by the soil content of organic carbon (r = 0.511) (Table 3). The content of water-stable aggregates (A5–10) determined, though to a limited extent, the air properties of the soil (FAC: r = 0.348) and its density (BD: r = −0.335; TP: r = 0.337). The effect of the group of aggregates in question (A5–10) on soil density and the state of the aeration of the soil was also demonstrated in previous works [62,63,97,98].
The distribution of the 1–5 mm water-stable aggregate content (A1–5) was similar to that of A5–10. However, the results were more diversified (CV = 0.41) and, in general, higher. The content of A1–5 in soils ranged between 2.19% (EM) and 30.42% (Control) (Table 5). The lowest mean annual values of A1–5 were observed in year V of the study in the soil inoculated with the biopreparation (EM, 2.81%), and in Control soil (8.91%). However, the highest mean annual value for the soil with EM-A was recorded in year IV (8.99%), and in Control soil in year I, when it amounted to 24.81% (Figure 8b). In the case of A1–5, a negative effect of the application of EM was also observed, which affected all 15/15 pairs of mean values (Control-EM) (Table 5). The analysis of variance for A1–5 (ANOVA-LSD) provided similar results as for A5–10, however, it also revealed numerous significant differences (Figure 8b; Table 2). The calculated coefficient of correlation indicated that an increase in the content of aggregates A1–5 causes a significant decrease (r = −0.372) in the amount of water available for plants (AWC) and a substantial increase (r = 0.324) in the volume of air (FAC) (Table 3).
The content of the smallest of the analyzed aggregates, A<1 (<1 mm) showed low variability throughout the measurements, CV = 0.07. The A<1 content ranged between 64.84% (Control) and 97.45% (EM) (Table 5). The lowest annual mean content was observed in Control soil (year II of the study, 70.45%), and in the soil with EM-A (year IV, 89.64%). The highest mean values of A<1 were noted in year V of the experiment in the soil inoculated with the biopreparation (EM, 96.03%), and in the soil without EM-A (Control, 88.02%) (Figure 8c). The addition of the content of A<1 brings the sum of the aggregates, including A5–10 and A1–5, to 100%. This is a close correlation confirmed statistically (A5–10: r = −0.860; A1–5: r = −0.991) (Table 3). It should be emphasized that the fraction of <1 mm aggregates includes not only small aggregates but also elementary particles of the fraction of sand originating from dispersed aggregates [14,62,63,97]. The relationship between the shares of particular fractions of aggregates affected all compared pairs of mean annual values and the content of aggregates A<1 was higher in the soil inoculated with EM-A than in Control soil (Table 5). This indicates an unfavorable effect of EM-A on the aggregate structure of soil. The statistical analysis (ANOVA–LSD) provided additional evidence by proving the statistical significance of differences (Figure 8c; Table 2).
The mean weight diameter (MWD) of aggregates, calculated on the basis of the shares of water-stable fractions of aggregates, is an index that is considered by experts as a useful estimator of the stability of the aggregate structure of soil [71,72,102,103]. The MWD values showed certain statistical variations (CV = 0.27) within the range of 0.32 mm (EM) to 1.33 mm (Control) (Table 5). The lowest mean annual values of MWD were noted in year V of the study, amounting to 0.36 mm for the soil with EM-A and 0.65 mm for Control soil. On the other hand, the highest mean values for the soil inoculated with EM-A were recorded in year IV (MWD = 0.57 mm) and for the control soil in year II, with MWD = 1.14 mm (Figure 8d). What emerges from the comparative analysis of the results is a destructive effect of EM-A on soil structure. In the comparison of 15 pairs of results, in each case, the MWD for the control soil was higher than for MWD of the soil with EM-A (Table 5). This was, moreover, confirmed by the results from the analysis of LSD (ANOVA), as the MWD for the soil with EM-A often had the lowest statistical significance (Figure 8d; Table 2). The correlation analysis (Table 3) revealed a positive and significant effect of organic carbon on the formation of a stable aggregate structure in the soil (r = 0.383).According to the classification of the stability of aggregates separated in water, as in Le Bissonnais [72] and Paluszek [100,101], the soil after the application of EM-A could be classified, in 12/15 cases, as “poor”, and in 3/15 cases as “very poor”. However, Control soil, in 8/15 cases, was classified as “medium”, and in 7/15 cases as “poor”. The results show good correspondence with other studies in the field [62,63,101,104]. The referenced studies were conducted in the same soil climate conditions, and with respect to the results of the water stability of aggregates, they were the closest to the results obtained for the soil without EM-A (Control). What is important to remember is that any decrease in the stability of soil aggregates increases the risk of soil crusting, which may cause accelerated surface runoff of precipitation waters, and thus an increase in soil susceptibility to water erosion [62,71,72,100,101,102,103]. The results from our study are in contrast with the laboratory tests carried out as part of model studies on 1-cm3 cylindrical soil samples. The studies in question [25,27,28] reported that the application of the biopreparation EM-A to the soil enhanced the resistance of aggregates to the scouring effect of water, increased the soil retention capacity, and caused a decrease in its density. Their results exemplify that model experiments cannot necessarily be confirmed in the field. Experiments conducted in the natural environment or the actual conditions of a cultivated field will always constitute the best method for the verification of the impact of various factors on soil.

4. Conclusions

The deterioration of the stability of soil structure, observed in this study, did not have any significant effect on the density of the soil and its total porosity (BD and TP), air properties (FAC and FAP), water properties (FC, AWC, and UWC), or the FC/TP ratio. It was found that the degree of their changes was rather small and statistically insignificant. The reduction in the water stability of aggregates should be attributed primarily to the distinctly reduced content of organic carbon (TOC) in the soil after the application of the biopreparation EM-A. As can be concluded from the experiment, the content of organic carbon (TOC) and the water stability of aggregates proved to be sensitive indicators of changes occurring in the soil. The content of the water-stable aggregates of the fractions of 5–10 and 1–5 mm was shown to be a good and useful indicator for the estimation of the physical status of soil. In the ecological approach, the introduction of any colonies of foreign organisms and/or components, organic or mineral, to soil can cause a disturbance in the functioning of the soil environment. Therefore, the application of such biopreparations as EM-A requires serious consideration, because they accelerate the decomposition of soil organic matter. Carbon sequestration in soil humus is a positive phenomenon. It increases resistance to physical degradation. Variations in yield levels between vegetation seasons can usually be explained by weather conditions. However, the progressing degradation of soil, i.e., the deterioration of its numerous properties, is difficult to observe in year-to-year comparisons. The reported study has shown that the answer to the question posed by Cóndor-Golec et al. [46]: “Effective Microorganisms: Myth or reality?”, should rather be “myth”. Bearing in mind the economic aspect of the application of EMs, it has been found, in field experiments, that the yield-forming effect of the application of preparations containing effective microorganisms is negligible and statistically insignificant, and as such, it is economically non-viable. Therefore, an entirely unexpected implication from this study is that the dissemination of knowledge and research results among farmers is of great importance for numerous reasons. It is typically the marketing activity of the producers of various soil “improvers” that meets with a warmer reception. One of the more significant findings to emerge from this study is that, instead of plant production, EM-type preparations could be put to better use in wastewater treatment, the stabilization of sewage sludge, or in the composting of biodegradable waste.

Author Contributions

Conceptualisation, J.P.; methodology, J.P., S.L. and H.S.; investigation, J.P.; formal analysis, J.P., S.L. and H.S.; writing and editing, J.P. and S.L. All the authors discussed the data. All authors have read and agreed to the published version of the manuscript.

Funding

This research was financed from the budget of the Ministry of Science and Higher Education in 2010–2020.

Conflicts of Interest

The authors declare no conflict of interest.

References

  1. Lal, R. Restoring Soil Quality to Mitigate Soil Degradation. Sustainability 2015, 7, 5875–5895. [Google Scholar] [CrossRef] [Green Version]
  2. Blum, W.E.H. Basic concepts: Degradation, Resilience, and Rehabilitation. In Methods for Assessment of Soil Degradation; CRC Press: Boca Raton, FL, USA; New York, NY, USA, 1998. [Google Scholar]
  3. Lal, R. Soil and sustainability agriculture. A review. Agron. Sustain. Dev. 2008, 28, 57–65. [Google Scholar] [CrossRef]
  4. Lal, R. Soils and world food security. Soil Tillage Res. 2009, 102, 1–4. [Google Scholar] [CrossRef]
  5. Lorenz, K.; Lal, R.; Ehlers, K. Soil organic carbon stock as an indicator for monitoring land and soil degradation in relation to United Nations’ Sustainable Development Goals. Land Degrad. Dev. 2019, 30, 824–838. [Google Scholar] [CrossRef]
  6. Pranagal, J. Intensity of agricultural land use and soil degradation processes. Adv. Agric. Sci. Prob. Issues 2009, 535, 321–329. [Google Scholar]
  7. Dahm, H.; Wrótniak-Drzewiecka, W.; Pauter, A. Microbial biofertilizers. In Physical, Chemical and Biological Processes in Soils; Szajdak, L.W., Karabanow, A.K., Eds.; Prodruk: Poznań, Poland, 2010; pp. 537–547. [Google Scholar]
  8. Nannipieri, P.; Falchini, L.; Landi, L.; Pietramellara, G. Management of soil microbiota. In Biological Resource Management; Balazs, E., Galante, E., Lynch, J.M., Shepers, J.S., Werner, D., Toutant, J.P., Werry, P.A., Eds.; Springer: Berlin/Heidelberg, Germany, 2000; pp. 237–255. [Google Scholar]
  9. Rodrigez, H.; Fraga, R. Phosphate solubilizing bacteria and their role in plant growth promotion. Botechnol. Adv. 1999, 17, 319–339. [Google Scholar] [CrossRef]
  10. Vessey, J.K. Plant growth promoting rhizobacteria as biofertilizers. Plant Soil 2003, 255, 571–586. [Google Scholar] [CrossRef]
  11. Martyniuk, S.; Księżak, J. Evaluation of pseudo-microbial biopreparations used in crop production. Pol. J. Agron. 2011, 6, 27–33. [Google Scholar]
  12. Panhurst, C.E.; Rogers, S.L.; Gupta, V.S.R. Microbial parameters for monitoring soil pollution. In Environmental Biomonitoring; Lynch, J.M., Wiseman, A., Eds.; Cambridge University Press: Cambridge, UK, 1998; pp. 46–69. [Google Scholar]
  13. Amézketa, E. Soil aggregate stability: A review. J. Sustain. Agric. 1999, 14, 82–151. [Google Scholar] [CrossRef]
  14. Bronick, C.J.; Lal, R. Soil structure and management: A review. Geoderma 2005, 124, 3–22. [Google Scholar] [CrossRef]
  15. Pagliai, M.; Vignozzi, N.; Pellegrini, S. Soil structure and the effect of management practices. Soil Tillage Res. 2004, 79, 131–143. [Google Scholar] [CrossRef]
  16. Pranagal, J.; Podstawka-Chmielewska, E.; Słowińska-Jurkiewicz, A. Influence of EM on selected physical properties of a Haplic Podzol during a ten-year fallow period. Pol. J. Environ. Stud. 2007, 16, 875–880. [Google Scholar]
  17. Pranagal, J.; Podstawka-Chmielewska, E. Physical properties of a Rendzic Phaeozem during a ten-year period of fallowing under the conditions of south-eastern Poland. Geoderma 2012, 189–190, 262–267. [Google Scholar] [CrossRef]
  18. Shukla, M.K.; Lal, R. Air permeability of soil. In Encyclopedia of Soil Science; Lal, R., Ed.; Marcel Dekker: New York, NY, USA, 2006; pp. 60–63. [Google Scholar]
  19. Higa, T. Revolution in the Protection of Our Planet; Foundation–SGGW Development: Warsaw, Poland, 2003; 152p. (In Polish) [Google Scholar]
  20. Kaczmarek, Z.; Wolna-Maruwka, A.; Jakubus, M. Changes of the number of selected microorganism groups and enzymatic activity in the soil inoculated with Effective Microorganisms (EM). J. Res. Appl. Agric. Eng. 2008, 53, 122–127. [Google Scholar]
  21. Kucharski, J.; Jastrzębska, E. The role of Effective Microorganisms (EM) and soil microorganisms in shaping microbial properties of soil. Adv. Agric. Sci. Prob. Issues 2005, 507, 315–322. [Google Scholar]
  22. Schenck zu Schweinsberg-Mickan, M.; Müller, T. Impact of effective microorganisms and other biofertilizers on soil microbial characteristics, organic-matter decomposition, and plant growth. J. Plant Nut. Soil Sci. 2009, 172, 704–712. [Google Scholar] [CrossRef]
  23. Kocoń, A.; Gałązka, A. Effect of preparations with effective microorganisms on physicochemical properties of soil and on plant yields. Stud. Rep. IUNG-PIB 2015, 45, 113–125. (In Polish) [Google Scholar]
  24. Gajewski, P.; Kaczmarek, Z.; Owczarzak, W.; Jakubus, M. Impact of sludge and municipal compost additions as well as effective microorganisms on selected properties of the oro-humus mineral soil level. Part II. Structure condition. J. Res. Appl. Agric. Eng. 2012, 57, 87–91. [Google Scholar]
  25. Gajewski, P.; Kaczmarek, Z.; Owczarzak, W.; Jakubus, M.; Mocek, A. Impact of addition of organic additives and EM-A preparation on physical, chemical and structural state of the arable-humus soil horizon. Part III. Structure condition. J. Res. Appl. Agric. Eng. 2013, 58, 119–123. [Google Scholar]
  26. Gajewski, P. Influence of the EM-A preparation on the structure properties in various mineral soils. Soil Sci. Ann. 2016, 67, 179–184. [Google Scholar] [CrossRef] [Green Version]
  27. Gajewski, P.; Kaczmarek, Z.; Owczarzak, W.; Glina, B.; Mocek-Płóciniak, A.; Gaweł, E.; Grzelak, M.; Świerk, D. The influence of the EM-A preparation on the properties of structure in arable mineral soils. Fresenius Environ. Bull. 2016, 25, 4184–4191. [Google Scholar]
  28. Kaczmarek, Z.; Owczarzak, W.; Gajewski, P.; Mrugalska, L. Impact of effective microorganisms on selected physical and aqueous properties and the structure state of the arable-humus horizon of mineral soils at varying content of organic matter in them. Part I. Physical and water properties. J. Res. Appl. Agric. Eng. 2011, 56, 179–184. [Google Scholar]
  29. Dziamba, S.; Pranagal, J.; Wielgosz, E. Some properties of Haplic Luvisol after one-year application of Effective Microorganisms (EM). Adv. Agric. Sci. Prob. Issues 2009, 542, 139–145. [Google Scholar]
  30. Frąszczak, B.; Kleiber, T.; Klama, J. Impact of Effective Microorganisms on yields and nutrition of sweet basil (Ocimum basilicum L.) and microbiological properties of the substrate. Afr. J. Agric. Res. 2012, 7, 5756–5765. [Google Scholar] [CrossRef]
  31. Kleiber, T.; Starzyk, J.; Bosiacki, M. Effect of nutrient solution, Effective Microorganisms (EM-A), and assimilation illumination of plants on the induction of the growth of lettuce (Lactuca sativa L.) in hydroponic cultivation. Acta Agrobot. 2013, 66, 27–38. [Google Scholar] [CrossRef] [Green Version]
  32. Tyburski, J.; Łachacz, A. The effectiveness of agents improving heavy soils in organic farms. In Summary of Results of Studies on Organic Farming Realized in 2009; Ministry of Agriculture and Rural Development: Warsaw, Poland, 2010; Volume 318, pp. 267–276. (In Polish) [Google Scholar]
  33. Tołoczko, W.; Trawczyńska, A.; Niewiadomski, A. Content of organic compounds in soils fertilized with EM preparation. Soil Sci. Ann. 2009, 60, 97–101. [Google Scholar]
  34. Kowalska, J. Effect of fertilization and microbiological bio-stimulators on healthiness and yield of organic potato. Prog. Plant Prot. 2016, 56, 230–235. [Google Scholar] [CrossRef]
  35. Kaczmarek, Z.; Jakubus, M.; Grzelak, M.; Mrugalska, L. Impact of the addition of various doses of Effective Microorganisms to arable-humus horizons of mineral soils on their physical and water properties. J. Res. Appl. Agric. Eng. 2008, 53, 118–121. [Google Scholar]
  36. Van Vliet, P.C.J.; Bloem, J.; de Goede, R.G.M. Microbial diversity, nitrogen loss and grass production after addition of Effective Microorganisms® (EM) to slurry manure. Appl. Soil Ecol. 2006, 32, 188–198. [Google Scholar] [CrossRef]
  37. Mayer, J.; Scheid, S.; Widmer, F.; Fließach, A.; Oberholzer, H.-R. How effective are “Effective microorganisms® (EM)”? Results from a field study in temperate climate. Appl. Soil Ecol. 2010, 46, 230–239. [Google Scholar] [CrossRef]
  38. Khaliq, A.; Abbasi, M.K.; Hussain, T. Effects of integrated use of organic and inorganic nutrient sources with effective microorganisms (EM) on seed cotton yield in Pakistan. Bioresour Technol. 2006, 97, 967–972. [Google Scholar] [CrossRef] [PubMed]
  39. Ismail, S.M. Influence of effective microorganisms and green manure on soil properties and productivity of pearl millet alfalfa grown on sandy loam in Saudi Arabia. Afr. J. Microb. Res. 2013, 7, 375–382. [Google Scholar] [CrossRef] [Green Version]
  40. Dexter, A.R. Soil physical quality. Part I. theory, effects of soil texture, density, and organic matter, and effects on root growth. Geoderma 2004, 120, 201–214. [Google Scholar] [CrossRef]
  41. Dexter, A.R. Soil physical quality: Part II. Friability, tillage, tilth and hard-setting. Geoderma 2004, 120, 215–225. [Google Scholar] [CrossRef]
  42. Dexter, A.R. Soil physical quality: Part III: Unsaturated hydraulic conductivity and general conclusions about S-theory. Geoderma 2004, 120, 227–239. [Google Scholar] [CrossRef]
  43. Di Giuseppe, D.; Melchiorre, M.; Tessari, U.; Faccini, B. Relationship between particle density and soil bulk chemical composition. J. Soils Sediments 2016, 16, 909–915. [Google Scholar] [CrossRef]
  44. Reynolds, W.D.; Bowman, B.T.; Drury, C.F.; Tan, C.S.; Lu, X. Indicators of good soil physical quality: Density and storage parameters. Geoderma 2002, 110, 131–146. [Google Scholar] [CrossRef]
  45. Pranagal, J.; Oleszczuk, P.; Tomaszewska-Krojańska, D.; Kraska, P.; Różyło, K. Effect of biochar application on the physical properties of Haplic Podzol. Soil Tillage Res. 2017, 174, 92–103. [Google Scholar] [CrossRef]
  46. Cóndor-Golec, A.F.; Pérez, P.G.; Lokare, C. Effective Microorganisms: Myth or reality? Rev. Peru. Biol. 2007, 14, 315–319. [Google Scholar]
  47. IUSS Working Group WRB. World Reference Base for Soil Resources 2014, Update 2015. International Soil Classification System for Naming Soils and Creating Legends for Soil Maps; World Soil Resources Reports No. 106; FAO: Rome, Italy, 2015. [Google Scholar]
  48. Domżał, H.; Pranagal, J. Pedological characteristics of research site for studying climate of the cultivated field. Adv. Agric. Sci. Prob. Issues 1995, 419, 9–14. [Google Scholar]
  49. Klute, A. Methods of Soil Analysis. 1. Physical and Mineralogical Methods; ASA-SSSA Inc.: Madison, WI, USA, 1986. [Google Scholar]
  50. Blake, G.R.; Hartge, K.H. Particle density. In Methods of Soil Analysis. 1. Physical and Mineralogical Methods; Klute, A., Ed.; ASA-SSSA Inc.: Madison, WI, USA, 1986; pp. 377–382. [Google Scholar]
  51. Blake, G.R.; Hartge, K.H. Bulk density. In Methods of Soil Analysis. 1. Physical and Mineralogical Methods; Klute, A., Ed.; ASA-SSSA Inc.: Madison, WI, USA, 1986; pp. 363–375. [Google Scholar]
  52. Danielson, R.E.; Sutherland, P.L. Porosity. In Methods of Soil Analysis. 1. Physical and Mineralogical Methods; Klute, A., Ed.; ASA-SSSA Inc.: Madison, WI, USA, 1986; pp. 443–460. [Google Scholar]
  53. Gardner, W.H. Water content. In Methods of Soil Analysis. 1. Physical and Mineralogical Methods; Klute, A., Ed.; ASA-SSSA Inc.: Madison, WI, USA, 1986; pp. 493–541. [Google Scholar]
  54. Cassel, D.K.; Nielsen, D.R. Field capacity and available water capacity. In Methods of Soil Analysis. 1. Physical and Mineralogical Methods; Klute, A., Ed.; ASA-SSSA Inc.: Madison, WI, USA, 1986; pp. 901–924. [Google Scholar]
  55. Canarache, A.; Vintila, I.; Munteanu, I. Elsevier’s Dictionary of Soil Science: Definitions in English with French, German, and Spanish Word Translations; Elsevier, BV: Amsterdam, The Netherlands, 2006. [Google Scholar]
  56. Olness, A.; Clapp, C.E.; Liu, R.; Palazzo, A.J. Biosoilds and their effect on soil properties. In Handbook of Soil Conditioners; Wallace, A., Terry, R.E., Eds.; Marcel Dekker: New York, NY, USA, 1998; pp. 141–165. [Google Scholar]
  57. Reynolds, W.D.; Drury, C.F.; Yang, X.M.; Tan, C.S. Optimal soil physical quality inferred through structural regression and parameter interactions. Geoderma 2008, 146, 466–474. [Google Scholar] [CrossRef]
  58. Skopp, J.; Janson, M.D.; Doran, J.W. Steady—State aerobic microbial activity as a function of soil water content. Soil Sci. Soc. Am. J. 1990, 54, 1619–1625. [Google Scholar] [CrossRef] [Green Version]
  59. Kemper, W.D.; Rosenau, R.C. Aggregate stability and size distribution. In Methods of Soil Analysis. Part 1. Agronomy Monograph 9, 2nd ed.; Klute, A., Ed.; American Society of Agronomy: Madison, WI, USA, 1986; pp. 425–442. [Google Scholar]
  60. Drewry, J.J.; Cameron, K.C.; Buchan, G.D. Pasture yield and soil physical property responses to soil compaction from treading and grazing – a review. Aust. J. Soil Res. 2008, 46, 237–256. [Google Scholar] [CrossRef]
  61. Du, Z.; Liu, S.; Li, K.; Ren, T. Soil organic carbon and physical quality as influenced by long-term application of residue and mineral fertiliser in the North China Plain. Aust. J. Soil Res. 2009, 47, 585–591. [Google Scholar] [CrossRef]
  62. Paluszek, J. Criteria of evaluation of physical quality of polish arable soils. Acta Agrophys. 2011, 191, 1–139. [Google Scholar]
  63. Pranagal, J. The Physical State of Selected Silty Soils of on the Lublin Region. Ph.D. Thesis, University of Life Sciences in Lublin, Lublin, Poland, 2011; pp. 1–129. [Google Scholar]
  64. Mentges, M.I.; Reichert, J.M.; Rodrigues, M.F.; Awe, G.O.; Mentges, L.R. Capacity and intensity soil aeration properties affected by granulometry, moisture, and structure in no-tillage soils. Geoderma 2016, 263, 47–59. [Google Scholar] [CrossRef]
  65. Olness, A.; Archer, D. Effect of organic carbon on available water in soil. Soil Sci. 2005, 170, 90–101. [Google Scholar] [CrossRef]
  66. Wang, W.; Li, J.; Su, L.; Wang, Q. Soil air permeability model based on soil physical basic parameters. Nongye Jixie Xuebao/Trans. Chin. Soc. Agric. Mach. 2015, 46, 125–130. [Google Scholar] [CrossRef]
  67. Asgarzadeh, H.; Mosaddeghi, M.R.; Dexter, A.R.; Mahboubi, A.A.; Neyshabouri, M.R. Determination of soil available water for plants: Consistency between laboratory and field measurements. Geoderma 2014, 226–227, 8–20. [Google Scholar] [CrossRef]
  68. Githinji, L. Effect of biochar application rate on soil physical and hydraulic properties of a sandy loam. Arch. Agron. Soil Sci. 2014, 60, 457–470. [Google Scholar] [CrossRef]
  69. Iversen, B.V.; Schjønning, P.; Poulsen, T.G.; Moldrup, P. In-situ, on-situ and laboratory measurements of soil air permeability: Boundary conditions and measurement scale. Soil Sci. 2001, 166, 97–106. [Google Scholar] [CrossRef]
  70. Kuncoro, P.H.; Koga, K.; Satta, N.; Muto, Y. A study on the effect of compaction on transport properties of soil gas and water I: Relative gas diffusivity, air permeability, and saturated hydraulic conductivity. Soil Tillage Res. 2014, 143, 172–179. [Google Scholar] [CrossRef]
  71. Darboux, F.; Le Bissonnais, Y. Changes in structural stability with soil surface crusting: Con-sequences for erodibility estimation. Eur. J. Soil Sci. 2007, 58, 1107–1114. [Google Scholar] [CrossRef]
  72. Le Bissonnais, Y. Aggregate stability and assessment of soil crustability and erodibility: I. Theory and methodology. Eur. J. Soil Sci. 1996, 47, 425–437. [Google Scholar] [CrossRef]
  73. Tisdall, J.M. Formation of soil aggregates and accumulation of soil organic matter. In Structure and Organic Matter Storage in Agricultural Soils; Carter, M.R., Stewart, D.A., Eds.; Lewis Publishers, CRC Press: Boca Raton, FL, USA, 1996; pp. 57–96. [Google Scholar]
  74. Tisdall, J.M.; Oades, J.M. Organic matter and water-stable aggregates in soils. J. Soil Sci. 1982, 33, 141–163. [Google Scholar] [CrossRef]
  75. Jones, C.A. Effect of soil texture on critical bulk densities for root growth. Soil Sci. Soc. Am. J. 1983, 47, 1208–1212. [Google Scholar] [CrossRef]
  76. Dexter, A.R.; Czyż, E.A. Applications of s-theory in the study of soil physical degradation and its consequences. Land Degrad. Dev. 2007, 18, 369–381. [Google Scholar] [CrossRef]
  77. Carter, M.R. Temporal variability of soil macroporosity in a fine sandy loam under mouldboard ploughing and direct drilling. Soil Tillage Res. 1988, 12, 37–51. [Google Scholar] [CrossRef]
  78. McQueen, D.J.; Shepherd, T.G. Physical changes and compaction sensitivity of a fine textured, poorly drained soil (Typic Endoaquept) under varying durations of cropping, Manawatu Region, New Zealand. Soil Tillage Res. 2002, 63, 93–107. [Google Scholar] [CrossRef]
  79. Kowda, W.A. Basics of Soil Science; PWRiL: Warsaw, Poland, 1984. [Google Scholar]
  80. Thompson, L.M.; Troeh, F.R. Soils and Soil Fertility; McGraw–Hill, Inc.: New York, NY, USA, 1978. [Google Scholar]
  81. Cockroft, B.; Olsson, K.A. Case study of soil quality in south-eastern Australia: Management of structure for roots in duplex soils. In Soil Quality for Crop Production and Ecosystem Health; Gregorich, E.G., Carter, M.R., Eds.; Developments in Soil Science; Elsevier: New York, NY, USA, 1997; Volume 25, pp. 339–350. [Google Scholar]
  82. Walczak, R.; Ostrowski, J.; Witkowska-Walczak, B.; Sławiński, C. Hydrophysical characteristics of Polish mineral arable soils. Acta Agrophys. 2002, 79, 1–64. [Google Scholar]
  83. Drewry, J.J. Natural recovery of soil physical properties from treading damage of pastoral soils in New Zealand and Australia: A review. Agric. Ecosyst. Environ. 2006, 114, 159–169. [Google Scholar] [CrossRef]
  84. Grable, A.R.; Siemer, E.G. Effects of bulk density, aggregate size, and soil water suction on oxygen diffusion, redox potentials and elongation of corn roots. Soil Sci. Soc. Am. Proc. 1968, 32, 180–186. [Google Scholar] [CrossRef]
  85. Mayers, W.S.; Barrs, H.D. Roots in irrigated clay soil: Measurement techniques and responses to root zone conditions. Irrig. Sci. 1991, 12, 125–134. [Google Scholar]
  86. Mueller, L.; Kay, B.D.; Been, B.; Hu, C.; Zhang, Y.; Wolff, M.; Eulenstein, F.; Schindler, U. Visual assessment of soil structure: Part II. Implications of tillage, rotation and traffic on sites in Canada, China and Germany. Soil Tillage Res. 2008, 103, 188–196. [Google Scholar] [CrossRef]
  87. Poulsen, T.G.; Iversen, B.V.; Yamaguchi, T.; Moldrup, P.; Schjønning, P. Spatial and temporal dynamics of air permeability in a constructed fields. Soil Sci. 2001, 166, 153–162. [Google Scholar] [CrossRef]
  88. Kutílek, M. Soil hydraulic properties as related to soil structure. Soil Tillage Res. 2004, 79, 175–184. [Google Scholar] [CrossRef]
  89. Leśny, J. Meteorology and Climatology Research. Acta Agrophys. 2010, 184, 1–263. [Google Scholar]
  90. Petrosyants, M.A.; Kislov, A.V.; Semenov, E.K. Principal concepts in meteorology and climatology. Vestn. Mosk. Univ. S 5 Geogr. 2005, 1, 83–91. [Google Scholar]
  91. White, R.E. Principles and Practice of Soil Science, 4th ed.; Blackwell Publishing: Oxford, UK, 2006. [Google Scholar]
  92. Usowicz, B.; Usowicz, Ł. Point measurements of soil water content and its spatial distribution in cultivated fields. Acta Agrophys. 2004, 4, 573–588. [Google Scholar]
  93. Staricka, J.A.; Benoit, G.R. Freeze-drying effects on wet and dry soil aggregate stability. Soil Sci. Soc. Am. J. 1995, 59, 218–223. [Google Scholar] [CrossRef]
  94. Paluszek, J. Comparing the physical quality of Polish chernozems classified in various complexes of agricultural suitability. Pol. J. Environ. Stud. 2016, 25, 259–271. [Google Scholar] [CrossRef]
  95. Kaczmarek, Z.; Owczarzak, W.; Mrugalska, L.; Grzelak, M. The influence of effective microorganisms for some of physical and water properties on arable-humus horizons of mineral soils. J. Res. Appl. Agric. Eng. 2007, 52, 73–77. [Google Scholar]
  96. Craul, P.J. Urban Soils: Applications and Practices; Wiley: Toronto, ON, USA, 1999. [Google Scholar]
  97. Oades, J.M.; Waters, A.G. Aggregate hierarchy in soils. Aust. J. Soil Res. 1991, 29, 815–828. [Google Scholar] [CrossRef]
  98. Cosentino, D.; Chenu, C.; Le Bissonnais, Y. Aggregate stability and microbial community dynamics under drying-wetting cycles in a silt loam soil. Soil Biol. Biochem. 2006, 38, 2053–2062. [Google Scholar] [CrossRef]
  99. Malamoud, K.; McBratney, A.B.; Minasny, B.; Field, D.J. Modelling how carbon affect soil structure. Geoderma 2009, 149, 19–26. [Google Scholar] [CrossRef]
  100. Paluszek, J. Assessment of soil structure of Luvisols developed from loess classified in various complexes of agricultural suitability. Soil Sci. Ann. 2013, 64, 41–48. [Google Scholar] [CrossRef]
  101. Paluszek, J. Air-dry and water-stable soil aggregate distribution of Polish chernozems classified in various complexes of agricultural suitability. Pol. J. Environ. Stud. 2014, 23, 389–397. [Google Scholar]
  102. Barthès, B.; Roose, E. Aggregate stability as an indicator of soil susceptibility to runoff and erosion; validation at several levels. Catena 2002, 47, 133–149. [Google Scholar] [CrossRef] [Green Version]
  103. Vermang, J.; Demeyer, V.; Cornelis, W.M. Aggregate stability and erosion response to antecedent water content of a loess soil. Soil. Sci. Soc. Am. J. 2009, 73, 718–726. [Google Scholar] [CrossRef]
  104. Domżał, H.; Pranagal, J. Aggregate stability of soil as an index of soil degradation caused by the agricultural use. Fragm. Agron. 1994, 3, 22–34. [Google Scholar]
Figure 1. The average monthly air temperature and precipitation during the years of the experiment (ae) and months of the research (I–V).
Agronomy 10 01049 g001
Figure 2. Scheme of field experiment. Control means soil without effective microorganism (EM-A), TEM means soil with EM-A application.
Agronomy 10 01049 g002
Figure 3. The annual mean values of soil total organic carbon content (TOC) during the five-year study. Notes: Control: soil without EM-A (n = 150), TEM: soil with EM-A application (n = 150), I–V: study year. Each letter (a, ab, bc and d) means a significant difference (Control or TEM × study year) according to Tukey’s lowest significant difference (LSD).
Agronomy 10 01049 g003
Figure 4. The annual mean values of soil bulk density (BD) (a) and total porosity (TP) (b) during the five-year study. Notes: Control: soil without EM-A (n = 150), TEM: soil with EM-A application (n = 150), I–V: study year. Each letter (a, ab, abc, and c) means a significant difference (Control or TEM × study year) according to Tukey’s lowest significant difference (LSD).
Agronomy 10 01049 g004
Figure 5. The annual mean values of field air capacity (FAC) (a) and air permeability (FAP) (b) of soil (at −15.5 kPa) during the five-year study. Notes: Control: soil without EM-A (n = 150), TEM: soil with EM-A application (n = 150), I–V: study year. Each letter (a, ab, and b) means a significant difference (Control or TEM × study year) according to Tukey’s lowest significant difference (LSD).
Agronomy 10 01049 g005
Figure 6. The annual mean values of soil water properties: soil moisture (SM) (a), field water capacity (at −15.5 kPa) (FC) (b), available water content (AWC) (c), and unavailable water content (UWC) (d) during the five-year study. Notes: Control: soil without EM-A (n = 150), TEM: soil with EM-A application (n = 150), I–V: study year. Each letter (a, ab and b) means a significant difference (Control or TEM × study year) according to Tukey’s lowest significant difference (LSD).
Agronomy 10 01049 g006
Figure 7. The annual mean values of the FC/TP ratio during the five-year study. Notes: Control: soil without EM-A (n = 150), TEM: soil with EM-A application (n = 150), I–V: study year. Each letter (a, ab and b) means a significant difference (Control or TEM × study year) according to Tukey’s lowest significant difference (LSD).
Agronomy 10 01049 g007
Figure 8. The annual mean values of water-stable aggregate content: A5–10 (a), A1–5 (b), A<1 (c), and mean weight diameter (MWD) (d) during the five-year study. Notes: Control: soil without EM-A (n = 150), TEM: soil with EM-A application (n = 150), I–V: study year. Each letter (a, ab, abc, b, bc, c, cd and d) means a significant difference (Control or TEM × study year) according to Tukey’s lowest significant difference (LSD).
Agronomy 10 01049 g008
Table 1. Mean values of soil properties on sampling dates.
Years DateTOCBDTPFACFAP
g × kg−1Mg × m−3m3 × m−3m3 × m−310−8 × m2 × Pa−1 × s−1
ControlTEMControlTEMControlTEMControlTEMControl
Ii8.696.211.431.510.4520.4210.1340.08644.3
ii7.955.661.471.470.4370.4370.0980.0713.1
iii6.875.361.381.390.4710.4670.1410.136195.9
IIi7.945.651.321.450.4940.4440.1720.11249.4
ii7.395.321.151.390.5590.4670.2780.17846.9
iii7.424.861.411.430.460.4520.1430.15772.2
IIIi7.236.191.461.470.4410.4370.1050.13.2
ii5.995.881.451.550.4440.4060.1450.09617.2
iii6.265.941.461.50.4410.4250.1490.12868.6
IVi9.867.951.481.530.4330.4140.0870.0752.9
ii9.127.641.461.50.4220.4440.0990.11314.6
iii8.767.461.531.540.4140.4090.080.0695.3
Vi10.117.651.291.310.4940.4890.160.16735.6
ii10.027.721.191.20.5350.5310.1910.19124.7
iii10.037.811.361.520.4680.4070.1690.0826
CV0.170.170.080.070.090.080.350.351.12
I–V: study year, i–iii: sampling date, Control: soil without EM-A, TEM: soil with EM-A application, TOC: total organic carbon content, BD: soil bulk density, TP: total porosity, FAC: air capacity at −15.5 kPa, FAP: air permeability at −15.5 kPa, CV: the coefficient of variation. Number of replicates: Control: n = 10, TEM: n = 10, i, ii, iii: n = 20, I, … V: n = 60.
Table 2. The mean values of the investigated properties of the five-year experiment.
PropertiesControlTEMLSD0.05
TOC (g × kg−1)8.24a6.49b0.3498
BD (Mg × m−3)1.39a1.45a0.0586
TP (m3 × m−3)0.464a0.443a0.0223
FAC (m3 × m−3)0.143a0.117a0.0275
FAP (10−8 × m2 × Pa−1 × s−1)47.3a24.1a37.382
SM (kg × kg−1)0.166a0.154a0.0291
FC (m3 × m−3)0.321a0.321a0.0142
AWC m3 × m−3)0.240a0.247a0.0134
UWC (m3 × m−3)0.079a0.078a0.0053
FC/TP0.69a0.73a0.0433
A5–10, %3.31a0.89b0.9498
A1–5, %15.03a6.38b2.4756
A<1, %87.70a92.75b3.1660
MWD, mm0.85a0.45b0.1104
Control: soil without EM-A (n = 150), TEM: soil with EM-A application (n = 150), TOC: total organic carbon content, BD: soil bulk density, TP: total porosity, FAC: air capacity at −15.5 kPa, FAP: air permeability at −15.5 kPa, SM: soil moisture at sampling, FC: field water capacity, AWC: available water content, UWC: unavailable water content, FC/TP: field water capacity/total porosity ratio, A5–10, A1–5 and A<1: water-stable aggregate content, MWD: mean weight diameter, LSD: lowest significant difference. Each letter (a, b) means a significant difference (Control × TEM) according to Tukey’s lowest significant difference (LSD).
Table 3. The correlation coefficient values for the investigated soil properties (significance value |r| > 0.368).
PropertiesTOCSMBDTPFCFC/TPAWCUWCFACFAPA5–10A1–5A<1
SM−0.271
BD−0.2840.125
TP0.288−0.106−0.988 *
FC0.355−0.3350.083−0.084
FC/TP0.021−0.0870.814 *−0.828 *0.610 *
AWC0.489 *−0.392 *−0.1990.1560.751 *0.305
UWC−0.3160.0830.653 *−0.605 *0.1440.536 *−0.468 *
FAC0.0720.061−0.892 *0.906 *−0.444−0.952 *−0.149−0.586 *
FAP0.0230.117−0.565 *0.573 *0.098−0.422 *0.115−0.1790.486 *
A5–100.511 *0.119−0.3350.337−0.021−0.289−0.010−0.1230.3480.279
A1–50.2390.211−0.2140.247−0.164−0.275−0.372 *0.1810.3240.0750.788 *
A<1−0.302−0.1990.245−0.2730.1370.2840.308−0.127−0.338−0.121−0.860 *−0.991 *
MWD0.383 *0.163−0.2100.228−0.086−0.233−0.2410.1100.2820.0770.886 *0.959 *−0.979 *
TOC: total organic carbon content, BD: soil bulk density, TP: total porosity, FAC: air capacity at −15.5 kPa, FAP: air permeability at −15.5 kPa, SM: soil moisture at sampling, FC: field water capacity, AWC: available water content, UWC: unavailable water content, FC/TP: the field water capacity/total porosity ratio, A5–10, A1–5 and A<1: water-stable aggregate content, MWD: mean weight diameter, *: significant correlation coefficient.
Table 4. Mean values of soil properties on sampling dates.
YearsDateSMFCAWCUWCFC/TP
kg × kg−1m3 × m−3m3 × m−3m3 × m−3
ControlTEMControlTEMControlTEMControlTEMControlTEM
Ii0.0950.0810.3180.3350.2290.2450.0890.0910.70.79
ii0.1510.1440.3380.3140.2470.2230.0910.0910.770.72
iii0.2130.2020.3320.3290.2420.2430.0860.0880.70.71
IIi0.1990.1770.3230.3320.2130.260.0790.0730.650.75
ii0.1890.1850.2840.2890.210.2270.070.0630.510.62
iii0.1930.1610.3180.2940.2310.2150.0860.080.690.65
IIIi0.1680.1640.3370.3350.2510.2620.0850.0750.760.77
ii0.1750.1660.3030.3080.2110.2120.0880.0980.680.76
iii0.1840.1740.2950.2960.2180.2220.0740.0750.670.7
IVi0.1290.1220.3460.3350.2630.2460.0830.090.790.81
ii0.1410.1380.3210.330.2410.2510.0820.080.760.74
iii0.2160.2030.3340.3380.2450.2580.0860.0820.810.83
Vi0.1540.1380.3330.3220.2790.2580.0550.0640.670.66
ii0.1020.0910.3470.3410.280.2880.0640.0530.650.65
iii0.1760.1720.2860.3160.2390.2590.060.0680.610.8
CVs0.220.230.060.050.090.090.140.160.110.09
SM: soil moisture at sampling, FC: field water capacity, AWC: available water content, UWC: unavailable water content, the FC/TP ratio. For I–V, i–iii, Control, TEM, CV, and number of replicates, see Table 1.
Table 5. Mean values of the water-stable aggregate content (A5–10, A1–5, and A<1) and mean weight diameters (MWDs) on sampling dates.
Years DateWater-Stable Aggregate Distributions, %MWD
A5–10A1–5A<1mm
mmmmmm
ControlTEMControlTEMControlTEMControlTEM
Ii2.120.249.928.7287.9691.040.620.44
ii2.560.1216.126.681.3293.280.80.43
iii2.840.4410.564.0486.695.520.630.33
IIi2.470.2218.086.2379.4593.550.820.43
ii4.741.0830.426.4564.8492.471.330.48
iii7.021.7825.939.8167.0588.411.270.61
IIIi0.770.69.216.1290.0293.280.550.41
ii1.930.510.425.4587.6594.050.710.4
iii4.020.518.936.9277.0592.580.980.44
IVi5.962.2418.2412.6175.885.151.230.7
ii1.840.8915.268.4882.990.630.880.54
iii3.561.0215.595.8980.8593.130.920.48
Vi3.760.289.562.2786.6897.450.710.32
ii2.782.779.763.9887.4693.450.690.43
iii3.280.647.412.1989.9197.180.540.33
CVs0.220.180.390.430.080.070.260.27
MWD: mean weight diameter of water-stable aggregates. For I–V, i–iii, Control, TEM, CV, and number of replicates, see Table 1.

