Abstract
Continuous cropping of rice (Oryza sativa L.) and wheat (Triticum aestivum L.) deplete soil fertility, reduced crop productivity, and grower’s income. Phosphorus (P) and zinc (Zn) deficiencies are considered important nutritional constraints under rice-wheat cropping system. One strategy to increase crop productivity and grower’s income under the rice-wheat system is the balanced application of P and Zn fertilizers. The objective of this research was to evaluate the impact of sole and various combinations of P (0, 40, 80, and 120 kg ha−1) and Zn levels (0, 5, 10, and 15 kg ha−1) on productivity (grain yield and yield components) and profitability (net returns) of different rice genotypes (cultivars) (fine (cv.Bamati-385) vs. coarse (cv. Fakhre-e-Malakand and cv. Pukhraj)) and their residual effect on the income of the succeeding wheat crop (cv. Siran-2010). The results revealed that both rice and wheat productivity and profitability was higher with the combined application of both nutrients at higher rates (80 and 120 kg P ha−1 and 10 and 15 kg Zn ha−1). The highest productivity and profitability was obtained with the cultivation of hybrid rice “Pukhraj” (Pukhraj > Fakhre-e-Malakand > Basmati-385). It was concluded from this study that application of higher P and Zn levels and growing of hybrid rice increased productivity and profitability under the rice-wheat cropping system.
Keywords:
Oryza sativa L.; genotypes; phosphorus; zinc; yield components; grain yield; hulling percentage; net returns 1. Introduction
Rice (Oryza sativa L.) is one of the most important staple foods for nearly half of the world’s population [1] and provides 50–60% of the calories to 2.7 billion people [2,3,4]. Rice occupies about 11 percent of the world’s agricultural land and ranks second to wheat in terms of cultivated area [5]. Rice is the second most widely consumed cereal in the world next to wheat. Because of population increase, the rice-producing countries will require 70% more rice by the year 2025 [6,7]. In Pakistan, rice is the third largest crop after wheat (Triticum aestivum L.) and cotton (Gossypium hirsutum L.) based on cultivated area, and ranked second after wheat on production basis. It accounts for 5.9% of value added in agriculture and 1.3% of Pakistan’s gross domestic products [8]. According to a previous study [8], rice production in Pakistan occupies an area of 2.96 million hectares with a total production of 6.95 million tons and average yield of 2.35 t ha−1. Although, the average yield of rice in Pakistan has increased by more than 2% per year, yet the yield is still far less than other leading rice growing countries [9,10,11].
One major reason for the low rice yield in the Khyber Pakhtunkhwa Province of Pakistan is the imbalanced use of macro and micronutrients [1,10]. Phosphorus (P) and zinc (Zn) deficiencies are responsible for the low productivity and profitability of rice under the rice-wheat system [11]. Phosphorus induced Zn-deficiency is the most important nutritional constraints for the current rice crop [11,12] and subsequent wheat crop [13], under the rice-wheat system. Both P and Zn-fertilizers can rapidly form insoluble complexes in the soil, rendering them unavailable for plants uptake. Therefore, cultivation of efficient and high yielding rice cultivars with an improved capability to access the soil-bound nutrients are needed [14]. As Zn is absorbed by plants as cations (Zn2+), and P is taken as anions (H2PO4−1 or HPO4−2). These cations and anions attract each other, which facilitates the formation of chemical bonds and restrict P and Zn availability to plants within the soil [15,16]. The excess P in soil binds a large quantity of Zn cause P-induced Zn deficiency [15,16,17,18,19,20,21] that results in reduced shoot Zn content, and reduce plant growth and yield [22]. Next to N and P deficiency, Zn deficiency is the most widespread nutrient disorder, under the rice-based cropping system [23,24]. About the interaction of Zn and P, numerous studies confirmed Zn and P imbalance in the plant, as a result of excessive accumulation of P, causing Zn-imposed deficiency [17,18,19,20]. High soil P levels are one of the most common causes responsible for Zn deficiency in field crops [17], which is one of the most widespread micro-nutritional disorders globally [16].
Inefficient rice genotypes (cultivars) decrease nutrient uptake that reduce plant growth and yield [25]. On the other hand, the efficient and high yielding rice genotypes have enhanced capacity to uptake higher Zn and P from the soil and increase nutrient use efficiency [12]. Recently, a study [11] suggested that the efficient hybrid rice (Pukhraj) produced and partitioned more dry matter (DM) into the reproductive parts (panicles) than the two local rice cultivars (F-Malakand and Bamati-385). Another study [11] also suggested that the higher DM accumulation and greater amounts of partitioning into panicles was observed with an increase in P and Zn levels, and the increase was significantly higher in the coarse than the fine rice genotype. Likewise, the increase in leaf area index (LAI) at different growth stages was also recorded with the increase in P and Zn levels, and the increase was more in the hybrid rice than the two-local rice cultivars [26].
Continuous cropping of rice and wheat under rice-wheat cropping system for several decades deplete P and Zn in the soil [13] and thereby decline crop growth and yield [11,27]. High fertilizer cost [25,27,28,29] and high soil pH also appears to be the main factors associated with the widespread of P and Zn deficiencies [30,31]. The high cost of Zn fertilizers places considerable burden on poor farmers, and therefore, there is need to identify high yielding and tolerant rice cultivars to Zn deficiency [23,24]. For getting high yielding rice and good quality seed, special consideration should be given to the Zn balance in soils and its bioavailability in plants. This is because Zn deficiency in crops can cause yield loss up to 40% without showing any symptom. One strategy to increase crop productivity and profitability under P and Zn deficient soils especially under rice-wheat system is the balanced application of crop nutrients, especially P and Zn. There is lack of research studies on response of “local rice cultivars” vs. “hybrid rice” to P and Zn management on productivity and grower’s income under the rice-wheat system. This study was therefore designed and conducted with an objective to find whether P and Zn fertilizers applied alone (sole) and in various combinations had any significant effect on the productivity and profitability of rice cultivars under the rice-wheat cropping system.
2. Materials and Methods
2.1. Site Description
Field experiment was conducted to investigate the impact of phosphorus (P) and zinc (Zn) levels on three different rice (Oryza sativa L.) genotypes (cultivars), under the rice-wheat cropping system. The experiment was conducted at farmers field in Batkhela, Malakand Agency (Northwest, Pakistan) during summer 2011–2012 (Y1) and 2012–2013 (Y2). Batkhela is located at 34°37’0” N and 71°58’17” E in DMS (Degrees Minutes Seconds) or 34.6167 and 71.9714 (in decimal degrees). The soil of the experimental site (Batkhela) is clay loam, slightly alkaline in reaction (pH = 7.3), non-saline (ECe = 1.02 dS m−1), moderately calcareous in nature (CaCO3 = 7.18%), low in soil fertility containing less organic matter (0.71%), total N (0.51%), extractable P (5.24 mg kg−1), exchangeable potassium (AB-DTPA) of 71 (mg kg−1), and Zn (0.93 mg kg−1).
2.2. Weather Condition
Weather data for the rice-wheat cropping system during 2011–2012 (year one) and 2012–2013 (year two) are given below in Figure 1 [13].
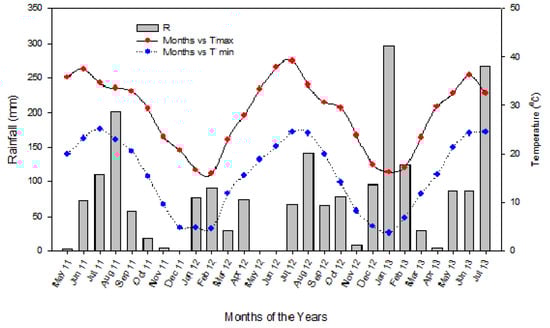
Figure 1.
Weather data for the rice-wheat cropping system during 2011–2012 (year one) and 2012–2013 (year two).
2.3. Experimentation
The experiment was conducted in randomized complete block design with split-plot arrangement having three replications (3 × 48 = 144 plots per year). Combination of factor-A (three rice genotypes) and factor B (four P levels) were allotted to main plots (3 × 4 = 12 treatments in main plots), while factor-C (four Zn levels) was kept in subplots (12 × 4 = 48 plots per replication). A subplot size of 12 m2 (3 m × 4 m) having 300 hills per subplot, and hill to hill distance (one seedling per hill) of 20 cm apart was used resulting in plant density of 25 hills m−2 or 250,000 hills ha−1. A uniform dose of 120 kg N ha−1 as urea and 60 kg K2O ha−1 (sulphate of potash (SOP) or muriate of potash (MOP) was applied to all treatments. All potassium, phosphorus (triple super phosphate), and zinc (zinc sulphate) were applied separately at the time of rice transplanting, while nitrogen was applied in two equal splits, i.e., 50% each at transplanting and 30 days after transplanting. In year one, rice nursery was grown on 4 June 2011 and then the 25-day-old seedlings were transplanted on 29 June 2011. In year two, rice nursery was grown on 11 June 2011, and then the 25-day-old seedlings were transplanted on 5 July 2011. The amount of sulfur was maintained constantly in each plot by adding additional sulfur using SOP. All fertilizers were applied to the respective subplots separately and not mixed with each other. All subplots were separated by about 30-cm ridges to stop movement of water/nutrients among different treatments. Water to each treatment was separately applied from the water channel and the crop was grown under flooded condition, as practiced in the region. Rice in this area is transplanted into puddled soils. Puddling is important for controlling weeds, helps in land levelling and transplanting, and to reduce percolation losses of water. Rice–wheat cropping is the dominant cropping system in this area. Therefore, wheat was grown as subsequent crop after the harvest of rice crop in each year.
Wheat variety Siren-2010 was planted on the same layout of the previous rice crop. But no additional P and Zn was applied to wheat crop [13]. The residual P and Zn left from the previous rice crop increased the biomass & harvest index [11] and overall productivity [13] of the subsequent wheat crop under rice-wheat cropping system. Nitrogen at the rate of 140 kg N ha−1 in the form of urea was applied to wheat crop in three equal splits, i.e., 1/3rd each at sowing, 30 days after emergence and booting stage.
2.4. Data Recording and Handling
This present paper presents the data on yield components (YC), grain yield (GY), hulling percentage (HP), and net returns (NR) of different rice cultivars (Basmati-385 (fine) and Fakhre-e-Malakand (Coarse) vs. hybrid rice (Pukhraj)). Number of panicles was counted in 10 randomly selected hills per treatment at physiological maturity and then average panicles per hill were calculated. Number of filled and un-filled grains was counted in 10 randomly selected panicles selected from 10 randomly selected hills in each treatment and then average filled and unfilled grains per panicle was also calculated. At harvest maturity, four-meter square area within each treatment was harvested with sickle, the material was sun dried up to constant weight, weighed, and then converted into biological yield (kg ha−1). The harvested material for biological yield was then threshed. The grains were separated, cleaned, weighed, and then converted into grain yield (kg ha−1). Thousand grains were taken randomly from each treatment and weighed by electronic balance. This was repeated thrice and then average weight (g) per 1000 grains was calculated. Hulling percentage (HP) or grains to hull ratio was then determined using the formula:
2.5. Statistical Analysis
Data were subjected to analysis of variance, according to the methods described for randomized complete block design with split plot arrangement combined over the years [32] and means between treatments were compared using LSD (least significant difference) test (p ≤ 0.05).
2.6. Economic Analysis
Net returns (the value of the increase in grain yield because of P and Zn-fertilizers applied, less the cost of P and Zn fertilizer) and Value-Cost Ratio (VCR) (the ratio between the value of the additional crop yield and the cost of P and Zn fertilizers) was determined (One USD = 150 Pakistani Rupees (PKR)) for both rice and wheat crops [27,28,29].
3. Results and Discussion
3.1. Rice Productivity
3.1.1. Rice Yield Component
The yield contributing characters of rice crop recorded were panicles hill−1, filled grains panicle−1, and 1000-grains weight (Table 1). The YC increased significantly with application of higher P (80 and 120 kg ha−1) and Zn rates (10 and 15 kg Zn ha−1), and the increase was more when both nutrients were applied in combination (P + Zn) than sole P and Zn application. The YC decreased significantly in the control plots (P and Zn not applied) and with application of lower P (40 kg P ha−1), and Zn rates (5 kg Zn ha−1). The increase in YC in the current study was attributed to the increase in dry matter partitioning, and particularly a significant increase in the dry matter partitioning into the reproductive parts (panicles) of rice [11]. In addition, the increase in the harvest index in the plots that received higher P and Zn levels also had a positive effect on the YC of rice [11]. According to a previous study [33], Zn and P fertilizers applied alone or in combination had considerably improved yield contributing characters in rice (e.g., number of grains per panicle, number of tillers per hill, 1000-grains weight). Similarly, investigators [34] obtained maximum yield components in rice with the combined application of 33 kg P + 12 kg Zn ha−1. Increasing P and Zn levels also increased filled grains panicle−1, grains and panicles length of rice [35]. Phosphorus application considerably increases tillering in rice [36], which may also be considered the possible reason to increase the YC in rice. Researchers [37,38] described that the application of 15 kg Zn ha−1 in the form of ZnSO4 improved YC in rice. Productive tillers per hill, number of grains per panicle, 1000-grains weight showed an increasing trend up to 9 kg Zn ha−1 [39]. Others [39] also reported the highest number of grains per panicle, 1000-grains weight, and productive tillers plant−1 with application of 90 kg P2O5 + 9 kg Zn ha−1. These findings are in line with those of a previous study [40] that the correct amount of Zn fertilization could increase yield contributing characters in rice. Panicles number per unit area was considered the greatest key component of rice yield [40]. With the application of Zn, about 5% increase was observed in panicles number and number of filled grains per panicle as compared with the control treatment [41]. Grain yield of cereal crops is determined by YC [42,43,44]. Many researchers [43,45,46] reported that tillers appearance, abortion, or both are affected by environmental conditions, especially nutrient deficiencies. The difference in the YC in the current study of both years may be attributed to the fluctuation in the rainfall and temperature data (Figure 1). A positive connection between grain yield and number of tillers m−2 in rice was described earlier [47].

Table 1.
Number of panicles hill−1, number of filled grains panicle−1, thousand grains weight (g), and grain yield (kg ha−1) of rice genotypes, as affected by phosphorus and zinc application.
In this study, the coarse genotypes (Pukhraj and F-Malakand) performed better than fine genotype (B-385) in terms of higher number of panicles hill−1; filled grains panicle−1 and 1000-grains weight (Table 1). The increase in YC of coarse genotypes over fine genotype probably may be due to the uptake of more P and Zn from the soil [13] and higher leaf area index [26] of coarse genotypes that increased dry matter partitioning into the panicles and therefore resulted in higher YC [11]. Moreover, the increase in the harvest index of coarse rice genotypes than fine genotype was due to the increase in YC [11]. Differences in YC of various rice genotypes were also reported [41]. Researchers [48] reported that rice genotype PSB Rc82 had low efficiency of assimilate partitioning to the grains, resulting in a light grains weight than other rice genotypes. Panicle size is also influenced by genotypes. Rice genotypes with compact panicles are considered better than spreading type panicles [42]. Researchers [42] reported that 1000-grains weight in 10-lowland rice genotypes varied from 24.7 to 27.4 g, with an average value of 26.2 g, indicating a difference of about 11% in 1000 grains weight. The sink size could be expressed by percentage of filled grains which varied among different genotypes and the ratio of fertile spikelets ranged between 65 and 74% [48]. Grain yield in cereals is highly dependent upon the number of spikelet-bearing tillers produced by each plant [43,44]. It is possible to genetically develop a rice panicle type which has enough spikelets with great number of filled grains percentage [49]. The spikelet filling interval of japonicas is frequently somewhat longer than that of indicas [50]. Interaction between phosphorus levels and rice genotypes (P × G) revealed that an increase in P level up to 80 kg ha−1 increased number of panicles per head (PPH) in all three rice genotypes under study. Interestingly, a significant decrease in PPH was observed for F-Malakand and B-385 and increased for Pukhraj when the highest rate of 120 kg P ha−1 was applied (Figure 2), indicating that the P requirement of hybrid rice “Pukhraj” was more than the two local rice cultivars.
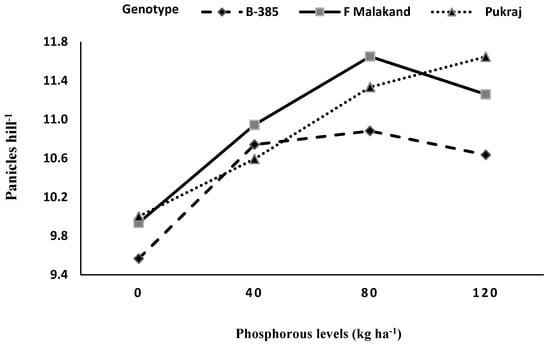
Figure 2.
Number of panicles hill−1 of rice as affected by phosphorus into genotype (P × G) interaction.
Generally, the YC and yield was more in the second year of the experiment than the first year (Table 1). The difference in the YC in both years may be attributed to the fluctuation in the rainfall and temperature data (Figure 1). Likewise, many researchers [43,45,46] stated that tiller appearance, abortion, or both are affected by environmental conditions. Spikelet barrenness induced by low temperature particularly when those temperatures occurred during the reproductive growth stage of rice crop, significantly reduce rice production under cool climates [51]. The sensitivity of rice to cool temperature was very high at the young microspore stage, a stage of active cell division [52]. Air temperature below 20 °C may cause high percentage of barrenness, if it continues for few days at the booting or heading stages of rice crop [53]. Similarly, high temperature (>35 °C) at anthesis or flowering may also result in high spikelets sterility [54]. Ref. [47] reported an encouraging association between grain yield and number of tillers m−2. Some opposing environmental factors such as drought, low solar radiation, N deficiency, low or high temperatures, and panicle blast can rise spikelet sterility and subsequently reduce rice grain yield [54]. The filled spikelets percentage is about 85% in rice, even under encouraging conditions [53]. Hence, the possibility exists to increase rice yield by 15% if breeders remove spikelet sterility [53].
3.1.2. Rice Grain Yield and Hulling Percentage
The results revealed that the GY and HP (Table 1) in rice also increased with the application of higher P (80 and 120 kg P ha−1) and Zn rates (10 and 15 kg Zn ha−1). The GY and HP decreased with application of lower P (0 and 40 kg P ha−1) and Zn rates (0 and 5 kg Zn ha−1). The increase in GY and HP while increasing P and Zn levels in this study probably may be due to the increase in dry matter partitioning into the reproductive parts (panicles) of rice genotypes [11]. Moreover, the increase in the harvest index in the plots under higher P and Zn levels also had a positive relationship with GY and HP [11]. Earlier, 80% increase in GY of rice was reported with the application of higher P rate of 131 kg P ha−1 over P-control plots [55]. Phosphorus application increased GY of different rice genotypes and the differences in yield were attributed with an increase in panicle number [56]. Increase in rice GY was also observed with application of Zn [57]. Researchers [57]) reported maximum GY with the application of 20 mg Zn kg−1 of soil that was about 97% more than Zn-control plots. Likewise, Ref. [41] reported a significant increase in grain and straw yields, and harvest index of rice. According to a study [39], straw and paddy yields showed an increasing trend up to 9 kg Zn ha−1. They reported the highest average paddy GY and YC were recorded at 90 kg P2O5 + 9 kg Zn ha−1. Our results confirmed that both P and Zn application in combination to rice crop increased leaf area index [26], harvest index and biomass yield [11], and subsequently GY and YC (Table 1). On the other hand, rice GY decreased significantly when P and Zn were not applied (control). These results agree with the results of previous studies [58,59], who reported that macro- as well as micronutrient deficiencies are the most important nutritional disorders that limit crop yields. Zn and P either alone or application of both nutrients had significantly increased grain and straw yields of rice [33]. Similarly, researchers [34] found that YC and GY in rice reached maximum with the combined application of 33 kg P + 12 kg Zn ha−1. In this study, higher YC and GY resulted in a higher harvest index in rice crop. According to Ref. [60], GY in cereals is related to YC and harvest index. Because the GY is a function of crop growth duration and crop growth rate at successive growth stages [61]. Mean values of the two years data showed that year two had higher GY (7721 kg ha−1) than year one (6935 kg ha−1). The difference in the GY in both years may be attributed to the fluctuation in the rainfall and temperature in the two years. In the three-way interaction among P × Zn × G (Figure 3), increase in GY of coarse genotypes was more than fine genotype while increasing both P and Zn levels.
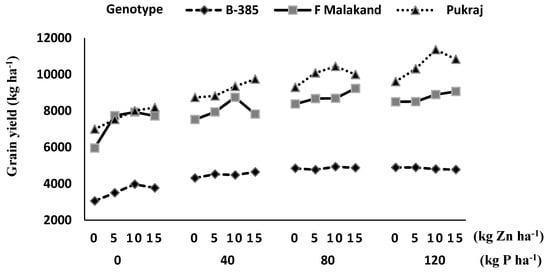
Figure 3.
Grain yield (kg ha−1) of rice as affected by phosphorus into zinc into genotype (P × Zn × G) interaction.
The increase in GY of coarse rice genotypes was attributed the higher number of panicles hill−1, more filled grains panicle−1 and heavy grains produced by coarse genotypes as compared with the fine genotype (Table 1). The increase in GY and HP of coarse genotypes over fine genotype probably may be due to the uptake of more P and Zn from the soil by coarse genotypes [13] and higher leaf area index of coarse genotypes [26] that significantly increased total dry matter accumulation per plant and more dry matter partitioning into the panicles of rice [11]. Moreover, the increase in the harvest index of coarse rice genotypes over fine genotype [11] resulted in higher GY of coarse genotypes (Pukhraj > Fakhre-e-Malakand > Basmati-385). The positive relationship of harvest index with GY and YC was also reported in our previous studies in maize [62] and wheat [63]. Earlier, the Ref. [48] reported that the two rice genotypes (SL8 and Bigante) had produced higher GY than the local check genotype, IR72. According to a previous study [41], significant differences in GY and YC of different rice genotypes exist. Significant differences in yields have been reported for different crop species and genotypes of the same species in absorption and utilization of nutrients including-P [64,65]. Improvement in GY of rice cultivars released by the International Rice Research Institute (IRRI) in the Philippines after 1980 was due to increase in grain production [66]. Ref. [67,68] reported that when comparisons were made among the rice cultivars, higher yield was achieved while increasing YC.
3.2. Wheat Productivity
The results published from the same study on wheat crop [13,27] indicated a significant increase in wheat yield in those plots where the previous rice crop received higher P and Zn levels. Wheat productivity also tremendously increased when grown in plots under fine rice genotype (B-385); wheat productivity reduced significantly when grown on plots where coarse rice genotypes (F-Malakand and Pukhraj) where grown under rice-wheat cropping system. Likewise, rice crop, wheat productivity was also higher in the second than in the first year of experiment. Our published results [13,63] confirmed the strong carry over effects of both P and Zn applied to the previous rice crop on the subsequent wheat crop under rice-wheat cropping system in the study area.
3.3. Profitability (Grower’s Income)
3.3.1. Impact of Phosphorus on Grower’s Income
The two years mean data indicated that, the highest NR of 55,731 PKR ha−1 was obtained application of the highest rate of 120 kg P ha−1, followed by 80 kg P ha−1 (54461 PKR ha−1), while the lowest NR (35192 PKR kg ha−1) was obtained with 40 kg P ha−1 (Table 2). The VCR (value cost ratio) decreased while increasing P level, and the highest VCR (7.7) was again obtained with 40 kg P ha−1 (Table 2). The subsequent wheat crop had the highest NR of 42,710 PKR ha−1 in the plots grown after rice that received 120 kg P ha−1, followed by wheat grown after rice that received 80 kg P ha−1 (36,030 PKR ha−1), while the lowest NR (26,230 PKR kg ha−1) was obtained when wheat was grown after rice that received 40 kg P ha−1 (Table 3). In rice-wheat cropping system, the highest NR of 98,441 PKR ha−1 was obtained with 120 kg P ha−1, followed by 80 kg P ha−1 (90,491 PKR ha−1), while the lowest NR (61,422 PKR kg ha−1) was obtained with 40 kg P ha−1. The increase in grower’s income while increasing P level under rice-wheat cropping system was attributed to the improvement in growth, yield and yield components of both crops [27,32,69].
Table 2.
Impact of phosphorus levels on the economic analysis (net returns and value cost ratio) of rice crop under rice-wheat cropping system.
Table 3.
Impact of residual soil phosphorus on the economic analysis of the subsequent wheat crop under rice-wheat cropping system.
3.3.2. Impact of Zinc on Grower’s Income
The highest NR of 26,774 PKR ha−1 was obtained from the rice crop applied with 10 kg Zn ha−1, followed by 15 kg Zn ha−1 (18,413 PKR ha−1), while the lowest NR (11,909 PKR kg ha−1) was obtained with 5 kg Zn ha−1 (Table 4). The VCR increased to maximum (5.2) with 10 kg Zn ha−1 and the lowest VCR (2.9) was obtained with 15 kg Zn ha−1 (Table 4). The subsequent wheat crop had the highest NR of 15,770 PKR ha−1 in the plots grown after rice that received 15 kg Zn ha−1, followed by wheat grown after rice that received 15 kg Zn ha−1 (11,600 PKR ha−1), while the lowest NR (8480 PKR kg ha−1) was obtained when wheat was grown after rice that received 5 kg Zn ha−1 (Table 5). In rice-wheat cropping system, the highest NR of 38,374 PKR ha−1 was obtained with 10 kg Zn ha−1, followed by 15 kg Zn ha−1 (34,183 PKR ha−1), while the lowest NR (20,389 PKR kg ha−1) was obtained with 5 kg Zn ha−1. The increase in grower’s income while increasing Zn level under rice–wheat cropping system was attributed to the improvement in growth, yield and yield components of both crops [1,27,69].
Table 4.
Impact of zinc levels on the economic analysis (net returns and value cost ratio) of rice crop under rice–wheat cropping system.
Table 5.
Impact of residual soil zinc on the economic analysis of the subsequent wheat crop under rice–wheat cropping system.
3.3.3. Impact of Rice Genotypes on Grower’s Income
Based on two years mean data, the highest NR of 416,895 PKR ha−1 was obtained from hybrid rice “Pukhraj”, followed F-Malakand (390,158 PKR ha−1), while the lowest NR (282,058 PKR kg ha−1) was obtained from B-385 (Table 6). The increase of profits of the coarse rice cultivars F-Malakand and Pukhraj was 27.71 and 32.34% higher than the fine rice cultivar “B-385”, respectively. Pukhraj had 6.41% higher profit over F-Malakand. In rice-wheat cropping system, the highest GV of 598,472 PKR ha−1 was obtained from Pukhraj-wheat system, followed by F-Malakand-wheat system (592,543 PKR ha−1), while the lowest GV (486,048 PKR kg ha−1) was obtained from B-385-wheat system. F-Malakand-wheat system had 17.97% higher profitability than B-385-wheat system, while Pukhraj-wheat system had 18.79% and 0.99% higher profitability over B-385-wheat and F-Malakand-wheat systems, respectively.
Table 6.
Impact of different rice genotypes on the economic analysis under rice–wheat cropping system.
The subsequent wheat had the highest grass value (GV) of 184,751 PKR ha−1 when grown after B-385, followed by wheat (180,075 PKR ha−1) grown after F-Malakand, while the lowest GV (163,732 PKR kg ha−1) was obtained when wheat was grown after Pukhraj (Table 7). In rice-wheat cropping system, the highest GV of 580,626 PKR ha−1 was obtained from Pukhraj-wheat system, followed by F-Malakand-wheat system (570,232 PKR ha−1), while the lowest GV (466,809 PKR kg ha−1) was obtained from B-385-wheat system. F-Malakand-wheat system had 18.14% higher profitability than B-385-wheat system, while Pukhraj–wheat system had 19.60% and 1.79% higher profitability over B-385-wheat and F-Malakand–wheat systems, respectively [62,69].
Table 7.
Impact of the preceding rice genotypes on the economic analysis of subsequent wheat crop under rice–wheat cropping system.
The increase in grower’s income while growing hybrid rice “Pukhraj” over local cultivars (Pukhraj > Fakhre-e-Malakand > Basmati-385) was attributed to the better growth, yield and yield components of hybrid rice [1,11]. Globally, the smallholders produce about 90% of the total rice [70]. It is important to provide incentives to the smallholders to ensure an adequate global rice production. The higher costs of seeds and fertilizers, however, significantly reduce the productivity and profitability under rice-based system all over the world.
4. Conclusions
We concluded from this study that application of both nutrients at higher rates (80 and 120 kg P ha−1) and (10 and 15 kg Zn ha−1) were found beneficial in terms of higher productivity and profitability of rice cultivars under the rice–wheat system. The hybrid rice (Pukhraj) had good performance by producing higher yield and yield components and increased grower’s income. Wheat grown after high yielding coarse rice cultivars especially after hybrid rice needs an additional P and Zn application under rice-wheat cropping system [63,69].
Author Contributions
A. designed and supervised the research project, drafted and revised the manuscript, and I. (Inamullah) carried out the lab and field studies. J.A., M.S.E., M.S.A., A.M., I. (Imran), and S.K. checked and reviewed the manuscript. All authors have read and agreed to the published version of the manuscript.
Funding
This research was conducted for the PhD degree requirement of Mr. Inamullah and none of the donor agency sponsored this research project.
Acknowledgments
We are highly thankful to Paigham Shah, The University of Agriculture Peshawar (retired) for the statistical analysis of the data. We are also thankful to the Department of Agronomy, The University of Agriculture Peshawar, Pakistan for helping and encouraging us to conduct this research work at farmer field in Malakand (Batkhela). The authors extend their appreciation to the Researchers Supporting Project number (RSP-2020/193) King Saud University, Riyadh, Saudi Arabia.
Conflicts of Interest
The authors declare that they have no competing interests.
References
- Amanullah, S.; Tamraiz, A. Iqbal and S. Fahad. Growth and productivity response of hybrid rice to application of animal manures, plant residues and phosphorus. Front. Plant Sci. 2016, 7, 1440. [Google Scholar] [CrossRef] [PubMed]
- Belder, P.; Bouman, B.A.; Cabangon, M.R.; Guoan, L.; Quilang, E.J.P.; Yuanhua, L.; Spiertz, J.H.J.; Tuong, T.P. Effect of water saving irrigation on rice yield and water use in typical low land conditions in Asia. Agric. Water Manag. 2004, 65, 193–210. [Google Scholar] [CrossRef]
- Metwally, T.F.; Gewaily, E.E.; Naeem, S.S. Nitrogen response curve and nitrogen use efficiency of Egyptian hybrid rice. J. Agric. Res. Kafer El-Sheikh Univ. 2011, 37, 73–84. [Google Scholar]
- Confalonieri, R.; Bocchi, S. Evaluation of crop syst for simulating the yield of flooded rice in northern Italy. Eur. J. Agron. 2005, 23, 315–332. [Google Scholar] [CrossRef]
- Tumrani, S.A.; Pathan, P.A.; Suleman, B.M. Economic contribution of rice production and food security in Indonesia. Asia Pac. Res. J. 2015, 33, 63–74. [Google Scholar]
- IRRI (International Rice Research Institute). Rice Facts; IRRI: Los Banos, Philippines, 1995. [Google Scholar]
- Swaminathan, M.S. Can science and technology feed the world in 2025? Field Crops Res. 2007, 104, 3–9. [Google Scholar] [CrossRef]
- Federal Bureau of Statistics Pakistan statistical Year Book 2008; Federal Bureau of Statistics, Statistics Division, Government of Pakistan: Islamabad, Pakistan, 2008.
- Ito, S.; Peterson, W.F.; Grant, W.R. Rice in Asia: Is it becoming an inferior good. Am. J. Agric. Econ. 1989, 71, 32–42. [Google Scholar] [CrossRef]
- Amanullah, H. Influence of organic and inorganic nitrogen on grain yield and yield components of hybrid rice in Northwestern Pakistan. Rice Sci. 2016, 23, 326–333. [Google Scholar] [CrossRef]
- Amanullah, I. Dry matter partitioning and harvest index differ in rice genotypes with variable rates of phosphorus and zinc nutrition. Rice Sci. 2016, 23, 78–87. [Google Scholar] [CrossRef]
- Ismail, A.M.; Heuer, S.; Thomson, J.T.; Wissuwa, M. Genetic and genomic approaches to develop rice germplasm for problem soils. Plant Mol. Biol. 2007, 65, 547–570. [Google Scholar] [CrossRef]
- Amanullah, I. Residual phosphorus and zinc influence wheat productivity under rice-wheat cropping system. SpringerPlus 2016, 5, 255. [Google Scholar] [CrossRef] [PubMed]
- Johnson-Beebout, S.E.; Lauren, J.G.; Duxbury, J.M. Immobilization of zinc fertilizer in flooded soils monitored by adapted DTPA soil test. Commun. Soil Sci. Plant Anal. 2009, 40, 1842–1861. [Google Scholar] [CrossRef]
- Mirvat, E.G.; Mohamed, M.H.; Tawfik, M.M. Effect of phosphorus fertilizer and foliar spraying with zinc on growth, yield and quality of groundnut under recLAPHmed sandy soils. J. Appl. Sci. Res. 2006, 2, 491–496. [Google Scholar]
- Alloway, B.J. Soil factors associated with zinc deficiency in crops and humans. Environ. Geochem. Health 2009, 31, 537–548. [Google Scholar] [CrossRef]
- Cakmak, I. Possible roles of zinc in protecting plant cells from damage by reactive oxygen species. New Phytol. 2000, 146, 185–205. [Google Scholar] [CrossRef]
- Das, K.; Dang, R.; Shivananda, T.N.; Sur, P. Interaction between phosphorus and zinc on the GY and yield attributes of the medicinal plant stevia (Stevia rebaudiana). Sci. World J. 2005, 5, 390–395. [Google Scholar] [CrossRef]
- Khorgamy, A.; Farnia, A. Effect of phosphorus and zinc fertilisation on yield and yield components of chick pea cultivars. In Proceedings of the 9th African Crop Science, Conference Proceedings, Cape Town, South Africa, 28 September–2 October 2009; pp. 205–208. [Google Scholar]
- Salimpour, S.; Khavazi, K.; Nadian, H.; Besharati, H.; Miransari, H. Enhancing phosphorous availability to canola (Brassica napus L.) using P solubilizing and sulfur oxidizing bacteria. Aust. J. Crop Sci. 2010, 4, 330–334. [Google Scholar]
- Impa, S.M.; Johnson-Beebout, S.E. Mitigating zinc deficiency and achieving high grain Zn in rice through integration of soil chemistry and plant physiology research. Plant Soil 2012, in press. [Google Scholar] [CrossRef]
- Marschner, H. Mineral Nutrition of Higher Plants, 2nd ed.; Academic Press: San Diego, CA, USA, 2002. [Google Scholar]
- Quijano-Guerta, C.; Kirk, G.J.D.; Portugal, A.M.; Bartolome, V.I.; McLaren, G.C. Tolerance of rice germplasm to zinc deficiency. Field Crops Res. 2002, 76, 123–130. [Google Scholar] [CrossRef]
- Singh, B.; Natesan, S.K.A.; Singh, B.K.; Usha, K. Improving zinc efficiency of cereals under zinc deficiency. Curr. Sci. 2003, 88, 36–44. [Google Scholar]
- Rose, T.J.; Impa, S.M.; Rose, M.T.; Pariasca-Tanaka, J.; Mori, A.; Heuer, S.; Johnson-Beebout, S.E.; Wissuwa, M. Enhancing phosphorus and zinc acquisition efficiency in rice: A critical review of root traits and their potential utility in rice breeding. Ann Bot. 2013, 112, 331–345. [Google Scholar] [CrossRef] [PubMed]
- Amanullah, I.; Shah, Z.; Khalil, S.K. Phosphorus and zinc interaction influence leaf area index in fine versus coarse rice (Oryza sativa L.) genotypes in Northwest Pakistan. J. Plant Stress Physiol. 2016, 2, 1–8. [Google Scholar]
- Khan, A., Jr.; Almas, L.K.; Al-Noaim, M.I. Nitrogen rates and sources affect yield and profitability of maize in Pakistan. Crop Forage Turfgrass Manag. 2015. [Google Scholar] [CrossRef]
- Almas, L.K.; Shah, P. Timing and rate of nitrogen application influence profitability of maize planted at low and high densities in Northwest Pakistan. Agron. J. 2010, 102, 575–579. [Google Scholar]
- Amanullah, A.M.; Almas, L.K. Agronomic efficiency and profitability of P-fertilizers applied at different planting densities of maize in Northwest Pakistan. J. Plant. Nutr. 2012, 35, 331–341. [Google Scholar] [CrossRef]
- Tahir, M.; Kausar, M.A.; Ahmad, R.; Bhatti, S.A. Micronutrient status of Faisalabad and Sheikhupura soils. Pak. J. Agric. Res. 1991, 12, 134–140. [Google Scholar]
- Qadar, A. Selecting rice genotypes tolerant to zinc deficiency and sodicity stresses. I. Differences in zinc, iron, manganese, copper, phosphorus concentrations, and phosphorus/zinc ratio in their leaves. J. Plant Nutr. 2002, 25, 457–473. [Google Scholar] [CrossRef]
- Steel, R.G.D.; Torrie, J.H.; Dickey, D. Principles and Procedures of Statistics; McGraw-Hill: New York, NY, USA, 1996. [Google Scholar]
- Rahman, K.M.M.; Chowdhury, M.A.K.; Sharmeen, F.; Sarkar, A.; Hye, M.A.; Biswas, G.C. Effect of zinc and phosphorus on yield of Oryza sativa (cv. br-11). Bangladesh. Res. Pub. J. 2011, 5, 351–358. [Google Scholar]
- Lal, B.; Majumdar, B.; Venkatesh, M.S. Individual and interactive effects of phosphorus and zinc in lowland rice. Indian J. Hill Farm. 2000, 13, 44–46. [Google Scholar]
- Mafi, S.; Sadeghi, S.M.; Doroodian, H. Effect of zinc and phosphorus ~ fertilizers on yield and component yield of rice (Hashemi). Persian Gulf Crop Protect. 2013, 2, 30–36. [Google Scholar]
- Fageria, N.K.; Slaton, N.A.; Baligar, V.C. Nutrient management for improving lowland rice productivity and sustainability. Adv. Agron. 2003, 80, 63–152. [Google Scholar]
- Shivay, Y.S.; Kumar, D.; Prasad, R. Effect of zinc fertilization on physical grain quality of basmati rice. Int. Rice Res. Notes 2007, 32, 41–42. [Google Scholar] [CrossRef]
- Maqsood, M.; Irshad, M.; Wajid, S.A.; Hussain, A. Growth and yield response of Basmati-85 (Oryza sativa L.) to ZnSO4 application. Pak. J. Biol. Sci. 1999, 2, 1632–1633. [Google Scholar]
- Khan, P.; Memon, M.Y.; Imtiaz, M.; Depar, N.; Aslam, M.; Memon, M.S.; Shah, J.A. Determining the zinc requirements of rice genotype sarshar evolved at NIA Tandojam. Sarhad. J. Agric. 2012, 28, 1–7. [Google Scholar]
- Grzebisz, W.; Wrońska, M.; Diatta, J.B.; Szczepaniak, W. Effect of zinc foliar application at an early stage of maize growth on patterns of nutrients and dry matter accumulation by the canopy. Part II: Nitrogen uptake and dry matter accumulation patterns. J. Elementol. 2008, 13, 29–39. [Google Scholar]
- Yadi, R. Role of zinc fertilizer on GY and some qualities parameters in Iranian rice genotypes. Ann. Biol. 2012, 3, 4519–4527. [Google Scholar]
- Fageria, N.K. Yield physiology of rice. J. Plant Nutr. 2007, 30, 843–879. [Google Scholar] [CrossRef]
- Power, J.F.; Alessi, J. Tiller development and yield of standard and semi dwarf spring wheat varieties as affected by nitrogen fertilizer. J. Agric. Sci. 1978, 90, 97–108. [Google Scholar] [CrossRef]
- Nerson, H. Effects of population density and number of ears on wheat yield and its components. Field Crops Res. 1980, 3, 225–234. [Google Scholar] [CrossRef]
- Black, A.L.; Siddoway, F.H. Hard red and durum spring wheat responses to seeding date and NP-fertilization on fallow. Agron. J. 1977, 69, 885–888. [Google Scholar] [CrossRef]
- Masle, J. Competition among tillers in winter wheat: Consequence for growth and development of the crop. In Wheat Growth and Modelling; Day, W., Atkin, R.K., Eds.; Plenum Press: New York, NY, USA, 1985; pp. 33–54. [Google Scholar]
- Fageria, N.K.; Baligar, V.C. Nutrient availability. In Encyclopedia of Soils in the Environment; Hillel, D., Ed.; Elsevier: San Diego, CA, USA, 2005; pp. 63–71. [Google Scholar]
- Wiangsamut, B.; Lafarge, T.A.; Mendoza, T.C.; Pasuquin, E.M. Agronomic traits and yield components associated with broadcasted and transplanted high-yielding rice genotypes. eSci. J. Crop Prod. 2013, 2, 19–30. [Google Scholar]
- Kato, T. Selection response for the characters related to yield sink capacity of rice. Crop Sci. 1997, 37, 1472–1475. [Google Scholar] [CrossRef]
- Jennings, P.R.; Coffman, W.R.; Kauffman, H.E. Rice Improvements; International Rice Research Institute: Los Banos, Philippines, 1979; p. 186. [Google Scholar]
- Shimono, H. Impact of global warming on yield fluctuation in rice in the northern part of Japan. Jpn. J. Crop Sci. 2008, 77, 489–497. [Google Scholar] [CrossRef][Green Version]
- Hayase, H.; Satake, T.; Nishiyama, I.; Ito, N. Male Sterility Caused by Cooling Treatment at the Meiotic Stage in Rice Plants: II. The most sensitive stage to cooling and the fertilizing ability of pistils. Jpn. J. Crop Sci. 1969, 38, 706–711. [Google Scholar] [CrossRef]
- Yoshida, S. Fundamentals of Rice Crop Science; IRRI: Los Baños, Philippines, 1981; p. 269. [Google Scholar]
- Amanullah, F.S.; Anwar, S.; Baloch, S.K.; Saud, S.; Alharby, H.; Alghabari, F.; Ihsan, M.Z. Rice Crop Responses to Global Warming: An Overview. In Rice-Technology and Production; Amanullah, F.S., Anwar, S., Eds.; In Tech: Rijeka, Croatia, 2017. [Google Scholar]
- Fageria, N.K.; Filho, M.P.B. Dry-matter and GY, nutrient uptake, and phosphorus use-efficiency of lowland rice as influenced by phosphorus fertilization. Comm. Soil Sci. Plant Anal. 2007, 38, 1289–1297. [Google Scholar] [CrossRef]
- Fageria, N.K.; dos Santos, A.B.; Heinemann, A.B. Lowland rice genotypes evaluation for phosphorus use efficiency in tropical lowland. J. Plant Nutr. 2011, 34, 1087–1109. [Google Scholar] [CrossRef]
- Fageria, N.K.; dos Santos, A.B.; Cobucci, T. Zinc nutrition of lowland rice. Commun. Soil Sci. Plant Anal. 2011, 42, 1719–1727. [Google Scholar] [CrossRef]
- Foy, C.D. Soil chemical factors limiting plant root growth. Adv. Soil Sci. 1992, 19, 97–149. [Google Scholar]
- Amanullah Khan, N.; Khan, I. Wheat biomass and harvest index increases with integrated use of phosphorus, zinc and beneficial microbes under semiarid climates. J. Microbiol. Biotechnol. Food Sci. 2019, 9, 242–247. [Google Scholar]
- Donald, C.M.; Hamblin, J. The biological yield and harvest index of cereals as agronomic and plant breeding criteria. Adv. Agron. 1976, 28, 361–405. [Google Scholar]
- Tanaka, A.; Osaki, M. Growth and behavior of photosynthesized 14C in various crops in relation to productivity. Soil Sci. Plant Nutr. 1983, 29, 147–158. [Google Scholar] [CrossRef]
- Amanullah. Source and rate of nitrogen application influence agronomic N-use efficiency and harvest index in maize (Zea mays L.) genotypes. Maydica 2014, 59, 80–89. [Google Scholar]
- Amanullah, I. Preceding rice genotypes, residual phosphorus and zinc influence harvest index and biomass yield of subsequent wheat crop under rice-wheat system. Pak. J. Bot. 2015, 47, 265–273. [Google Scholar]
- Epstein, E.; Bloom, A.J. Mineral Nutrition of Plants: Principles and Perspectives; Sinauer Associates, Inc. Publishers: Sunderland, MA, USA, 2005. [Google Scholar]
- Fageria, N.K.; Baligar, V.C.; Clark, R.B. Root Architecture. In Physiology of Crop Production; The Haworth Press: Binghamton, NY, USA, 2006; pp. 23–59. [Google Scholar]
- Peng, S.; Cassman, K.G.; Virmani, S.S.; Sheehy, J.; Khush, G.S. Yield potential trends of tropical rice since the release of IR8 and the challenge of increasing rice yield potential. Crop Sci. 1999, 39, 152–1559. [Google Scholar] [CrossRef]
- Akita, S. Improving Yield Potential in Tropical Rice. In Progress in Irrigated Rice Research; Int Rice Res Inst: Manila, Philippines, 1989; pp. 41–73. [Google Scholar]
- Amano, T.; Zhu, Q.; Tanaka, H. Case studies on high yields of paddy rice in Jiangsu Province China: I. Characteristics of grain production. Jpn. J. Crop Sci. 1993, 62, 267–274. [Google Scholar] [CrossRef][Green Version]
- Amanullah. Integrated use of organic carbon, plant nutrients and bio-fertilizers is key to improve field crops productivity under arid and semiarid climates. In FAO Proceedings of the Global Symposium on Soil Organic Carbon 2017; Food and Agriculture Organization of the United Nations: Rome, Italy, 2017; pp. 480–481. [Google Scholar]
- Mottaleb, K.A.; Mohanty, S. Farm size and profitability of rice farming under rising input costs. J. Land Use Sci. 2015, 10, 243–255. [Google Scholar] [CrossRef]


© 2020 by the authors. Licensee MDPI, Basel, Switzerland. This article is an open access article distributed under the terms and conditions of the Creative Commons Attribution (CC BY) license (http://creativecommons.org/licenses/by/4.0/).