Article

Optimization of Analytical Ultrasound-Assisted Methods for the Extraction of Total Phenolic Compounds and Anthocyanins from Sloes (Prunus spinosa L.)

by
Ana V. González-de-Peredo
1,
Mercedes Vázquez-Espinosa
1,
Estrella Espada-Bellido
1,
Marta Ferreiro-González
1,
Ceferino Carrera
1,
Miguel Palma
1,
José Ángel Álvarez
2,
Gerardo F. Barbero
1,* and
Jesús Ayuso
2
1
Department of Analytical Chemistry, Faculty of Sciences, University of Cadiz, Agrifood Campus of International Excellence (ceiA3), IVAGRO, Puerto Real, 11510 Cadiz, Spain
2
Department of Physical Chemistry, Faculty of Sciences, University of Cadiz, Institute of Biomolecules (INBIO), Puerto Real, 11510 Cadiz, Spain
*
Author to whom correspondence should be addressed.
Agronomy 2020, 10(7), 966; https://doi.org/10.3390/agronomy10070966
Submission received: 5 June 2020 / Revised: 28 June 2020 / Accepted: 2 July 2020 / Published: 4 July 2020
(This article belongs to the Special Issue Extraction and Analysis of Natural Product in Plant)

Abstract

:
Prunus spinosa L. is a shrub that produces berries—sloes—with a high content of phenolic compounds and anthocyanins. Numerous consumer products are made from sloes, such as “Pacharán” liquors or jams. For these reasons, it is crucial to design accurate analytical methods for the extraction of these bioactive compounds in order to promote their consumption and to improve our health. In this study, an ultrasound-assisted extraction method was developed to extract phenolic compounds and anthocyanins from sloes. Several process variables (methanol composition, pH, temperature, cycle, amplitude, and sample–solvent ratio) were optimized based on a Box–Behnken design. The most influential parameters for the extraction of total phenolic compounds were the cycle, the percentage of methanol, and pH of the extraction solvent, with 0.2 s, 67%, and pH 7 as their optimal values, respectively. For total anthocyanins, all parameters were influential, with 44% methanol at pH 2, 48 °C, 0.2 s cycles, 30% amplitude, and 1.5 g/20 mL ratio as the optimal values for their corresponding variables. Both methods showed high recoveries, short time use, and high precision (RSD < 5%). In addition, the sloe liqueur “Pacharán” and sloe jams were analyzed to demonstrate the applicability of these methods for the extraction of the real matrix.

Graphical Abstract

1. Introduction

There is a current growing interest in natural sources with a high content of bioactive compounds [1]. Among these natural sources, plant products (fruits, berries, leaves, flowers, etc.,) with antioxidant properties are increasingly being applied in the food, cosmetic and pharmaceutical industries as effective remedies to counteract the harming actions of free radicals and to stop oxidant processes that cause different pathological conditions [2]. Such natural antioxidants are very useful as substitutes for synthetic antioxidants, the use of which is being restricted because of their potential risks for health and side-effects [3].
Nowadays, lesser-known fruit species are receiving growing attention and their beneficial effects for health are making it to the forefront. It is, therefore, crucial to spread the knowledge on their bioactive contents as well as on their antioxidant properties in order to promote their consumption [4]. Prunus spinosa L., also known as blackthorn or sloe, is a deciduous shrub with blackish bark and dense, stiff, and thorny branches, native to Western Asia and Europe [5,6]. It is generally found in the wild in cold and even mountain climate areas, where it can grow up to 5 m tall. Its fruit, called “sloe”, is an oval-shaped drupe with a size ranging between 5 and 15 mm. It is initially green and it acquires a blue or black color as it matures, with a bittersweet taste and a velvety texture [7,8]. Its optimum point of ripeness usually takes place between September and October. It is remarkable for its high content of fiber, potassium, vitamin C, carotenoids, anthocyanins, and phenolic compounds, these last two being the aim of our study, since they give sloe its remarkable antioxidant, antibacterial, antiallergenic, anti-inflammatory, and anticancer capacities [4,9]. The main phenolic compounds that have been identified in sloes are flavonols (quercetin and kaempferol derivatives), phenolic acids (neochlorogenic acid and caffeic acid derivatives), derivatives of coumarin (esculetin, umbelliferone, and scopoletin) and anthocyanins (cyanidin 3-O-glucoside, cyanidin 3-O-rutinoside, peonidin 3-O-glucoside, and peonidin 3-O-rutinoside) [10,11]. Sloe can be used to make jellies or jams. However, its main industrial use is the production of a liquor known in Spain as “Pacharán”. This is an ancient traditional drink of a pleasant, sweet taste, to which beneficial properties (astringents, diuretics, and purgatives [12]) have been historically attributed. Many of those properties are believed to be based on the transfer of the phenolic compounds and anthocyanins that are initially found in sloe berries to the liquor during the maceration process. Such anthocyanins are also responsible for the intense and attractive red color of “Pacharán”.
Considering the high biological potential of sloe and its great diversity in phenolic compounds, it is essential to employ an efficient extraction method [13] to conserve the quality of the raw material and its elaborated products, such as “Pacharán”. Nowadays, as an alternative to conventional methods, new extraction technologies are being used. These new methods, among other objectives, intend to reduce solvents, extraction time, energy consumption and any harmful impact on the environment or on humans, at the same time that they improve extraction efficiency and product quality [14]. Ultrasound-assisted extraction (UAE) is one of these novel extraction techniques that has been studied for its potential, since it does not require complex instruments and is relatively inexpensive. In addition, it can be used both at a small and large-scale in the phytopharmaceutical extraction industry [15]. Ultrasounds are pressure waves of a very high frequency (above 20 kHz), inaudible to humans. They propagate through matter and cause the phenomenon known as cavitation, which consists of producing cavities filled with vapor within a liquid medium. The cavities are the result of the ultrasound expansion and contraction cycles, which break the plant matrix cell walls and promote solvent penetration and mass transfer processes [16,17]. This is a commonly used technique for the extraction of a large number of fruits such as blackberries [18], grapes [19] or pomegranates [20]. With regard to sloes, ultrasound-assisted extraction has previously been used for the extraction of antioxidants from its flowers [21] and anthocyanins from the epicarp [22], but not for total phenolic compounds or the whole berry, and in both works, using far fewer variables than those studied in this article. Furthermore, this is the first time that ultrasound-assisted extraction of total phenolic compounds and anthocyanins has been treated for purely analytical purposes to determine the quality of the raw material and end products of whole sloes and foods made from sloes. The previous works had a process approach, aimed at obtaining the extract for its subsequent application [21,22].
UAE methods are also influenced by a number of variables such as temperature, solvent or pH, among others. For this reason, experimental designs are usually applied in order to study the effects of the different variables and their interactions and to determine the method’s optimal conditions [23]. Specifically, Box–Behnken design is frequently used for this purpose since it does not require extreme conditions and can provide a satisfactory amount of statistical data with only a small number of experiments.
For all the aforementioned, this study presents a further advance in the field of the extraction and analysis of natural products in plants, since many important extraction variables are optimized and a fast and efficient method such as UAE is employed. Specifically, the present study intends to develop and optimize two UAE methods for the extraction of the total phenolic compounds and anthocyanins in sloe with the purpose of providing rapid and reliable extraction methods that could be used in quality control laboratories. In addition, “Pacharán” and sloe jams were elaborated and analyzed in order to demonstrate the applicability of the methods for the extraction of the compounds of interest from real matrix samples. Having efficient methods to extract the bioactive compounds that are found in sloe berries is of great interest for food industries to improve their processes as well as the quality of their raw materials, by-products, and final products.

2. Materials and Methods

2.1. Plant Material

Sloe berries were used to develop the extraction methods. The fresh samples were obtained from Endrinas de Navarra (42°28′38.7″ N 2°04′59.6″ W, Sesma, Navarra, Spain). The preparation of the sample’s matrix previous to its extraction is of great importance. In addition to preserving the target compounds, sample preparation also ensures extraction efficiency because it can eliminate interferences, increase the concentration of the analyte in the mixture and ensure optimum particle size. For these reasons, in this study, the sloe berries were crushed until a homogenous sample was obtained. During the sample’s grinding and milling stage, a conventional mixer was used. To ensure the stability of the compounds of interest, the sloe samples were ground at a low temperature (4 °C) and short milling times were performed to avoid the rise in temperature of the sample. This pre-treatment, which significantly increases the contact surface between the fruit and the solvent, is usually employed in the research group because it enhances yields during the extraction process [17,23,24]. The homogenous samples obtained were stored in a freezer at −20 °C until further use.

2.2. Commercial Sloe Products

For the artisanal production of “Pacharán”, approximately 60 g of sloe berries were weighed and added to 200 mL of 24% alcohol aniseed. This mixture was stored in amber-colored bottles (12 units) at room temperature. During the following six months, two “Pacharán” aliquots (one for each bottle) were taken after each month to study the transfer of the bioactive compounds to “Pacharán” during the maceration process. Specifically, each month, the two aliquots were subsequently analyzed to quantify its phenolic compounds and anthocyanins content. “Pacharán”, which is chemically considered a liquid extract of sloes macerated in aniseed liquor, was analyzed directly by UHPLC-UV–Vis in the different maceration periods of the study for total anthocyanins. For the analysis of total phenolic compounds, the Folin–Ciocalteu method was used as described in Section 2.5. Determining Total Phenolic Compounds by “Folin–Ciocalteu Assay”. The “Pacharán” samples were also filtered through a 0.22 µm nylon syringe filter (Membrane Solutions, Dallas, TX, USA) before being analyzed. The results were expressed in mg of compound L−1 of “Pacharán”. All analyses were carried out in triplicate on each of the macerated samples. With respect to the sloes used for the “Pacharán” elaboration, once they were macerated, they presented variable amounts of liquor. Subsequently, the berries were dried prior to analysis. In this sense, to obtain the amount of compounds that remained in the sloes each month, the sloes were dried in an oven (at 50 °C for 18 h). Then, extracts were obtained and analyzed. The UAE methods that had been previously developed were employed for the extraction of the phenolic compounds and the anthocyanins, while the Folin–Ciocalteu assay was used to quantify the total phenolic compound content and the UHPLC method was employed to quantify the anthocyanins content. To compare the results obtained with the macerated sloes (dry sample) with the total amount of initial compounds in fresh fruit, the amount of sloe moisture was measured, obtaining a value of 89.42%. This percentage of moisture was taken into account when comparing the values of total phenolic compounds and anthocyanins in the initial sample of sloes (fresh weight) and the values of sloes once macerated (dry weight) to have comparable values.
Homemade sloe jams were also studied. Three types of jams were analyzed—two commercial jams and a handmade one at 50:50% sloes/sugar ratio. For this particular jam, 50:50 (g sloe:g sugar) was weighed in a pan containing 30 mL of water. Then, it was reduced to recover the texture of a jam. All the jams were extracted and analyzed using the above described method for “Pacharán”. The results were expressed in mg of compound g−1 of jam. All analyses were carried out in triplicate.

2.3. Chemicals and Solvents

Methanol and water were selected as solvents for the extractions. Methanol is a solvent with very good extraction qualities for this type of compound, due to its small size (easy penetration capacity), low density and polarity similar to the polarity of the studied compounds, even more so if it is modulated with water. These properties make methanol an excellent solvent widely used to extract phenolic compounds and anthocyanins in multiple natural matrices [23,24,25,26,27]. The methanol (Fischer Scientific, Loughborough, United Kingdom) was HPLC grade. The ultra-pure water was obtained from a Milli-Q water purification system (Millipore, Bedford, MA, USA). Hydrochloric acid and sodium hydroxide, both of analytical grade and purchased from Panreac Química SLU (Barcelona, Spain), were employed to adjust pH.
For the chromatographic separations, the solvents required were Milli-Q water, methanol and formic acid (Scharlau, Barcelona, Spain) of HPLC grade. Cyanidin chloride (Sigma-Aldrich Chemical Co., St. Louis, MO, USA) was used as the standard for the quantification of the anthocyanins. For the determination of the total phenolic compounds, Folin–Ciocalteu reagent (EMD Millipore, Darmstadt, Germany) and anhydrous sodium carbonate (Panreac Química SLU, Barcelona, Spain) were used. Gallic acid (Sigma-Aldrich Chemical Co., St. Louis, MO, USA) was used as the standard for the quantification of the phenolic compounds.

2.4. Extraction of Bioactive Compounds

Ultrasound-assisted extraction was the technique chosen to extract the bioactive compounds of interest from sloe berries. A UP200S ultrasonic processor (Ultraschallprozessor, Dr. Hielscher, GmbH, Berlin, Germany) was used to control the cycle and the amplitude. This UAE equipment employed showed 200 W of useful output power and a working frequency of 24 kHz. The probe employed was a Micro tip S7 (Ultraschallprozessor, Dr. Hielscher, GmbH, Berlin, Germany) with the following characteristics: maximum submerged depth 90 mm, diameter 7 mm, maximum amplitude 175 µm, and acoustic power density 300 W cm−2. This probe was coupled to a thermostatic bath (FRIGITERM-10, J.P. Selecta S.A., Abrera, Barcelona, Spain), in which the necessary temperature was set up. A 50 mL “Falcon” tube was used to weigh about 1.5 g of the homogenized sample and to add the corresponding amount of the solvent corresponding to each experiment. At the moment of the extraction, the ultrasound probe was inserted into the Falcon tube, which was inside a double-walled vessel where the water from a thermostatic bath ran under controlled temperature. The temperature, cycle, and amplitude were programmed according to each experiment and the extractions were performed after a specific time, starting from 10 min. Once the extraction was complete, the extract was centrifuged at 7500 rpm (9.5 cm orbital radius) for 5 min. The supernatant was added to a 25 mL volumetric flask and the precipitate was subsequently redissolved using 5 mL of the same extraction solvent. This second extract was centrifuged again under the same conditions and the supernatant was placed in the same volumetric flask. The final extracts were stored in a freezer at −20 °C prior to analysis. The ranges of variables employed for the UAE were as follows: solvent composition (25–75% methanol in water), temperature (10–70 °C), amplitude (30–70%), cycle (0.2–0.7 s), pH (2–7), and solvent–sample ratio (10:1.5–20:1.5 mL/g). The pH was controlled by using a Crison GLP22 pH-meter (Barcelona, Spain). Specifically, for the pH adjustment of the different extraction solvents, solutions of hydrochloric acid (HCl) and sodium hydroxide (NaOH) were used, both at a concentration of 1 M.

2.5. Determining Total Phenolic Compounds by Folin–Ciocalteu Assay

The total phenolic compounds content in the sloe berries was determined by means of the Folin–Ciocalteu (FC) spectrophotometric method [28]. Due to the large number and variety of phenolic compounds in sloes, it would be economically impractical and time consuming to use a different standard for the quantification of each phenolic compound individually. In this sense, the Folin–Ciocalteu method can be a faster and more feasible procedure, with which a fairly approximate estimate of the amount of total phenolic compounds present in sloe is achieved. Furthermore, this procedure is extensively used for samples as diverse as blueberries [29] or açai [30]. It is based on the reactivity of the phenolic compounds at basic pH with the Folin–Ciocalteu reagent (a mixture of phosphomolybdate and sodium phosphotungstate). The reaction results in a blue colored complex whose maximum absorbance is 765 nm. Such absorbance, according to the Lambert–Beer law, is directly proportional to the amount of polyphenols present in the sample. The procedure was as follows: in a 25 mL volumetric flask, 0.25 mL of the previous extract filtered through a 0.22 μm filter (MS Nylon Syringe Filter, Membrane Solutions, Dallas, USA), 12.5 mL of Milli-Q water, 1.25 mL of Folin–Ciocalteu reagent and 5 mL of a 20% sodium carbonate solution were mixed. Then, the flask was filled up with water and after 30 min away from the light, the absorbance was measured at the maximum. The extracts were analyzed in duplicate. The absorbance measuring equipment used was an UV–Vis Helios-γ Unicam spectrophotometer (Thermo Scientific, Waltham, MA, USA). Previously, in order to establish a relationship between the absorbance and the concentration of polyphenols, a linear regression curve was produced based on a reference standard gallic acid pattern under the same conditions as the extracts. Each point of the curve was prepared in duplicate in a linear range from 10 until 1000 ppm. The following regression equation y = 0.0010x + 0.0054 and correlation coefficient R2 = 0.9997 were obtained. The results were expressed in milligrams of gallic acid equivalent per gram of fresh weight. The software used to process the data was Microsoft Office Excel 2013.

2.6. Identification of Anthocyanins by UHPLC-QToF-MS

The anthocyanins present in the sloe samples were identified by ultra-performance liquid chromatography coupled to a quadrupole-time-of-flight mass spectrometer, (UHPLC–QToF–MS) (Xevo G2, Waters Corp., Milford, MA, USA). The analytical column used was a reverse-phase C18 (Acquity UPLC BEH C18, Waters) with dimensions of 100 × 2.1 mm and a particle size of 1.7 μm. Two mobile phases were used—2% formic acid–water solution as phase A and methanol solution as phase B. The UAE extracts were filtered through a 0.22 µm nylon syringe filter (Membrane Solutions, Dallas, TX, USA). The flow rate was 0.4 mL/min and the volume injected was 3 µL. The total programmed gradient was as follows (time, % solvent B)—0.00 min, 15%; 3.30 min, 20%; 3.86 min, 30%; 5.05 min, 40%; 5.35 min, 55%; 5.64 min, 60%; 5.95 min, 95%; 7.50 min, 95%. The total run time was 12 min, including 4 min for re-equilibration. Mass spectra were acquired in positive ion mode under the following conditions: desolvation gas flow = 700 L h–1, desolvation temperature = 500 °C, cone gas flow =10 L h–1, source temperature = 150 °C, capillary voltage = 700 V, cone voltage = 30 V, and collision energy = 20 eV. “Full Scan” mode was used (m/z = 100–1200). The individual anthocyanins were identified based on their retention time and molecular weight. Four anthocyanins were identified in the samples with the following m/z ratios: cyanidin 3-O-glucoside, 449; cyanidin 3-O-rutinoside, 595; peonidin 3-O-glucoside, 463; peonidin 3-O-rutinoside, 609. The structures of the main anthocyanins present in sloes are shown in Figure 1.

2.7. Determination of Anthocyanins by UHPLC-UV–Vis

To separate and quantify the anthocyanins present in the sloe samples, an Elite UHPLC LaChrom System (Hitachi, Tokyo, Japan) was used. The equipment consists of an L-2200U autosampler, an L2300 column oven set at 50 °C, two L-2160U pumps, and a UV–Vis detector L-2420U. The analytical column used was a reversed-phase C18 (PhenomenexKinetex, CoreShell Technology, Torrance, CA, USA) of 2.1 × 50 mm and a particle size of 2.6 µm. Two mobile phases were used at a flow rate of 0.7 mL/min. Phase A was 5% formic acid–water solution and phase B was a methanol solution. Both solvents were filtered using a 0.22 µm filter (RephiLe Bioscience, Ltd., Shanghai, China) and degassed in an ultrasonic bath (Elma S300, Elmasonic, Singen, Germany). Before their identification, the UAE extracts were also filtered through a 0.22 µm nylon syringe filter (Membrane Solutions, Dallas, TX, USA). The injection volume was set at 15 μL and the absorption wavelength 520 nm. The gradient for the UHPLC separation was as follows (time, % solvent B)—0.00 min, 2%; 1.50 min, 2%; 3.30 min, 15%; 4.80 min, 15%; 5.40 min, 35%; 6 min, 100%. This gradient provided optimal results and easily integrable signals. Specifically, this method achieves a separation of the four major anthocyanins present in sloes in less than 4 min. The quantification of individual anthocyanins was carried out by means of a calibration curve, where cyanidin chloride was used as the reference standard. The regression equation (y = 300568.88x − 28462.43) and the correlation coefficient (R2 = 0.9999) were calculated. In addition, the limits of detection (LOD) (0.198 mg L–1) and quantification (LOQ) (0.662 mg L–1) were obtained as three and ten times, respectively, the standard deviation from the blank signal values divided by the slope of the calibration curve. Assuming that the different anthocyanins have similar absorbances, and taking into account their individual molecular weights, a calibration curve was prepared to quantify each anthocyanin. All the analyses were carried out in duplicate. The typical chromatogram obtained is shown in Figure 2.

2.8. Experimental Design Analysis

In recent years, different experimental designs have been frequently applied for the optimization of various analytical methods. This is an efficient technique to optimize complex processes, since it allows the optimization of multiple variables with a very small number of experiments, which reduces costs, energy and laboratory work [31]. Among these techniques, Box–Behnken design (BBD) is a very interesting quadratic design that considers all the variable combinations at the midpoint of the edges and at the center of the space, which means that it discards experiments under extreme conditions and reduces the possibility of deceiving results [32]. In this work, a Box–Behnken experimental design (BBD) was used to measure the effect of six independent factors (X1, % methanol in water; X2, solvent pH; X3, extraction temperature; X4, ultrasound amplitude; X5, cycle; X6, solvent–sample ratio) on the composition of total phenolic compounds (YTP, mg g–1) and total anthocyanins (YTA, mg g–1). As these factors have different units and ranges, each factor was first normalized and forced to range from −1 to +1 [33]. Specifically, the values studied for each factor were solvent composition (25, 50, and 75%), temperature (10, 40, and 70 °C), amplitude (30, 50, and 70%), cycle (0.2, 0.45, and 0.7 s), pH (2, 4.5, and 7), and solvent–sample ratio (10:1.5, 15:1.5, and 20:1.5 mL solvent:g sample). Having taken into account the number of factors (6—X1, X2, X3, X4, X5, X6) and using the particular BBD equation, the design consisted of 54 treatments with six repetitions at their center point. The whole experimental design matrix used can be seen in Table 1.
For the experimental design, data analysis and model building, the Design Expert software 12 (Trial Version, Stat-Ease Inc., Minneapolis, MN, USA) was used. The statistical significance of the model, as well as the regression terms and the fitting quality of the polynomial model, were evaluated based on the analysis of variance (ANOVA).
When this statistical experiment design is employed in conjunction with a response surface methodology (RSM), the effects of the independent factors on each response can be studied. Therefore, the results of the whole experimental design matrix were analyzed by an RSM and a mathematical model was obtained Equation (1). This is a second-order polynomial equation, in which the response of the system is considered as a function of the factors and the interactions involved [31,34].
y = β 0 + i = 1 k β i x i + i = 1 k   β i i · x i 2 + i i = 1 k β i j x i j + ε
where y is the response; β0 is the regression coefficient for the intercept; βi, βii, and βij are the regression coefficients for the linear, quadratic and interactive terms, respectively; xi and xj are independent variables; ε is the error.

3. Results and Discussion

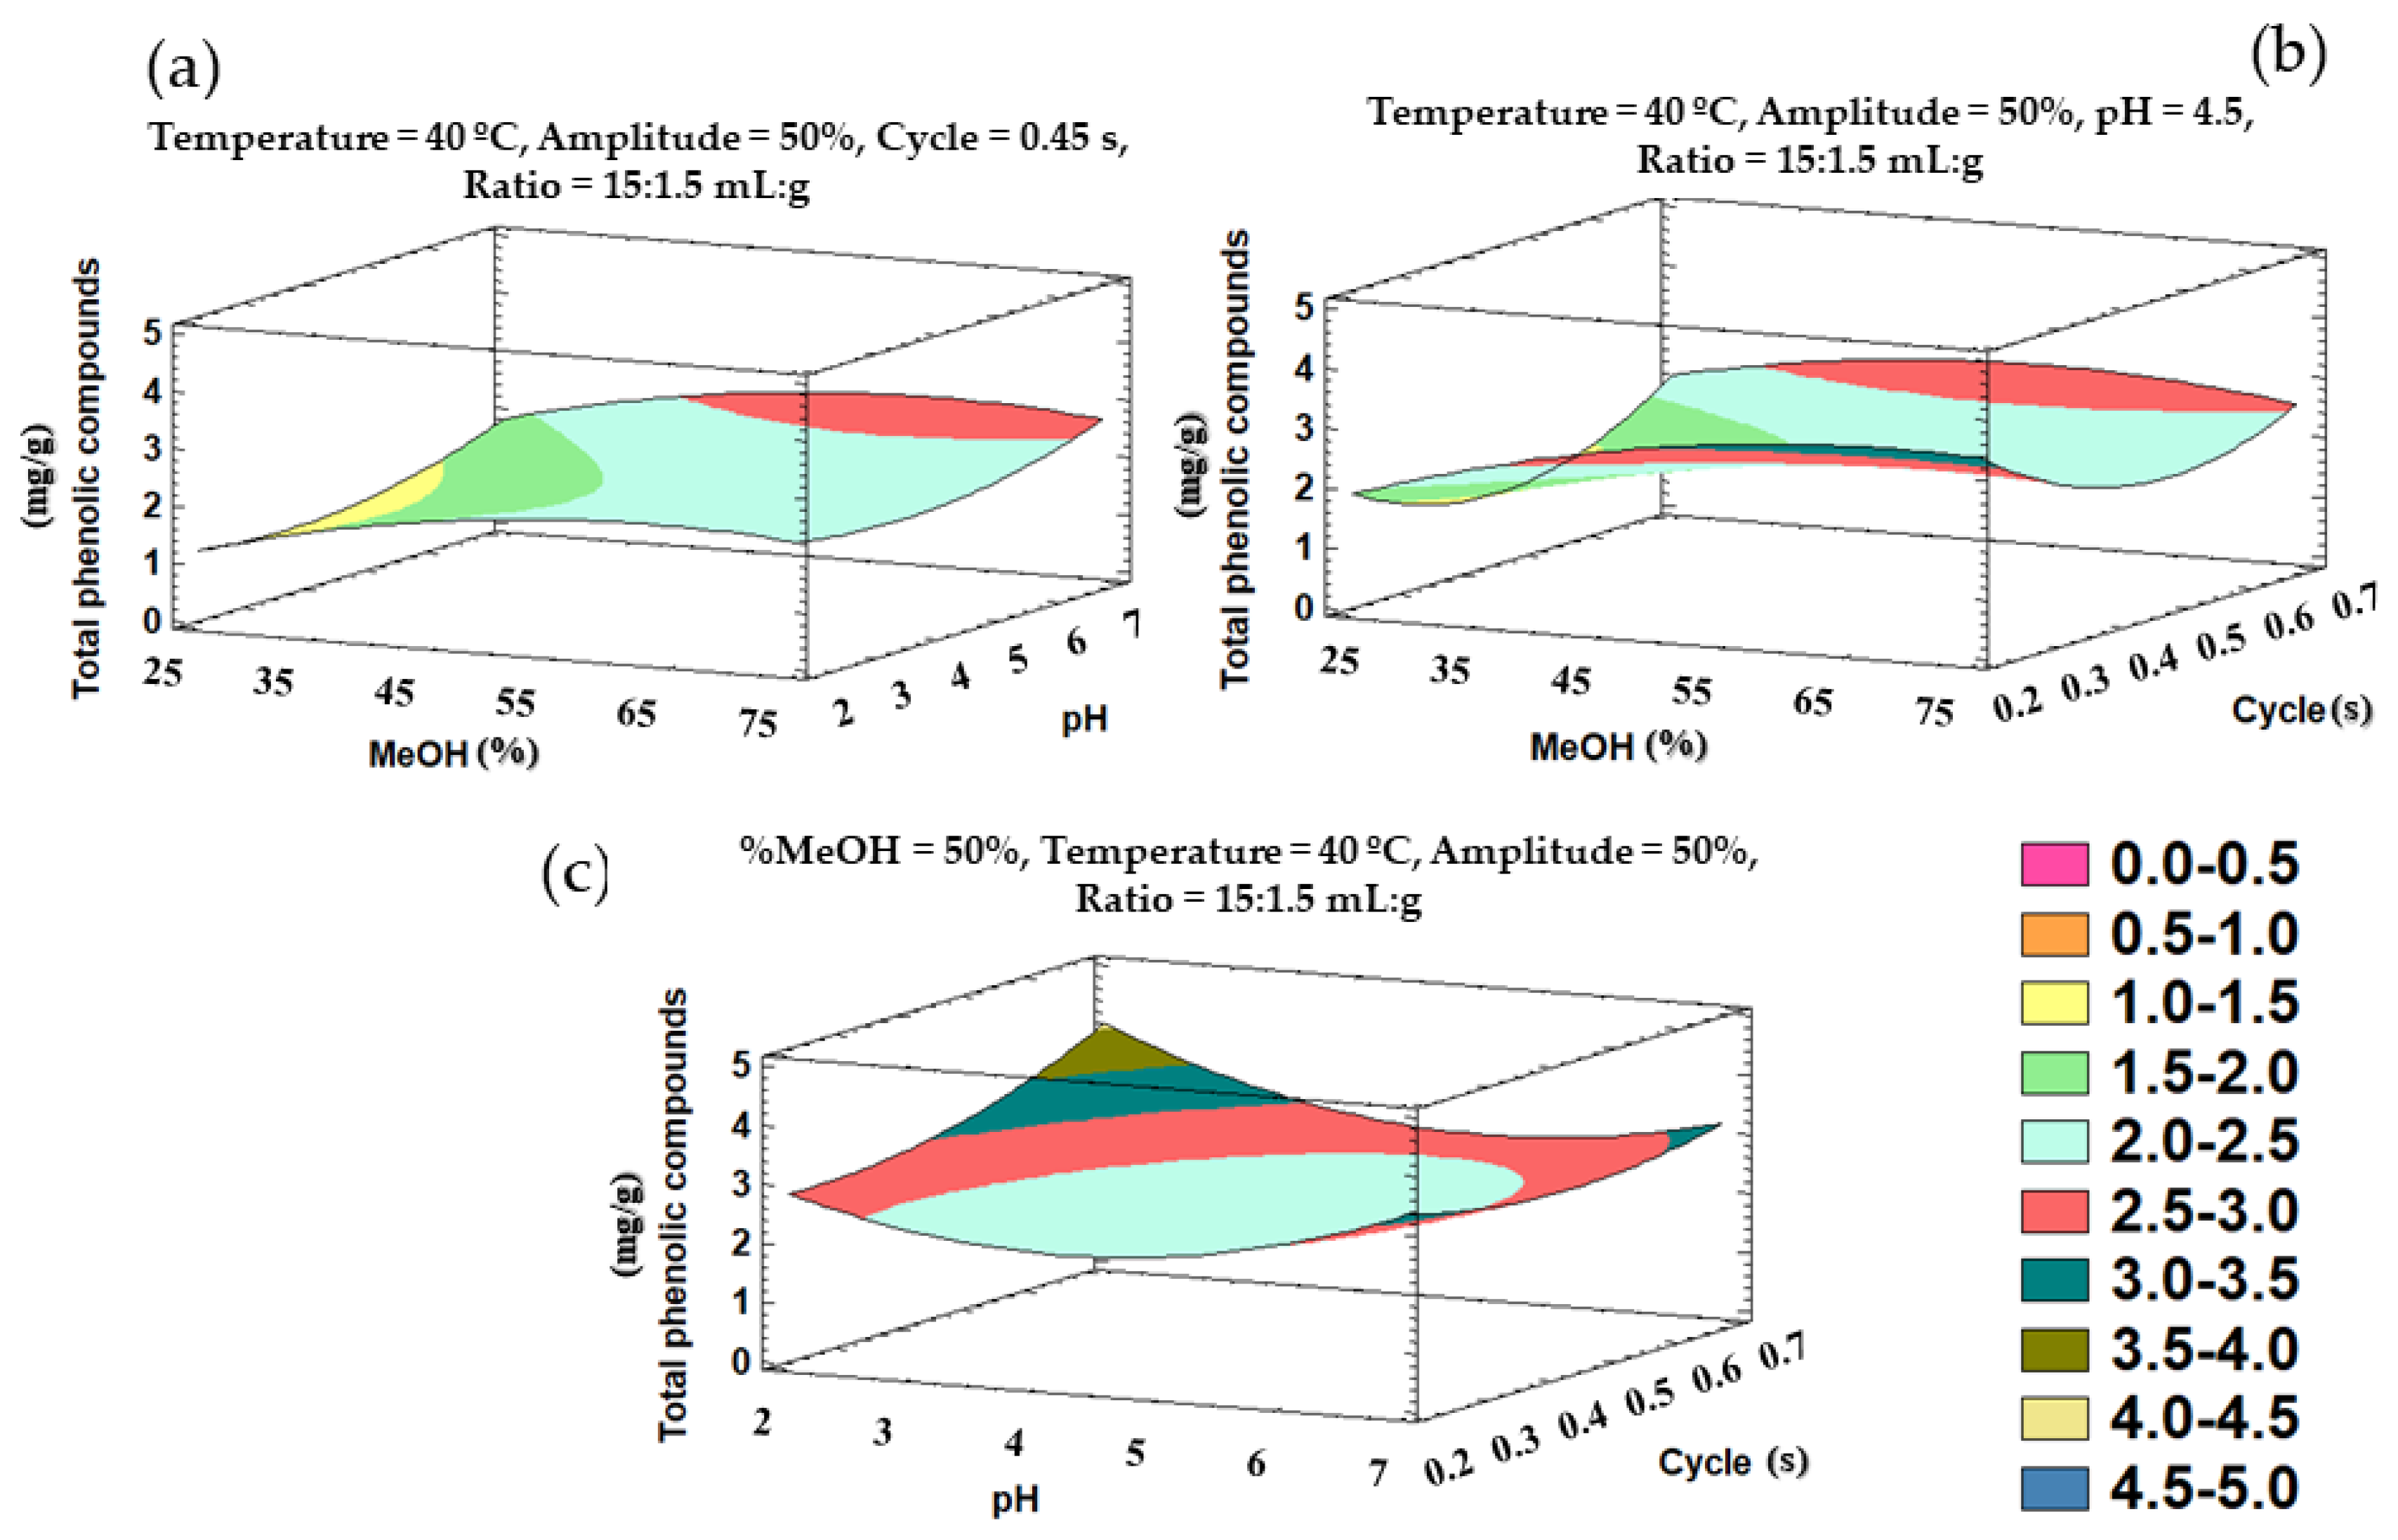
3.1. Experimental Design of the Extraction Method for Total Phenolic Compounds

Firstly, the analysis of variance (ANOVA) was carried out to evaluate the statistical significance of the model. The results are shown in Table 2. Based on the results from this analysis, the coefficients for the different parameters of the quadratic polynomial equation and their significance (p-values) can be obtained.
With respect to the coefficients, they can be used to form a second-order mathematical model Equation (2) that predicts YTP response values as a function of the independent variables. The significance of the model terms was evaluated by F test and p-value at a 95% confidence level. The lack of fit test showed a p-value < 0.005, which indicates evidence for a lack of fit. Therefore, low agreement between experimental and predicted values for phenolic compounds was obtained by using the second-order polynomial equation. This value of lack of adjustment is expected and other authors have obtained similar results [35]. Phenolic compounds are a very wide family of compounds that encompass molecules of many polarities and sizes, from simple phenolic compounds to tannins. For these reasons, in this type of design, the lack of fit usually appears in this range for phenolic compounds. In any case, the optimal conditions obtained are a compromise situation to extract the most desirable quantity of these compounds.
YTP (mg g1) = 2.08193 + 0.444798·X1 + 0.103845·X2 − 0.0169561·X3 − 0.0953913·X4 + 0.297381·X5 − 0.0376947·X6 − 0.472377·X12 + 0.0788551·X1X2 + 0.0574559·X1X3 − 0.273725·X1X4 − 0.0370776·X1X5 − 0.0389726·X1X6 + 0.0174852·X2 2 + 0.00617701·X2 X3 + 0.318381·X2X4 − 0.197963·X2X5 − 0.00164167·X2X6 + 0.0622859·X32 + 0.0478669·X3X4 + 0.0368211·X3X5 − 0.0378576·X3X6 + 0.895324·X4 2 − 0.328879 ·X4X5 − 0.0652641·X4X6 + 0.374389·X5 2 + 0.0398097·X5X6 − 0.225439·X6 2
With respect to the p-values, these inform what factors and/or interactions have a significant influence on the response (YTP). Specifically, the factors and/or interactions with p-values below 0.05 were considered significant at a 95% confidence level. The same results can be graphically represented in a standardized Pareto chart (Figure 3).
Taking the information from the Pareto chart and the ANOVA into account, the following factors and/or interactions can be considered as significant in this study: % methanol in water, solvent pH, the quadratic interaction of the percentage of methanol in water, and the quadratic interaction of cycle. Among the linear terms, the most significant factor was the percentage of methanol in water and this had a positive effect on the response (b1 = 0.444798), which means that a high methanol percentage in water within this range was more efficient for the extraction of the phenolic compounds in sloes. Many researchers have shown that hydroalcoholic mixtures are more efficient than pure solvents for the extraction of polyphenols. This is because when methanol is added to the solvent, it acquires a similar polarity to the phenolic compounds (moderately polar molecules). This increases the solubility of the target compounds in the solvent and favors their extraction [36,37]. pH also has a positive effect (b2 = 0.297381), which means that the extraction of phenolic compounds is more favorable at a neutral pH. Neutral pH tends to favor the extraction of phenolic compounds since acidified solvents may enhance the formation of free radicals, which would generate undesirable reactions that may affect the recovery of polyphenols [38,39]. Among the quadratic effects, the cycle effect, which had a positive effect on the response, was more significant than the negative effect of methanol. Other articles have been found in the literature to support that the cycle is an influential variable. The use of ultrasound cycles (pulse) usually improves the extraction of phenolic compounds from natural matrices [40,41].
The trends outlined above can be graphically represented in three-dimensional surface plots obtained from the polynomial equation for the fitted model. The plots illustrate the combined effects of the most significant variables—% methanol in water, pH, and cycle—on the total phenolic compounds’ recovery (Figure 4).

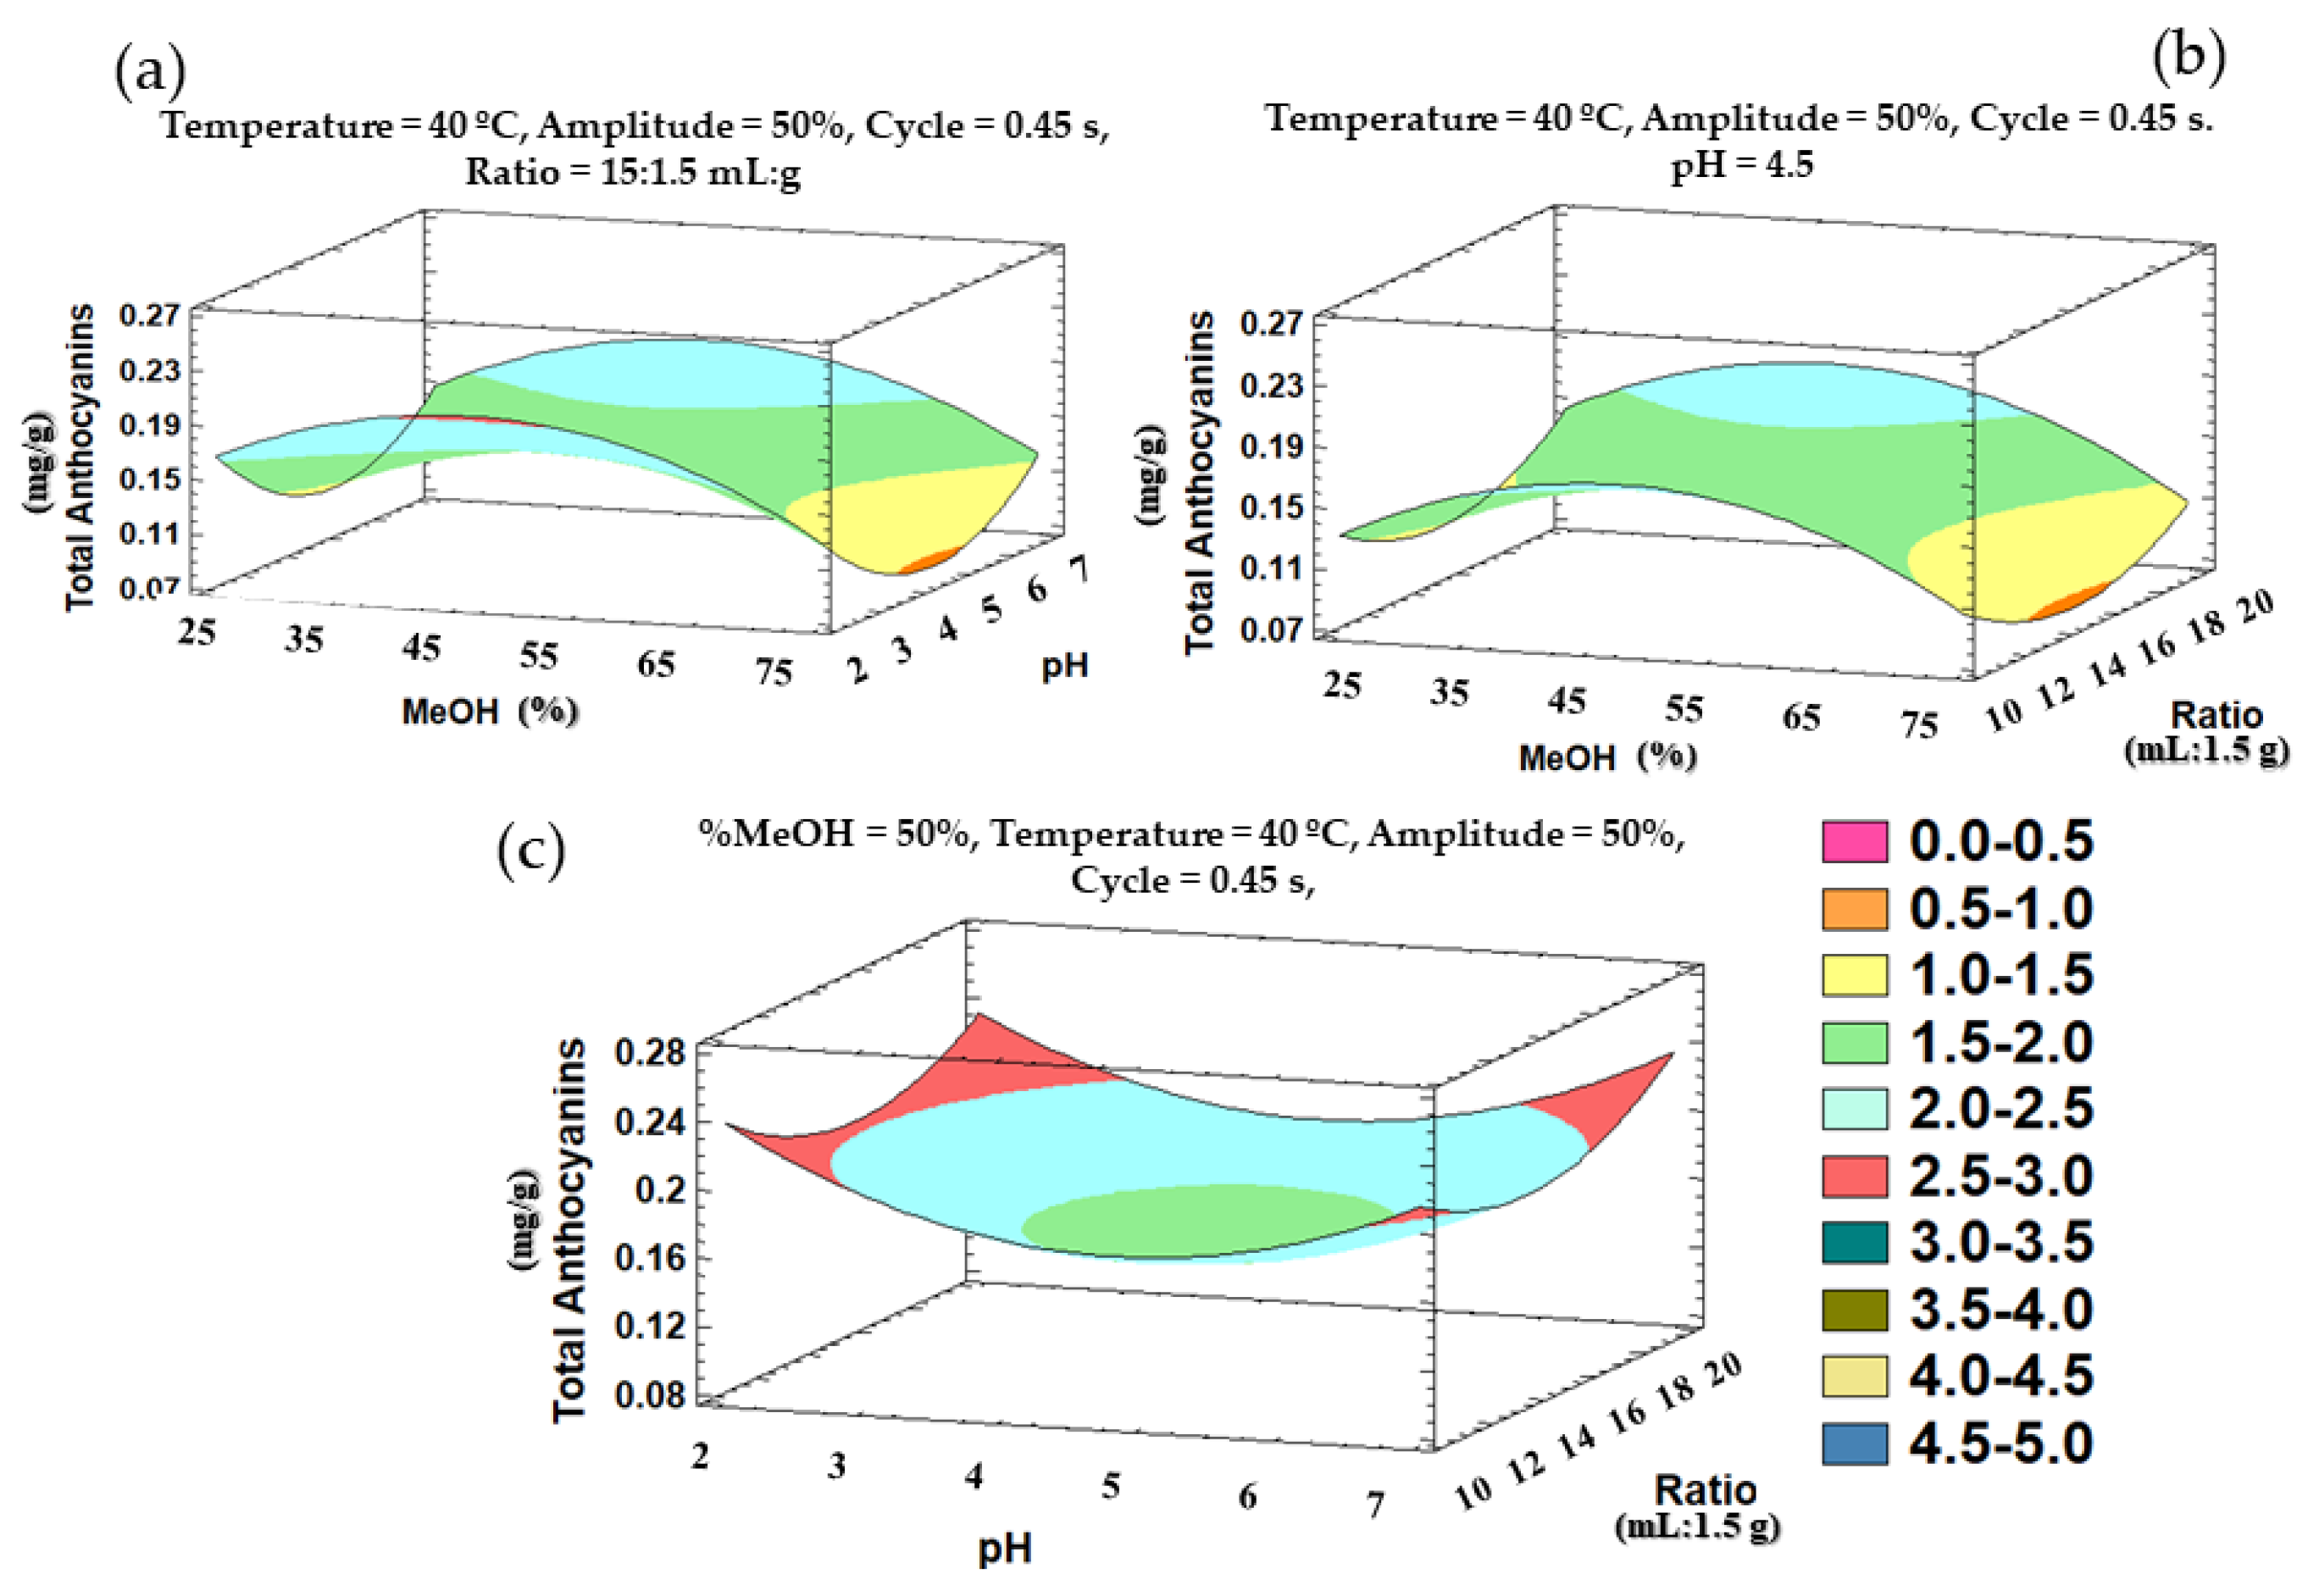
3.2. Experimental Design of the Method for the Extraction of Total Anthocyanins from Sloes

A similar statistical treatment was applied to design the extraction method for the anthocyanins present in sloes. The results are shown in Table 3; Equation (3) is a second-order mathematical model that predicts YTA response values as a function of the independent variables. In this case and contrary to what happened with the phenolic compounds, the lack of fit test showed p-values greater than 0.05, which means that the model fits correctly. Therefore, a statistically significant agreement between experimental and estimated values for anthocyanins was achieved by using the second-order polynomial equation; the mathematical model can be applied to predict the amount of anthocyanins under specific experimental conditions.
YTA (mg g1) = 0.147238 − 0.0156779 ·X1 − 0.00584412·X2 − 0.00527471·X3 − 0.00330947·X4 −0.00543886·X5 + 0.00471369·X6 − 0.0565519 ·X12 − 0.00324514 ·X1X2 + 0.0107542 ·X1X3 + 0.000160117 ·X1X4 + 0.00304127 ·X1X5 − 0.00277275 ·X1X6 − 0.0238888·X2 2 − 0.00133485·X2 X3 − 0.00367707·X2X4 − 0.00488403·X2X5 + 0.00411265·X2X6 + 0.0192637X32 + 0.00952472·X3X4 + 0.00145933·X3X5 − 0.00671815·X3X6 + 0.0143183·X4 2 + 0.0167321 ·X4X5 + 0.00230262·X4X6 + 0.0513733·X5 2 + 0.00651685·X5X6 + 0.0317386·X6 2
Taking the information of the Pareto chart (Figure 5) and the ANOVA (Table 3) into account, there are many factors and/or interactions which can be considered significant for the extraction of anthocyanins. The greater number of variables that have an influence on the extraction of anthocyanins, in comparison with the influential variables for the extraction of phenolic compounds, may be due to the fact that anthocyanins are more sensitive and degrade more easily [42], and therefore, any slight variation in any of the variables may affect its extraction performance. With respect to quadratic interactions, the following ones had p-values below 0.05: the quadratic interactions % methanol in water–% methanol in water, pH–pH, ratio–ratio (solvent–sample), temperature–temperature, amplitude–amplitude, and cycle–cycle. As aforementioned, the percentage of methanol in water, the cycle, and the pH are variables with an influence on the extraction of the phenolic compounds from natural matrices, and therefore, they are for the extraction of anthocyanins [43,44]. With respect to temperature and amplitude, a lot of research has been found in the literature where both have been considered as influential variables. On the one hand, the energy provided by ultrasound waves is necessary to release the target compounds from the matrix, but, on the other hand, it may also accelerate some degradation processes of the anthocyanins [45], and therefore, amplitude values should be controlled. The same happens with temperature, where high values favor a more efficient extraction thanks to the higher solubility and faster extraction kinetics of the compounds [46], but it may also cause the degradation of the targeted compounds, since it may also degrade them [45].
With regards to the interactions between the different factors, minor interactions between cycle and pH were observed. Finally, with respect to the linear terms, the effect of percentage of methanol in water was negative; this means that the solvents with a low methanol content in water in the range studied in this work were more efficient to extract the anthocyanins in sloes. This may indicate that the anthocyanins present in sloes are moderately more polar than the rest of the phenolic compounds. This makes these compounds easier to be extracted using solvents with a higher percentage of water. In addition, in methanol:water mixtures, water contributes to the desorption of the solute from the sample [38].
Similarly to the phenolic compounds, the above outlined trends can be graphically represented in three-dimensional surface plots obtained from the polynomial equation of the fitted model. The plots illustrate the combined effects of the most significant variables—% methanol in water, pH, and cycle—on the total anthocyanins recoveries (Figure 6).

3.3. Optimal Conditions

The Box–Behnken design allows us to determine the optimum values for each factor that maximizes the extraction of the bioactive compounds in sloes.

3.3.1. Total Phenolic Compounds

According to the experimental design, the ideal UAE conditions to extract the phenolic compounds were as follows: an extraction solvent with 67% MeOH in water at pH 7 at 10 °C, 0.2 s cycles, 70% ultrasound amplitude, and 1.5 g/15 mL sample/solvent ratio. As can be observed, some of the optimal values obtained were at extreme levels. In the case of temperature (10 °C, the lowest value of the studied range) and amplitude (70%, the highest value of the studied range), they are not significant variables. Specifically, their p-values (0.4613 and 0.9038, for temperature and amplitude, respectively) were quite high and greater than 0.05. Therefore, these factors have little effect on the response and the changes in their values will not affect the recovery of phenolic compounds from sloes. However, in the case of pH (pH 7, the highest value of the studied range) and cycle (0.2% s, the lowest value of the studied range), they are influential factors in the extraction of phenolic compounds (pH, p-value of 0.0418; cycle–cycle quadratic interaction, p-value of 0.0003). In this sense, higher values in the case of pH and lower values in the case of the cycle could give place to greater extractions. According to the previous experience of our research group, higher pH values could cause unstable structures as a result of basic hydrolysis [23]. In the case of the extraction cycle, although the UAE equipment employed reaches up to 0% ultrasound pulses, applying some pulse, even if it is to a low extent, usually generates higher yields than not applying any pulse. Numerous studies show that the use of ultrasound (pulse) cycles improves the extraction of certain compounds of interest in certain plant matrices, requiring less time and low energy and solvent consumption [40,41]. However, to definitively check if the optimal pH and cycle values obtained were adequate, a series of experiments were carried out, keeping the rest of the variables in optimal conditions. On the one hand, extraction experiments were performed at 0.1 and 0.2 s of the cycle and without ultrasound (magnetic stirring) and on the other hand, experiments were performed at pH 7, 8 and 9. Each of the experiments was carried out in triplicate. Regarding pH, no significant differences (p > 0.05) were observed between the amount of total phenolic compounds extracted at pH 7 (5.562 ± 0.182 mg g−1) and pH 8 (5.416 ± 0.182 mg g−1), with a smaller amount of phenolic compounds (p < 0.05) being observed at pH 9 (5.137 ± 0.275 mg g−1). Regarding the extraction cycle, it is observed that the largest amount of phenolic compounds is obtained at 0.2 s (5.562 ± 0.182 mg g−1), with considerable significant differences with respect to 0.1 s (4.706 ± 0.327 mg g−1), or not using ultrasound (2.981 ± 0.396 mg g−1).

3.3.2. Total Anthocyanins

With respect to the anthocyanins, the optimum UAE conditions were as follows: an extraction solvent with 44% MeOH in water at pH 2 at 48 °C, 0.2 s cycles, 30% ultrasound amplitude, and 1.5 g/20 mL sample/solvent ratio. In Figure 5 and Table 3, it is observed that all the variables studied are significant in the extraction of the total anthocyanins present in the sloes. If the optimal values are observed, we can verify that those corresponding to the pH, cycle, ultrasound amplitude, and sample/solvent ratio are located at the extreme values of the studied range. As has been previously done for total phenolic compounds, due to these variables, they are significant and their optimal value is presented at one end of the studied interval; values outside of said interval have been studied, keeping the rest of the variables constant at the optimal values obtained. All the experiments were carried out in triplicate.
Regarding pH, values of 1, 1.5 and 2 have been studied, keeping the rest of the variables at their optimal values. pH values below 1 have not been tested since such low values could cause acid hydrolysis of these compounds. In view of the results, it is observed that there are no statistically significant differences (p > 0.05) with the different pH values studied (0.302 ± 0.008 mg g−1—pH 2; 0.307 ± 0.012 mg g−1—pH 1.5; 0.295 ± 0.015 mg g−1—pH 1).
Regarding the cycle, just as it happened with total phenolic compounds, the lower value of the studied interval has been obtained. Similarly, extraction at different cycles (0.2; 0.1; without ultrasound-magnetic stirring) has been studied. Significant differences have been obtained in all cases, obtaining the highest amount of anthocyanins extracted with a 0.2 cycle (0.302 ± 0.008 mg g−1—cycle 0.2; 0.268 ± 0.011 mg g−1—cycle 0.1; 0.184 ± 0.018 mg g−1—magnetic stirring).
For the ultrasound amplitude, the lowest range was obtained (30% of the maximum amplitude of the equipment (200 W)). Lower amplitude values (20 and 10%) have been studied to determine if there was an improvement in the amount of anthocyanins removed. It has been observed that there are no significant differences (p > 0.05) between 30% (0.302 ± 0.008 mg g−1) and 20% (0.308 ± 0.014 mg g−1) of amplitude, while with 10% of amplitude, the amount of anthocyanins extracted is considerably less (0.267 ± 0.014 mg g−1).
In the case of the sample/solvent ratio, the highest concentration of anthocyanins was obtained by using a higher volume of solvent. Similarly, higher volumes have been tested (25 and 30 mL of solvent for 1.5 g of sample). No significant differences (p > 0.05) have been observed for the three mean values obtained (0.302 ± 0.008 mg g−1—1.5 g/20 mL; 0.306 ± 0.006 mg g−1—1.5 g/25 mL; 0.307 ± 0.011 mg g−1—1.5 g/30 mL).

3.3.3. Comparison Between Total Phenolic Compounds and Anthocyanins

As above mentioned, anthocyanins are a particular type of phenolic compounds, so in general, differences between the optimal values for the extraction of these compounds and for the extraction of phenolic compounds are to be expected. This is consistent with the previous results obtained by our research group for the extraction of these bioactive compounds from other berry matrices [26,46,47].
In the first place, with respect to the ratio, high values were obtained when extracting both compounds. A smaller amount of sample (1.5 g sloe) in a greater volume of solvent resulted in a greater gradient and a greater mass transfer, thus favoring the extraction process [48].
With respect to the optimal solvents, greater extractions of phenolic compounds than anthocyanins were obtained when higher percentages of methanol were used, which indicates a greater polarity of the anthocyanins. Nevertheless, the role of the solvent may vary depending on the mixture, thus, methanol increases the solubility of polyphenols, while water contributes to the desorption of the solute in the samples [39].
Regarding pH, different values were obtained—pH 7 for phenolic compounds and pH 2 for anthocyanins. It has already been commented that basic pH is favorable for the extraction of phenolic compounds. However, in the case of anthocyanins, recovery increases in an acid medium since these compounds are more stable at low pH solutions [44]. Furthermore, low pH contributes to the breakdown of cell walls by acid hydrolysis, thus, releasing the anthocyanins from the cell-matrix and increasing the extraction yields of these compounds [49,50,51].
Finally, with regards to the ultrasound amplitude, high values may tend to promote free radicals, thus, accelerating the degradation of the bioactive compounds [52]. This could explain why the phenolic compounds obtained an optimal value at the top end of the range studied (70%) and the anthocyanins—more degradable compounds—exhibited the lowest value in the amplitude range studied (30%).

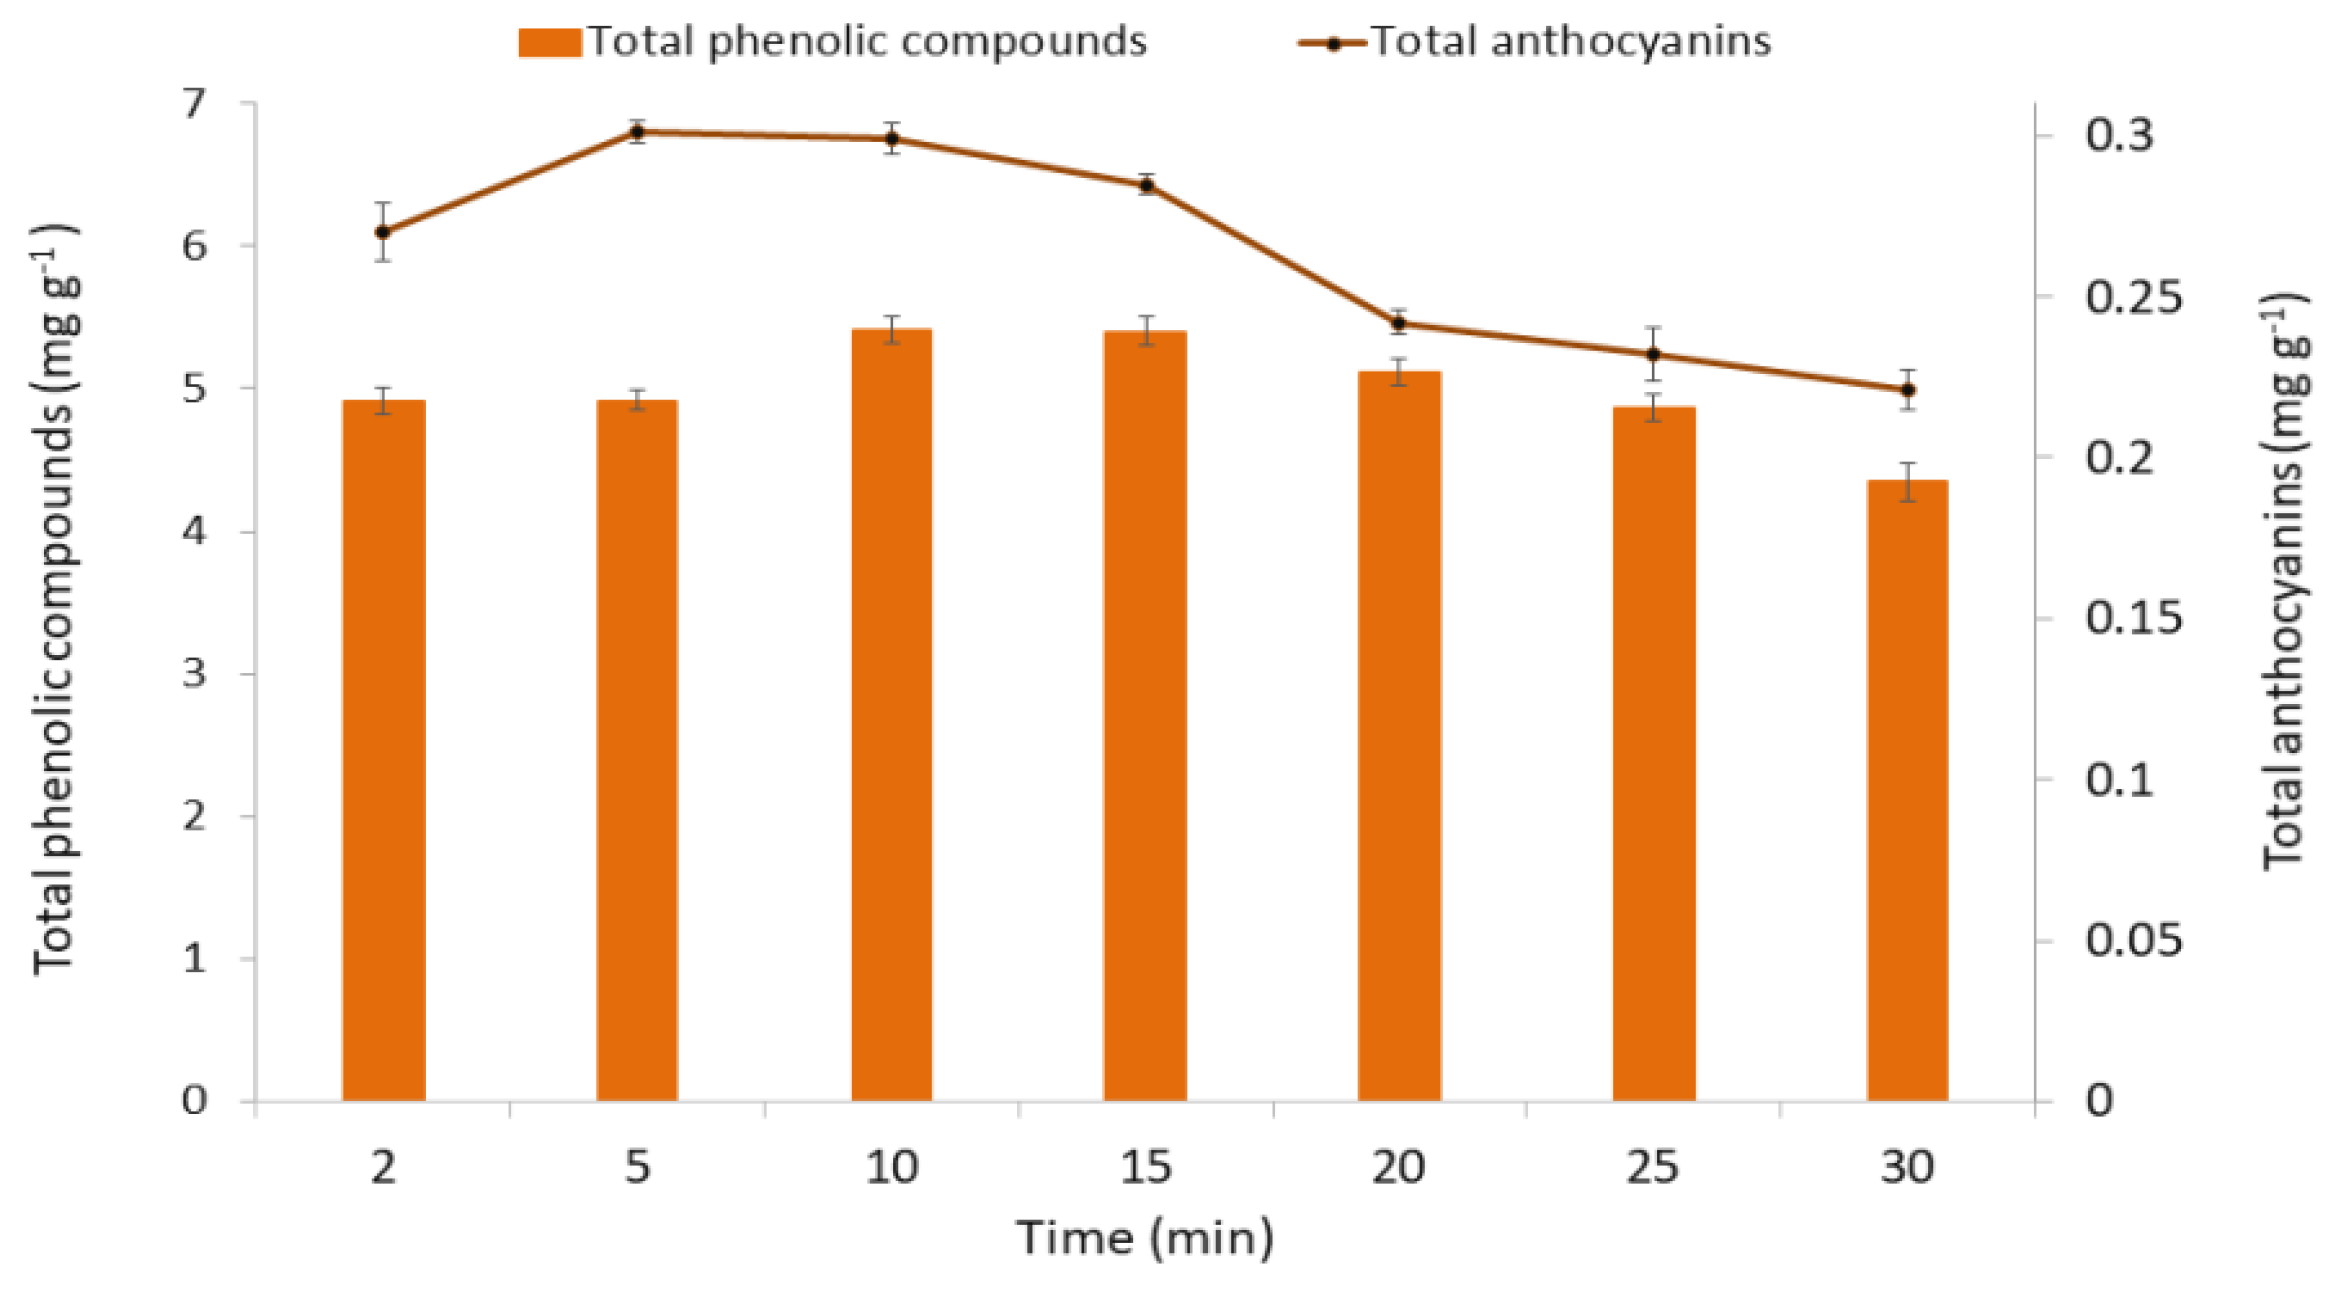
3.4. Study of the Optimal Extraction Time

Once the effects of the variables on both extraction methods and the optimal values had been found, the optimal extraction time of each method was studied. Several ultrasound-assisted extractions were carried out under optimal conditions with extraction times varying between 2, 5, 10, 15, 20, and 25 min. The total anthocyanins and phenolic compounds’ recoveries are represented in Figure 7.
The phenolic compounds reached their maximum recoveries at 10 and 15 min. Naturally, a shorter time is more desirable for the corresponding savings. The maximum recovery of anthocyanins was reached at 5 min. In both cases, longer extraction times led to lower recoveries, probably due to the degradation of the bioactive compounds of interest [17].

3.5. Method Accuracy

Finally, the precision of both methods was evaluated in terms of repeatability and intermediate precision. Repeatability was evaluated by performing 12 extractions under the same conditions on the same day. Intermediate precision was evaluated by performing 18 additional extractions on each one of the following two days. Altogether, 30 phenolic compounds extractions and 30 anthocyanins extractions were carried out under optimal conditions for each one of the methods. The results were expressed by the coefficient of variation (CV) from their means. The repeatability and intermediate precision for the extraction of phenolic compounds were determined as 3.96 and 4.33%, respectively, while for anthocyanins, 2.80 and 3.85% were the values obtained. Therefore, the accuracy of the methods was demonstrated, since 5% is generally considered as the maximum allowable deviation in this type of test [53].
Finally, having proven the accuracy of both methods, let us say that the amount of phenolic compounds extracted from sloes was 5.412 mg g−1, while the amount of anthocyanins extracted from sloes was 0.301 mg g−1.

3.6. Re-Extraction Study

To ensure that the extraction of both total phenolic compounds and anthocyanins is quantitative, a re-extraction study of the sample was carried out once the extraction process had been finalized. To do this, the sloe residue obtained after the second centrifugation and removal of the extract (supernatant) was again subjected to an extraction process under optimal extraction conditions for both total phenolic compounds and anthocyanins. The re-extraction analyses were carried out in triplicate. With respect to total phenolic compounds, a concentration of 0.198 ± 0.016 mg g−1 was obtained, which corresponds to 3.56% of the amount extracted by the optimized extraction method in the first cycle. Having obtained a quantity of total phenolic compounds less than 5%, we can consider that the developed method quantitatively extracts the phenolic compounds present in the sample. With respect to anthocyanins, no clear chromatographic peaks were observed in the chromatogram, indicating that their concentration was below the detection limit of the chromatographic method. For this reason, we can assure that the extraction method developed for anthocyanins also extracts, in a quantitative way, the anthocyanins present in the sample.

3.7. Applying the Developed Methods to Real Sloe Matrices

Once the extraction methods had been developed, an additional study was carried out to quantify the phenolic compounds and the anthocyanins present in two commercial sloe-containing products. Specifically, homemade “Pacharán” and sloe jams were elaborated and analyzed in order to demonstrate the applicability of the methods for the extraction from real matrices.

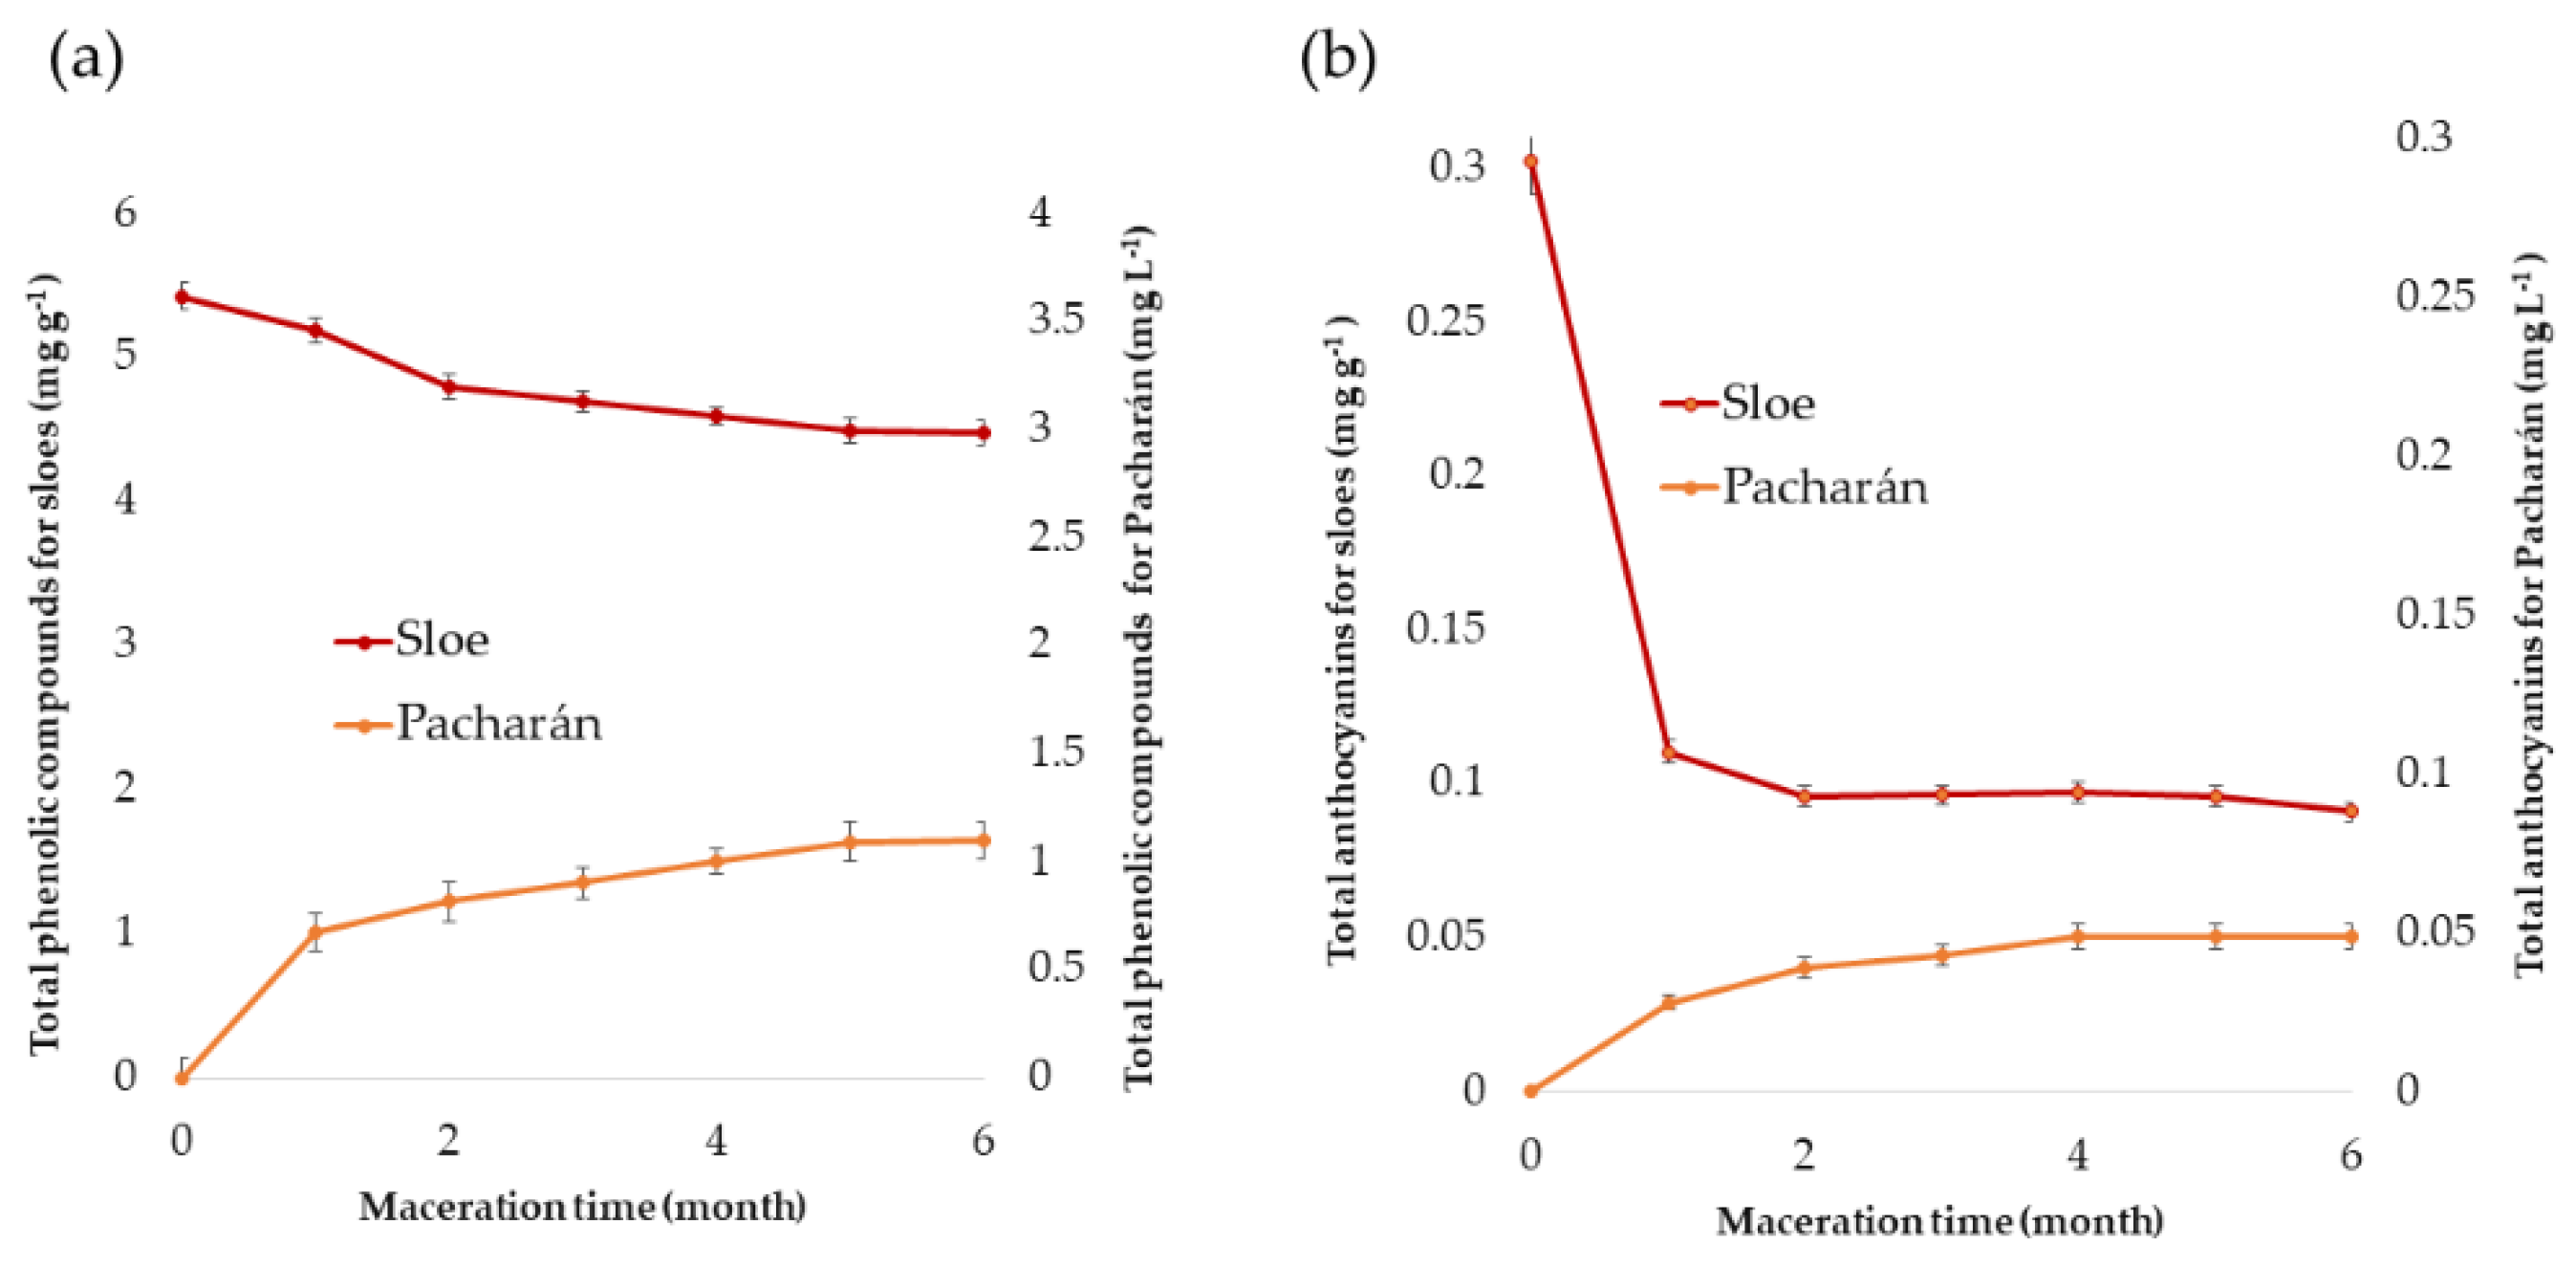
3.7.1. Extraction and Analysis of the Bioactive Compounds in “Pacharán”

The total phenolic compounds and the total anthocyanins present in “Pacharán” were determined with regards to the maceration time of the sloes in the aniseed. In addition, in order to know the extraction ranges of these compounds in “Pacharán”, the sloes used for the production of the liquor were subjected to the two UAE methods previously developed. The results are shown in Figure 8.
The concentration of phenolic compounds in “Pacharán” with respect to its maceration time presents a clearly increasing trend. With regards to the anthocyanins, it can be observed that most of the extraction occurs in the first maceration month. Then, the increasing trend in content is not as steep as for total phenolic compounds. Similar results have been obtained by other authors for “Pacharán” and other liquors such as maqui liquor [54]. In addition, for both compounds, after the fifth month, the concentration of anthocyanins and phenolic compounds remains practically unchanged, reaching a maximum of 0.083 mg of anthocyanins L−1 of “Pacharán” and 2.491 mg of phenolic compounds L−1 of “Pacharán”. It can be, therefore, concluded that after the fifth month, both the concentration of total phenolic compounds and anthocyanins have an asymptotic behavior and that a greater transfer of compounds cannot be achieved, regardless of the time that sloes remain in aniseed maceration.
With respect to sloes, a decrease in their concentration of total phenolic compounds and anthocyanins can be observed, since they have been transferred to the “Pacharán”. As aforementioned, in the case of the anthocyanins, such a decrease is less marked after the first month.

3.7.2. Extraction and Analysis of the Bioactive Compounds from Sloe Jams

In the same way as “Pacharán”, the total phenolic compounds and the total anthocyanins present in different types of sloe jams were analyzed. The results are shown in Figure 9. It can be observed that the concentration of total phenolic compounds and anthocyanins in commercial jams is lower than that in handmade jam. This may be due to the degradation of these bioactive compounds due to the length of time and the storage conditions of commercial jams.
All these results indicate that the proposed UAE extraction methods are suitable for the extraction of phenolic compounds and anthocyanins from real sloe samples. This is of great interest, among other things, because it allows the characterization of sloe varieties according to their phenolic composition by means of a rapid, inexpensive, and environmentally friendly extraction technique. Furthermore, it allows for improving of the quality of the raw material, the intermediate products, and the final products.

4. Conclusions

To the best of our knowledge, although UAE has been used for the extraction of antioxidant compounds from a variety of fruits, it had never been optimized for the sloes with analytical purposes. For this aim, a UP200S ultrasonic processor (200 W and 24 kHz) with a micro tip S7 probe (7 mm diameter) was employed. Specifically, two UAE methods have been developed for the extraction of total phenolic compounds and total anthocyanins from sloes. The influential factors that maximize the extraction of these bioactive compounds from sloes have been optimized, studying their effect on the responses and determining the optimum values for each factor. According to the experimental design, the ideal UAE conditions to extract the total phenolic compounds using this UAE equipment were as follows: extraction solvent at 67% MeOH in water, pH 7, 10 °C, 0.2 s cycles, 70% ultrasound amplitude, and 1.5 g/15 mL sample/solvent ratio. With respect to the extraction of total anthocyanins, the optimum UAE conditions using the UAE equipment were as follows: extraction solvent at 44% MeOH in water, pH 3, 48 °C, 0.2 s cycles, 30% ultrasound amplitude, and 1.5 g/20 mL sample/solvent ratio. The maximum recoveries were obtained at 10 and 5 min, respectively. Therefore, it can be said that large recoveries of either type of bioactive compounds are achieved in a short time. Furthermore, both methods presented high repeatability and intermediate precision values (RSD < 5%). Re-extraction studies indicate that quantitative sample extractions (>95%) have been achieved for both total phenolic compounds and total anthocyanins. Finally, the methods were successfully applied to different sloe commercial products (jams and homemade “Pacharán”), thus, their applicability for the extraction of the compounds of interest from real matrix samples was demonstrated. Therefore, based on the results and in comparison with traditionally used methods for the extraction of phenolic compounds and anthocyanins from sloes, it can be concluded that these new ultrasound-assisted extraction methods developed demonstrate that UAE is a fast and effective technique which allows for the achieving of a great recovery (> 95%) of the compounds of interest.

Author Contributions

Conceptualization, E.E.-B. and G.F.B.; methodology, E.E.-B. and G.F.B.; software, M.F.-G.; formal analysis, A.V.G.-d.-P., M.V.-E. and C.C.; investigation, E.E.-B., C.C. and G.F.B.; resources, J.Á.Á., M.P. and J.A.; data curation, A.V.G.-d.-P., M.V.-E., M.F.-G. and G.F.B.; writing—original draft preparation, A.V.G.-d.-P., M.V.-E.; writing—review and editing, G.F.B., M.F.-G. and E.E.-B.; supervision, G.F.B., M.F.-G. and E.E.-B.; project administration, G.F.B., J.Á.Á., M.P. and J.A. All authors have read and agreed to the published version of the manuscript.

Funding

The authors acknowledge V. la Andaluza and University of Cadiz for the support provided through the project OT2016/046.

Acknowledgments

The authors are grateful to IVAGRO (University of Cadiz) for provision of the necessary facilities to carry out the research.

Conflicts of Interest

The authors declare no conflict of interest.

References

  1. Gündüz, G.T. Antimicrobial activity of sloe berry purees on Salmonella spp. Food Control 2013, 32, 354–358. [Google Scholar] [CrossRef]
  2. Cosmulescu, S.; Trandafir, I.; Nour, V. Phenolic acids and flavonoids profiles of extracts from edible wild fruits and their antioxidant properties. Int. J. Food Prop. 2017, 20, 3124–3134. [Google Scholar] [CrossRef] [Green Version]
  3. Yang, C.; Li, F.; Du, B.; Chen, B.; Wang, F.; Wang, M. Isolation and characterization of new phenolic compounds with estrogen biosynthesis-inhibiting and antioxidation activities from Broussonetia papyrifera leaves. PLoS ONE 2014, 9, e94198. [Google Scholar] [CrossRef] [PubMed]
  4. Mikulic-Petkovsek, M.; Stampar, F.; Veberic, R.; Sircelj, H. Wild Prunus Fruit Species as a Rich Source of Bioactive Compounds. J. Food Sci. 2016, 81, 1928–1937. [Google Scholar] [CrossRef]
  5. Gironés-Vilaplana, A.; Mena, P.; Moreno, D.A.; García-Viguera, C. Evaluation of sensorial; phytochemical and biological properties of new isotonic beverages enriched with lemon and berries during shelf life. J. Sci. Food Agric. 2014, 94, 1090–1100. [Google Scholar] [CrossRef]
  6. Eimert, K.; Hüwe, U.; Rückert, F.-E. Evaluation of genetic differentiation of autochthonous sloe (Prunus spinosa; rosaceae) populations across Germany using molecular markers. Plant Ecol. Evol. 2016, 149, 280–290. [Google Scholar] [CrossRef]
  7. Kavaz Yuksel, A. The Effects of Blackthorn (Prunus Spinosa L.) Addition on Certain Quality Characteristics of Ice Cream. J. Food Qual. 2015, 38, 413–421. [Google Scholar] [CrossRef] [Green Version]
  8. Baltas, N.; Pakyildiz, S.; Can, Z.; Dincer, B.; Kolayli, S. Biochemical properties of partially purified polyphenol oxidase and phenolic compounds of Prunus spinosa L. subsp. dasyphylla as measured by HPLC-UV. Int. J. Food Prop. 2017, 20, 1–15. [Google Scholar] [CrossRef]
  9. Guimarães, R.; Barros, L.; Dueñas, M.; Carvalho, A.M.; Queiroz, M.J.R.P.; Santos-Buelga, C.; Ferreira, I.C.F.R. Characterisation of phenolic compounds in wild fruits from Northeastern Portugal. Food Chem. 2013, 141, 3721–3730. [Google Scholar] [CrossRef] [Green Version]
  10. Pinacho, R.; Cavero, R.Y.; Astiasarán, I.; Ansorena, D.; Calvo, M.I. Phenolic compounds of blackthorn (Prunus spinosa L.) and influence of in vitro digestion on their antioxidant capacity. J. Funct. Foods 2015, 19, 49–62. [Google Scholar] [CrossRef]
  11. Sokoł-Łȩtowska, A.; Kucharska, A.Z.; Wińska, K.; Szumny, A.; Nawirska-Olszańska, A.; Mizgier, P.; Wyspiańska, D. Composition and antioxidant activity of red fruit liqueurs. Food Chem. 2014, 157, 533–539. [Google Scholar] [CrossRef] [PubMed]
  12. Barros, L.; Carvalho, A.M.; Morais, J.S.; Ferreira, I.C.F.R. Strawberry-tree; blackthorn and rose fruits: Detailed characterisation in nutrients and phytochemicals with antioxidant properties. Food Chem. 2010, 120, 247–254. [Google Scholar] [CrossRef]
  13. Lovrić, V.; Putnik, P.; Bursać Kovačević, D.; Jukić, M.; Dragović-Uzelac, V. The Effect of Microwave-Assisted Extraction on the Phenolic Compounds and Antioxidant Capacity of Blackthorn Flowers. Food Technol. Biotechnol. 2017, 55, 243–250. [Google Scholar] [CrossRef] [PubMed]
  14. Pradal, D.; Vauchel, P.; Decossin, S.; Dhulster, P.; Dimitrov, K. Kinetics of ultrasound-assisted extraction of antioxidant polyphenols from food by-products: Extraction and energy consumption optimization. Ultrason. Sonochem. 2016, 32, 137–146. [Google Scholar] [CrossRef] [PubMed]
  15. Dai, J.; Mumper, R.J. Plant phenolics: Extraction; analysis and their antioxidant and anticancer properties. Molecules 2010, 15, 7313–7352. [Google Scholar] [CrossRef]
  16. Mason, T.J.; Paniwnyk, L.; Lorimer, J.P. The uses of ultrasound in food technology. Ultrason. Sonochem. 1996, 3, 253–260. [Google Scholar] [CrossRef]
  17. Espada-Bellido, E.; Ferreiro-González, M.; Carrera, C.; Palma, M.; Barroso, C.G.; Barbero, G.F. Optimization of the ultrasound-assisted extraction of anthocyanins and total phenolic compounds in mulberry (Morus nigra) pulp. Food Chem. 2017, 219, 23–32. [Google Scholar] [CrossRef]
  18. Pasquel Reátegui, J.L.; Machado, A.P.D.F.; Barbero, G.F.; Rezende, C.A.; Martínez, J. Extraction of antioxidant compounds from blackberry (Rubus sp.) bagasse using supercritical CO2 assisted by ultrasound. J. Supercrit Fluids 2014, 94, 223–233. [Google Scholar] [CrossRef]
  19. González-Centeno, M.R.; Comas-Serra, F.; Femenia, A.; Rosselló, C.; Simal, S. Effect of power ultrasound application on aqueous extraction of phenolic compounds and antioxidant capacity from grape pomace (Vitis vinifera L.): Experimental kinetics and modeling. Ultrason. Sonochem. 2015, 22, 506–514. [Google Scholar] [CrossRef] [Green Version]
  20. Živković, J.; Šavikin, K.; Janković, T.; Ćujić, N.; Menković, N. Optimization of ultrasound-assisted extraction of polyphenolic compounds from pomegranate peel using response surface methodology. Sep. Purif. Technol. 2018, 194, 40–47. [Google Scholar] [CrossRef]
  21. Elez Garofulić, I.; Zorić, Z.; Pedisić, S.; Brnčić, M.; Dragović-Uzelac, V. UPLC-MS 2 Profiling of Blackthorn Flower Polyphenols Isolated by Ultrasound-Assisted Extraction. J. Food Sci. 2018, 83, 2782–2789. [Google Scholar] [CrossRef] [PubMed]
  22. Leichtweis, M.G.; Pereira, C.; Prieto, M.A.; Barreiro, M.F.; Baraldi, I.J.; Barros, L.; Ferreira, I.C.F.R. Ultrasound as a Rapid and Low-Cost Extraction Procedure to Obtain Anthocyanin-Based Colorants from Prunus spinosa L. Fruit epicarp: Comparative study with conventional heat-based extraction. Molecules 2019, 24, 1–17. [Google Scholar] [CrossRef] [PubMed] [Green Version]
  23. González de Peredo, A.V.; Vázquez-Espinosa, M.; Espada-Bellido, E.; Ferreiro-González, M.; Amores-Arrocha, A.; Palma, M.; Barbero, G.F.; Jiménez-Cantizano, A. Alternative Ultrasound-Assisted Method for the Extraction of the Bioactive Compounds Present in Myrtle (Myrtus communis L.). Molecules 2019, 24, 882. [Google Scholar] [CrossRef] [PubMed] [Green Version]
  24. Aliaño-González, M.J.; Espada-Bellido, E.; Ferreiro-González, M.; Carrera, C.; Palma, M.; Ayuso, J.; Álvarez, J.A.; Barbero, G.F. Extraction of Anthocyanins and Total Phenolic Compounds from Açai (Euterpe oleracea Mart.) Using an Experimental Design Methodology. Part 2: Ultrasound-Assisted Extraction. Agronomy 2020, 10, 326. [Google Scholar] [CrossRef] [Green Version]
  25. Espada-Bellido, E.; Ferreiro-González, M.; Carrera, C.; Palma, M.; Álvarez, J.A.; Barbero, G.F.; Ayuso, J. Extraction of Antioxidants from Blackberry (Rubus ulmifolius L.): Comparison between Ultrasound and Microwave Assisted Extraction Techniques. Agronomy 2019, 9, 745. [Google Scholar] [CrossRef] [Green Version]
  26. Vázquez-Espinosa, M.; González de Peredo, A.V.; Espada-Bellido, E.; Ferreiro-González, M.; Toledo-Domínguez, J.J.; Carrera, C.; Palma, M.; Barbero, G.F. Ultrasound-Assisted Extraction of Two Types of Antioxidant Compounds (TPC and TA) from Black Chokeberry (Aronia melanocarpa L.): Optimization of the Individual and Simultaneous Extraction Methods. Agronomy 2019, 9, 456. [Google Scholar] [CrossRef] [Green Version]
  27. Vázquez-Espinosa, M.; González de Peredo, A.V.; Ferreiro-González, M.; Carrera, C.; Palma, M.; Barbero, G.F.; Espada-Bellido, E. Assessment of ultrasound assisted extraction as an alternative method for the extraction of anthocyanins and total phenolic compounds from maqui berries (Aristotelia chilensis (Mol.) Stuntz). Agronomy 2019, 9, 148. [Google Scholar] [CrossRef] [Green Version]
  28. Singleton, V.L.; Orthofer, R.; Lamuela-Raventós, R.M. Analysis of total phenols and other oxidation substrates and antioxidants by means of folin-ciocalteu reagent. Methods Enzymol. 1999, 299, 152–178. [Google Scholar] [CrossRef]
  29. Siddiq, M.; Dolan, K.D.; Perkins-Veazie, P.; Collins, J.K. Effect of pectinolytic and cellulytic enzymes on the physical; chemical; and antioxidant properties of blueberry (Vaccinium corymbosum L.) juice. LWT-Food Sci. Technol. 2018, 92, 127–132. [Google Scholar] [CrossRef]
  30. Hogan, S.; Chung, H.; Zhang, L.; Li, J.; Lee, Y.; Dai, Y.; Zhou, K. Antiproliferative and antioxidant properties of anthocyanin-rich extract from açai. Food Chem. 2010, 118, 208–214. [Google Scholar] [CrossRef]
  31. Ferreira, S.L.C.; Bruns, R.E.; Ferreira, H.S.; Matos, G.D.; David, J.M.; Brandão, G.C.; da Silva, E.G.P.; Portugal, L.A.; dos Reis, P.S.; Souza, A.S.; et al. Box-Behnken design: An alternative for the optimization of analytical methods. Anal. Chim. Acta 2007, 597, 179–186. [Google Scholar] [CrossRef] [PubMed]
  32. Maran, J.; Manikandan, S.; Thirugnanasambandham, K.; Vigna Nivetha, C.; Dinesh, R. Box-Behnken design based statistical modeling for ultrasound-assisted extraction of corn silk polysaccharide. Carbohydr. Polym. 2013, 92, 604–611. [Google Scholar] [CrossRef]
  33. Setyaningsih, W.; Saputro, I.E.; Carrera, C.A.; Palma, M.; Barroso, C.G. Multiresponse optimization of a UPLC method for the simultaneous determination of tryptophan and 15 tryptophan-derived compounds using a Box-Behnken design with a desirability function. Food Chem. 2017, 225, 1–9. [Google Scholar] [CrossRef] [PubMed]
  34. Li, H.; van den Driesche, S.; Bunge, F.; Yang, B.; Vellekoop, M.J. Optimization of on-chip bacterial culture conditions using the Box-Behnken design response surface methodology for faster drug susceptibility screening. Talanta 2019, 194, 627–633. [Google Scholar] [CrossRef] [PubMed]
  35. Fernández-Barbero, G.; Pinedo, C.; Espada-Bellido, E.; Ferreiro-González, M.; Carrera, C.; Palma, M.; García-Barroso, C. Optimization of ultrasound-assisted extraction of bioactive compounds from jabuticaba (Myrciaria cauliflora) fruit through a Box-Behnken experimental design. Food Sci. Technol. 2019, 9, 745. [Google Scholar] [CrossRef] [Green Version]
  36. Machado, A.P.D.F.; Pasquel-Reátegui, J.L.; Barbero, G.F.; Martínez, J. Pressurized liquid extraction of bioactive compounds from blackberry (Rubus fruticosus L.) residues: A comparison with conventional methods. Food Res. Int. 2015, 77, 675–678. [Google Scholar] [CrossRef]
  37. Mustafa, A.; Turner, C. Pressurized liquid extraction as a green approach in food and herbal plants extraction: A review. Anal. Chim. Acta 2011, 703, 8–18. [Google Scholar] [CrossRef]
  38. Kidak, R.; Ince, N.H. Ultrasonic destruction of phenol and substituted phenols: A review of current research. Ultrason. Sonochem. 2006, 13, 195–199. [Google Scholar] [CrossRef]
  39. Machado, A.P.D.F.; Pereira, A.L.D.; Barbero, G.F.; Martínez, J. Recovery of anthocyanins from residues of Rubus fruticosus; Vaccinium myrtillus and Eugenia brasiliensis by ultrasound assisted extraction; pressurized liquid extraction and their combination. Food Chem. 2017, 231, 1–10. [Google Scholar] [CrossRef]
  40. Hashemi, S.M.B.; Michiels, J.; Asadi Yousefabad, S.H.; Hosseini, M. Kolkhoung (Pistacia khinjuk) kernel oil quality is affected by different parameters in pulsed ultrasound-assisted solvent extraction. Ind. Crops. Prod. 2015, 70, 28–33. [Google Scholar] [CrossRef]
  41. You, Q.; Yin, X.; Ji, C. Pulsed counter-current ultrasound-assisted extraction and characterization of polysaccharides from Boletus edulis. Carbohydr. Polym. 2014, 101, 379–385. [Google Scholar] [CrossRef]
  42. Pereira, D.T.V.; Tarone, A.G.; Cazarin, C.B.B.; Barbero, G.F.; Martínez, J. Pressurized liquid extraction of bioactive compounds from grape marc. J. Food Eng. 2019, 240, 105–113. [Google Scholar] [CrossRef]
  43. Barnes, J.S.; Nguyen, H.P.; Shen, S.; Schug, K.A. General method for extraction of blueberry anthocyanins and identification using high performance liquid chromatography-electrospray ionization-ion trap-time of flight-mass spectrometry. J. Chromatogr. A 2009, 1216, 4728–4735. [Google Scholar] [CrossRef] [PubMed]
  44. Cai, Z.; Qu, Z.; Lan, Y.; Zhao, S.; Ma, X.; Wan, Q.; Jing, P.; Li, P. Conventional; ultrasound-assisted; and accelerated-solvent extractions of anthocyanins from purple sweet potatoes. Food Chem. 2016, 197, 266–272. [Google Scholar] [CrossRef] [PubMed]
  45. Carrera, C.; Ruiz-Rodríguez, A.; Palma, M.; Barroso, C.G. Ultrasound assisted extraction of phenolic compounds from grapes. Anal. Chim. Acta 2012, 732, 100–104. [Google Scholar] [CrossRef]
  46. Espada-Bellido, E.; Ferreiro-González, M.; Barbero, G.F.; Carrera, C.; Palma, M.; Barroso, C.G. Alternative Extraction Method of Bioactive Compounds from Mulberry (Morus nigra L.) Pulp Using Pressurized-Liquid Extraction. Food Anal. Methods 2018, 11, 2384–2395. [Google Scholar] [CrossRef]
  47. Vázquez-Espinosa, M.; González de Peredo, A.V.; Ferreiro-González, M.; Palma, M.; Carrera, C.; Barroso, C.G.; Barbero, G.F. Optimization of Microwave-Assisted Extraction for the Recovery of Bioactive Compounds from the Chilean Superfruit (Aristotelia chilensis (Mol.) Stuntz). Agronomy 2018, 8, 240. [Google Scholar] [CrossRef] [Green Version]
  48. Barbero, G.F.; Liazid, A.; Palma, M.; Barroso, C.G. Ultrasound-assisted extraction of capsaicinoids from peppers. Talanta 2008, 75, 1332–1337. [Google Scholar] [CrossRef]
  49. Santos, D.T.; Veggi, P.C.; Meireles, M.A.A. Optimization and economic evaluation of pressurized liquid extraction of phenolic compounds from jabuticaba skins. J. Food Eng. 2012, 108, 444–452. [Google Scholar] [CrossRef] [Green Version]
  50. Türker, N.; Erdoǧdu, F. Effects of pH and temperature of extraction medium on effective diffusion coefficient of anthocynanin pigments of black carrot (Daucus carota var. L.). J. Food Eng. 2006, 76, 579–583. [Google Scholar] [CrossRef]
  51. Peron, D.V.; Fraga, S.; Antelo, F. Thermal degradation kinetics of anthocyanins extracted from juçara (Euterpe edulis Martius) and “Italia” grapes (Vitis vinifera L.); and the effect of heating on the antioxidant capacity. Food Chem. 2017, 232, 836–840. [Google Scholar] [CrossRef] [PubMed]
  52. Luque de Castro, M.D.; Priego-Capote, F. Ultrasound assistance to liquid-liquid extraction: A debatable analytical tool. Anal. Chim. Acta 2007, 583, 2–9. [Google Scholar] [CrossRef] [PubMed]
  53. AOAC (Ed.) AOAC Peer Verified Methods Program. In A International, Manual on Policies and Procedures; Maryland: Arlingt, VA, USA, 1998. [Google Scholar]
  54. Gironés-Vilaplana, A.; Calín-Sánchez, Á.; Moreno, D.A.; Carbonell-Barrachina, Á.A.; García-Viguera, C. Novel maqui liquor using traditional pacharán processing. Food Chem. 2015, 173, 1228–1235. [Google Scholar] [CrossRef] [PubMed]
Figure 1. Structures of the different anthocyanins present in the sloe samples.
Agronomy 10 00966 g001
Figure 2. Chromatogram of the anthocyanins identified in the sloe samples. Peak correspondence: (1) cyanidin 3-O-glucoside; (2) cyanidin 3-O-rutinoside; (3) peonidin 3-O-glucoside; (4) peonidin 3-O-rutinoside.
Agronomy 10 00966 g002
Figure 3. Pareto chart of the total phenolic compounds.
Agronomy 10 00966 g003
Figure 4. Three-dimensional surface plots representing the recovery of phenolic compounds according to a Box–Behnken design and depending on the following influential variables on the total phenolic compounds: (a) % methanol in water and pH; (b) % methanol in water and cycle; (c) pH and cycle.
Agronomy 10 00966 g004
Figure 5. Pareto chart for the total anthocyanins extracted from the sloe samples.
Agronomy 10 00966 g005
Figure 6. Three-dimensional surface plots representing the recovery of total anthocyanins according to a Box–Behnken design and depending on the following influential variables on the total anthocyanins: (a) % methanol in water and pH; (b) % methanol in water and ratio; (c) pH and ratio.
Agronomy 10 00966 g006
Figure 7. Optimal extraction time of anthocyanins and total phenolic compounds. Results are expressed as mg g−1 of fresh weight (FW). All results are expressed as means ± standard deviation (SD) (n = 3).
Agronomy 10 00966 g007
Figure 8. Total phenolic compounds (a) and total anthocyanins (b) extractions from sloes employed to elaborate “Pacharán” and from the “Pacharán” obtained at different months of maceration. Results are expressed as mg g−1 of fresh weight (FW) for sloes and mg L−1 for “Pacharán”. All results are expressed as means ± standard deviation (SD) (n = 3).
Agronomy 10 00966 g008
Figure 9. Extraction of anthocyanins and total phenolic compounds from different sloe jam types. Results are expressed as mg g−1 of fresh weight (FW) of jam. All results are expressed as means ± standard deviation (SD) (n = 3).
Agronomy 10 00966 g009
Table 1. Box–Behnken design matrix with measured and predicted responses.
RunFactorsResponses
X1X2X3X4X5X6Total Phenolic Compounds (mg g−1)Total Anthocyanins (mg g−1)
MeasuredPredictedMeasuredPredicted
100−10−1−12.39152.08920.26240.2569
20010−1−12.47832.05740.25670.2568
300−101−12.06422.53070.21280.23
400101−12.22772.64620.24220.2358
500−10−112.54012.00990.26030.2667
60010−112.18141.82660.25710.2398
700−10112.30142.61070.2660.2659
80010112.16072.57470.23940.2449
90−10−1−102.12962.85480.23970.2118
10010−1−101.49822.82170.20590.2172
110−101−101.90552.6850.17430.1791
120101−104.07973.92540.15110.1698
130−10−1104.5094.50330.20290.1772
14010−1104.29783.67830.1610.1631
150−101104.50153.0180.22970.2114
160101104.03173.46650.14780.1826
17−10−1−1002.1582.06630.19020.169
1810−1−1004.22153.38840.09270.1158
19−101−1001.7361.82180.12190.1179
20101−1004.45043.37370.09330.1077
21−10−11001.77372.32720.15090.143
2210−11002.1172.55450.09280.0904
23−1011001.96422.27420.14660.13
241011002.11642.73120.10560.1204
250−1−100−12.01091.85370.17580.1768
2601−100−12.05682.05240.15610.1596
270−1100−11.86451.88320.16710.1824
2801100−12.05392.10650.16110.1598
290−1−10011.79831.85740.19020.1915
3001−10011.95642.04940.2060.1907
310−110011.84271.73540.17350.1701
320110011.90671.95210.16490.164
33−1−100−101.5040.99920.12380.14
341−100−101.90791.80530.10110.1091
35−1100−101.91021.44510.15080.1446
361100−102.55992.56660.10920.1007
37−1−100101.91072.06410.11740.1329
381−100102.09672.72180.10090.1141
39−1100101.77551.71810.13280.1179
401100102.34662.69130.10920.0861
41−100−10−11.88861.58980.14020.1507
42100−10−12.59553.10480.1330.1246
43−10010−11.80572.0770.14190.1392
4410010−13.05022.49710.13680.1137
45−100−1011.69281.72280.13150.1611
46100−1012.83013.08190.12760.1239
47−1001011.93511.9490.15680.1587
481001012.43752.21320.12620.1222
490000001.93792.08190.12490.1472
500000002.13962.08190.15880.1472
510000002.15722.08190.14330.1472
520000001.89192.08190.12330.1472
530000002.32892.08190.18880.1472
540000002.03622.08190.14430.1472
Table 2. ANOVA for the response surface quadratic model for total phenolic compounds.
SourceCoefficientSum of SquaresDegrees of FreedomMean SquareF-Valuep-Value
Model2.0822.59270.83661.810.0677
MethanolX10.44484.7514.7510.260.0036
TemperatureX20.10380.258810.25880.55910.4613
AmplitudeX3−0.01700.006910.00690.01490.9038
CycleX4−0.09540.218410.21840.47180.4982
pHX50.29742.1212.124.590.0418
RatioX6−0.03770.034110.03410.07370.7882
Methanol × TemperatureX1X20.07890.049810.04980.10750.7456
Methanol × AmplitudeX1X30.05750.026410.02640.05710.813
Methanol × CycleX1X4−0.27371.211.22.590.1196
Methanol × pHX1X5−0.03710.01110.0110.02370.8787
Methanol × RatioX1X6−0.03900.012110.01210.02620.8726
Temperature × AmplitudeX2X30.00620.000310.00030.00070.9797
Temperature × CycleX2X40.31840.810910.81091.750.1971
Temperature × pHX2X5−0.19800.62710.6271.350.255
Temperature × RatioX2X6−0.001601000.9946
Amplitude × CycleX3X40.04790.018310.01830.03960.8438
Amplitude × pHX3X50.03680.010910.01090.02350.8795
Amplitude × RatioX3X6−0.03790.022910.02290.04950.8256
Cycle × pHX4X5−0.32890.865310.86531.870.1832
Cycle × RatioX4X6−0.06530.034110.03410.07360.7883
pH × RatioX5X60.03980.012710.01270.02740.8698
Methanol × MethanolX12−0.47242.312.34.960.0348
Temperature × Temperature X220.01750.003110.00310.00680.9349
Amplitude × AmplitudeX320.06230.039910.03990.08620.7714
Cycle × CycleX420.89538.2418.2417.810.0003
pH × pHX520.37441.4411.443.120.0893
Ratio × RatioX62−0.22540.522710.52271.130.2976
Residual 2.0812.03260.4628
Lack of Fit 0.444811.9210.566921.980.0014
Pure Error 0.10380.128950.0258
Total −0.017034.6253
Table 3. ANOVA for the response surface quadratic model for total anthocyanins.
SourceCoefficientSum of SquaresDegrees of FreedomMean SquareF-Valuep-Value
Model0.14720.1163270.00438.83<0.0001
MethanolX1−0.01570.005910.005912.090.0018
TemperatureX2−0.00590.000810.00081.680.2057
AmplitudeX3−0.00530.000710.00071.370.252
CycleX4−0.00330.000310.00030.53810.4698
pHX5−0.00540.000710.00071.450.2395
RatioX60.00470.000510.00051.10.3044
Methanol × TemperatureX1X2−0.00330.000110.00010.17310.6808
Methanol × AmplitudeX1X30.01080.000910.00091.890.1805
Methanol × CycleX1X40.00013.60E-0713.60E-070.00070.9785
Methanol × pHX1X50.0030.000110.00010.150.7017
Methanol × RatioX1X6−0.00280.000110.00010.12620.7253
Temperature × AmplitudeX2X3−0.00130100.02930.8654
Temperature × CycleX2X4−0.00370.000110.00010.22130.642
Temperature × pHX2X5−0.00490.000410.00040.78290.3844
Temperature × RatioX2X60.00410.000110.00010.27720.603
Amplitude × CycleX3X40.00950.000710.00071.490.2337
Amplitude × pHX3X50.00150100.03510.8529
Amplitude × RatioX3X6−0.00670.000710.00071.480.2343
Cycle × pHX4X50.01670.002210.00224.580.0418
Cycle × RatioX4X60.00230100.08670.7708
pH × RatioX5X60.00650.000310.00030.69510.412
Methanol × MethanolX12−0.05660.032910.032967.42<0.0001
Temperature × Temperature X22−0.02390.005910.005912.030.0018
Amplitude × AmplitudeX320.01920.003810.00387.810.0096
Cycle × CycleX420.01430.002110.00214.330.0475
pH × pHX520.05140.027210.027255.62<0.0001
Ratio × RatioX620.03180.010410.010421.24<0.0001
Residual 0.14720.0127260.0005
Lack of Fit −0.01570.0097210.00050.78380.6888
Pure Error −0.00590.00350.0006
Total −0.00530.12953

