Article

Modeling Climate Warming Impacts on Grain and Forage Sorghum Yields in Argentina

1
Cátedra de Forrajicultura, Departamento de Producción Animal, Facultad de Agronomía, Universidad de Buenos Aires. Av. San Martín 4453, Buenos Aires CP 1417, Argentina
2
U.S. Department of Agriculture-Agricultural Research Service (USDA-ARS), Grassland, Soil and Water Research Laboratory, 808 East Blackland Rd., Temple, TX 76502, USA
3
Facultad de Ciencias Agrarias, Universidad Nacional de Lomas de Zamora, Ruta 4, Km 2, Lavallol, Buenos Aires CP 1836, Argentina
4
Oak Ridge Institute for Science and Education, 808 East Blackland Rd., Temple, TX 76502, USA
5
Texas AgriLife Research, Blackland Research and Extension Center, 720 East Blackland Road, Temple, TX 76502, USA
*
Author to whom correspondence should be addressed.
Agronomy 2020, 10(7), 964; https://doi.org/10.3390/agronomy10070964
Submission received: 26 May 2020 / Revised: 26 June 2020 / Accepted: 30 June 2020 / Published: 4 July 2020

Abstract

:
Sorghum is the world’s fifth major cereal in terms of production and acreage. It is expected that its growth will be affected by the increase in air temperature, an important component of global climate change. Our objective was to use the Agricultural Land Management Alternatives with Numerical Assessment Criteria (ALMANAC) model to (a) evaluate the impact of climate warming on forage and grain sorghum production in Argentina and (b) to analyze to what extent yield changes were associated with changes in water or nitrogen stress days. For model calibration, we used previous information related to the morpho-physiological characteristics of both sorghum types and several soil parameters. We then used multiyear field data of sorghum yields for model validation. Yield simulations were conducted under three possible climate change scenarios: 1, 2, and 4 °C increase in mean annual temperature. ALMANAC successfully simulated mean yields of forage and grain sorghum: root mean square error (RMSE): 2.6 and 1.0 Mg ha−1, respectively. Forage yield increased 0.53 Mg ha−1, and grain yield decreased 0.27 Mg ha−1 for each degree of increase in mean annual temperature. Yields of forage sorghum tended to be negatively associated with nitrogen stress (r = −0.94), while grain sorghum yield was negatively associated with water stress (r = −0.99). The information generated allows anticipating future changes in crop management and genetic improvement programs in order to reduce the yield vulnerability.

1. Introduction

Sorghum [Sorghum bicolor (L.) Moench] is the fifth most important cereal crop globally in terms of production and acreage [1]. This annual C4 species is mainly used as food and fodder, and is quickly emerging as a biofuel crop [2,3,4,5]. In recent years, it has received special interest, with novel uses such as the production of bio-industrial products (e.g., bioplastics), gluten-free products for coeliacs, and beverages [6]. Sorghum is more adapted to high temperatures (maintains its grain yield even up to 33 °C) and water stress than most other cereal crops [7,8] allowing for growth in a wider range of ecological conditions. However, there are differences within genotypes, with forage sorghum being more stress-tolerant than grain sorghum. Forage sorghums possess higher water use efficiency and are not dependent on adequate water at critical reproductive growth stages, as is grain sorghum for grain production [7,9]. Additionally, forage sorghums are able to synthesize higher levels of heat-shock proteins than grain genotypes, which allow them to maintain growth at high temperatures [10].
Earth’s near-surface temperatures and water availability are expected to change in the coming decades [11,12]. By mid-21st century, temperatures are predicted to increase about 3–5 °C, depending on the greenhouse gas emission pathway, while precipitation patterns are predicted to shift [12,13,14]. As a consequence of these changes in climatic conditions, it is expected that plant productivity will decrease or increase, depending on the sensitivity of the soil–plant–climate system, which would be indicative of the degree of vulnerability [15]. It is expected that these climate variations will not be homogeneous in all continents, with spatial heterogeneity mainly associated with latitude [16]. In addition, the response of plant productivity to these variations depends on species identity and other factors, such as edaphic properties (e.g., soil texture and available water capacity) [17,18,19]. Therefore, to understand how climate change will affect plant productivity, it is necessary to independently carry out assessments of the species of interest in different world regions.
Several studies have assessed the impact of climate change on sorghum production in Africa, South Asia, Oceania, and North America [7,20,21,22,23,24,25,26]. Except for Pembleton et al. [22], the studies focused on grain sorghum, so knowledge about the effect of global warming on forage sorghum is scarce. Surprisingly, South America has received much less attention, although sorghum is a species of interest in many countries on this continent. For example, Argentina ranks second after the USA in global sorghum exports, with 37% of the annual production destined to Mexico, Japan, and Colombia [27]. According to regional climate models, in the Pampas region of Argentina (where sorghum production is concentrated) the expected average temperature will increase between 1 and 3 °C (for the periods 2016–2035 and 2021–2020, respectively), while the average annual rainfall will remain constant [16,28]. The stability in average precipitation does not exclude the possibility of changes in water availability for plant growth, considering the effect of temperatures on evapotranspiration [29]. Therefore, climate warming could generate more heat stress and more water stress. Additionally, the increase in mean temperature could alter plant growth through the control of the biomass accumulation rate, the duration of growth, pollen viability and seed setting, and its effect on mineralization rates of organic matter [30,31,32].
Crop growth simulation models that integrate the soil–plant–atmosphere complex are increasingly used to predict the consequences of climate change on various crops species. The Agricultural Land Management Alternatives with Numerical Assessment Criteria (ALMANAC) model was designed to simulate the growth of a wide range of plant species [33], including different sorghum types. It has a versatile database infrastructure that combines soils, climate, and plant growth characteristics, with management practices that can easily be adapted for various cropping systems and growing conditions [34]. It comprises simulations of water and nutrient balance, the interception of solar radiation, and the sharing of the same components with the models Soil and Water Assessment Tool (SWAT) [35] and Agricultural Production Systems Simulator (APSIM) [36]. The SORKAM model (SORghum, Kansas, A&M) [37] is also a useful tool for sorghum growth simulations, and has had very satisfactory results [38,39]. However, ALMANAC has shown a better fit in sorghum yield simulations [40], and has already been implemented to evaluate the impact of climate change on growth of wheat and C4 perennial grasses [41,42,43]. The objectives of this study were to use the ALMANAC model to (a) evaluate the impact of climate warming on forage and grain sorghum production in Argentina, and (b) to analyze to what extent yield changes were associated with changes in water or nitrogen stress days. Considering that the studies carried out on forage sorghum worldwide, and on both types of sorghum in South America are scarce, the information generated in this study will improve our understanding of the impact of global warming on this crop. Additionally, it is the first time that this impact has been evaluated in forage and grain sorghum simultaneously and in the same environment, allowing for an adequate analysis of the sensitivity of each genotype to increased temperature.

2. Materials and Methods

2.1. Study Area and Plant Material

The study was conducted on an experimental field located near Cañuelas, in the Pampas region, Argentina (34°49′54″ S, 58°43′20″ W). The mean annual precipitation at the site is 1054 mm year−1 concentrated in the spring and summer, and mean annual temperature is 17 °C (average from 1990 to 2018). The soil is classified as a typical Argiudoll [44], with 23.5% of clay, 57.9% of silt, and 18.6% of sand (silt loam soil). It has 3.3% organic matter and a pH of 6.1.
We used seven years of forage sorghum yields and five years of grain sorghum yields. The data were obtained from an evaluation network for genetic material managed by the University of Lomas de Zamora, Argentina. Table 1 details the climatic variables of each year and the number of hybrids evaluated.

2.2. ALMANAC Model Description

ALMANAC model was used for yield simulations. The model simulates a wide range of plant species under diverse soil and weather scenarios, and under a variety of land management options (tillage, harvest height, nutrient management, irrigation, and grazing) [45]. It simulates water and nutrient balance, and daily plant growth through leaf area index (LAI), light interception, and radiation use efficiency (RUE). Light fraction interception by the canopy is estimated using Beer’s law [46] and LAI:
Fraction = 1.0 exp ( k × LAI )
LAI development through the season is simulated with an S-curve through the origin, which describes how potential LAI can increase as a function of heat units. In this model, nutrient deficiency, drought, or temperature stress reduce LAI and biomass growth. Plant biomass is simulated with RUE and grain yield with a harvest index approach, sensitive to water stress. Grain yield is simulated based on harvest index (HI), which is the grain yield as a fraction of the total aboveground dry matter at maturity.

2.3. ALMANAC Input Datasets for Model Calibration

2.3.1. Forage and Grain Sorghum Parameters

The extinction coefficient (k) was 0.55 for forage sorghum and 0.53 for grain sorghum. A higher value of this coefficient indicates that more light is intercepted at a given LAI. The sums of degree days from planting to maturity were 1400 for forage sorghum and 1500 for grain sorghum. Base and optimum temperatures for forage sorghum were 10 and 27.5 °C, and for grain sorghum were 8 and 30 °C, respectively. Both the base and optimum temperatures for grain and forage sorghum applied in this study are within the ranges reported for sorghum species/genotypes in the literature [47,48,49,50]. Biomass growth is simulated by the model with a RUE approach [51]. Energy to biomass conversion factor was 45 kg ha−1 per MJ m−2 for forage and 41 kg ha−1 per MJ m−2 for grain sorghum. Regarding the harvest index (economic yield divided by above ground biomass), we used a value of 0.90 for forage and 0.45 for grain sorghum. Thus, the economic yield of forage sorghum is the above ground biomass (leaves, stems, and panicles), and the economic yield of grain sorghum is just the grain.

2.3.2. Soil Parameters and Crop Management
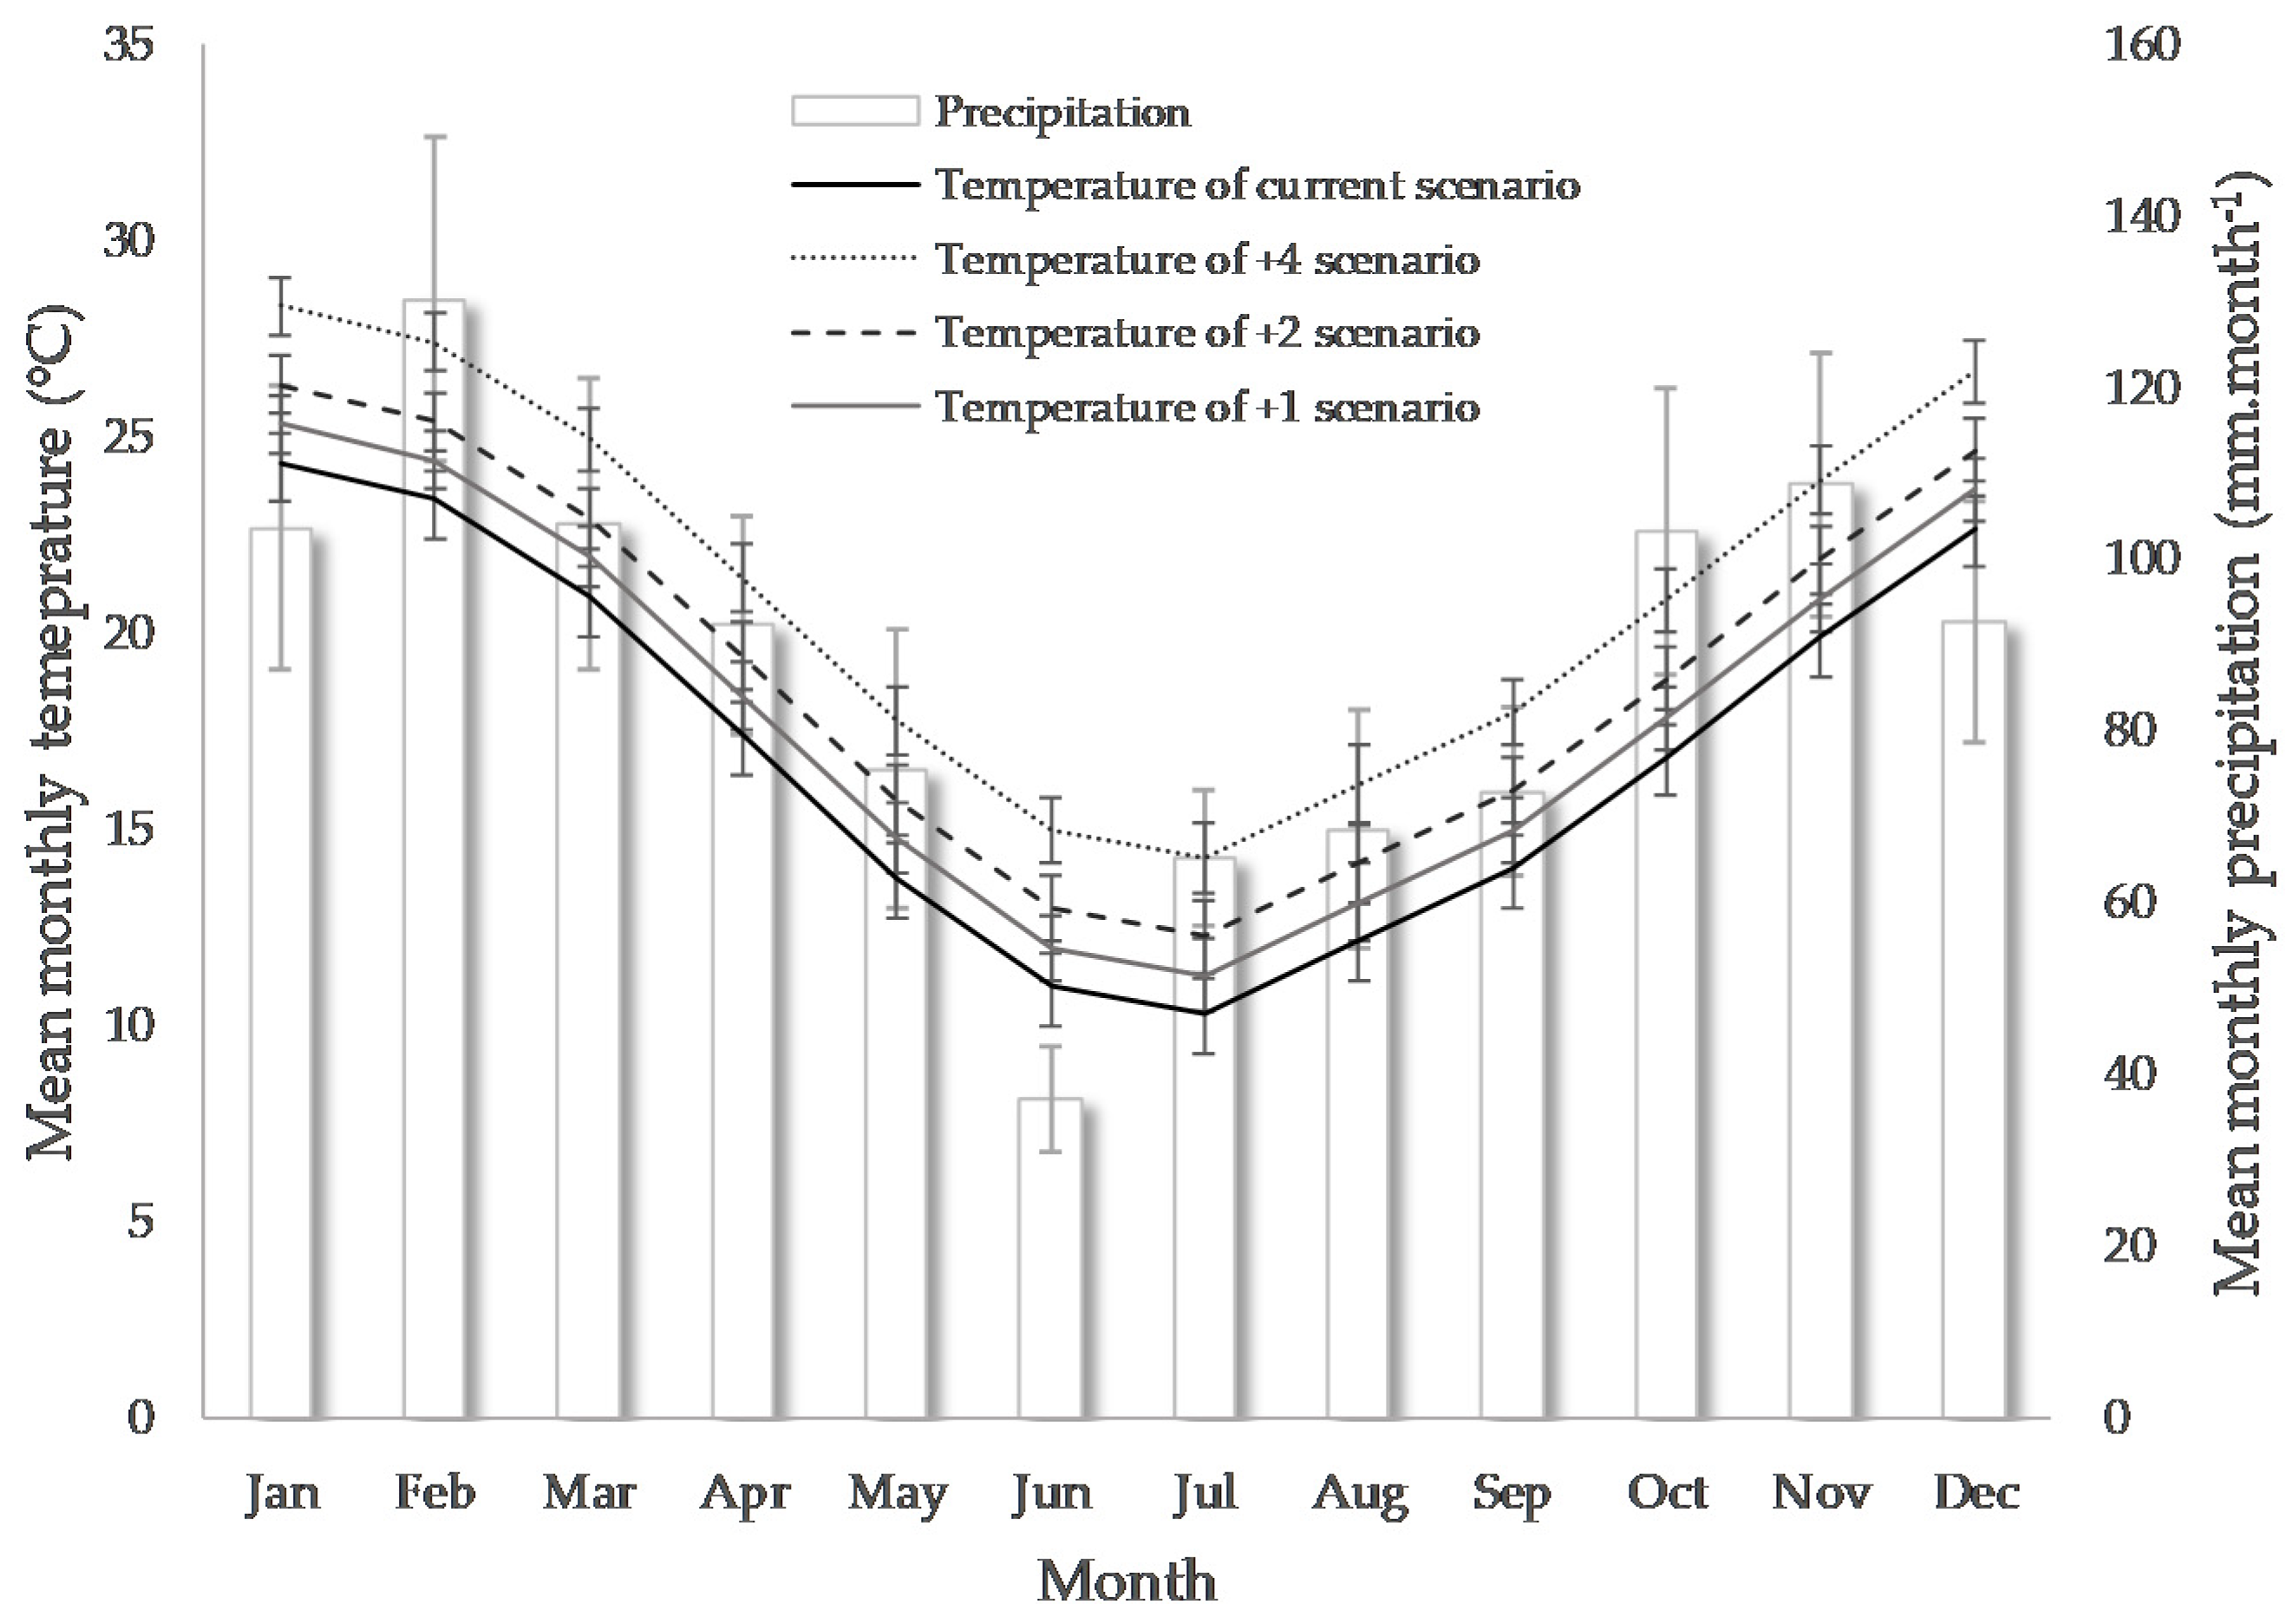
Several soil properties were used from the field site, including depth of each layer, water holding capacity, texture, pH, slope, and N and P availability. The water and nutrient balance subroutines are from the Erosion Productivity Impact Calculator (EPIC) model [52]. Some soil properties, management practices, and inputs (e.g., planting and harvest dates, planting density, row spacing, and amount and dates of N and P fertilization) were determined according to the trials from 2008 to 2015 (Table 2, Table 3 and Table 4).
Soil organic carbon variations could be related to different root biomass and residues returned to the soil associated with the crop yields of previous years that varied inter-annually as a consequence of variations in temperature and precipitation [53].

2.3.3. Weather Data

Meteorological data included the daily maximum and minimum air temperature; precipitation and wind speed, obtained from the nearest meteorological station (Argentine National Meteorological Service); and daily incident radiation, obtained from NASA Prediction of Worldwide Energy Resource method (http://power.larc.nasa.gov/). Potential evapotranspiration was estimated by the model through Penman–Monteith method [54].
To make projections for climate change scenarios using ALMANAC, “future weather” databases were created and added to the ALMANAC interface. In this study, three climate change scenarios were analyzed: 1, 2, and 4 °C increases in annual surface air temperature, with no change in annual mean precipitation. We decided to use these three scenarios because they are within the projections made for the Pampas region of Argentina, in response to increased greenhouse gas concentrations for the near-term (2016–2035) and for the long-term (2081–2100) [16,28]. Climate change impact scenarios were constructed by applying changes in mean meteorological variables to historical weather data [55]. Thus, for the future weather databases creation, we increased by 1, 2, and 4 °C the mean daily temperature of 19 years (1999–2018) (Figure 1).

2.4. Model Validation

For the validation process, we used the average yields of all hybrids of each sorghum type. Model performance was assessed through comparing means and coefficients of variation of measured and simulated yields. We also analyzed the root mean square error (RMSE), the mean bias error (MBE), and the mean absolute error (MAE). Following Fox [56], these indices take the form
RMSE = [ N 1   i = 1 N ( y i x i ) 2 ] 0.5
MBE = N 1   i = 1 N y i     x i
and
MAE = N 1   i = 1 N | y i x i |
where N is the number of cases, yi the simulated yield, and xi the measure yield. Both RMSE and MAE express average model prediction error in units of the variable of interest. These metrics can range from 0 to ∞ and are indifferent to the direction of errors. Lower values of these metrics indicate better model performance. MBE indicates whether the model generates overestimation (positive values) or underestimation (negative values) of the simulated yields.

2.5. Statistical Analysis

One-way analysis of variance (ANOVA) was used to compare sorghum yield under different increases in mean annual temperature. In the cases when ANOVA identified significant effects (i.e., p < 0.05), means were compared using Tukey test. The relationship between sorghum yield and days of water and nitrogen stresses was analyzed using the Pearson correlation coefficient (r). ANOVA’s and correlation analysis were performed using InfoStat software [57]. Slope analyzes were performed to compare the regressions between yield and water and nitrogen stress days, using the GraphPad Prism software.

3. Results

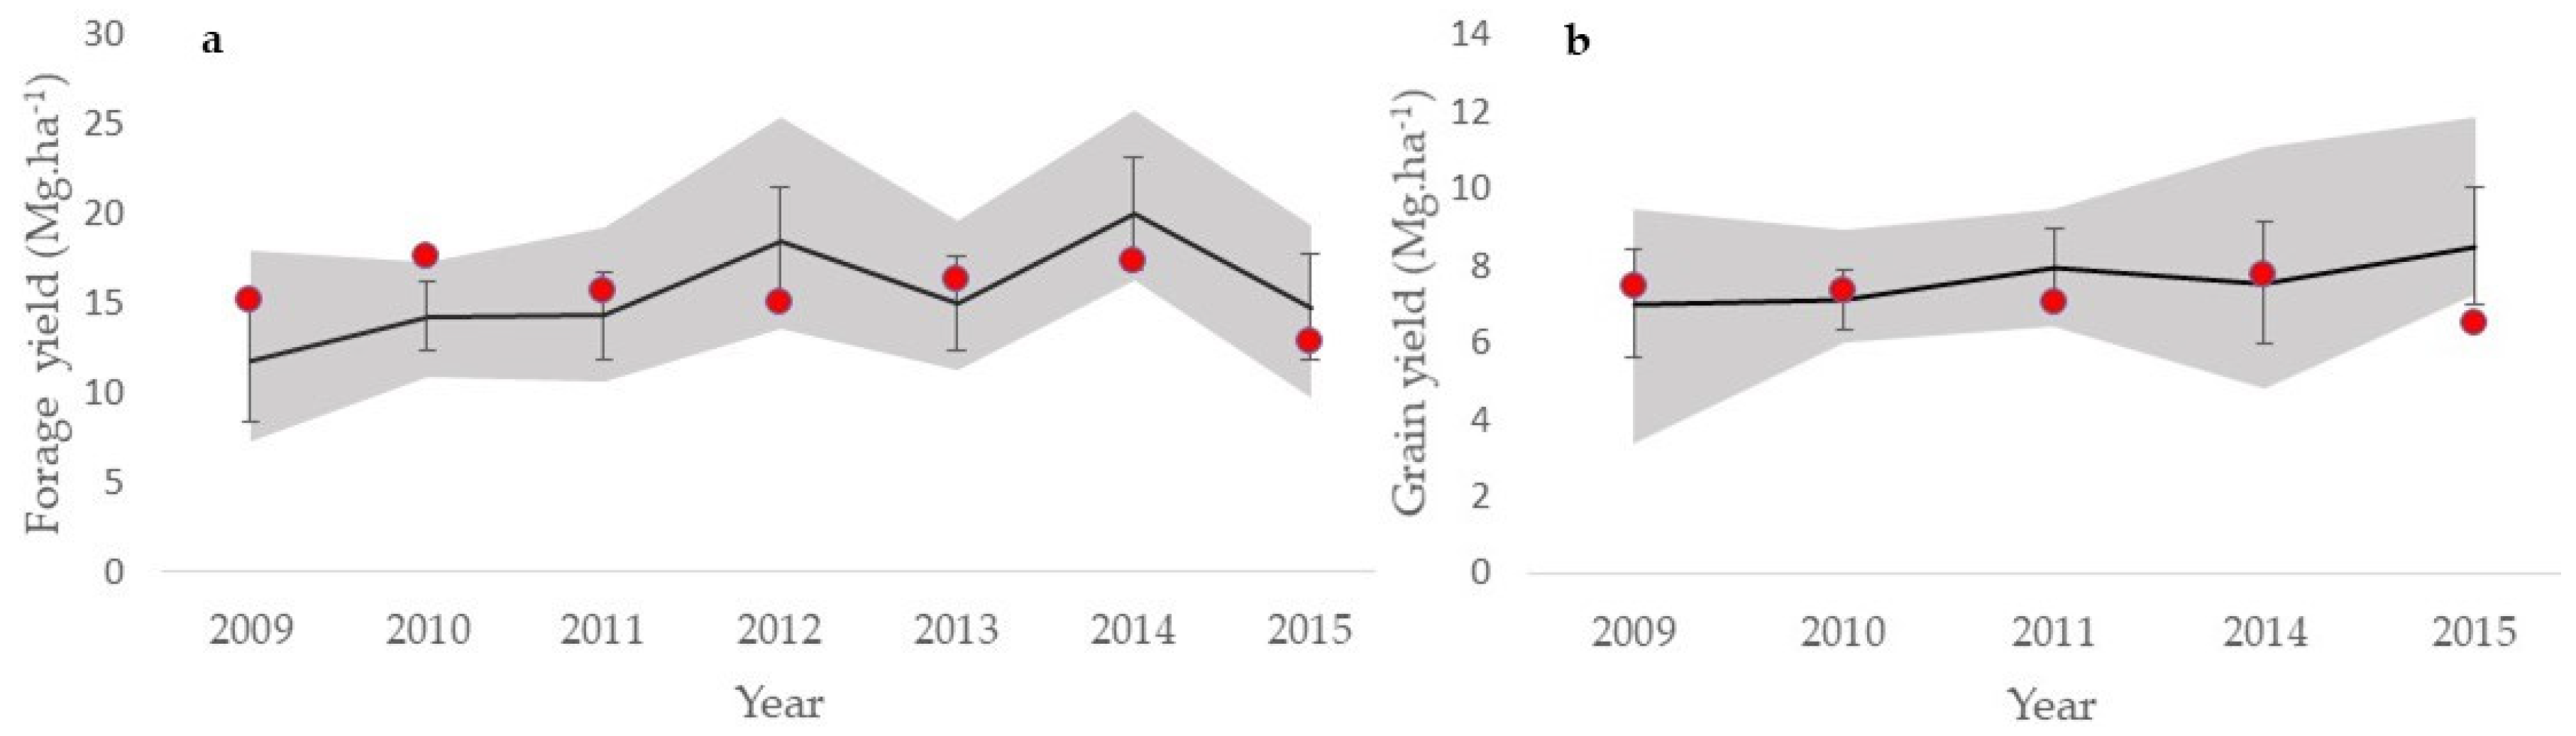
3.1. Model Validation

Considering the overall mean, the model achieved a successful simulation, with similar means and coefficients of variation between the simulated and measured values in both sorghum types (Table 5). The measures used to evaluate the model’s performances demonstrate a better fit in forage sorghum than in grain sorghum simulations. In view of the average bias of each model (MBE), a small overestimation in the simulated yields of forage sorghum and an underestimation of grain sorghum is detected.
Considering the inter-annual variability, most of the simulated yields were found within one standard deviation and within the measured yield range considering all the hybrids (86% and 80% of the years evaluated in forage and grain sorghum, respectively) (Figure 2).

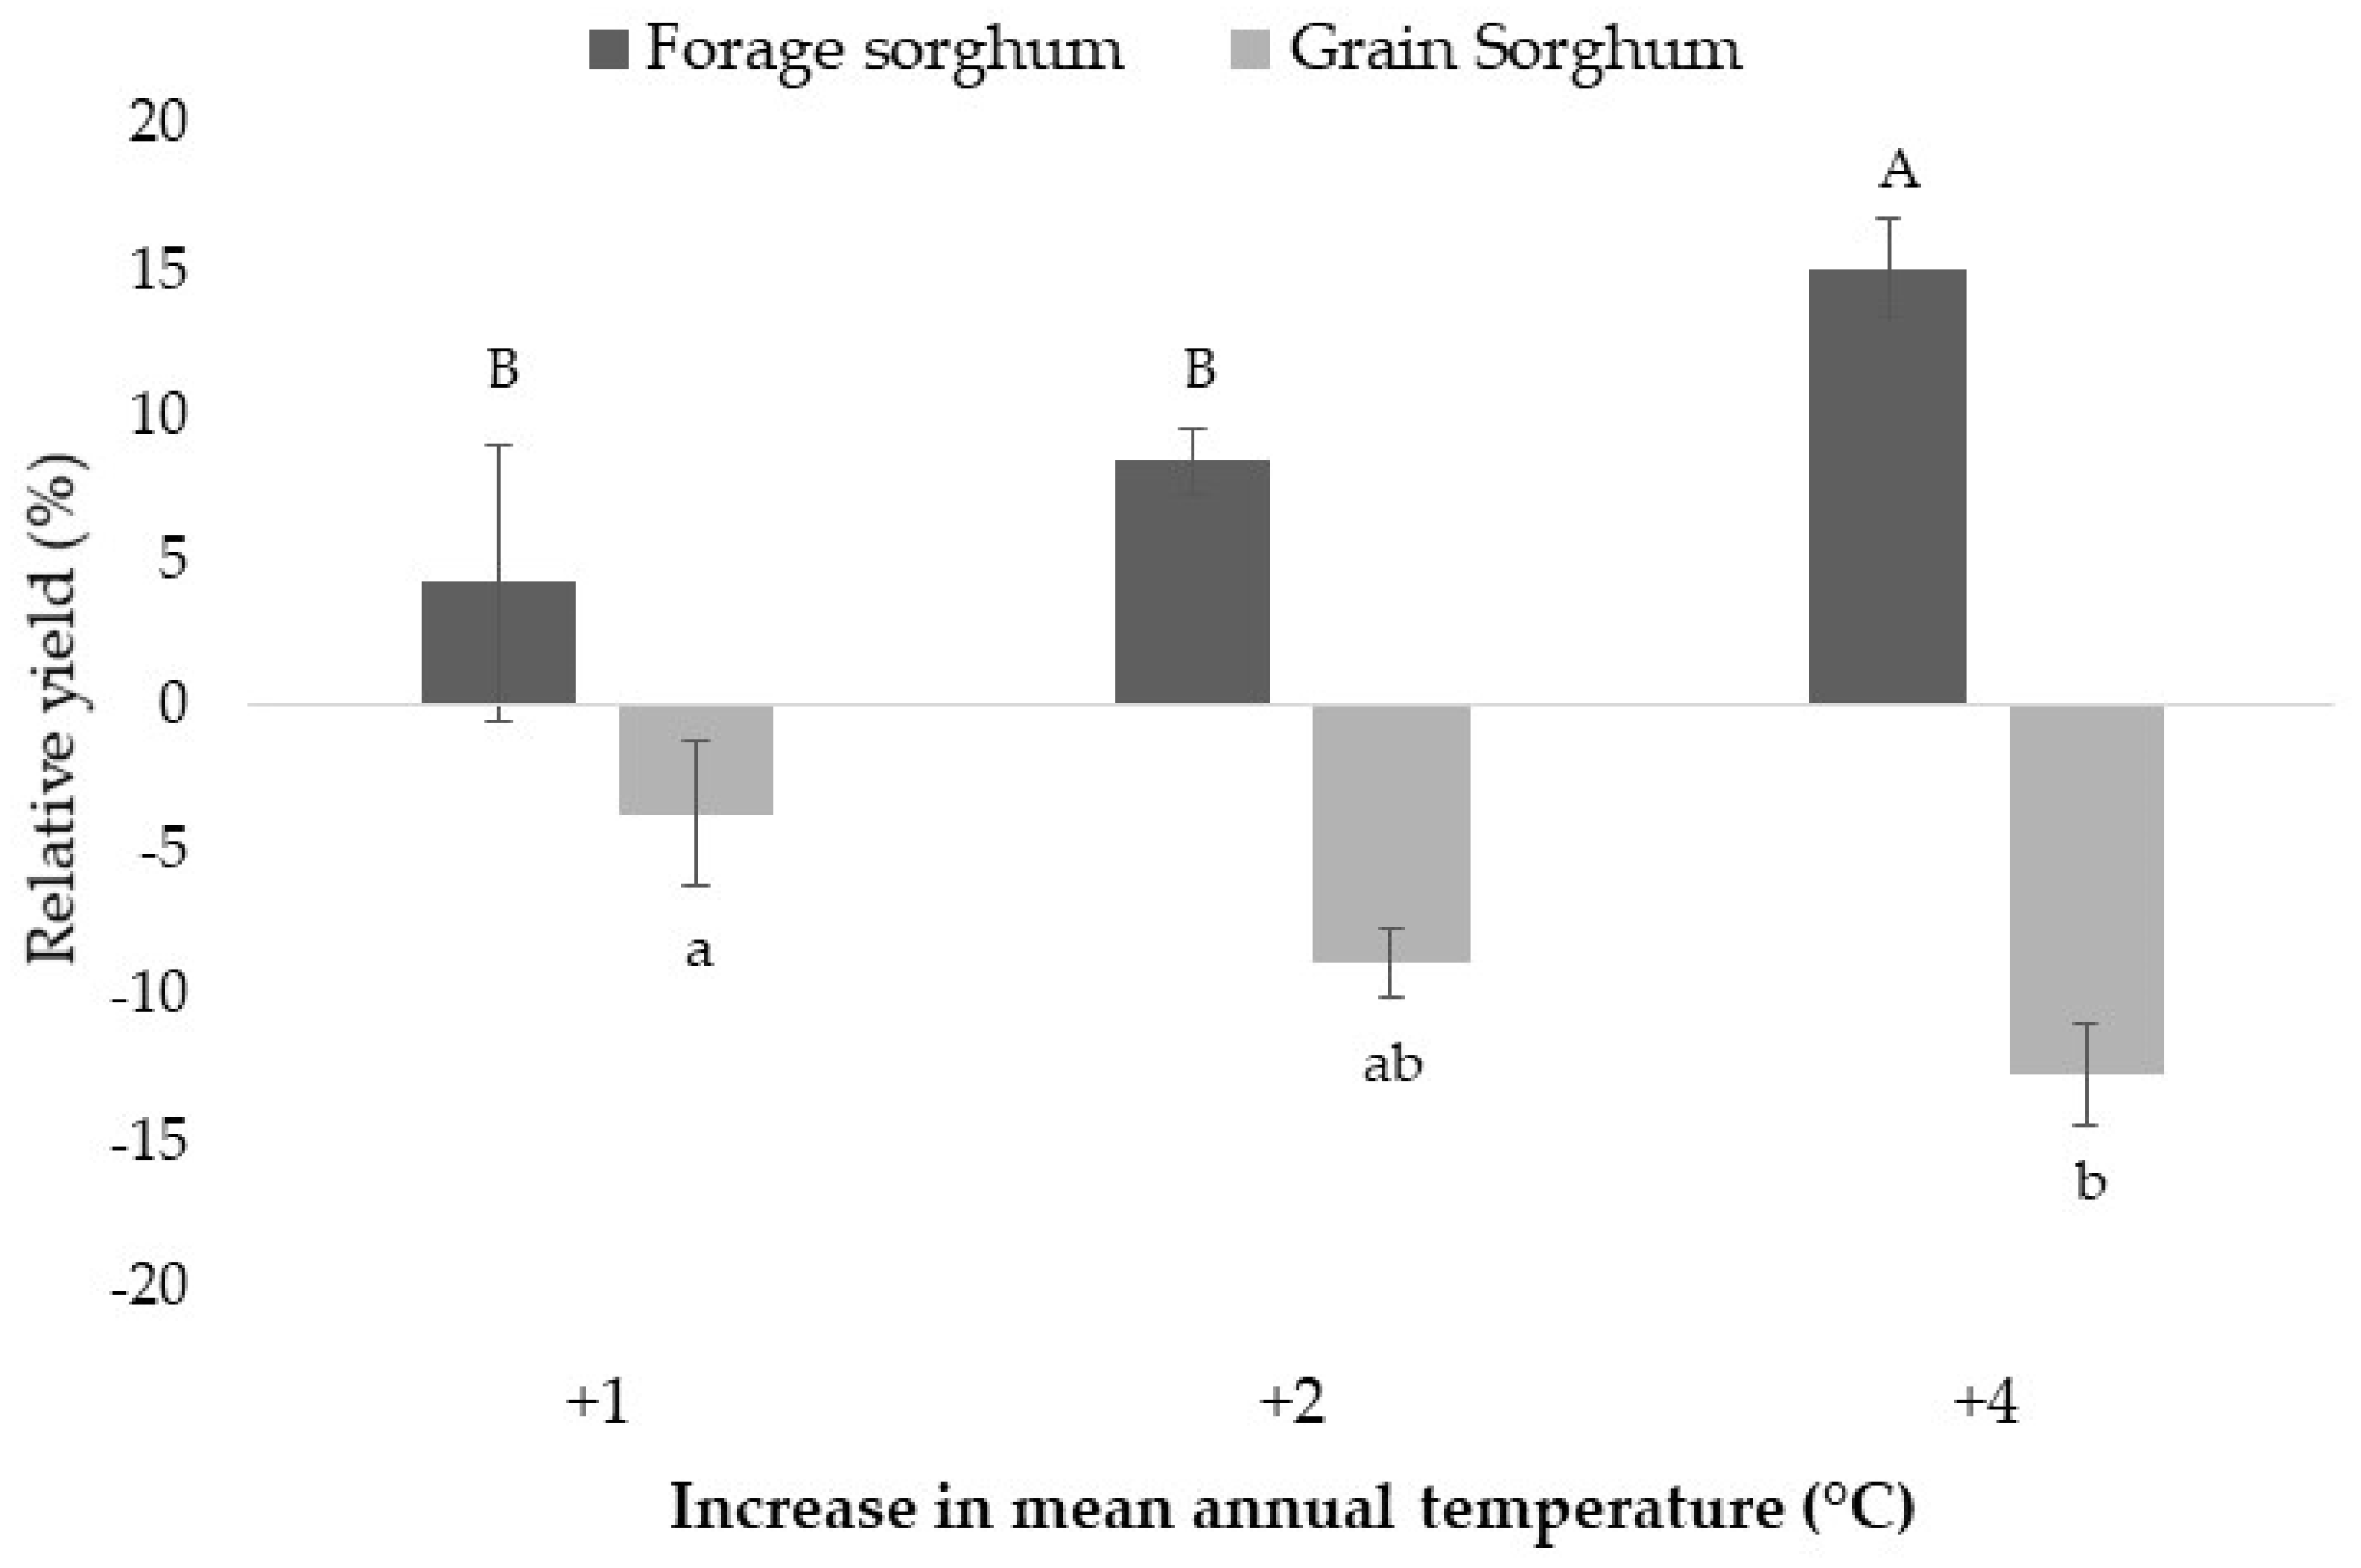
3.2. Forage and Grain Sorghum Yields under Different Warming Scenarios

The increase in mean annual temperature impacted differentially in both forage and grain sorghum yields (Figure 3). Forage sorghum had its highest yield in the warmest scenario, increasing by 15% in relation to the current scenario (17.1 vs. 14.9 Mg ha−1, respectively). The linear regression equation considering both variables (yields and mean annual temperature) shows an increase in forage yield of 0.53 Mg ha−1 for each degree of increase in mean annual temperature (y = 0.53x + 15.06; r2 = 0.9921). Conversely, the yield of grain sorghum was negatively affected, with reductions of 3.4, 8.5, and 12.4% in the scenarios of 1, 2, and 4 °C of increase in mean annual temperature, respectively. In this case, the regression between both variables shows that the grain yield decreases 0.27 Mg ha−1 for each degree of increase in mean annual temperature (y = −0.27x + 9.36; r2 = 0.9998).

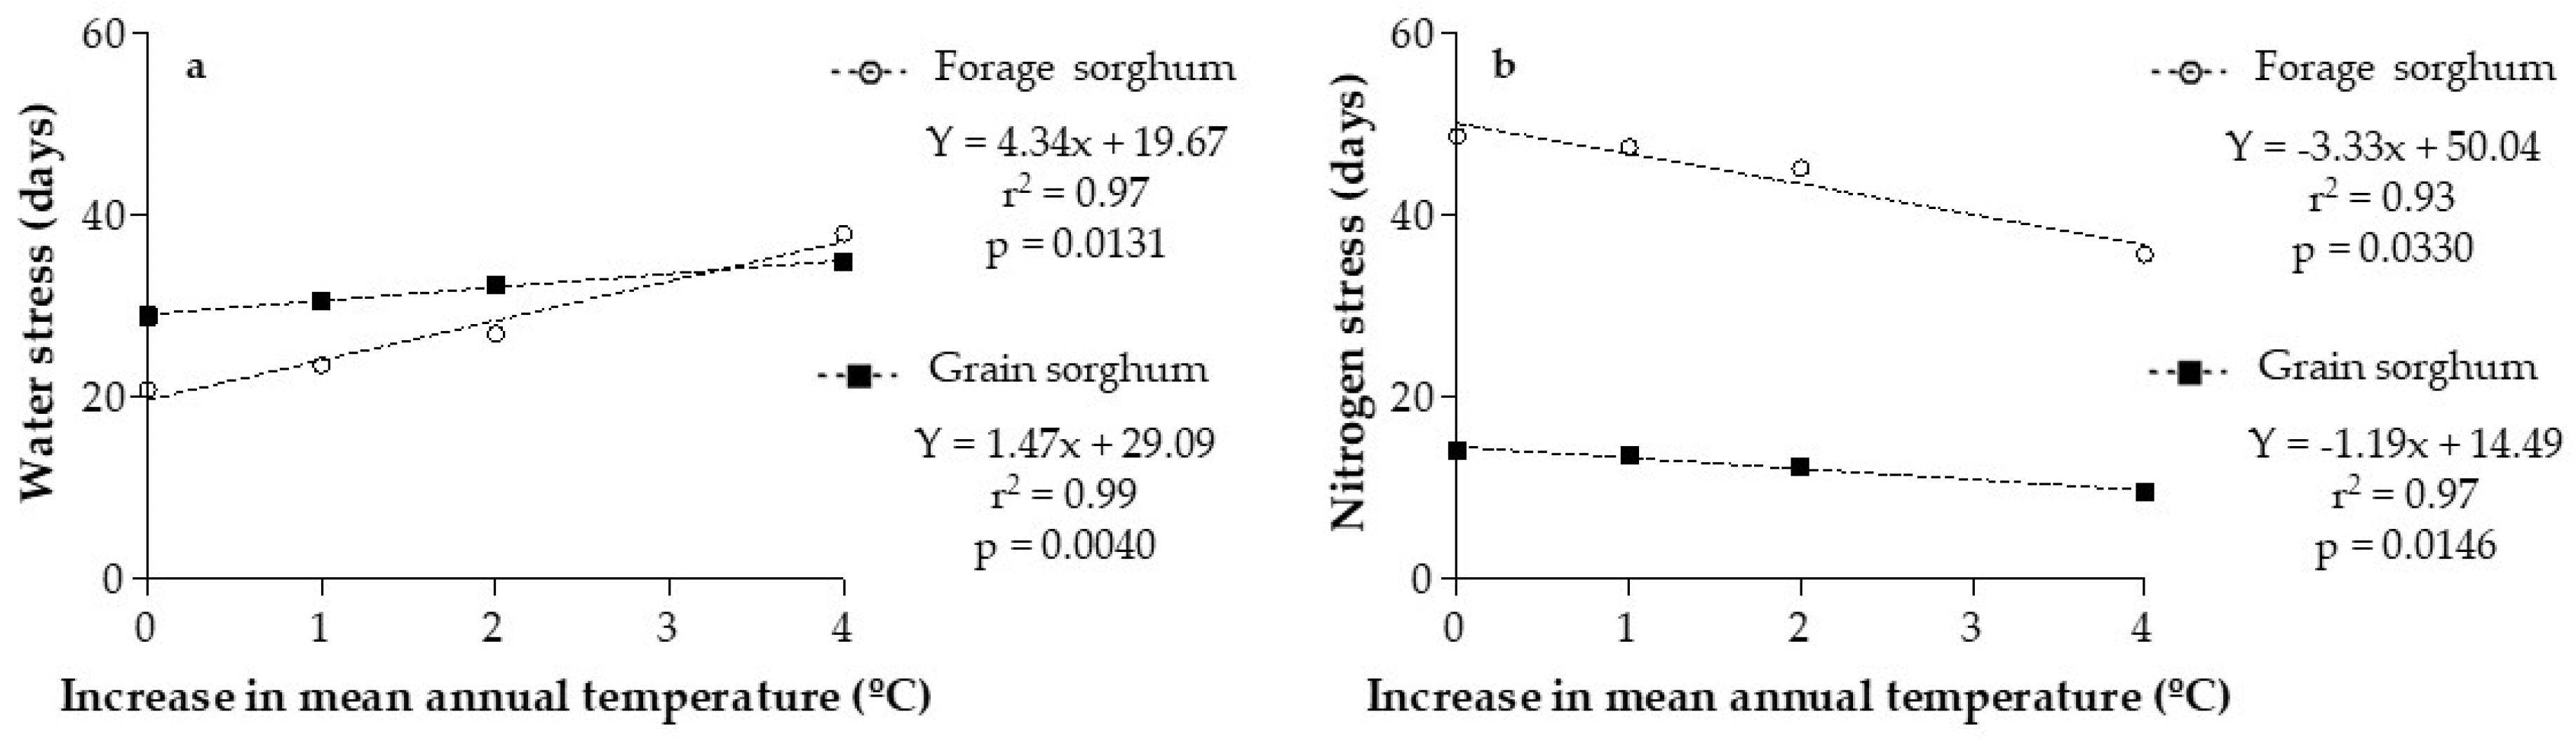
3.3. Correlation Analysis between Yields and Days of Water and Nitrogen Stress

Correlation analyses demonstrate that forage and grain sorghum yields are determined by different types of stress (Table 6). In the case of forage sorghum, yield tended to be negatively associated with days when plant growth was limited by nitrogen. In contrast, grain sorghum yield was negatively associated with the days when growth was limited by water stress. In both cases, the days of water and nitrogen stresses were significantly and negatively correlated.
The increase in the mean annual temperature generates an increase in the days in which the plants limited their growth due to water stress in both types of sorghum (Figure 4a). A linear regression showed that the slope in the case of forage sorghum is significantly greater than grain sorghum (p = 0.0049), but with a lower intercept. Conversely, the days when sorghum plants were affected by nitrogen stress decreased as the mean annual temperature increased (Figure 4b). In this case, the slopes were also significantly different, being higher in the case of forage sorghum in relation to grain sorghum (p = 0.0283), with a higher intercept.

4. Discussion

The ALMANAC model realistically simulated yields of forage and grain sorghum, achieving means and coefficients of variation similar to the measured yields. Figure 2 demonstrates that the model was able to capture interannual climate variability, since for the majority of the years the simulated yields were within the range of measured yields of all hybrids evaluated and within one standard deviation of their average. This, added to the acceptable values obtained in the statistical parameters used to validate the model, demonstrate that it is adequate to predict not only long-term means but also to predict reasonable variability around the means [58]. Previous studies demonstrated the effectiveness of the ALMANAC model in estimating the yield of grain sorghum in diverse Texas environments [40,59]. Our results demonstrate that the model was also successful in an environment with different soil and weather characteristics, not only to estimate the yield of grain but also forage sorghum. This satisfactory fit between simulated and measured yields is key to this study, where the model is used to predict changes in forage and grain sorghum yields under different climate change scenarios of increases in annual mean temperature. The information generated in this study shows that forage and grain sorghum yields responded differentially to climate warming and were impacted by different types of stress. These differences can be explained through the morphophysiological traits of both types of sorghum.
Forage sorghum yield increased by 0.53 Mg ha−1 for each degree increase in mean annual temperature, reaching the highest yield of 17.1 Mg ha−1 at the warmest scenario. This represents an increase of 15% in relation to the yield obtained in the current scenario. Our result agrees with those published by Pembleton et al. [22], who reported increases of up to 14% in 4 °C increase in mean annual temperature scenario without changes in annual precipitation. Forage sorghum has greater tolerance to water and heat stresses [7,9,10], and higher base temperature and leaf area than grain sorghum. Therefore, despite decreases in soil water availability, increases in temperature accelerate the leaf area growth, increasing the nitrogen demand. This explains why nitrogen is the most limiting factor for forage yield (Table 6), and that yields increase with temperature since in warmer scenarios the availability of this nutrient increases due to the higher mineralization rates [31].
Conversely, grain sorghum was negatively affected by climate warming, reducing its yield by 0.27 Mg ha−1 for each degree increase in mean annual temperature. These results are also consistent with previous studies conducted in different types of environments [7,20,21,23,24,32], and can be explained through various mechanisms. On the one hand, temperature could directly affect yield, through (a) the shortening of the growth cycle due to a rapid accumulation of growing degree days [60]; and (b) plants are more exposed to heat stress, reducing photosynthesis rates during anthesis and grain filling, and pollen germination affecting its fertility [61,62]. In fact, the days with maximum temperatures above the optimum temperature increased by 31, 58, and 124% in scenarios of 1, 2, and 4 °C increase in mean annual temperature (data not shown). On the other hand, temperature can indirectly affect grain yield through an increase in evapotranspiration loss and a reduction in soil organic carbon which affects soil structure and available nutrients and water capacity [20,32,53]. Direct and indirect effects of temperature lead to a reduction of phenological phase duration, grain set, grain number and size, grain-filling duration, and hence yield [50]. Our results demonstrate that the lower water availability in the soil as a consequence of the increase in temperature was more limiting for grain yield than the nitrogen availability.
The simulations carried out in this study evaluated the impact of climate warming on sorghum yield under the current input levels, planting dates and densities, and hybrids. The information generated allows anticipating future changes in crop management and genetic improvement programs in order to reduce the yield vulnerability. For instance, breeding varieties where the crop phenology remains at current levels even as the temperature increases would avoid the reduction in grain yields [32]. The sowing dates should be reconsidered, with the aim of looking for those hybrids that expose the crop to the least number of days with water stress, mainly during the reproductive stages. In the case of forage sorghum, rates of N fertilization could be increased since N has a high impact on yield. Although the N availability is expected to increase due to the greater mineralization of organic matter, the application of N fertilization at intermediate doses would avoid negative soil balances [63]. However, it should be considered that this would entail more economic investment. This information can not only be useful for management decision-making in Argentina but also in other regions with similar projections of climate change, such as some regions of Australia [16]. It is important to highlight that the implications arising from this study should be interpreted with caution, considering the limitations of the model. A major limitation of this study is that it does not consider possible future variations in the frequency of extreme weather events and increases in air CO2 concentration [64,65]. Finally, the possibility of changes in the projections provided by current and/or future climate change models should be considered. For example, if changes in the amount of precipitation are predicted, the use of ALMANAC or other similar growth simulation models will be necessary to assess the impact on sorghum yield.

5. Conclusions

Our results demonstrate that the ALMANAC model can be considered as an appropriate tool to study the impact of climate warming on forage and grain sorghum yields. Its use in the Pampas Region of Argentina indicates that increases in mean annual temperature are projected to be positive for the forage yield and negative for the grain yield of sorghum. The variations detected in yields would not only be related to direct effects of temperature on plant growth, but also to indirect effects through changes in water and nitrogen availability [66]. The use of simulation models in different agroecosystems worldwide to assess the effect of climate change on diverse crops and then food and forage production generates valuable information to make management decisions. Among others, the sowing dates, planted area, genotypes used, fertilization rates, and objectives in the genetic improvement projects can be modified. A combination of these strategies could significantly buffer the impacts of climate warming, mainly in those crops with low tolerance to water and heat stress, such as grain sorghum, maize, rice, and wheat [67].

Author Contributions

Conceptualization, M.D, A.S.W., S.K., N.M., and J.R.K.; validation, M.D.; formal analysis, M.D.; data curation, M.D.; writing—original draft preparation, M.D.; writing—review and editing, M.D., A.S.W., M.T., S.K., N.M., and J.R.K. All authors have read and agreed to the published version of the manuscript.

Funding

This research was funded in part by an appointment to Agricultural Research Service administered by Oak Ridge Institute for Science and Education through interagency agreement between U.S. Department of Energy (DOE) and U.S. Department of Agriculture (USDA), Agricultural Research Service Agreement #60-3098-0-001. USDA is an Equal Opportunity Provider and Employer. Any use of trade, firm, or product names is for descriptive purposes only and does not imply endorsement by the U.S. Government.

Acknowledgments

We gratefully acknowledge the suggestions made by two reviewers to improve the manuscript.

Conflicts of Interest

The authors declare no conflict of interest.

References

  1. FAO. FAO Statistics Data Base (FAOSTAT) for 2018. 2019. Available online: Http://Faostat.Fao.Org (accessed on 10 February 2020).
  2. Alguacil, M.D.M.; Torres, M.; Torrecillas, E.; Diaz, G.; Roldan, A. Plant type differently promote the arbuscular mycorrhizal fungi biodiversity in the rhizosphere after revegetation of a degraded, semiarid land. Soil Biol. Biochem. 2011, 43, 167–173. [Google Scholar] [CrossRef]
  3. Hariprasanna, K.; Rakshit, S. Economic Importance of Sorghum; Springer: Cham, Switzerland, 2016; pp. 1–25. [Google Scholar]
  4. Sasaki, T.; Antonio, B.A. Sorghum in sequence. Nature 2009, 457, 547–548. [Google Scholar] [CrossRef] [PubMed]
  5. Torrecillas, M.G.; Bertoia, L.M.; Jorge Rey, L. Nitrogen Nutrition and Hybrid Type and Their Influence on Attributes That Determine Bioenergetic Aptitude of Sorghum. AgriScientia 2018, 35, 1–9. [Google Scholar] [CrossRef]
  6. Taylor, J.R.N.; Schober, T.J.; Bean, S.R. Novel food and non-food uses for sorghum and millets. J. Cereal Sci. 2006, 44, 252–271. [Google Scholar] [CrossRef]
  7. Tack, J.; Lingenfelser, J.; Jagadish, S.V.K. Disaggregating sorghum yield reductions under warming scenarios exposes narrow genetic diversity in US breeding programs. Proc. Natl. Acad. Sci. USA 2017, 114, 9296–9301. [Google Scholar] [CrossRef] [Green Version]
  8. Mundia, C.; Secchi, S.; Akamani, K.; Wang, G. A Regional Comparison of Factors Affecting Global Sorghum Production: The Case of North America, Asia and Africa’s Sahel. Sustainability 2019, 11, 2135. [Google Scholar] [CrossRef] [Green Version]
  9. Unger, P.W. Grain and Forage Sorghum Production with No-Tillage on Dryland. Agron. J. 1988, 80, 193–197. [Google Scholar] [CrossRef]
  10. Pavli, O.I.; Ghikas, D.V.; Katsiotis, A.; Skaracis, G.N. Differential Expression of Heat Shock Protein Genes in Sor-Ghum (Sorghum bicolor L.) Genotypes under Heat Stress. Aust. J. Crop Sci. 2011, 5, 511–515. [Google Scholar]
  11. Rogelj, J.; Elzen, M.D.; Höhne, N.; Fransen, T.; Fekete, H.; Winkler, H.; Schaeffer, R.; Sha, F.; Riahi, K.; Meinshausen, M. Paris Agreement climate proposals need a boost to keep warming well below 2 °C. Nature 2016, 534, 631–639. [Google Scholar] [CrossRef] [Green Version]
  12. IPCC. Special Report on Global Warming of 1.5 °C (SR1). 2018. Available online: http://www.ipcc.ch/report/sr15/ (accessed on 6 March 2020).
  13. Arnell, N.; Livermore, M.; Kovats, S.; Levy, P.; Nicholls, R.J.; Parry, M.; Gaffin, S. Climate and socio-economic scenarios for global-scale climate change impacts assessments: Characterising the SRES storylines. Glob. Environ. Chang. 2004, 14, 3–20. [Google Scholar] [CrossRef]
  14. Meehl, G.A.; Washington, W.M.; Collins, W.; Arblaster, J.M.; Hu, A.; Buja, L.E.; Strand, G.; Teng, H. How Much More Global Warming and Sea Level Rise? Science 2005, 307, 1769–1772. [Google Scholar] [CrossRef] [PubMed] [Green Version]
  15. Magrin, G.; Travasso, M.; Diaz, R.; Rodríguez, R. Vulnerability of the agricultural systems of Argentina to climate change. Clim. Res. 1997, 9, 31–36. [Google Scholar] [CrossRef]
  16. Collins, M.; Knutti, R.; Arblaster, J.; Dufresne, J.-L.; Fichefet, T.; Friedlingstein, P.; Gao, X.; Gutowski, W.J.; Johns, T.; Krinner, G.; et al. Long-Term Climate Change: Projections, Commitments and Irreversibility. In Climate Change 2013: The Physical Science Basis; Stocker, T.F., Qin, D., Plattner, G.-K., Tignor, M., Allen, S.K., Boschung, J., Nauels, A., Xia, Y., Bex, V., Midgley, P.M., Eds.; IPCC, Cambridge University Press: Cambridge, UK, 2013; pp. 1029–1136. [Google Scholar]
  17. Weng, E.; Luo, Y. Soil hydrological properties regulate grassland ecosystem responses to multifactor global change: A modeling analysis. J. Geophys. Res. Space Phys. 2008, 113. [Google Scholar] [CrossRef]
  18. Summers, D.M.; Bryan, B.A.; Crossman, N.D.; Meyer, W.S. Species Vulnerability to Climate Change: Impacts on Spatial Conservation Priorities and Species Representation. Glob. Chang. Biol. 2012, 18, 2335–2348. [Google Scholar] [CrossRef]
  19. Choudhary, S.; Guha, A.; Kholova, J.; Pandravada, A.; Messina, C.D.; Cooper, M.; Vadez, V.; Anand, P. Maize, sorghum, and pearl millet have highly contrasting species strategies to adapt to water stress and climate change-like conditions. Plant Sci. 2020, 295, 110297. [Google Scholar] [CrossRef] [PubMed]
  20. McCarthy, D.S.; Vlek, P.L.G. Impact of Climate Change on Sorghum Production under Different Nutrient and Crop Residue Management in Semi-Arid Region of Ghana: A Modeling Perspective. Afr. Crop Sci. J. 2012, 20, 243–259. [Google Scholar]
  21. Ramirez-Villegas, J.; Jarvis, A.; Läderach, P. Empirical approaches for assessing impacts of climate change on agriculture: The EcoCrop model and a case study with grain sorghum. Agric. For. Meteorol. 2013, 170, 67–78. [Google Scholar] [CrossRef]
  22. Pembleton, K.; Cullen, B.; Rawnsley, R.P.; Harrison, M.T.; Ramilan, T. Modelling the resilience of forage crop production to future climate change in the dairy regions of Southeastern Australia using APSIM. J. Agric. Sci. 2016, 154, 1131–1152. [Google Scholar] [CrossRef]
  23. Sandeep, V.M.; Rao, V.U.M.; Bapuji Rao, B.; Bharathi, G.; Pramod, P.; Santhibhushan Chowdary, P.; Patel, N.R.; Mukesh, P.; Vijaya Kumar, P. Impact of Climate Change on Sorghum Productivity in India and Its Adaptation Strategies. J. Agrometeorol. 2018, 20, 89–96. [Google Scholar]
  24. Amouzou, K.A.; Lamers, J.P.; Naab, J.B.; Borgemeister, C.; Vlek, P.L.; Becker, M. Climate change impact on water- and nitrogen-use efficiencies and yields of maize and sorghum in the northern Benin dry savanna, West Africa. Field Crops Res. 2019, 235, 104–117. [Google Scholar] [CrossRef]
  25. Eggen, M.; Ozdogan, M.; Zaitchik, B.F.; Ademe, D.; Foltz, J.; Simane, B. Vulnerability of sorghum production to extreme, sub-seasonal weather under climate change. Environ. Res. Lett. 2019, 14, 045005. [Google Scholar] [CrossRef]
  26. Huntington, T.; Cui, X.; Mishra, U.; Scown, C.D. Machine learning to predict biomass sorghum yields under future climate scenarios. Biofuels Bioprod. Biorefining 2020, 14, 566–577. [Google Scholar] [CrossRef]
  27. Pena, G.; Cavaglieri, L.R.; Chulze, S.N. Fusarium species and moniliformin occurrence in sorghum grains used as ingredient for animal feed in Argentina. J. Sci. Food Agric. 2018, 99, 47–54. [Google Scholar] [CrossRef] [PubMed] [Green Version]
  28. Barros, V.R.; Boninsegna, J.A.; Camilloni, I.A.; Chidiak, M.; Magrín, G.O.; Rusticucci, M. Climate change in Argentina: Trends, projections, impacts and adaptation. Wiley Interdiscip. Rev. Clim. Chang. 2014, 6, 151–169. [Google Scholar] [CrossRef]
  29. Nistor, M.M.; Cheval, S.; Gualtieri, A.F.; Dumitrescu, A.; Boţan, V.E.; Berni, A.; Hognogi, G.; Irimuş, I.A.; Porumb-Ghiurco, C.G. Crop Evapotranspiration Assessment under Climate Change in the Pannonian Basin during 1991–2050. Meteorol. Appl. 2017, 24, 84–91. [Google Scholar] [CrossRef] [Green Version]
  30. Leirós, M.; Trasar-Cepeda, C.; Seoane, S.; Gil-Sotres, F. Dependence of mineralization of soil organic matter on temperature and moisture. Soil Biol. Biochem. 1999, 31, 327–335. [Google Scholar] [CrossRef]
  31. Rustad, L.E.; Campbell, J.L.; Marion, G.M.; Norby, R.J.; Mitchell, M.J.; Hartley, A.E.; Cornelissen, J.H.C.; Gurevitch, J. A meta-analysis of the response of soil espiration, net nitrogen mineralization, and aboveground plant growth to experimental ecosystem warming. Oecologia 2001, 126, 543–562. [Google Scholar] [CrossRef]
  32. Srivastava, A.; Naresh, K.S.; Aggarwal, P. Assessment on vulnerability of sorghum to climate change in India. Agric. Ecosyst. Environ. 2010, 138, 160–169. [Google Scholar] [CrossRef]
  33. Kiniry, J.R.; Sanchez, H.; Greenwade, J.; Seidensticker, E.; Bell, J.R.; Pringle, F.; Peacock, G.; Rives, J. Simulating Grass Productivity on Diverse Range Sites in Texas. J. Soil Water Conserv. 2002, 57, 144–150. [Google Scholar]
  34. Meki, M.N.; Kiniry, J.R.; Worqlul, A.W.; Kim, S.; Williams, A.S.; Osorio, J.M.; Reilley, J. Field and simulation-based assessment of vetivergrass bioenergy feedstock production potential in Texas. Agron. J. 2020, 1–16. [Google Scholar] [CrossRef]
  35. Arnold, J.G.; Srinivasan, R.; Muttiah, R.S.; Williams, J.R. Large area hydrologic modeling and assessment part i: model development. J. Am. Water Resour. Assoc. 1998, 34, 73–89. [Google Scholar] [CrossRef]
  36. Hammer, G. Crop modelling: current status and opportunities to advance. Acta Hortic. 1998, 456, 27–36. [Google Scholar] [CrossRef]
  37. Rosenthal, W.D.; Gerik, T.J.; Pendleton, G.B.; Teetes, G.; Makila, M.; Stone, N. Sorghum Midge Control Using a Plant/Insect Model; ASAE Technical Paper 894043; American Society of Agricultural Engineers: St. Joseph, MI, USA, 1989. [Google Scholar]
  38. Gerik, T.; Wade, L.; Rosenthal, W.; Vanderlip, R. Optimising cultural practices for grain sorghum in relation to climatic risk at three locations in the United States, using the Sorkam model. Math. Comput. Simul. 1992, 33, 415–419. [Google Scholar] [CrossRef]
  39. Fritz, J.O.; Vanderlip, R.L.; Heiniger, R.W.; Abelhalim, A.Z. Simulating Forage Sorghum Yields with SORKAM. Agron. J. 1997, 89, 64–68. [Google Scholar] [CrossRef]
  40. Xie, Y.; Kiniry, J.R.; Nedbalek, V.; Rosenthal, W.D. Maize and Sorghum Simulations with CERES-Maize, SORKAM, and ALMANAC under Water-Limiting Conditions. Agron. J. 2001, 93, 1148–1155. [Google Scholar] [CrossRef] [Green Version]
  41. Behrman, K.D.; Kiniry, J.R.; Winchell, M.; Juenger, T.E.; Keitt, T.H. Spatial forecasting of switchgrass productivity under current and future climate change scenarios. Ecol. Appl. 2013, 23, 73–85. [Google Scholar] [CrossRef]
  42. Rong, L.; Zhang, C.; Zhang, X.; Wu, S.; Wang, Z. Wheat Production Simulation Based on the ALMANAC Model of North China Region. Sustain. Agric. Res. 2013, 2. [Google Scholar] [CrossRef] [Green Version]
  43. Kim, S.; Williams, A.; Kiniry, J.R.; Hawkes, C.V. Simulating diverse native C4 perennial grasses with varying rainfall. J. Arid. Environ. 2016, 134, 97–103. [Google Scholar] [CrossRef] [Green Version]
  44. Soil Survey Staff. Soil Taxonomy: A Basic System of Soil Classification for Making and Interpreting Soil Surveys; Agriculture Handbook No. 436; US Government Printing Office: Washington, DC, USA, 1975.
  45. Kiniry, J.R.; Johnson, M.V.V.; Venuto, B.C.; Burson, B.L. Novel Application of ALMANAC: Modelling a Functional Group, Exotic Warm-season Perennial Grasses. Am. J. Exp. Agric. 2013, 3, 631–650. [Google Scholar] [CrossRef] [Green Version]
  46. Monsi, M.; Saeki, T. Uber Den Lichtfaktor in Den Pflanzen-Gesellschaften Und Seine Bedeutung Fur Die Stoffproduktion. Jpn. J. Bot. 1953, 14, 22–52. [Google Scholar]
  47. Quinby, J.R.; Kramer, N.W.; Stephens, J.C.; Lahr, K.A.; Karper, R.E. Grain sorghum production in Texas. Texas Agric. Exp. Stn. Bull. 1958, 912, 78–218. [Google Scholar]
  48. Ferraris, R.; Charles-Edwards, D. A comparative analysis of the growth of sweet and forage sorghum crops. II. Accumulation of soluble carbohydrates and nitrogen. Aust. J. Agric. Res. 1986, 37, 513–522. [Google Scholar] [CrossRef]
  49. Hammer, G.L.; Carberry, P.S.; Muchow, R.C. Modeling genotypic and environmental control of leaf area dynamics in grain sorghum. Whole plant level. Field Crops Res. 1993, 33, 293–310. [Google Scholar] [CrossRef]
  50. Prasad, P.; Pisipati, S.R.; Mutava, R.N.; Tuinstra, M.R. Sensitivity of Grain Sorghum to High Temperature Stress during Reproductive Development. Crop Sci. 2008, 48, 1911–1917. [Google Scholar] [CrossRef] [Green Version]
  51. Kiniry, J.R.; Tischler, C.; Van Esbroeck, G. Radiation use efficiency and leaf CO2 exchange for diverse C4 grasses. Biomass Bioenergy 1999, 17, 95–112. [Google Scholar] [CrossRef]
  52. Williams, J.R.; Jones, C.A.; Kiniry, J.; Spanel, D.A. The EPIC Crop Growth Model. Trans. ASAE 1989, 32, 497–511. [Google Scholar] [CrossRef]
  53. Lal, R. Enhancing crop yields in the developing countries through restoration of the soil organic carbon pool in agricultural lands. Land Degrad. Dev. 2006, 17, 197–209. [Google Scholar] [CrossRef]
  54. Monteith, J.L. Evaporation and Environment. In Symposium of the Society Experimental Biology; Cambridge University Press: Cambridge, UK, 1965; pp. 205–234. [Google Scholar]
  55. Giorgi, F.; Mearns, L.O. Approaches to the simulation of regional climate change: A review. Rev. Geophys. 1991, 29, 191–216. [Google Scholar] [CrossRef]
  56. Fox, D.G. Judging Air Quality Model Performance. A Summary of the AMS Workshop on Dispersion Model Performance, Woods Hole, Mass., 8–11 September 1980. Bull. Am. Meteorol. Soc. 1981, 62, 599–609. [Google Scholar] [CrossRef] [Green Version]
  57. Di Rienzo, J.A.; Casanoves, F.; Balzarini, M.G.; Gonzalez, L.; Tablada, M.; Robledo, C.W. InfoStat: Statistical Software; Grupo InfoStat, FCA, Universidad Nacional de Córdoba: Córdoba, Argentina, 2013; p. 334. [Google Scholar]
  58. Kiniry, J.R.; Cassida, K.A.; Hussey, M.A.; Muir, J.P.; Ocumpaugh, W.R.; Read, J.C.; Reed, R.L.; Sanderson, M.A.; Venuto, B.C.; Williams, J.R. Switchgrass simulation by the ALMANAC model at diverse sites in the southern US. Biomass Bionerg. 2005, 29, 419–425. [Google Scholar] [CrossRef]
  59. Kiniry, J.R.; Bockholt, A.J. Maize and Sorghum Simulation in Diverse Texas Environments. Agron. J. 1998, 90, 682–687. [Google Scholar] [CrossRef]
  60. Boomiraj, K.; Marimuthu, S.; Wani, S.P.; RaviKumar, S.M.; Tani, S. Vulnerability assessment of kharif rainfed sorghum to climate change in SAT regions of India. J. Agrometeorol. 2012, 14, 2–8. [Google Scholar]
  61. Sunoj, V.S.J.; Somayanda, I.M.; Chiluwal, A.; Perumal, R.; Prasad, P.V.V.; Jagadish, S.V.K. Resilience of Pollen and Post-Flowering Response in Diverse Sorghum Genotypes Exposed to Heat Stress under Field Conditions. Crop Sci. 2017, 57, 1658–1669. [Google Scholar] [CrossRef]
  62. Deryng, D.; Conway, D.; Ramankutty, N.; Price, J.; Warren, R. Global crop yield response to extreme heat stress under multiple climate change futures. Environ. Res. Lett. 2014, 9, 1–13. [Google Scholar] [CrossRef]
  63. Cosentino, S.L.; Mantineo, M.; Testa, G. Water and nitrogen balance of sweet sorghum (Sorghum bicolor moench (L.)) cv. Keller under semi-arid conditions. Ind. Crops Prod. 2012, 36, 329–342. [Google Scholar] [CrossRef]
  64. Alexander, L.; Arblaster, J.M. Assessing trends in observed and modelled climate extremes over Australia in relation to future projections. Int. J. Clim. 2009, 29, 417–435. [Google Scholar] [CrossRef]
  65. Levy, P.E.; Cannell, M.; Friend, A. Modelling the impact of future changes in climate, CO2 concentration and land use on natural ecosystems and the terrestrial carbon sink. Glob. Environ. Chang. 2004, 14, 21–30. [Google Scholar] [CrossRef]
  66. Greaver, T.L.; Clark, C.M.; Compton, J.E.; Vallano, D.; Talhelm, A.F.; Weaver, C.P.; Band, L.E.; Baron, J.S.; Davidson, E.A.; Tague, C.L.; et al. Key ecological responses to nitrogen are altered by climate change. Nat. Clim. Chang. 2016, 6, 836–843. [Google Scholar] [CrossRef]
  67. Challinor, A.J.; Watson, J.; Lobell, D.B.; Howden, S.; Smith, D.R.; Chhetri, N. A meta-analysis of crop yield under climate change and adaptation. Nat. Clim. Chang. 2014, 4, 287–291. [Google Scholar] [CrossRef]
Figure 1. Variation of the mean monthly temperature in the current scenario, and in scenarios with 1, 2, and 4 °C increases of mean annual temperature. The columns represent the mean monthly precipitation, which remained the same in the different scenarios of increases in temperature. Values represent the average of 19 years of data (1999–2018). The bars represent the standard error.
Agronomy 10 00964 g001
Figure 2. Average of 19 years of measured (black line) and simulated (red points) yields of (a) forage and (b) grain sorghum. Gray area represents the range of measured yields, and bars represent standard deviation considering all the hybrids evaluated.
Agronomy 10 00964 g002
Figure 3. Relative yield of forage and grain sorghum exposed to increases in mean annual temperature, compared to the current yields. Current yields are 14.9 Mg ha−1 and 9.3 Mg ha−1 for forage and grain sorghum, respectively. Different capital or lowercase letters above error bars indicate significant differences (p ≤ 0.05) among forage and grain sorghum treatments, respectively.
Agronomy 10 00964 g003
Figure 4. Average days of (a) water and (b) nitrogen stress during the growth cycle of forage and grain sorghum under scenarios with increases in the mean annual temperature.
Agronomy 10 00964 g004
Table 1. Climate description and number of forage and grain sorghum hybrids evaluated in each growing season (spring and summer).
Growing Season (GS)Precipitation (mm/GS)Average Minimum Temperature (°C)Average Maximum Temperature (°C)Sorghum TypeNº of Hybrids Evaluated
2008/200943816.228.5Forage23
Grain32
2009/201093215.726.5Forage20
Grain32
2010/201134814.827.6Forage19
Grain33
2011/201243015.828.2Forage16
2012/201374415.427.2Forage24
2013/201484315.727.3Forage14
Grain44
2014/201558115.827.8Forage15
Grain31
Table 2. Soil organic carbon and nitrate concentration in each evaluated year. Values correspond to soil samples taken at planting date, in the sowing area of forage and grain sorghum.
Soil Properties2008200920102011201220132014
Organic C (%)1.891.712.151.861.751.822.46
NO3 (g·t−1)91.291.281.251.739.4160.172.4
Table 3. Detail of forage sorghum management practices in each evaluated year.
Growing Season (GS)Planting DatePlanting Density *
(pl·m−2)
Fertilization DateFertilization Rate
(Kg·ha−1)
Intermediate Harvest DatesFinal Harvest Date
2008/2009Dec 5501st: Dec 12
2nd: Feb 24
1st: N 25, P 9; 2nd: N 9, P 10 Jan 23, Feb 23Mar 31
2009/2010Dec 340Dec 5N 25, P 9 Jan 15, Feb 18Apr 23
2010/2011Nov 1950Nov 25N 21, P 7.5 Jan 23Mar 22
2011/2012Nov 2240Nov 22N 21.6, P 24Feb 13Apr 20
2012/2013Nov 1545Nov 15N 18, P 20Jan 20Apr 30
2013/2014Dec 140Dec 1N 18, P 20Jan 30Mar 25
2014/2015Nov 2860Nov 28N 18, P 20Jan 22Apr 22
* In all the years, row spacing was 0.5 m.
Table 4. Grain sorghum management practices in each evaluated year.
Growing Season (GS)Planting DatePlanting Density *
(pl·m−2)
Fertilization DateFertilization Rate
(Kg·ha−1)
Harvest Date
2008/2009Dec 330Dec 17N 25, P 9 Jun 7
2009/2010Dec 436Dec 7N 72, P 21 May 10
2010/2011Nov 2542Nov 25N 21, P 7.5Jun 2
2013/2014Dec 845Dec 8N 45, P 20 May 20
2014/2015Nov 2827Nov 28N 68, P 20 Jun 3
* In all the years, row spacing was 0.5 m.
Table 5. Agricultural Land Management Alternatives with Numerical Assessment Criteria (ALMANAC) model performance statistics for predicting forage and grain sorghum yields.
Statistic Forage SorghumGrain Sorghum
Measured SimulatedMeasured Simulated
Mean yield (Mg ha−1)15.4715.697.617.22
Coefficient of variation (%)18.110.18.16.6
RMSE (Mg ha−1)2.61.0
MBE (Mg ha−1)0.21−0.39
MAE (Mg ha−1)2.40.7
Table 6. Degree of correlation (Pearson coefficient, r) between simulated yields and the simulated days of N and water stress, and between both types of stresses.
Variable 1Variable 2Forage SorghumGrain Sorghum
Pearsonp-ValuePearsonp-Value
YieldN stress−0.940.05940.980.0161
YieldWater stress0.970.0313−0.990.0030
N stressWater stress−0.990.0046−0.970.0323

