Article

Nutritional Quality of Plant Species in Pyrenean Hay Meadows of High Diversity

1
Department of Agrarian and Environmental Sciences, Higher Polytechnic School, University of Zaragoza, Ctra Cuarte s/n, 22071 Huesca, Spain
2
Department of Agrarian and Environmental Sciences, Faculty of Veterinary Sciences, University of Zaragoza, Miguel Servet 177, 50013 Zaragoza, Spain
3
AgriFood Institute of Aragon-IA2-CITA, University of Zaragoza, 50013 Zaragoza, Spain
*
Author to whom correspondence should be addressed.
Agronomy 2020, 10(6), 883; https://doi.org/10.3390/agronomy10060883
Submission received: 14 May 2020 / Revised: 16 June 2020 / Accepted: 18 June 2020 / Published: 19 June 2020
(This article belongs to the Special Issue Environmental Sustainability of Crop-Livestock Systems)

Abstract

:
The feed quality of 34 species (27 dicotyledonous and 7 grasses) present in the vegetation of the Pyrenean mountain hay meadows rich in species subject to extensive management is analyzed in this paper. For this, just before mowing, samples were taken in the field and their organic and mineral components were determined in the laboratory. The results indicate that some species, such as Taraxacum officinale, Sanguisorba minor, Chaerophyllum aureum, and Lotus corniculatus, are outstanding in their forage feed value and, in the cases of T. officinale and C. aureum, also for their mineral content. The non-leguminous forbs studied presented quality comparable to legumes and higher than grasses, which provide worse nutritional values in this type of late-cut meadow. The forbs are shown to have higher content than grasses and legumes in Mg, K, and Na, as well as intermediate Ca content. All species present suitable mineral content for animal nutrition, except in the case of P, which is low. The Ca:P ratio is higher than adequate in half of the species analyzed, while the K:(Ca + Mg) ratio is appropriate for all species. The ratios between the elements N, P, and K indicate that most of the species studied grow under N-limited conditions, which are adequate for their conservation in the meadows.

1. Introduction

The feeding value of the forage species of a meadow depends on the floristic composition and their growth stage, which are influenced by environmental, topographical, and geographical features (e.g., climate, soil, moisture, elevation, slope, and distance to the main farm building), as well as the spatio-temporal aspects of the management (e.g., mowing, grazing, fertilization, and time of year) [1,2,3,4,5,6,7,8,9].
In meadows, species richness correlates negatively with high productivity, and nitrogen enrichment, which increases productivity, is a major factor influencing species extinction [10]. N deposition can cause a decrease in soil pH, depletion of base cations (Ca, Mg, K, and Na) from soil and foliage, eutrophication with increased soil and foliar N concentrations, and increased foliar N:P ratios, indicative of increased P limitation with higher rates of N deposition [11], along with an increase in aboveground biomass production; thus, increasing competition for light and supporting the exclusion of less competitive species [7,12].
Therefore, species-rich grasslands are located in very specific environments and are maintained by environmentally compatible agricultural management [13], away from the two main threats to their conservation: excessive management intensification and mowing abandonment [14]. In its floristic composition, apart from grasses and leguminous botanical families with agronomic behavior and fodder quality which are more or less known, there are other forbs for which not much information is available and which are sometimes underestimated, due to such lack of knowledge [3,7]. Their incorporation may be of interest for their nutritional value, protein content, and high digestibility [2,5,15,16], as they establish a convenient ratio between protein and energy, contributing to better protein assimilation [17]; are rich in minerals and increase them in the animal ration [18]; they may have potential to reduce CH4 emissions and rumen ammonia production [5,19,20]; have healing properties with special dietary value and great impact on the nutritive value of forage, as well as on fermentation processes during ensiling [21]; and can contribute unique organoleptic characteristics to the derived animal products [22].
Although the total dry matter produced and fodder quality of these meadows is always lower than that achieved in conventional fodder crops in monoculture or in grass–legume mixtures [23,24], they do offer benefits for tackling future agricultural challenges that go beyond the animal performance level [20]. Grassland plant diversity helps to strengthen the resilience of ruminant production by securing the feeding system against seasonal and long-term climatic variability [25]. Forages that maintain quality at advanced stages of maturity have potential to increase the flexibility in timing of harvest dates, which benefits forage producers and livestock farmers [26]. This is particularly important in mountain conditions, where a delayed first cutting is commonly adopted by all farmers [9]. Furthermore, fibrous feeds produced under these conditions are not only profitable for local breeds of cattle but also have potential in genetically improved breeds [27].
In the case of the central Spanish Pyrenees, the meadows of Arrhenatherion elatioris and Triseto-Polygonion bistortae present high floristic diversity, small surface plots, and low-intensity management due to topographic and environmental characteristics. Most of them have been included in the Natura 2000 Network (Directive 92/43/EEC) [6]. Their management consists of one cut in the first 15 days of July, grazing in Spring and Autumn, and manure fertilization (although some are not fertilized). Once the grass has been cut, it is transformed into hay and provided indoors, during the winter, as part of the production cycle of the cattle that graze the high-altitude pastures during the summer. Unfortunately, these hay meadows are at risk of disappearing from the mountain landscape. Ascaso et al. [28] quantified a loss of 40.89% of the meadow area in the Benasque Valley between 1986 and 2016. Their use continues to be key for the few farms that remain in the valley and assists in preserving their independence from the external food resources which increase the costs of the farms. On the same farm, these more diverse meadows coexist with other, especially on the more intensively managed ones in the lower parts of the valley, giving security and flexibility to the management of forage resources [22].
The aim of this work consists of the analysis of the nutritional quality of 34 herbaceous species common to four mountain meadows selected for their plant diversity values and extensive management. The species were chosen to represent the groups of grasses and legumes as quality references; however, most of them were non-leguminous forbs with significant coverage in the vegetation of the meadows. The quality is estimated from the digestibility parameters and mineral content of the individual species and species groups found in the four meadows.

2. Materials and Methods

2.1. Study Site

Four hay meadows in the Benasque Valley (Spanish Pyrenees), located in grid ETRS89 UTM 31T X: 298, Y: 4721, between 1173–1245 m altitude, at the site of community importance “ES2410046” in the Natura 2000 network (Directive 92/43/EEC) were studied. The average annual rainfall is 1144 mm, with November being the month with the highest rainfall (144 mm) and March with the lowest (65 mm). The average annual temperature is 9.3 °C, the coldest month being January (1.0 °C) and the warmest July (18.9 °C). They are located on the alluvial terrace of the Ésera River, on sandy loam soils which are slightly acidic and neutral, not saline, with high organic matter content (Table 1). According to the reference values in García-Serrano et al. [29], nitrogen levels in the form of nitrates in the soil are adequate for plant production, P plant-available levels are very low, K plant-available levels are low, and Mg levels are more variable; the first meadow was considered to have low levels while the other three had high levels. The vegetation of these meadows is typical of the secondary communities of Arrhenatherion elatioris and Triseto-Polygonion bistortae. The meadows were chosen as they are geographically close to each other, in order to reduce environmental and management variability. Their agricultural management consists of one annual hay cut, between 3600 and 5400 kg DM ha−1, two cattle grazing periods (in Spring and Autumn), and no use of fertilization apart from the dung and urine from the animals while grazing.

2.2. Vegetation Sampling

Between June 25 and July 3, 2014, just before the beginning of the hay cut, plant inventories were carried out for each plot following the methodology of Braun-Blanquet [30]. Each one of the vascular species present was assigned a coverage coefficient, which was expressed in percentage of coverage in the meadow, according to a transformation (+ = 0.1%, 1 = 5%, 2 = 17.5%, 3 = 37.5%, 4 = 62.5%, and 5 = 87.5%) [31], and later fitting the data to 100%. From these values, the cover of the grasses, legumes and other forbs, the floristic richness (number of species per meadow), and the Shannon–Weaver (H’) diversity index [32] were calculated for each of the four plots. Nomenclature of species follows Castroviejo et al. [33].
In each meadow, samples of about 500 g of green weight were collected from each one of the 34 selected species listed in Table 2. Plants were cut 5–7 cm above the ground, as mown at different places in each meadow. The number of sub-samples collected varied, according to the weight of each species. The phenology of each species at the time of the cut is listed in Table 2. These species belong to 13 botanical families and their presence, abundance, and relative biomass within the hay meadows of the area was variable, as evidenced by the numerous phytosociological and grasslands studies compiled in Reiné et al. [34] and Chocarro et al. [35].

2.3. Chemical Analysis

In the laboratory, 136 species samples were oven-dried at 55 °C for 24 h to estimate the dry matter (DM) and ground in a mill (IKA MF10, IKA-Werke, Staufen, Denmark) to the point where the material could pass through a 1 mm screen. Nitrogen content (N) was determined using the Kjeldahl method and Crude Protein (CP) concentrations were calculated from it by multiplying (N × 6.25). Ash concentration was obtained by incineration at 550 °C. Crude fat (CF) determination was carried out using a Soxhlet extractor in ethyl ether at low heat for six hours. Ash-free neutral detergent fiber (NDF), acid detergent fiber (ADF), and acid detergent lignin (ADL) were quantified using an Ankom 200 fiber analyzer (Ankom Technol. Corp., Fairport, NY, USA), according to Van Soest et al. [36]. Hemicellulose and cellulose were estimated by subtraction from the various fiber components, as follows: % Hemicellulose = %NDF − %ADF; % Cellulose = %ADF − %ADL.
Relative feed value (RFV) [37] is an index which combines important nutritional factors (potential intake and digestibility) into a single number, providing a quick and effective method for evaluating feed value or quality. The RFV is calculated using the estimates of digestible dry matter (DDM%) and potential dry matter intake (DMI% of body weight) of the forage, based on the ADF and the NDF fractions, respectively, as follows: DDM% = 88.9 – [0.779 ADF (% of DM)]; DMI (% of body weight) = 120 NDF (% of DM) −1; RFV = (DDM DMI) 1.29−1; forage quality standard = f (RFV): prime (>151), 1st (151–125), 2nd (124–103), 3rd (102–87), 4th (86–75), and 5th (<75). To obtain the net energy value of fodder and the metabolizable protein content of the species, two other parameters were calculated: the UFL (“Unité fourragère lait”, feed units for milk UFL (kg DM)−1) and the PDI (“protéines digestibles dans l’intestin”, digestible crude proteins in the gut, %DM). Both were calculated, according to the INRA [38] methodology, based on the DM, organic matter (OM), CP, and ADF.
Phosphorus (P) content was determined by colorimetry of vanadomolybdophosphoric yellow, magnesium (Mg) content by atomic emission spectrophotometry in ICP-MS, calcium (Ca) by complexometry, and potassium (K), and sodium (Na) content by atomic absorption spectroscopy. All analytical results are expressed as % of DM (g per 100 g).
To determine the relationships between these minerals, Ca P−1 (Ca:P ratio), K (Ca + Mg)−1 (K:Ca + Mg ratio), N P−1 (N:P ratio), N K−1 (N:K ratio), and K P−1 (K:P ratio) values were calculated. Milliequivalents per 100 g were used to calculate K (Ca + Mg)−1 and grams per 100 g (%) values to calculate the rest.

2.4. Data Analysis

Due to the small sample size, the results are expressed as the median, as it better reflects the central value of the variation range. This was delimited by the maximum and minimum values. To analyze the intra-specific variation of the parameters, we used the relative amplitude of this interval with respect to the minimum value.
To identify the main factors characterizing the chemical composition of the 34 species, principal component analysis (PCA) was performed, with varimax rotation. The Bartlett sphericity test and a Kaiser–Meyer–Olkin (KMO) test for sampling adequacy were used to validate the procedure. ADL and DDM variables were excluded from the analysis, due to their results in the anti-image correlation matrix.
In order to determine the influence of the botanical groups (grasses, legumes, and other forbs) and the meadow of origin on the chemical and nutritional variables of the plants, a two-way ANOVA test was carried out. Where significant differences existed, HSD Tukey post-hoc tests were performed. Normality of variables was assumed. Homogeneity of variance was estimated with Levene’s test.
Spearman’s rho coefficient between the medians and their amplitude intervals was used to check whether the intra-specific variation was correlated with the median value. It was also used to estimate the correlations between some parameters.
All statistical analyses were performed using IBM SPSS Advanced Statistics software ver. 26 (SPSS Statistics 26.0, International Business Machines Corporation, Armonk, NY, USA).

3. Results

3.1. Vegetation Cover

Table 2 provides data on the cover of the 34 species analyzed in the vegetation of the four meadows. The total percentages of cover of the selected species with respect to the total can be seen, with values ranging from 62.5% to 95.9%. These meadows showed variable cover of grasses, legumes, and other forbs, with high values of plant diversity and specific richness. The cover results are accompanied by the species quality values (Is), which vary from 0 (minimum value) to 5 (maximum value), compiled from 20 works by Roggero et al. [39], and which are used in the pastoral value method [40] to estimate the relative value of the quality of a pasture. The table also incorporates the evidence of consumption by cattle of each of the plants; information extracted from the study by Farruggia et al. [41], which analyzed the DNA fragments of the plants in the dung of the animals.

3.2. Chemical Composition of Species

Results of the chemical composition of the 34 sampled species are given in Table 3. DM median content presented a maximum of 45.5% for Festuca arundinacea and a minimum of 18.5% for Heracleum sphondylium. The percentages of CP varied between a maximum median for Vicia cracca of 18.2% and a minimum value for Cerastium fontanum of 6.6%. Ash content varied between 12.8% for Taraxacum officinale and 3.9% for Phleum pratense. The maximum CF content was presented by Tragopogon dubius (4.9%) and the minimum by Centaurea scabiosa (1.3%). NDF presented a maximum value of 73.3% for Festuca arundinacea and a minimum of 30.5% for Taraxacum officinale. ADF varied between a maximum value of 42.3% for Rumex acetosa and a minimum of 17.6% for Taraxacum officinale. The last component of fiber, ADL, was maximum in Galium verum (12.6%) and minimum in Lolium perenne (2.8%). With these fiber contents, a maximum DDM was estimated for Taraxacum officinale with 75.2% and a minimum DDM for Rumex acetosa with 55.9%.
Regarding the mineral components, the maximum P content corresponded to Rhinanthus pumilus with 0.29% and the minimum to Cerastium fontanum with 0.11%. Silene vulgaris had the highest K content (2.92%), Mg content was maximum in Taraxacum officinale (0.61%) and minimum in the grass Phleum pratense (0.11%). The legume Anthyllis vulneraria stood out for its maximum content of Ca (3.32%) and minimum contents of K (0.55%) and Na (0.06%). Festuca arundinacea had the lowest Ca content (0.35%) and, once again, Taraxacum officinale stood out as the species with the highest Na content (0.21%).
Table 4 shows the intra-specific variability of the above results. If we consider only the data of more than 50% of relative amplitude of this interval with respect to the minimum value, we observe that the greatest variations were produced in the results of the minerals. Thus, for K, 27 of the 34 species analyzed had variations greater than 50%, 21 species in the case of Mg, 16 species in the case of Ca, and 12 in P and Na. Potassium and magnesium were the minerals with the highest percentages of variation. Of the rest of the parameters analyzed, the low intra-specific variation of the NDF and ADF fiber values stood out. The species that presented high variations for five or more parameters were Crepis pyrenaica, Festuca arundinacea, Lolium perenne, Rhinanthus pumilus, Sanguisorba minor, and Taraxacum offcinale. No significant correlations between median values and intra-specific variation percentages were found for any parameter.
Figure 1 shows the results of the PCA. The graph jointly shows the distribution of species and weights of each variable in components 1 (x-axis) and 2 (y-axis) which explain a high percentage of the total variance, 55% and 20%, respectively. Species are represented according to their belonging to the botanical family of either grasses, legumes, or other forbs. The first component positively differentiated the analytical variables, corresponding to the fibers–NDF, ADL, hemicellulose, and cellulose–which determine the distribution in this part of the graph of all grass species family. With negative values on this first component, the variables Ca, CP, and ash stood out, ordering the preferential distribution of the legumes. The group formed by the other species (in blue) does not have a clearly marked distribution with respect to this component, except for species from the Umbelliferae family, which were preferentially distributed in the negative values of the axis. With regard to the second component, the positive values of the variables corresponding to the mineral contents of K, Na, P, Mg, and to the CF, stood out. These variables jointly separate grasses and legumes, both with negative values for this second component, from some species of the blue group. In this group, there were families, such as Umbelliferae, which were preferably located in the positive values of the second component and families, such as Compositae, that presented more variability; that is, some had the highest positive values (e.g., Taraxacum officinale), while others took negative values (e.g., Centaurea nigra).

3.3. Chemical Composition of Botanical Groups

Table 5 shows the results of the two-way ANOVA between the parameters of the chemical composition of the plants, according to their botanical group and the meadow of origin of the samples. None of the variables analyzed showed significant differences with respect to the meadow of origin except for P, which has significantly higher values in the plants from meadows 1 and 2. ANOVA showed no significant interactions between the botanical groups and the meadow of origin of the samples.
Significant differences between botanical groups were found for all parameters. Grasses presented the lowest content in CP, ash, ADL, P, Mg, and Ca, and the highest in DM, hemicellulose, cellulose, NDF, and ADF. Legumes had the highest content in CP, ADL, and Ca, whereas the group of other forbs presented the highest content in CF and in the minerals Mg, K, and Na (Figure 1).

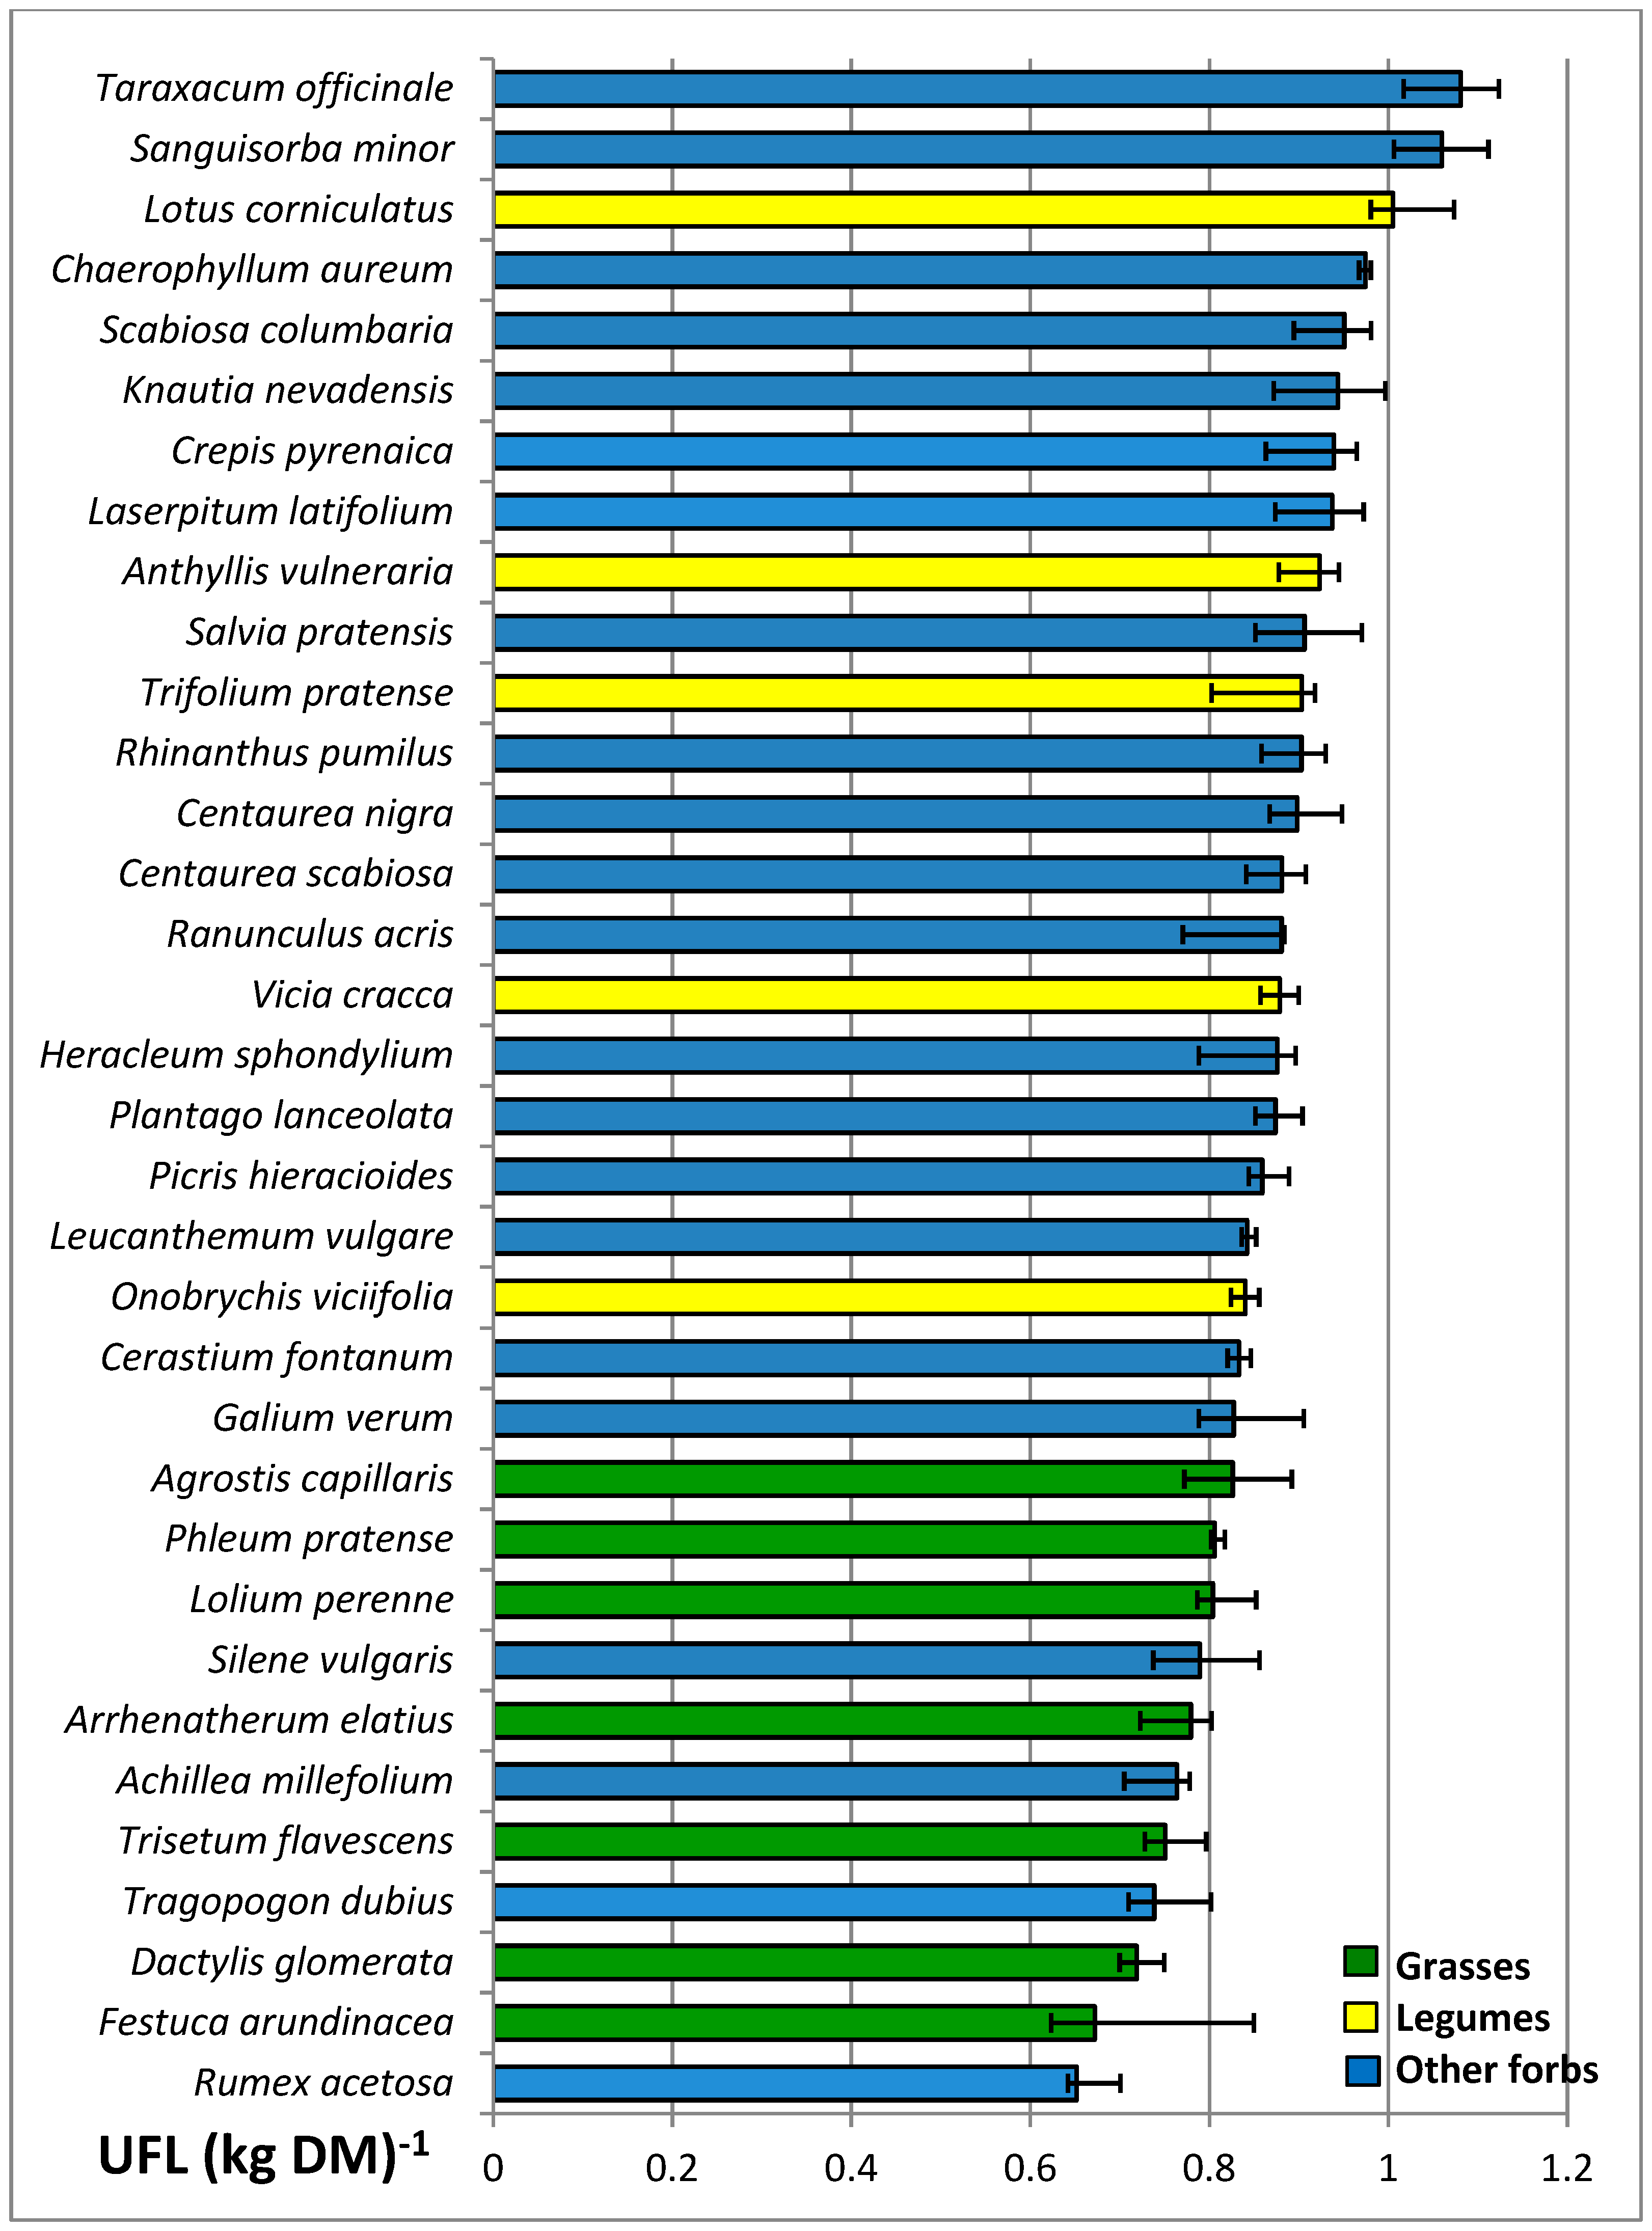
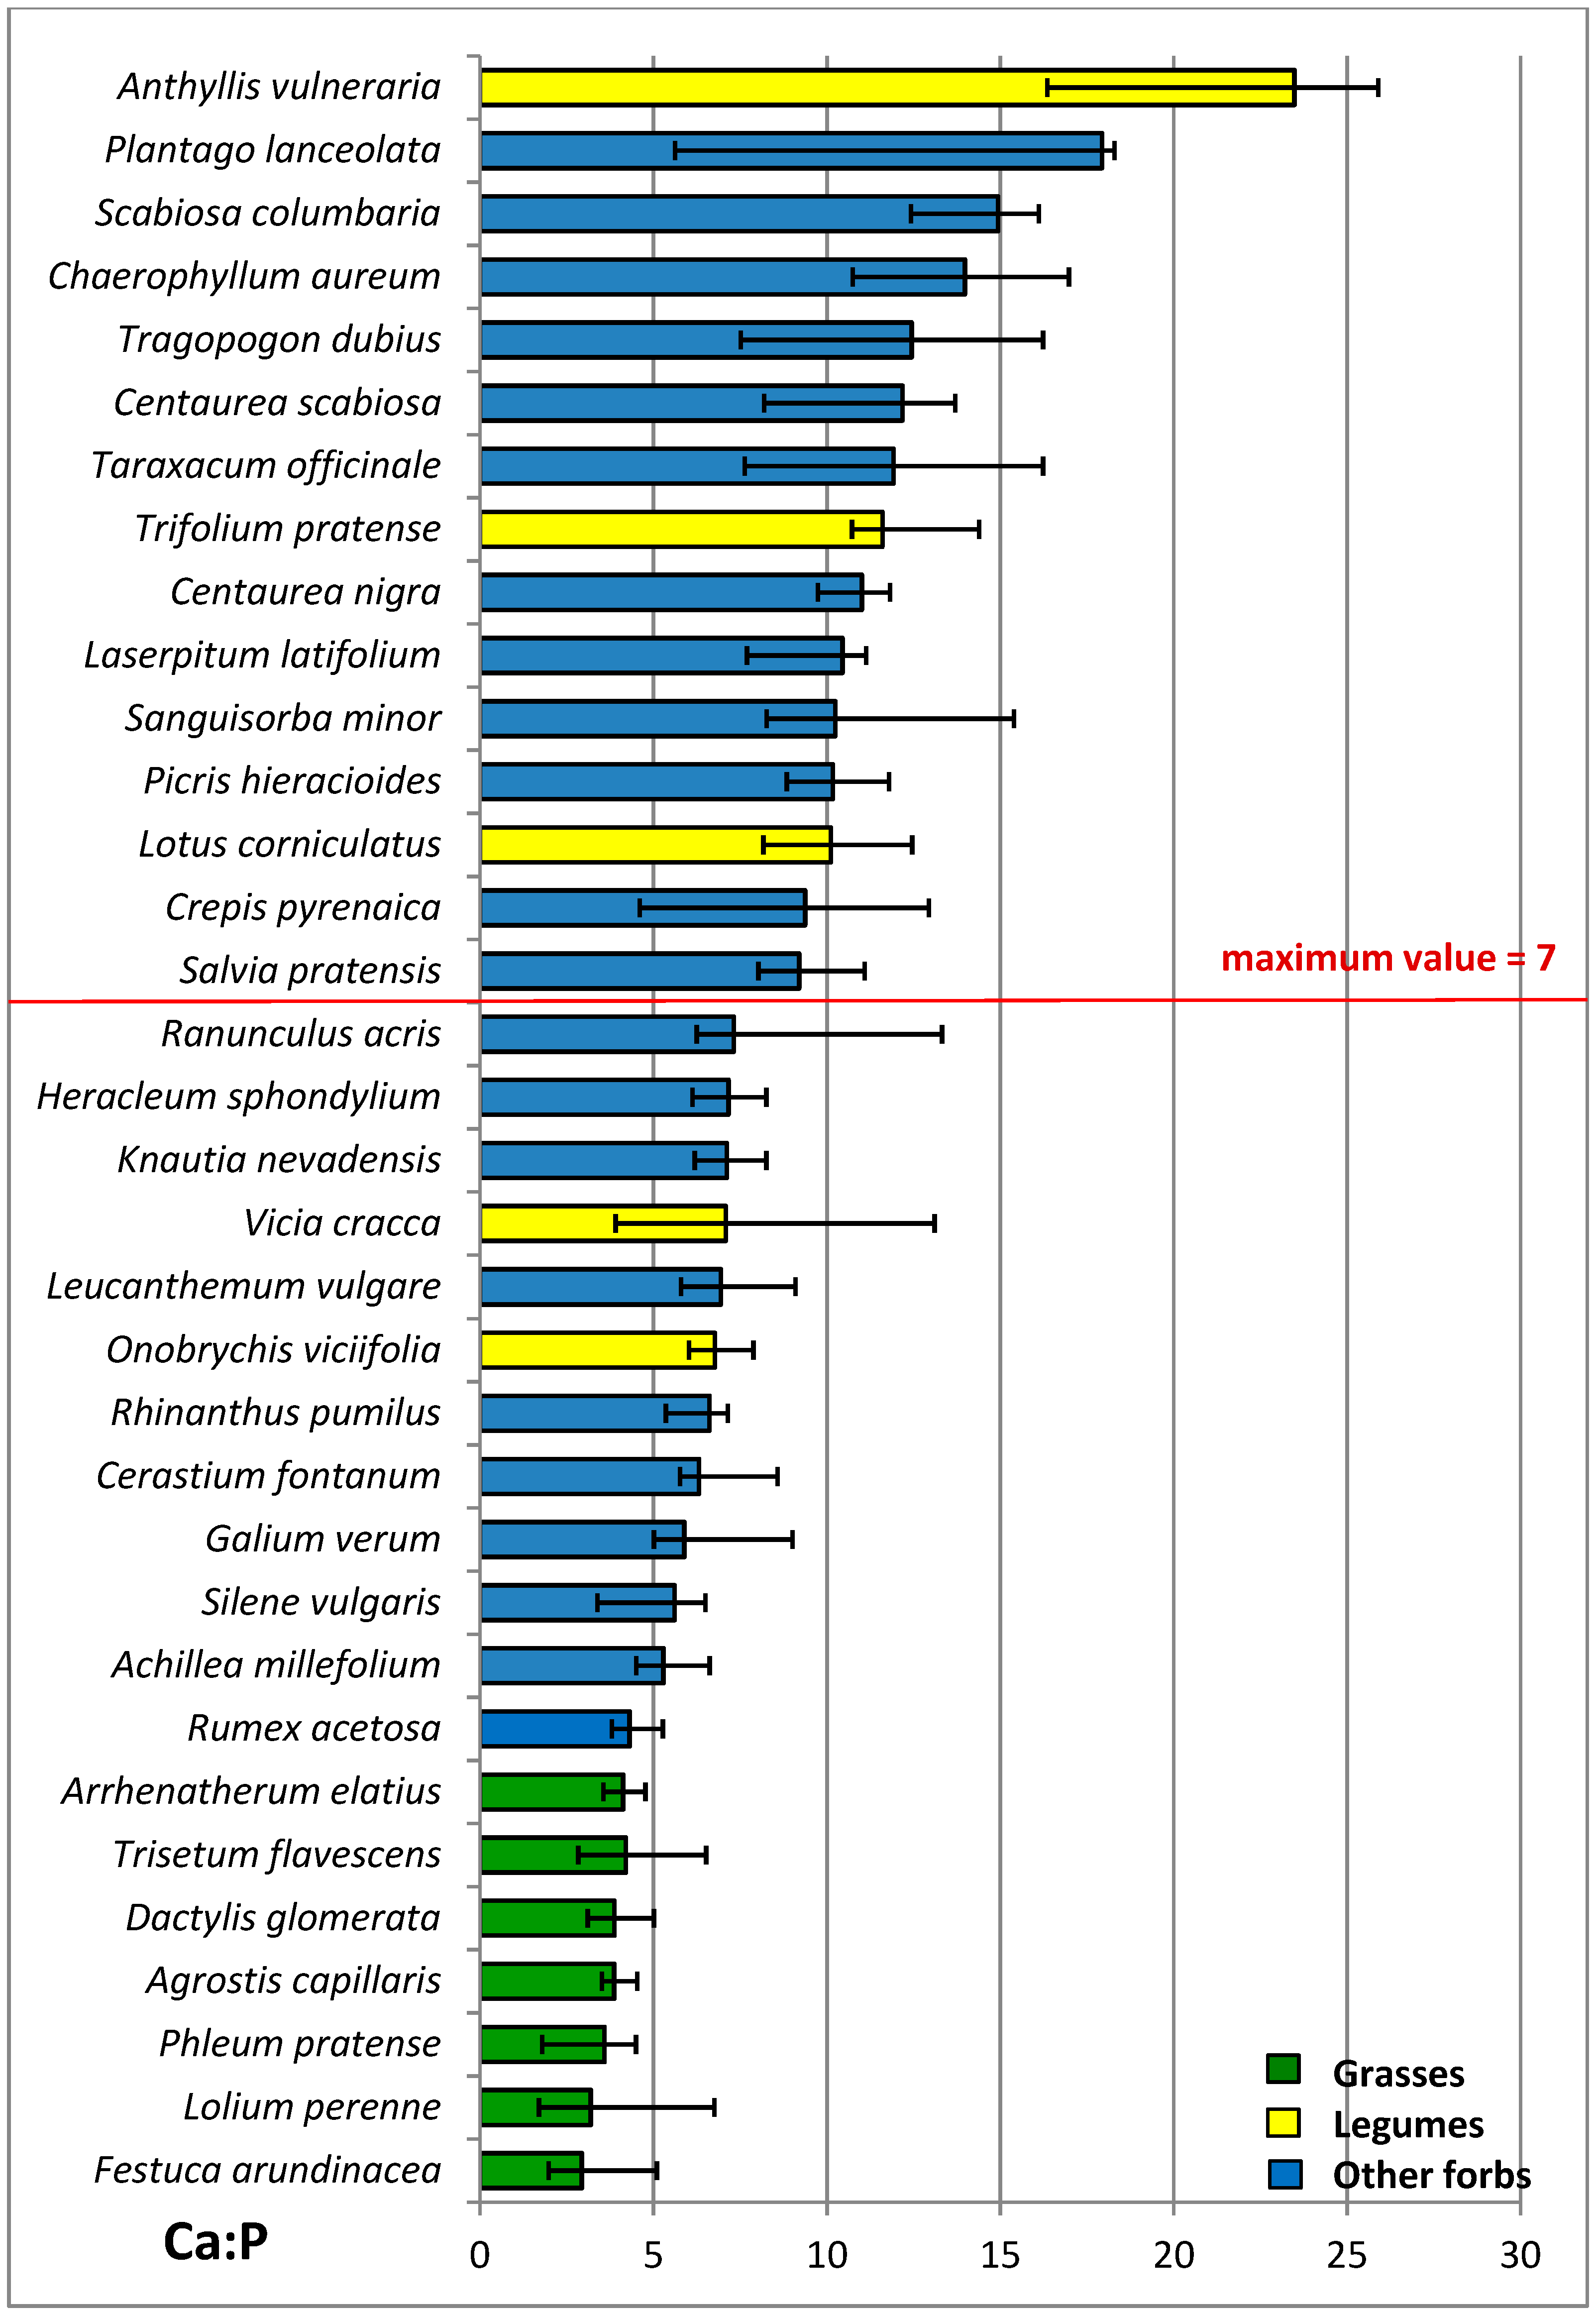
3.4. Nutritive Value of Species

Figure 2 shows the RFV of the 34 species analyzed, represented by their median and range of variation. The species are ordered in the graph from highest to lowest, differentiating them according to the quality categories described by Linn and Martin [37]. The minimum median value was presented by the species Festuca arundinacea (71.4) and the maximum median by Taraxacum officinale (229.9).
We highlight that, in the first position of the ranking (i.e., the prime category), there were three species from the group of other forbs: Taraxacum officinale, Sanguisorba minor, and Chaerophyllum aureum. These three species were followed by two leguminous plants: Lotus corniculatus and Anthyllis vulneraria, also in the prime category. It is also surprising that, again, some of the other forbs were classified as first category: Plantago lanceolata, Scabiosa columbaria, Knautia nevadensis, Crepis pyrenaica, and Laserpitium latifolium, among others. However, practically all of the analyzed grasses were classified in the fourth category (Dactylis glomerata, Trisetum flavescens, Phleum pretense, Agrostis capillaris, and Arrhenatherum elatius), or even in the fifth (Festuca arundinacea).
The intra-specific variation of the RFV index was not high. The relative width of the intervals shown in the graph with respect to the minimum value only reached 30% in one species, Festuca arundinacea. These calculated % variations were not correlated with the median values (Spearman’s rho = 0.30, n = 34, p = 0.10).
Figure 3 presents the results of the quality estimation of each species, following a different methodological approach from INRA [38], based on the use of an energy value; that is, the UFL (kg DM)−1. The minimum median value was presented by Rumex acetosa (0.65) and the maximum median value by Taraxacum officinale (1.08). In addition to this species, Lotus corniculatus and Chaerophyllum aureum, which were also considered as prime quality in the RFV method, occupied the first positions in the ranking. In the lower part of the classification, mixed with the grasses were the species Rumex acetosa, Tragopogon dubius, Achillea millefolium, and Silene vulgaris, which were also considered to be of very low quality by the RFV method. Both RFV and UFL parameters were highly correlated (Spearman’s rho = 0.92, n = 136, p < 0.001). The intra-specific variation of UFL results was also very similar to that obtained in RFV, with values above 30% only for Festuca arundinacea, with variation that was not correlated with the median either (Spearman’s rho = −0.02, n = 34, p = 0.90).
The results of PDI of the 34 species are shown in Figure S1 (Supplementary Material), ordered by their median and with their ranges of variation. As expected, the legume family, due to their N content, occupied the first positions in the order; however, among them, in the third and fifth positions appeared the species Taraxacum officinale and Chaerophyllum aureum, which were also highlighted in the two previous classifications (see Figure 2 and Figure 3). The maximum median content was presented by Lotus corniculatus (9.3%) and the minimum by Festuca arundinacea (6.5%). Grasses also appeared in the last positions of the ranking, although not as clearly ordered as in the RFV ranking (Figure 2); this time, plants from the group of other forbs, such as Rumex acetosa, Cerastium fontanum, Tragopogon dubius, Silene vulgaris, and Leucanthemum vulgare, appeared next to them.
The PDI was positive and significantly correlated with the RFV (Spearman’s rho = 0.73, n = 136, p < 0.001) and UFL (Spearman’s rho = 0.79, n = 136, p < 0.001), but showed less intra-specific variation. The mean relative width of the ranges shown in the graph with respect to the minimum values was less than 9%. Moreover, these % variations, as in the previous parameters, were not correlated with the median values (Spearman’s rho = −0.08, n = 34, p = 0.67).
In addition to the individual contents of the minerals Ca and P in the forage, the ratio relating them (Ca:P) is an important feed indicator for beef cattle. The median, maximum, and minimum values of this ratio, as calculated from the contents of these two minerals in each of the 34 species, are shown in Figure 4. The median values fluctuated between a minimum of 2.9 for Festuca arundinacea and a maximum of 23.5 for Anthyllis vulneraria. Together with this legume species, very high values of the ratio were presented in Plantago lanceolata, Scabiosa columbaria, and Chaerophyllum aureum, all from the other forbs group. The species that presented the lowest Ca:P ratios were all from the grasses family.
In Figure 4, the maximum value recommended by the NRC [42] for the feeding requirements of beef cattle is marked in red. Of the 34 species analyzed, 15 were above this value, including the first seven in the ranking in Figure 2 with the best RFV records and the first five in the classification in Figure 3 with the best UFL records.
To conclude with respect to Figure 4, it should be noted that there was high intra-specific variation in the values of the Ca:P ratio in some species. The relative amplitude of the intervals represented in the graph with respect to the minimum value reached values higher than 150% in six species: Crepis pyrenaica, Festuca arundinacea, Lolium perenne, Phleum pratense, Plantago lanceolate, and Vicia cracca. This variation was not correlated with the median (Spearman’s rho = −0.10, n = 34, p = 0.60).
K:(Ca + Mg) equivalent ratio is another important feed indicator for beef cattle. In Figure S2 (Supplementary Material) we represent the median values of this ratio for the 34 species sampled, which varied between a minimum of 0.1 for the legume Anthyllis vulneraria and a maximum of 1.0 for the grass Festuca arundinacea. The highest values of this ratio were found for the grasses, accompanied by some species of the other forbs, such as Silene vulgaris, Cerastium fontanum, and Achillea millefolium. Leguminous plants were grouped in the lower values, although they were also accompanied by species of the other forbs group, such as Scabiosa columbaria and Sanguisorba minor.
Marked in red (Figure S2, Supplementary Material) is the critical value of the index (i.e., 2.2), according to several authors [42,43], from which the beef cattle can suffer from grass tetany, a highly fatal disease associated with low levels of magnesium in the blood. All our values were below it. We also observed in the K:(Ca + Mg) ratio, as in Ca:P, high intra-specific variability in some species. In this case, seven species had a relative amplitude of the intervals of variation with respect to the minimum above 150%: Crepis pyrenaica, Dactylis glomerata, Festuca arundinacea, Galium verum, Lotus corniculatus, Onobrychis viciifolia, and Tragopogon dubius. The ranges of variation of the K:(Ca + Mg) ratio were also not significantly correlated with the median values (Spearman’s rho = −0.30, n = 34, p = 0.08).
The N:P ratio was analyzed for a double purpose: On one hand, these two minerals are key in animal nutrition, N being the constituent element of proteins and P for its role in metabolism and in the development of bone structures. On the other hand, the N:P ratio has been considered, by some authors [44,45], as an indicator of the type of nutrient limitation in the plant community. Figure S3 (Supplementary Material) shows the median, maximum, and minimum values of this ratio for the 34 species analyzed. The median values varied between the minimum of 6.8 for Silene vulgaris and the maximum of 15.1 for Lotus corniculatus. The species that presented the highest values of the ratio were all those of the leguminous family, in addition to the aforementioned, Trifolium pratense, Anthyllis vulneraria, Vicia cracca, and Onobrychis viciifolia. On the opposite side, the minimum values (in addition to Silene vulgaris) were marked by Rhinanthus pumilus, Lolium perenne, Rumex acetosa, and Galium verum. In this ranking, the grasses were more dispersed than in the five previous cases (Figure 2, Figure 3 and Figure 4, and S1 and S2, Supplementary Material).
Marked in red (Figure S3, Supplementary Material), we delimit the N:P ratio < 14, which separates the species that have N-limited plant growth, according to Koerselman and Meuleman [44] and Aerts and Chapin [45], from the rest. Only four leguminous plants exceeded this limit: Lotus corniculatus, Trifolium pratense, Anthyllis vulneraria, and Vicia cracca.
The intra-specific variation in this case was not as high as for the Ca:P and K:(Ca + Mg) ratios. There were only three species for which the relative amplitude of the intervals with respect to the minimum value reached values greater than 150%. This was the case for Centaurea scabiosa, Lolium perenne, and Sanguisorba minor. Once again, this variation was not correlated with the median (Spearman’s rho = −0.24, n = 34, p = 0.17).

3.5. Nutritive Value of Botanical Groups

Table 6 shows the results of the two-way ANOVA between botanical groups and meadow of origin of the samples, with respect to the nutritional variables. The nine parameters shown in the table presented significant differences between the three botanical groups. Grass species were characterized by the lowest values of DDM, RFV, UFL, and PDI; that is to say, they presented the lowest qualities of the three botanical groups. They also had the lowest values of the Ca:P ratio and the highest values of the K:(Ca + Mg) ratio. Legume species presented the highest values of protein PDI and Ca:P, N:P, and N:K ratios, as well as the lowest values of K:(Ca + Mg) and K:P ratios. The group of other forbs did not stand out in any of the previous parameters, but it was very remarkable that i) their quality parameters were the same as those of the legumes without reaching their protein content; ii) they had intermediate and significantly different values from grasses and legumes in their Ca:P and K:(Ca + Mg) ratios; and iii) together with the grasses, they had the lowest values in the N:P and N:K ratios, and the highest in K:P ratios.
With respect to the differences between the four meadows, as seen in Table 5, we found (Table 6) significant differences in the ratios where P was involved (i.e., N:P and K:P) and in the N:K ratio. Meadow 3 had the highest N:P ratio, meadows 1 and 3 had different K:P ratios, and meadows 2 and 4 had different N:K ratios. For these ratios, the interaction between botanical groups and meadows was significant (marginal mean of legumes in meadow 4 reached an N:K value of 4.7).

4. Discussion

4.1. Species Diversity and Quality

The 34 species selected for this work had high total cover in the vegetation of the meadows studied, which presented high values of diversity and species richness. In 104 hay meadows located in the Aragonese Pyrenees, Reiné et al. [6] found, on average, 33 species and a Shannon diversity index of 2.55 within the central 100 m2 of the meadows. These values in the four meadows analyzed were above these averages. This high diversity could be the result of the environmental factors and the management of the meadows [2,9]. The meadows are located in the highest parts of the valley, far from the main farm building, so they receive less intensive management consisting of only one cutting which, as in other mountain areas, is usually quite late [9], and the only fertilization they receive is manure from the animals during the two grazing periods. These traditional management conditions, which are compatible with environmental conservation [14], allow this vegetation to be classified as habitats 6510 [34] and 6520 [35] of the directive 92/43/EEC (European Economic Community) in the Natura 2000 Network.
Any analysis of the nutritional quality of forage species which differ from those usually cultivated or known, must begin with knowledge of their palatability [46,47]. Table 2 shows the quality of these plants in grazing and evidence of their consumption by livestock. From the first parameter, we obtained information on 32 species and, from the second, on 25 species of the 34 studied. It was observed that some forage plants which have traditionally been assigned a value of zero quality were voluntarily selected for consumption by the animals, such that their palatability may be underestimated in the pastoral value method [40]. Of the nine species that did not appear in the list of Farruggia et al. [41], we also found evidence of grazing consumption for Cerastium fontanum [48], Anthyllis vulneraria [49], Chaerophyllum aureum [50], and Heracleum sphondylium [21].
Although none of the 34 plants have been listed as toxic to livestock [51,52], attention should be paid to their secondary compounds. These can have negative but also positive effects, both on the digestibility of forage and on animal production, depending on their intake and the biological activity in which they are involved. In the case of meadows, the grass is provided in the farm after haymaking or silage, without the animal being able to select the species in its ration (as in grazing), such that the nutritional quality of the species of the mown mixture must be considered. The detoxification of some of these secondary compounds can occur in the haymaking process of the grass, in the salivation process, and especially in the ruminal environment [53]. One should consider, for example, the oxalic acid content of Rumex acetosa, which can precipitate to calcium salts and cause kidney stone problems; the glycoside protoanemonine in Ranunculus acris, which irritates the gastrointestinal tract; or the sesquiterpene lactone content of Laserpitium latifolium [53,54]. Some of these effects can be mitigated by the low coverage of these species in the meadows and, therefore, their scarce contribution within a diverse ration of species, in which low concentrations of these compounds may even be beneficial [16,55].
Among the positive aspects of the secondary compounds, Ramírez-Restrepo and Barry [19] highlighted the control of internal parasites in cattle and of final methane emissions, as well as an increase in reproductive rates. Julier and Huyghe [17] pointed out the importance of condensed tannins from species such as Lotus corniculatus and Onobrychis viciifolia in improving protein digestion by reducing tympanism. Farruggia et al. [22] indicated the stimulation of ingestion and the contribution of unique organoleptic and nutritional characteristics to dairy and meat products. Lukac et al. [21] mentioned their benefits in the silage process: the high level of oxalic acid in Rumex acetosa causes a rapid decrease in pH and improves the lactic fermentation process, while the presence of Plantago lanceolata, in addition to giving a pleasant smell to the silage, maintains its quality over time through the content of aucubin glycoside, which inhibits protein degradation. The species Heracleum sphondylium, Sanguisorba minor, and Plantago lanceolata have shown inhibitory action on the activity of cellulolytic enzymes and can stimulate the activity of the rumen microbial population during the digestion process [16].
The individual chemical compositions of the plants analyzed (Table 2) were contrasted in a literature review [5,15,21,38,46,47,49,56,57,58,59,60,61,62,63,64,65,66,67,68]. Our results were in the range of variation of those presented by these authors, although the comparison should be made while taking into account the type of grassland, the management system, the climatic conditions, the degree of fertilization, the phenological state, and considering that some data were from experimental trials and that not all works used the same methods or the same parameters that we have considered. In the literature review, we did not find any chemical composition results for the species Centaurea scabiosa, Crepis pyrenaica, Laserpitium latifolium, Picris hieracioides, Rhinanthus pumilus, Salvia pratensis, or Tragopogon dubius. Our work is, therefore, original in this sense. The cited research showed wide inter-specific variation in the chemical variables analyzed, as well as intra-specific variation, due, in most cases, to repeated sampling over time. The present study is based on a single sampling moment for four meadows in the same environment and with the same productive management; despite this, it reflects high intra-specific variation in the results of the minerals P, K, Mg, Ca, and Na, much higher than in the rest of the nutritional variables analyzed (Table 4).

4.2. Feeding Evaluation

Fiber from forage is the main component of rations in most ruminant production systems. The maximum cell-wall concentration of diets that does not hinder intake and animal production can be as high as 70–75% NDF dry matter for mature beef cows and as low as 15–20% NDF for finishing ruminants [1]. In other words, their levels of incorporation into rations vary between margins well above the recommended levels of protein (11–18%) [42], crude fat (4–7%), and ash (8–10%) [69]. According to Linn and Martin [37], the RFV of half of the species analyzed was in the first category or higher. INRA [38], for permanent mountain meadows with dicotyledonous dominance, gave a reference value of 0.82 UFL (kg DM)−1 for early harvests, which dropped to 0.73 UFL (kg DM)−1 for late harvest and, for PDI in the same scenarios, the values are between 8.1% and 7.0% DM, respectively. According to these references and considering that the meadows considered were late mown, our species presented very good energy values of UFL and protein digestibility values (i.e., PDI). The approach to the nutritional quality of the species from two different procedures (RFV and UFL) was satisfactory, as the second allows for energetic quantification of the feed, which complements the classification made by the first. Both parameters had very similar and highly correlated results.
All the quality parameters indicated the nutritional value of the fodder of other forbs group to be comparable to legumes and superior to the grasses. Their protein and lignin contents were intermediate between grasses (low PDI and low ADL) and legumes (high PDI and high ADL), and had higher CF (Table 5 and Table 6; Figure 1, Figure 2 and Figure 3). These patterns of non-leguminous forbs were similar in the works of Wilman and Riley [15]; Jeangros et al. [60]; Marinas and García-González [61]; and Vázquez de Aldana et al. [64].
The grasses in our study did not show the nutritional potential that they have in monocultures or other permanent grasslands rich in competitive grasses [7,38,63], where fertilization significantly influences the N content and plant biomass in grasses, but not in legumes or in forbs [70]. The average difference in digestibility values of grasses can vary up to 80 g kg−1 between plant communities composed of species characteristic of nutrient-rich habitats and those characteristic of nutrient-poor habitats. For legumes, this average variation is only 20 g kg−1 [71]. If we add to this that their nutrient quality decreases with their phenological stage [26], it is normal that, in late-cutting meadows such as those considered in our study, grasses produce poor-quality forage. However, legumes can maintain their overall sward digestibility over a longer period, as their leaves and petioles are replaced as they mature. The presence of other non-leguminous forbs in a diverse sward might be expected to confer similar advantages by maintaining an active leaf growth [2].
Supporting this, the species that presented the highest values of RFV and UFL were three of the other forbs group–Taraxacum officinale, Sanguisorba minor, and Chaerophyllum aureum–in addition to the legume Lotus corniculatus (Figure 2 and Figure 3). Taraxacum officinale and Chaerophyllum aureum also had the highest values of digestible protein PDI, together with the legumes (Figure S1, Supplementary Data). The fodder quality values of Taraxacum officinale have already been pointed out in previous works [5,7,66]. Regarding Chaerophyllum aureum, Magda et al. [50] reported that it is palatable only at a very early stage, due to the concentration of lignified tissues in its shoots. Its ADL values in this work were not a limiting factor for its quality, as it had the third highest DDM value. The quality of Sanguisorba minor and Lotus corniculatus are perhaps more widely reported in the literature [5,17,20,39,72]. The non-leguminous forbs mentioned seemed to occupy, in the quality ranking of these meadows, positions that a priori should have been occupied by leguminous plants such as Onobrychis viciifolia, Vicia cracca, or even Trifolium pratense with recognized feed quality, and which are valued for their ability to grow in a symbiotic relationship with nitrogen-fixing bacteria, enabling them to have high PDI. Finally, we must also consider that some of these species, such as Heracleum sphondylium and Taraxacum officinale, have low DM content (Table 3), which can cause problems with forage conservation, especially losses during hay making; while these losses for grasses are much smaller as they have high DM content (Table 3 and Table 4).

4.3. Mineral Contents

The mineral value of forage in a meadow depends not only on the mineral content of each species, as conditioned by environmental and management factors [73], but also on the animal’s needs for these elements and their real absorption capacity [4]. Taking as reference the nutrient requirements of beef cattle [42], and knowing that requirements vary according to the animal categories, the optimal and toxic values of the concentrations of the different elements (g kg−1) in the forage are: P (3.5; >10), K (11.5; >30), Mg (1.4; >4), Ca (6.5; >20), and Na (1.0; no toxic data). Therefore, the species analyzed provide deficient levels of P, are adequate in K and Na, and are high in Mg and Ca. P deficiency reduces growth and milk production and impairs reproduction [42]. P deficiency values in forage have been described in lowland semi-natural species-rich grasslands [23], in meadows from the order Arrhenatheretalia [73], in unfertilized mountain pastures [70], and in Pyrenean summer pastures [61]. In meadows with agricultural management that includes fertilization, P deficiency does not exist [59,74,75]. It should be remembered that the soils of the four grasslands studied had very low P content (Table 1), although, according to Bowman et al. [76], caution should be used in estimating soil fertility and specific nutrient limitations of growth based on foliar nutrient concentrations in herbaceous communities. With respect to Ca and Mg values above the toxicity limits, five species presented them for Ca and seven species for Mg; however, their effects on animal nutrition would be diluted by feeding these species mixed with others in a balanced ration (Table 2). In addition, the average Ca and Mg content of each meadow were below the limit values (Table 5).
Non-leguminous forbs presented higher content than grasses and legumes in Mg, K, and Na, as well as intermediate content in Ca. The P content was similar as that in legumes, but higher than that of the grasses, being the only mineral that presented differences among the four meadows; probably originating from the differential P content in the soil (Table 1 and Table 5; Figure 1). In general, non-legume forbs had greater macro-mineral concentrations than grasses and legumes [2,8,18,59,68,74,77]. Comparisons between mineral contents of grasses and legumes are generally favorable to the latter [62].
The ratio of dietary minerals in animal diets sometimes plays a more important role than the content of individual elements. This is the case for the ratios Ca:P and K:(Ca + Mg). Inadequate ratios can lower the availability, absorption, and utilization of those elements [68]. According to NRC [42], the optimal range for the Ca:P ratio is between one and seven, in order to maintain optimal ruminant performance, depending on animal categories. Above this range, metabolic disorders may arise. In our case, 15 of the 34 species studied had values above the optimum (Figure 4). Although some forb values were above the maximum level, it was the legume group which had the highest ratios (Table 6). Grasses, however, had the lowest values (Figure 4). In the data reviewed, we only found this situation in some species of the other forbs group, in the study by Borsworth et al. [46]. Most of the studies reviewed provided values within the optimal range [68,74,75,78]. When the ratio values are as high as in our work, dietary P supplementation should be considered for cattle [78]. This would be a better solution than trying to apply phosphate fertilizers on this type of meadow, as they typically have no effect on the mineral content of the forage [4], in addition to other adverse consequences on the specific richness and biodiversity of the meadows [9,12] directly related to low soil phosphorus levels [23,79,80]. The maximum tolerable K:(Ca + Mg) ratio is 2.2 [42]. Above this ratio, cattle at risk of grass tetany occur when plants are growing rapidly in the spring, at the time of heavy lactation demand by ruminants for Mg and Ca [43]. All our species were below this critical level (Figure S2, Supplementary Material), certainly due to the ability of dicotyledonous plants to accumulate high concentrations of Ca and Mg [67], where the grass group came closest to it (Table 6).
The species that stood out for their mineral content were Taraxacum officinale, Chaerophyllum aureum, Heracleum sphondylium, Silene vulgaris, and Galium verum. According to NRC [42], the first three species showed very high Mg and Ca content. For the first two, we have already referred to their high RFV, UFL, and PDI. Heracleum sphondylium also presented good PDI content and its Ca:P ratio was within the optimal range; it has been previously considered to be of high feed value [7]. However, for others [9,50] this Umbelliferae is undesirable, more for its capacity to become dominant in the meadow vegetation in certain environments (postponing cuttings in the summer causes the full maturation of seeds and their dissemination) than for its bromatological composition. In the meadows studied, their cover is reduced (Table 2) and their nutritional quality is remarkable (Table 3). We have not found references on the quality of Silene vulgaris and Galium verum, except for their good CP values in the study by Macheboeuf et al. [5]. Other species to be mentioned, although they did not show as much mineral content, are Sanguisorba minor and Plantago lanceolata. Pirhofer-Walzl et al. [18] mentioned how they are typically included in seed mixtures to provide herbage with greater concentrations of most macro-minerals and some micro-minerals than those of grasses and forage legumes. Plantago lanceolata has been noted, in the work of Wilman and Riley [15], for its high Na content.

4.4. N:P Ratio

N:P ratio indicates, according to several authors [44,45], the type of nutrient limitation in the vegetal community: an N:P ratio < 14 is indicative of N limitation; for ratios between 14 and 16, either N or P can be limiting or plant growth is co-limited by N and P together; and a N:P ratio > 16 indicates P limitation. In our case, most species would be considered N-limited, except for the legumes Lotus corniculatus, Trifolium pratense, Anthyllis vulneraria, and Vicia cracca, which lay in the intermediate range between 14 and 16 (Figure S3, Supplementary Data). For these cases of uncertainty, Olde Venterink et al. [81], based on the N:P ratio and including the mineral K, developed a new classification according to these critical ratios: (1) N-limited sites, N:P < 14.5 and N:K < 2.1; (2) P- or P + N-limited sites, N:P > 14.5 and K:P > 3.4; and (3) K- or K + N-limited sites, N:K > 2.1 and K:P < 3.4. Following these criteria, the four legumes mentioned indicated growth in sites with N and P limitations, while the other species indicated, as we have said above, N-limited sites; none of the plants studied indicated K or K + N-limited sites. In extensively managed meadows, such as those we have studied, the species are typically classified as N-limited [70,82]. Agricultural management with low inputs, which ultimately translates into low soil phosphorus availability, appears to be a key factor in allowing the maintenance of high species-richness [23]. In a fertilization trial [11], the variation of N:P ratio was studied in 10 species of a meadow, four common to our study: Agrostis capillaris, Lotus corniculatus, Plantago lanceolate, and Sanguisorba minor. They described how species without nitrogen treatments are found in N:P < 14 and, with doses of 140 kg N ha−1, shifted to N:P > 16; except in the case of legumes. We also note that there have been other authors who pointed out that N:P ratios were useful for suggesting N or P limitation of growth for only one of three species studied [76].
N-enrichment has been considered as a major cause of plant species loss in temperate grasslands [10]. Deposition of N causes grassland soils to lose their total available bases (Ca, Mg, K, and Na) and become acidified [11], increasing aboveground biomass production and, thus, increasing competition for light, supporting the exclusion of less competitive species [12]. Stevens et al. [10] pointed out, as an example, the disappearance of Plantago lanceolata from the vegetation of the grasslands as a consequence of N enrichment. However, other authors have indicated that many more endangered plant species persist under P-limited than under N-limited conditions and conclude that enhanced P is more likely to be the cause of species loss than N enrichment [83]. For these authors, the endangered species only occurred at low-productivity sites (biomass < 600 g m−2) and in P-limited sites; in our study only the second of the two conditions was found in the four legumes reviewed. In this line, Ceulemans et al. [79] considered that, independent of the level of atmospheric N deposition and soil acidity, plant species richness was consistently negatively related to soil P. For them, the soil levels at which the loss of specific richness occurs in the community were 104–130 mg P kg−1, well above those values in our meadows. These same authors, in another paper, suggested that the relative abundance of grassland plant species can be influenced by soil P forms, as higher richness has been linked to higher acquisition of a specific form of P [80].

5. Conclusions

The nutritional value of the hay meadows studied, was due to a good number of dicotyledonous species that, until recently, have been considered to be indifferent (or even harmful) to the bromatological quality of the fodder offered in the farm. These species were also responsible for the floristic diversity of these plant communities, included in Directive 92/43/EEC for their conservation. Due to their fiber quality, high digestibility, and high energy value, we highlight Taraxacum officinale, Sanguisorba minor, Chaerophyllum aureum, and the legume Lotus corniculatus; for their high mineral contents Taraxacum officinale, Chaerophyllum aureum, Heracleum sphondylium, Silene vulgaris, and Galium verum are also highlighted.
Non-leguminous forbs, despite not reaching the PDI of legumes, have less ADL and more CF than the latter. In terms of the other quality parameters, they were on par with legumes and much higher than grasses. The quality of grasses is unquestionable as fodder crops but, in more intensified permanent grasslands, it can be affected by the late cutting of the vegetation in these meadows. Mineral content, in terms of macro-nutrients, was adequate for animal nutrition; except for P, which was low in all species. Non-leguminous forbs had higher content than grasses and legumes in Mg, K, and Na, as well as intermediate Ca content. The content of these minerals in plants presented much greater intra-specific variation than that obtained in the rest of the nutritional variables analyzed.
The Ca:P ratio was higher than adequate in half of the species analyzed, due to the deficiencies of the second element, while the K:(Ca + Mg) ratio was appropriate for all species. The ratios between the elements N, P, and K indicated that most of the species studied grew under N-limited conditions; only four legume species could be considered as indicators also of P-limited sites. These results suggest that the current low-input management conditions are adequate for the conservation of these species.

Supplementary Materials

The following are available online at https://www.mdpi.com/2073-4395/10/6/883/s1, Figure S1: PDI (“protéines digestibles dans l’intestin”), digestible crude proteins in the gut, expressed in % DM, of the 34 species analyzed (median values, maximum and minimum), calculated according to INRA [38] procedures. Figure S2: K:(Ca+Mg) ratio of the 34 species analyzed (median values, maximum and minimum). Red line indicates species with K:(Ca+Mg) ≥ 2.2, which can cause grass tetany according to Grunes and Welch [43] and NCR [42]. Figure S3: N:P ratio of the 34 species analyzed (median values, maximum and minimum). Red line indicates species with N:P ratio < 14, which is indicative of N nutrient limitation according to Koerselman and Meuleman [44] and Aerts and Chapin [45].

Author Contributions

All authors have contributed to the different components of the work. All authors have read and agreed to the published version of the manuscript.

Funding

This work has been funded by the SOS Praderas project within the Interreg Sudoe Program 2014–2020 (European Regional Development Fund, ERDF) through the Department of Rural Development and Sustainability of the Government of Aragon.

Acknowledgments

The authors would like to thank Carlos Ferrer for the idea and dedication to this and other shared research and Alfonso Broca for his laboratory work.

Conflicts of Interest

The authors declare no conflict of interest.

References

  1. Buxton, D.R. Quality-related characteristics of forages as influenced by plant environment and agronomic factors. Anim. Feed. Sci. Technol. 1996, 59, 37–49. [Google Scholar] [CrossRef]
  2. Hopkins, A.; Holz, B. Grassland for agriculture and nature conservation: production, quality and multi-functionality. Agron. Res. 2006, 4, 3–20. [Google Scholar]
  3. Baumont, R.; Aufrère, J.; Niderkorn, V.; Andueza, D.; Surault, F.; Peccatte, J.R.; Delaby, L.; Pelletier, P. La diversité spécifique dans le fourrage: conséquences sur la valeur alimentaire. Fourrages 2008, 194, 189–206. Available online: https://www.researchgate.net/publication/273770331_La_diversite_specifique_dans_le_fourrage_consequences_sur_la_valeur_alimentaire (accessed on 9 May 2020).
  4. Baumont, R.; Aufrere, J.; Meschy, F. La valeur alimentaire des fourrages: rôle des pratiques de culture, de récolte et de conservation. Fourrages 2009, 198, 153–173. Available online: https://www.researchgate.net/publication/281798330_La_valeur_alimentaire_des_fourrages_role_des_pratiques_de_culture_de_recolte_et_de_conservation (accessed on 9 May 2020).
  5. Macheboeuf, D.; Coudert, L.; Bergeault, R.; Lalière, G.; Niderkorn, V. Screening of plants from diversified natural grasslands for their potential to combine high digestibility, and low methane and ammonia production. Animal 2014, 8, 1797–1806. [Google Scholar] [CrossRef]
  6. Reiné, R.; Barrantes, O.; Chocarro, C.; Juárez, A.; Broca, A.; Maestro, M.; Carlos, F.; Juárez-Escario, A. Pyrenean meadows in Natura 2000 network: grass production and plant biodiversity conservation. Span. J. Agric. Res. 2014, 12, 61. [Google Scholar] [CrossRef] [Green Version]
  7. Andueza, D.; Rodrigues, A.M.; Picard, F.; Rossignol, N.; Baumont, R.; Cecato, U.; Farruggia, A. Relationships between botanical composition, yield and forage quality of permanent grasslands over the first growth cycle. Grass Forage Sci. 2015, 71, 366–378. [Google Scholar] [CrossRef]
  8. Schlegel, P.; Wyss, U.; Arrigo, Y.; Hess, H. Mineral concentrations of fresh herbage from mixed grassland as influenced by botanical composition, harvest time and growth stage. Anim. Feed. Sci. Technol. 2016, 219, 226–233. [Google Scholar] [CrossRef] [Green Version]
  9. Pierik, M.E.; Gusmeroli, F.; Della Marianna, G.; Tamburini, A.; Bocchi, S. Meadows species composition, biodiversity and forage value in an Alpine district: Relationships with environmental and dairy farm management variables. Agric. Ecosyst. Environ. 2017, 244, 14–21. [Google Scholar] [CrossRef]
  10. Stevens, C.J.; Dise, N.B.; Mountford, J.O.; Gowing, D.J.G. Impact of Nitrogen Deposition on the Species Richness of Grasslands. Science 2004, 303, 1876–1879. [Google Scholar] [CrossRef] [Green Version]
  11. Horswill, P.; O’Sullivan, O.; Phoenix, G.K.; Lee, J.A.; Leake, J.R. Base cation depletion, eutrophication and acidification of species-rich grasslands in response to long-term simulated nitrogen deposition. Environ. Pollut. 2008, 155, 336–349. [Google Scholar] [CrossRef] [PubMed]
  12. Hejcman, M.; Sochorová, L.; Pavlů, V.; Štrobach, J.; Diepolder, M.; Schellberg, J. The Steinach Grassland Experiment: Soil chemical properties, sward height and plant species composition in three cut alluvial meadow after decades-long fertilizer application. Agric. Ecosyst. Environ. 2014, 184, 76–87. [Google Scholar] [CrossRef]
  13. Schwab, A.; Dubois, D.; Fried, P.M.; Edwards, P.J. Estimating the biodiversity of hay meadows in north-eastern Switzerland on the basis of vegetation structure. Agric. Ecosyst. Environ. 2002, 93, 197–209. [Google Scholar] [CrossRef]
  14. Keenleyside, C.; Beaufoy, G.; Tucker, G.; Jones, G. High Nature Value Farming throughout EU-27 and Its Financial Support under the CAP. Report Prepared for DG Environment, Contract No ENV B.1/ETU/2012/0035; Institute for European Environmental Policy: London, UK, 2014; Available online: https://ieep.eu/uploads/articles/attachments/2e7adcbd-ba75--44db-89e6--0e1669076607/HNV_and_CAP_Full_Report.pdf?v=63664509849 (accessed on 9 May 2020).
  15. Wilman, D.; Riley, J.A. Potential nutritive value of a wide range of grassland species. J. Agric. Sci. 1993, 120, 43–50. [Google Scholar] [CrossRef]
  16. Scehovic, J. Effets de quelques plantes de prairies permanentes sur la qualité des associations végétales. Rev. Suisse Agric. 2000, 32, 195–200. Available online: https://abiodoc.docressources.fr/index.php?lvl=bulletin_display&id=24663 (accessed on 9 May 2020).
  17. Julier, B.; Huyghe, C. Quelles légumineuses fourragères (espèces et variétés) et quelles conduits pour améliorer l’autonomie protéique des élevages herbivores? Innov. Agron. 2010, 11, 101–114. Available online: https://prodinra.inra.fr/?locale=en#!ConsultNotice:173318 (accessed on 9 May 2020).
  18. Walzl, K.P.; Søegaard, K.; Jensen, H.H.; Eriksen, J.; Sanderson, M.A.; Rasmussen, J. Forage herbs improve mineral composition of grassland herbage. Grass Forage Sci. 2011, 66, 415–423. [Google Scholar] [CrossRef] [Green Version]
  19. Ramírez-Restrepo, C.; Barry, T. Alternative temperate forages containing secondary compounds for improving sustainable productivity in grazing ruminants. Anim. Feed. Sci. Technol. 2005, 120, 179–201. [Google Scholar] [CrossRef]
  20. Hammond, K.; Humphries, D.; Westbury, D.; Thompson, A.; Crompton, L.; Kirton, P.; Green, C.; Reynolds, C.K. The inclusion of forage mixtures in the diet of growing dairy heifers: Impacts on digestion, energy utilisation, and methane emissions. Agric. Ecosyst. Environ. 2014, 197, 88–95. [Google Scholar] [CrossRef]
  21. Lukac, B.; Kramberger, B.; Meclic, V.; Verbic, J. Importance of non-leguminous forbs in animal nutrition and their ensiling properties: a review. Žemdirbyst Agric. 2012, 99, 3–8. Available online: http://www.lzi.lt/tomai/99(1)tomas/99_1_tomas_str1.pdf (accessed on 9 May 2020).
  22. Farruggia, A.; Martin, B.; Baumont, R.; Prache, S.; Doreau, M.; Hoste, H.; Durand, D. Quels intérêts de la diversité floristique des prairies permanentes pour les ruminants et les produits animaux? INRA Prod. Anim. 2008, 21, 181–200. [Google Scholar] [CrossRef]
  23. Tallowin, J.R.B.; Jefferson, R.G. Hay production from lowland semi-natural grasslands: A review of implications for ruminant livestock systems. Grass Forage Sci. 1999, 54, 99–115. [Google Scholar] [CrossRef]
  24. Sturludóttir, E.; Brophy, C.; Belanger, G.; Gustavsson, A.-M.; Jørgensen, M.; Lunnan, T.; Helgadottir, A. Benefits of mixing grasses and legumes for herbage yield and nutritive value in Northern Europe and Canada. Grass Forage Sci. 2013, 69, 229–240. [Google Scholar] [CrossRef] [Green Version]
  25. Dumont, B.; Garel, J.P.; Ginane, C.; Decuq, F.; Farruggia, A.; Pradel, P.; Rigolot, C.; Petit, M. Effect of cattle grazing a species-rich mountain pasture under different stocking rates on the dynamics of diet selection and sward structure. Animal 2007, 1, 1042–1052. [Google Scholar] [CrossRef] [PubMed] [Green Version]
  26. Elgersma, A.; Søegaard, K. Changes in nutritive value and herbage yield during extended growth intervals in grass-legume mixtures: effects of species, maturity at harvest, and relationships between productivity and components of feed quality. Grass Forage Sci. 2017, 73, 78–93. [Google Scholar] [CrossRef]
  27. Lourenço, A.; Dias-Da-Silva, A.; Santos, A.S.; Rodrigues, M.; Cone, J.W.; Ferreira, L.M.M. Comparative digestibility of low-quality grass hay by two breeds of cattle differing in mature live weight. J. Anim. Physiol. Anim. Nutr. 2013, 98, 453–457. [Google Scholar] [CrossRef]
  28. Ascaso, J.; Reiné, R.; Barrantes, O. Evolution of Hay Meadows between 1956, 1986, and 2016 and Its Relation to the Characteristics and Location of the Parcels in the Valley of the River Esera (Pyrenees, Spain). Agron. Basel 2020, 10, 329. [Google Scholar] [CrossRef] [Green Version]
  29. García-Serrano, P.; Criado, S.R.; Marotta, J.J.L.; García, M.N. Guía Práctica de la Fertilización Racional de los Cultivos en Españai; Ministerio de Medio Ambiente y Medio Rural y Marino: Madrid, Spain, 2010; pp. 1–119. ISBN 978-84-491-0997-3. [Google Scholar]
  30. Braun-Blanquet, J. Plant Sociology—The Study of Plant Communities; Hafner Publishing Company: New York, NY, USA, 1965; pp. 1–439. ISBN 9783874292085. [Google Scholar]
  31. Maabel, E. Transformation of cover-abundance values in phytosociology and its effects on community similarity. Vegetatio 1979, 39, 97–114. [Google Scholar] [CrossRef]
  32. Magurran, A.E. Ecological Diversity and Its Measurement; Chapman & Hall: London, UK, 1988; ISBN 978-94-015-7360-3. [Google Scholar]
  33. Castroviejo, S. Flora Iberica. Plantas Vasculares de la Península Ibérica e Islas Baleares; Volumes I–XV, XVI (I), XVII–XVIII y XX–XXI; Real Jardín Botánico C.S.I.C.: Madrid, Spain, 1986–2015; Available online: http://www.floraiberica.es/ (accessed on 9 May 2020).
  34. Reiné, R.; Ascaso, J.; Ferrer, C.; Yera, J.; Chocarro, C. 6510 Prados de Siega de Montaña (Arrhenatherion). In Bases Ecológicas Preliminares Para la Conservación de los Tipos de Hábitat de Interés Comunitario en España; Hidalgo, R., Ed.; Ministerio de Medio Ambiente y Medio Rural y Marino: Madrid, Spain, 2009; pp. 1–60. Available online: https://www.miteco.gob.es/es/biodiversidad/temas/espacios-protegidos/6510_tcm30-196853.pdf (accessed on 9 May 2020).
  35. Chocarro, C.; Reiné, R.; Ascaso, J.; Yera, J.; Ferrer, C. 6520 Prados de Siega de Montaña (Triseto-Polygonion bistortae). In Bases Ecológicas Preliminares Para la Conservación de los Tipos de Hábitat de Interés Comunitario en España; Hidalgo, R., Ed.; Ministerio de Medio Ambiente y Medio Rural y Marino: Madrid, Spain, 2009; pp. 1–48. Available online: https://www.miteco.gob.es/es/biodiversidad/temas/espacios-protegidos/6520_tcm30-196854.pdf (accessed on 9 May 2020).
  36. Van Soest, P.; Robertson, J.; Lewis, B. Methods for Dietary Fiber, Neutral Detergent Fiber, and Nonstarch Polysaccharides in Relation to Animal Nutrition. J. Dairy Sci. 1991, 74, 3583–3597. [Google Scholar] [CrossRef]
  37. Linn, J.G.; Martin, N.P. Forage Quality Tests and Interpretations (Revised 1989); Univ. Minnesota, Agricultural Extension Service: 1989. Retrieved from the University of Minnesota Digital Conservancy. Available online: https://conservancy.umn.edu/handle/11299/207442 (accessed on 9 May 2020).
  38. INRA. Alimentation des Ruminants; Éditions Quæ: Versailles, France, 2018; pp. 1–728. ISBN 9782759228683. [Google Scholar]
  39. Roggero, P.P.; Bagella, S.; Farina, R. Un archivio dati di Indici specifici per la valutazione integrata del valore pastorale. Riv. Agron. 2002, 36, 149–156. Available online: http://eprints.uniss.it/4121/ (accessed on 9 May 2020).
  40. Daget, P.H.; Poissonet, T. Analyse Phytologique des Prairies. Applications Agronomiques; Centre d’Etudes Phytosociologiques et Écologiques (CNRS), Document 48: Montpellier, France, 1969; pp. 1–134. [Google Scholar]
  41. Farruggia, A.; Pompanon, F.; Ginane, C.; Vazeille, K.; Niderkorn, V.; Hulin, S. Reconstituer la composition du régime alimentaire des herbivores domestiques au pâturage: l’approche par métabarcoding. Fourrages 2012, 209, 43–51. Available online: https://afpf-asso.fr/article/reconstituer-la-composition-du-regime-alimentaire-des-herbivores-domestiques-au-paturage-l-approche-par-metabarcoding (accessed on 9 May 2020).
  42. National Research Council (NRC). Nutrient Requirements of Beef Cattle, 7th ed.; National Academic Science: Washington, DC, USA, 2000. [Google Scholar] [CrossRef] [Green Version]
  43. Grunes, D.L.; Welch, R.M. Plant Contents of Magnesium, Calcium and Potassium in Relation to Ruminant Nutrition. J. Anim. Sci. 1989, 67, 3485. [Google Scholar] [CrossRef] [PubMed]
  44. Koerselman, W.; Meuleman, A.F.M. The Vegetation N:P Ratio: A New Tool to Detect the Nature of Nutrient Limitation. J. Appl. Ecol. 1996, 33, 1441. [Google Scholar] [CrossRef]
  45. Aerts, R.; Chapin, F.; Chapin, F.S. The Mineral Nutrition of Wild Plants Revisited: A Re-evaluation of Processes and Patterns. In Advances in Ecological Research; Fitter, A.H., Raffaelli, D.G., Eds.; Elsevier Academic Press: San Diego, CA, USA, 2000; pp. 1–66. [Google Scholar] [CrossRef]
  46. Bosworth, S.C.; Hoveland, C.S.; Buchanan, G.A.; Anthony, W.B. Forage Quality of selected Warm−Season Weed Species1. Agron. J. 1907, 72, 1050–1054. [Google Scholar] [CrossRef]
  47. Bosworth, S.C.; Hoveland, C.S.; Buchanan, G.A. Forage Quality of Selected Cool-Season Weed Species. Weed Sci. 1986, 34, 150–154. [Google Scholar] [CrossRef]
  48. Salt, C.A.; Mayes, R.W.; Elston, D.A. Effects of Season, Grazing Intensity and Diet Composition on the Radiocaesium Intake by Sheep on Re-Seeded Hill Pasture. J. Appl. Ecol. 1992, 29, 378. [Google Scholar] [CrossRef]
  49. Marinas, A.; González, R.G.; Fondevila, M. The nutritive value of five pasture species occurring in the summer grazing ranges of the Pyrenees. Anim. Sci. 2003, 76, 461–469. [Google Scholar] [CrossRef] [Green Version]
  50. Magda, D.; Theau, J.P.; Duru, M.; Coléno, F.-C. Hay-Meadows Production and Weed Dynamics as Influenced by Management. J. Range Manag. 2003, 56, 127. [Google Scholar] [CrossRef]
  51. Cortinovis, C.; Caloni, F. Epidemiology of intoxication of domestic animals by plants in Europe. Vet. J. 2013, 197, 163–168. [Google Scholar] [CrossRef]
  52. Cortinovis, C.; Caloni, F. Alkaloid-Containing Plants Poisonous to Cattle and Horses in Europe. Toxins 2015, 7, 5301–5307. [Google Scholar] [CrossRef] [Green Version]
  53. Ramos, G.; Frutos, P.; Giráldez, F.J.; Mantecón, A.R. Los compuestos secundarios de las plantas en la nutrición de los herbívoros. Arch. Zootec. 1998, 47, 597–620. Available online: https://digital.csic.es/bitstream/10261/8179/1/Mantecon%20et%20al.%201998%20Regs.%20198.pdf (accessed on 9 May 2020).
  54. Moldt, P.; Smitt, U.W.; Christensen, S.B. A New Sesquiterpene from Laserpitium latifolium. J. Nat. Prod. 1987, 50, 974–975. [Google Scholar] [CrossRef]
  55. Sostaric, K.; Kovacevic, J. La méthode “Complexe” pour la determination de la qualité et de la valeur globale des herbages et des prairies temporaires. Fourrages 1974, 60, 3–25. Available online: https://afpf-asso.fr/index.php?secured_download=2408&token=1c7eb1b12c5ed7189d725ef997c06504 (accessed on 9 May 2020).
  56. Benton, J.J.; Wolf, B.; Mills, H.A. Plant Analysis Handbook; Micro-Macro Publishing Inc.: Georgia, USA, 1991; p. 213. ISBN 1-878148-001. [Google Scholar]
  57. Vázquez-De-Aldana, B.R.; Ciudad, G.; Corona, M.E.P.; Criado, G. Nutritional quality of semi-arid grassland in western Spain over a 10-year period: changes in chemical composition of grasses, legumes and forbs. Grass Forage Sci. 2000, 55, 209–220. [Google Scholar] [CrossRef] [Green Version]
  58. Daccord, R.; Arrigo, Y.; Jeangros, B.; Scehovic, J.; Schubiger, F.X.; Lehmann, J. Valeur nutritive des plantes de prairies. 2: Teneurs en constituants pariétaux. Rev. Suisse Agric. 2001, 33, 81–86. Available online: https://www.agrarforschungschweiz.ch/fr/2001/04/valeur-nutritive-des-plantes-des-prairies-teneurs-en-constituants-parietaux/ (accessed on 9 May 2020).
  59. Daccord, R.; Arrigo, Y.; Kessler, J.; Jeangros, B.; Scehovic, J. Valeur nutritive des plantes de prairies. 3. Teneurs en calcium, phosphore, magnésium et potassium. Agrarforschung 2001, 8, 264–269. Available online: https://www.agrarforschungschweiz.ch/fr/2001/07/valeur-nutritive-des-plantes-des-prairies-teneurs-en-calcium-phosphore-magnesium-et-potassium/ (accessed on 9 May 2020).
  60. Jeangros, B.; Scehovic, J.; Schubiger, F.X.; Lehmann, J.; Daccord, R.; Arrigo, Y. Valeur nutritive des plantes de prairies. 1. Teneurs en matière sèche, matière azotée et sucres. Rev. Suisse Agric. 2001, 33, 73–80. Available online: https://www.agrarforschungschweiz.ch/fr/2001/02/valeur-nutritive-des-plantes-des-prairies-teneurs-en-matiere-seche-matiere-azotee-et-sucres/ (accessed on 9 May 2020).
  61. Marinas, A.; García González, R. Preliminary data on nutritional value or abundant species in supraforestal Pyrenean pastures. Pirineos 2006, 161, 85–109. Available online: http://pirineos.revistas.csic.es/index.php/pirineos/article/view/4/4 (accessed on 9 May 2020). [CrossRef]
  62. Juknevičius, S.; Sabienė, N. The content of mineral elements in some grasses and legumes. Ekologija 2007, 53, 44–52. Available online: http://www.gamtostyrimai.lt/uploads/publications/docs/651_05583b61a61c467113d137f303ecf9c1.pdf (accessed on 9 May 2020).
  63. Pontes, L.; Carrère, P.; Andueza, D.; Louault, F.; Soussana, J.-F. Seasonal productivity and nutritive value of temperate grasses found in semi-natural pastures in Europe: responses to cutting frequency and N supply. Grass Forage Sci. 2007, 62, 485–496. [Google Scholar] [CrossRef]
  64. Vázquez de Aldana, B.R.; García-Ciudad, A.; García-Criado, B. Relación Entre Compuestos Fenólicos Y Calidad Nutritiva en Especies Pratenses. In La Multifuncionalidad de Los Pastos: Producción Ganadera Sostenible Y Gestión de Los Ecosistemas; Reiné, R., Barrantes, O., Broca, A., Ferrer, C., Eds.; Sociedad Española para el Estudio de los Pastos: Huesca, Spain, 2009; pp. 273–278. ISBN 978-84-612-9337-7. [Google Scholar]
  65. Peláez, R.; Andrés, S.; Valdés, C.; García, R.; Calleja, A. Valor Alimenticio de Especies Productivas en Prados de Montaña. In Pastos, Paisajes Culturales Entre Tradición Y Nuevos Paradigmas del Siglo XXI; López-Carrasco, C., Rodríguez Rojo, M.P., San Miguel Ayanz, A., Fernández González, F., Roig Gómez, S., Eds.; Sociedad Española para el Estudio de los Pastos: Toledo, Spain, 2011; pp. 325–330. ISBN 978-84-614-8713-4. [Google Scholar]
  66. Vondrášková, B.; Čermák, B.; Martinkova, L.; Brouček, J. Examination of the nutritional quality of forbs from mountainous pastures in the Southwestern Bohemia region. Ekológia (Bratislava) 2012, 31, 231–237. [Google Scholar] [CrossRef]
  67. Grzegorczyk, S.; Alberski, J.; Olszewska, M. Accumulation of potassium, calcium and magnesium by selected species of grassland legumes and herbs. J. Elem. 2012, 18, 69–78. [Google Scholar] [CrossRef]
  68. Grzegorczyk, S.; Alberski, J.; Olszewska, M.; Grabowski, K.; Bałuch-Małecka, A. Content of calcium and phosphorus and the Ca:P ratio is selected species of leguminous and herbaceous plants. J. Elem. 2017, 22, 663–669. [Google Scholar] [CrossRef]
  69. Calsamiglia, A.; Ferret, A.; Bach, A. Tablas FEDNA de Valor Nutritivo de Forrajes y Subproductos Fibrosos Húmedos; Fundación para el Desarrollo de la Nutrición Animal: Madrid, Spain, 2016; Available online: http://www.fundacionfedna.org/forrajes/introducci%C3%B3n-forrajes (accessed on 9 May 2020).
  70. Kacorzyk, P.; Głąb, T. Effect of ten years of mineral and organic fertilization on the herbage production of a mountain meadow. J. Elem. 2016, 22, 219–233. [Google Scholar] [CrossRef]
  71. Duru, M. Leaf and Stem In Vitro Digestibility for Grasses and Dicotyledons of Meadow Plant Communities in Spring. J. Sci. Food Agric. 1997, 74, 175–185. [Google Scholar] [CrossRef]
  72. Elgersma, A.; Søegaard, K.; Marker, S. Herbage dry-matter production and forage quality of three legumes and four non-leguminous forbs grown in single-species stands. Grass Forage Sci. 2013, 69, 705–716. [Google Scholar] [CrossRef] [Green Version]
  73. Wyłupek, T.; Harkot, W.; Czarnecki, Z. The content of selected macroelements in the dry weight of permanent grassland sward, grass yields and its agricultural value. J. Elem. 2014, 19, 853–864. [Google Scholar] [CrossRef]
  74. Kuusela, E. Annual and seasonal changes in mineral contents (Ca, Mg, P, K and Na) of grazed clover-grass mixtures in organic farming. Agric. Food Sci. 2008, 15, 23–34. [Google Scholar] [CrossRef]
  75. Grzegorczyk, S.; Olszewska, M.; Grabowski, K. Content of potassium, calcium, magnesium, phosphorus and sodium in meadow sward irrigated with wastewater. J. Elem. 2019, 25, 249–257. [Google Scholar] [CrossRef]
  76. Bowman, W.D.; Bahn, L.; Damm, M. Alpine Landscape Variation in Foliar Nitrogen and Phosphorus Concentrations and the Relation to Soil Nitrogen and Phosphorus Availability. Arct. Antarct. Alp. Res. 2003, 35, 144–149. [Google Scholar] [CrossRef] [Green Version]
  77. García-Ciudad, A.; Ruano-Ramos, A.; Vázquez-De-Aldana, B.R.; García-Criado, B. Interannual variations of nutrient concentrations in botanical fractions from extensively managed grasslands. Anim. Feed. Sci. Technol. 1997, 66, 257–269. [Google Scholar] [CrossRef]
  78. Gao, X.; Hao, X.; Marchbank, D.H.; Beck, R.; Willms, W.D.; Zhao, M. Responses of herbage P, Ca, K and Mg content and Ca/P and K/(Ca + Mg) ratios to long-term continuous and discontinued cattle grazing on a rough fescue grassland. Grass Forage Sci. 2016, 72, 581–589. [Google Scholar] [CrossRef]
  79. Ceulemans, T.; Stevens, C.J.; Duchateau, L.; Jacquemyn, H.; Gowing, D.J.G.; Merckx, R.; Wallace, H.; Van Rooijen, N.; Goethem, T.; Bobbink, R.; et al. Soil phosphorus constrains biodiversity across European grasslands. Glob. Chang. Boil. 2014, 20, 3814–3822. [Google Scholar] [CrossRef] [PubMed]
  80. Ceulemans, T.; Bodé, S.; Bollyn, J.; Harpole, W.S.; Coorevits, K.; Peeters, G.; Van Acker, K.; Smolders, E.; Boeckx, P.; Honnay, O.; et al. Phosphorus resource partitioning shapes phosphorus acquisition and plant species abundance in grasslands. Nat. Plants 2017, 3, 16224. [Google Scholar] [CrossRef] [PubMed]
  81. Venterink, H.O.; Wassen, M.J.; Verkroost, A.W.M.; De Ruiter, P.C. Species richness-productivity patterns differ between N-, P-, and K-limited wetlands. Ecology 2003, 84, 2191–2199. [Google Scholar] [CrossRef]
  82. Pavlů, L.; Pavlů, V.; Gaisler, J.; Hejcman, M. Relationship between soil and biomass chemical properties, herbage yield and sward height in cut and unmanaged mountain hay meadow (Polygono–Trisetion). Flora Morphol. Distrib. Funct. Ecol. Plants 2013, 208, 599–608. [Google Scholar] [CrossRef]
  83. Wassen, M.J.; Venterink, H.O.; Lapshina, E.; Tanneberger, F. Endangered plants persist under phosphorus limitation. Nature 2005, 437, 547–550. [Google Scholar] [CrossRef]
Figure 1. Ordination diagram showing the results of principal component analysis (PCA) of plant species data in relation to the chemical composition parameters. The X-axis (Component 1) explains 55% of the variance, while the Y-axis (Component 2) explains 20%. CP = crude protein. CF = crude fat; Hem = hemicellulose; Cel = cellulose; NDF = neutral detergent fiber; ADF = acid detergent fiber; P = phosphorus; Mg = magnesium; K = potassium; Ca = calcium; and Na = sodium. The numbers next to the symbols refer to the species names: 1, Achillea millefolium; 2, Agrostis capillaris; 3, Anthyllis vulneraria; 4, Arrhenatherum elatius; 5, Centaurea nigra; 6, Centaurea scabiosa; 7, Cerastium fontanum; 8, Chaerophyllum aureum; 9, Crepis pyrenaica; 10, Dactylis glomerata; 11, Festuca arundinacea; 12, Galium verum; 13, Heracleum sphondylium; 14, Knautia nevadensis; 15, Laserpitum latifolium; 16, Leucanthemum vulgare; 17, Lolium perenne; 18, Lotus corniculatus; 19, Onobrychis viciifolia; 20, Phleum pretense; 21, Picris hieracioides; 22, Plantago lanceolata; 23, Ranunculus acris; 24, Rhinantus pumilus; 25, Rumex acetosa; 26, Salvia pratensis; 27, Sanguisorba minor; 28, Scabiosa columbaria; 29, Silene vulgaris; 30, Taraxacum officinale; 31, Tragopogon dubius; 32, Trifolium pretense; 33, Trisetum flavescens; and 34, Vicia cracca.
Agronomy 10 00883 g001
Figure 2. Relative feed value of the 34 species analyzed (median values, maximum and minimum). Red lines indicate forage quality standard, according to Linn and Martin [37]: Prime: RFV > 151; 1st: RFV = 151–125; 2nd: RFV = 124–103; and 3rd: RFV = 102–87.
Agronomy 10 00883 g002
Figure 3. Feed units for milk (UFL (kg DM)−1) of the 34 species analyzed (median values, maximum and minimum), calculated according to INRA [38] procedures.
Agronomy 10 00883 g003
Figure 4. Ca:P ratios of the 34 species analyzed (median values, maximum and minimum). Red line marks the maximum recommended value for beef cattle [42].
Agronomy 10 00883 g004
Table 1. Basic physical and chemical soil properties of the four meadows.
Soil ParametersMeadow
1234
Sand (%)53.746.036.744.9
Fine Silt (%)26.132.539.136.0
Coarse Silt (%)14.713.414.511.4
Clay (%)5.58.19.77.7
pH (H2O 1:2.5)6.66.56.36.0
Salinity (dS m−1)0.220.220.200.22
OM (%)>6.69>6.69>6.69>6.69
POlsen (mg kg−1)3.753.252.752.75
KAmmonium acetate (mg kg−1)125.5122.5112.0139.5
N-NO3- (mg kg−1)37.050.047.738.2
Mg (mg kg−1)53.5113.0104.5136.5
Table 2. List of selected species, development stage (1, vegetative; 2, flowering; and 3, fruiting) and their cover (%) in the vegetation of the four meadows. Total cover of botanical groups and diversity of species. Is (VP) = Specific quality indices for the calculation of the pastoral value [40] compiled by Roggero et al. [39], minimum and maximum values. Intake = Presence in cattle dung in grazing, according to Farruggia et al. [41].
SpeciesBotanical FamilyDevelopment StageMeadowsIs (VP)Intake
1234
Achillea millefoliumCompositae1–28.71.71.71.42–2yes
Agrostis capillarisGramineae2–38.711.611.69.82–3yes
Anthyllis vulnerariaLeguminosae20.10.10.10.12–5-
Arrhenatherum elatiusGramineae2–31.211.61.79.83–4yes
Centaurea nigraCompositae218.51.71.79.80–1yes
Centaurea scabiosaCompositae20.111.611.61.40–0yes
Cerastium fontanumCaryophyllaceae2–30.10.10.10.10–0-
Chaerophyllum aureumUmbelliferae2–31.21.71.71.40–0-
Crepis pyrenaicaCompositae21.21.71.79.8--
Dactylis glomerataGramineae21.211.61.79.84–5yes
Festuca arundinaceaGramineae2–30.10.10.10.13–5yes
Galium verumRubiaceae21.20.10.10.10–1yes
Heracleum sphondyliumUmbelliferae28.70.11.71.40–2-
Knautia nevadensisDipsacaceae21.20.10.10.10–2yes
Laserpitium latifoliumUmbelliferae28.70.10.10.1--
Leucanthemum vulgareCompositae20.10.10.10.10–1-
Lolium perenneGramineae20.10.10.10.15–5yes
Lotus corniculatusLeguminosae1–21.20.10.10.13–4yes
Onobrychis viciifoliaLeguminosae2–31.20.11.71.42–5yes
Phleum pratenseGramineae21.211.60.10.14–5yes
Picris hieracioidesCompositae20.10.11.70.10–2-
Plantago lanceolataPlantaginaceae1–21.21.71.71.42–3yes
Ranunculus acrisRanunculaceae2–31.20.10.10.10–0yes
Rhinanthus pumilusScrophulariaceae1–21.21.70.11.40–0yes
Rumex acetosaPolygonaceae1–21.20.11.70.10–1yes
Salvia pratensisLabiatae20.10.10.10.10–1-
Sanguisorba minorRosaceae20.10.11.70.11–5yes
Scabiosa columbariaDipsacaceae1–21.20.11.70.10–1yes
Silene vulgarisCaryophyllaceae20.10.11.70.10–2yes
Taraxacum officinaleCompositae2–30.11.70.11.42–3yes
Tragopogon dubiusCompositae2–30.10.10.10.11–2yes
Trifolium pratenseLeguminosae28.711.61.79.84–4yes
Trisetum flavescensGramineae1–21.211.611.61.43–4yes
Vicia craccaLeguminosae20.11.71.71.42–4yes
Total Cover of Selected Species 81.095.962.574.0
Rest of species 19.04.137.526.0
Total Cover of Botanical Groups
Grasses 16.560.155.142.4
Legumes 11.315.26.814.2
Other forbs 72.224.738.143.4
Diversity of Vegetal Species
Shannon Index 2.962.582.802.79
Number of species 77475652
Table 3. Chemical composition of species sampled in the four meadows, expressed in % of dry matter (median values, n = 4). Maximum median values highlighted in orange and minimum median values in violet. DM = dry matter (in %); CP = crude protein; CF = crude fat; NDF = neutral detergent fiber; ADF = acid detergent fiber; ADL = acid detergent lignin; DDM = digestible dry matter; P = phosphorus; K = potassium; Mg = magnesium; Ca = calcium; and Na = sodium.
SpeciesDMCPAshCFNDFADFADLDDMPKMgCaNa
Achillea millefolium31.110.16.52.255.936.59.060.40.161.610.220.900.11
Agrostis capillaris38.58.95.31.868.133.23.363.00.140.800.220.510.08
Anthyllis vulneraria26.713.011.81.440.926.25.468.50.140.550.173.320.06
Arrhenatherum elatius42.17.64.51.666.535.23.061.50.130.740.180.500.08
Centaurea nigra32.49.66.21.546.228.45.266.70.141.150.251.370.10
Centaurea scabiosa28.68.77.41.345.929.04.866.30.141.130.251.670.09
Cerastium fontanum33.96.66.11.659.631.24.664.60.111.650.290.770.13
Chaerophyllum aureum26.112.710.82.039.224.15.570.10.161.490.542.390.10
Crepis pyrenaica25.610.47.52.743.726.74.968.10.161.270.411.570.11
Dactylis glomerata40.58.34.72.269.038.85.058.60.131.160.160.490.09
Festuca arundinacea45.57.24.42.073.341.14.056.80.121.000.130.350.09
Galium verum31.912.16.73.047.833.412.662.90.221.650.261.390.10
Heracleum sphondylium18.512.99.22.243.930.24.465.40.231.890.471.600.13
Knautia nevadensis22.311.07.82.143.826.14.368.50.181.680.371.240.12
Laserpitum latifolium25.512.18.52.943.726.83.968.00.201.630.372.120.11
Leucanthemum vulgare27.18.15.82.547.631.76.664.20.161.140.361.090.10
Lolium perenne37.16.85.81.663.632.72.863.40.160.830.140.440.11
Lotus corniculatus24.417.67.02.339.326.28.068.50.191.050.281.940.09
Onobrychis viciifolia30.415.64.81.849.335.210.161.50.200.630.221.240.06
Phleum pratense37.77.63.92.168.534.04.062.40.130.960.110.370.08
Picris hieracioides26.910.37.63.049.930.64.365.00.171.090.461.740.14
Plantago lanceolata25.59.89.31.742.328.810.166.50.141.290.402.360.10
Ranunculus acris25.710.26.12.647.630.46.065.20.161.360.291.300.10
Rhinantus pumilus25.512.39.34.045.728.68.866.60.291.410.391.790.11
Rumex acetosa27.88.14.41.861.642.310.755.90.161.080.270.680.10
Salvia pratensis21.712.48.42.745.028.06.167.10.191.500.531.790.11
Sanguisorba minor32.79.68.63.336.219.63.773.70.160.920.481.670.08
Scabiosa columbaria32.28.86.71.843.625.74.868.90.140.820.321.880.08
Silene vulgaris24.18.49.32.556.332.64.863.50.202.920.321.030.17
Taraxacum officinale19.414.112.83.130.517.65.275.20.202.270.612.380.21
Tragopogon dubius27.58.46.44.957.537.24.060.00.150.960.261.700.08
Trifolium pratense25.914.27.51.651.129.77.165.70.160.990.391.990.10
Trisetum flavescens44.57.94.71.669.136.84.160.20.130.960.120.490.08
Vicia cracca25.818.27.11.749.733.16.963.10.190.920.271.640.10
Table 4. Relative amplitude of the interval of variation of the parameters with respect to their lowest value, expressed in percentage (%). Highlighted in violet values >50%. DM = dry matter; CP = crude protein; CF = crude fat; NDF = neutral detergent fiber; ADF = acid detergent fiber; ADL = acid detergent lignin; DDM = digestible dry matter; P = phosphorus; Mg = magnesium; K = potassium; Ca = calcium, and Na = sodium.
SpeciesDMCPAshCFNDFADFADLDDMPKMgCaNa
Achillea millefolium172210216101251828914351
Agrostis capillaris22454911231822717721443218
Anthyllis vulneraria2492029108212391521521953
Arrhenatherum elatius9243039143465739867528
Centaurea nigra1241162712161756360355857
Centaurea scabiosa2931301381321411563523142
Cerastium fontanum21261821441324377683240
Chaerophyllum aureum16183522129342391081342481
Crepis pyrenaica12145220815174297513013483
Dactylis glomerata282941371839435210412319
Festuca arundinacea2372348618355916298815911361
Galium verum25391018141849779235873454
Heracleum sphondylium1166244620184362855991532
Knautia nevadensis5225298725224364012253915
Laserpitum latifolium2534157420305082669848040
Leucanthemum vulgare2133386531814898383814
Lolium perenne4813667121041420313720811249
Lotus corniculatus3131182261633418169357145
Onobrychis viciifolia16715291258234182965145
Phleum pratense253426707215172992411921
Picris hieracioides212315154743246405919112
Plantago lanceolata364946401213274808813410940
Ranunculus acris14373530171421510769542135
Rhinantus pumilus2430417014131448685626360
Rumex acetosa1447441556213181084916512
Salvia pratensis83727181723707468639926
Sanguisorba minor8548111419214120562410833
Scabiosa columbaria51640171321562090213242
Silene vulgaris31673362101910284835536011
Taraxacum officinale257381623266056861685857
Tragopogon dubius831474751342667204494851
Trifolium pratense62281368132035732661642165
Trisetum flavescens811722111024548123596125
Vicia cracca3729152091021447243720912
Table 5. Results of two-way ANOVA between botanical groups and meadow (% DM mean values). Different letters in the same row indicate significant differences according to Tukey’s HSD test. Sig: significance levels; (***) = p < 0.001; ns = not significant; DM = dry matter (in %); CP = crude protein; CF = crude fat; Hem. = hemicellulose; Cel. = cellulose; NDF = neutral detergent fiber; ADF = acid detergent fiber; ADL = acid detergent lignin; P = phosphorus; Mg = magnesium; K = potassium; Ca = calcium; and Na = sodium.
Botanical Groups Meadows
Chemical VariablesGrasses (n = 28)Legumes (n = 20)Other Forbs (n = 88)Sig1 (n = 34)2 (n = 34)3 (n = 34)4 (n = 34)Sig
DM40.2 b26.6 a26.8 a***33.230.929.631.1ns
CP7.9 a15.6 c10.2 b***9.810.511.110.7ns
Ash4.8 a7.6 b7.8 b***6.87.17.57.3ns
CF1.9 a1.8 a2.5 b***12.32.52.32.2ns1
Hem.32.0 b15.8 a17.5 a***20.020.419.920.7ns
Cel.32.0 b22.7 a23.3 a***25.425.224.624.8ns
NDF67.8 b46.1 a47.0 a***51.151.650.551.3ns
ADF35.7 b30.2 a29.5 a***131.131.230.730.6ns1
ADL3.7 a7.5 c6.1 b***5.75.96.05.7ns
P0.13 a0.18 b0.18 b***0.19 b0.18 b0.14 a0.15 a***
K0.92 a0.87 a1.49 b***1.211.441.281.19ns
Mg0.17 a0.27 b0.36 c***0.250.330.320.33ns
Ca0.47 a2.01 c1.55 b***11.441.461.351.34ns1
Na0.09 a0,09 a0,12 b***0,110,100,100.10ns
Levene test: (1) Equal variances are not assumed (p < 0.001). No interactions were found between botanical groups and meadows.
Table 6. Results of two-way ANOVA between botanical groups and meadow (mean values). Different letters in the same row indicate significant differences, according to Tukey’s HSD test. Sig: significance levels; (*) = p < 0.05; (**) = p < 0.01; (***) = p < 0.001; ns = not significant; DDM = digestible dry matter (in % DM); RFV = relative feed value; UFL = feed units for milk; PDI = “protéines digestibles dans l’intestin” (in % DM); P = phosphorus; Mg = magnesium; K = potassium; Ca = calcium; and N = nitrogen.
Botanical Groups Meadows Interaction
Nutritive VariablesGrasses (n = 28)Legumes (n = 20)Other Forbs (n = 88)Sig1 (n = 34)2 (n = 34)3 (n = 34)4 (n = 34)SigSig
DDM61.1 a65.3 b65.9 b***64.764.665.065.1nsns
RFV84.3 a134.5 b135.5 b***1124.6123.5125.8125.4ns1ns1
UFL (kg DM)−10.77 a0.91 b0.88 b***0.850.840.860.86nsns
PDI6.9 a8.7 c7.7 b***7.67.77.97.8nsns
Ca P−13.8 a11.8 c9.3 b***17.68.09.88.8ns1ns1
K (Ca + Mg)−11.6 c0.4 a0.9 b***1.01.00.91.0nsns
N P−110.3 a14.1 b9.8 a***8.5 a9.3 a13.0 c11.3 b***ns
N K−11.5 a3.3 b1.2 a***12.2 ab1.6 a1.9 ab2.4 b***1***1
K P−17.6 b4.9 a8.8 b***5.7 a6.9 ab8.5 b7.2 ab*ns
Levene test: (1) Equal variances are not assumed (p < 0.001).

