Article

The Role of Biochar and Soil Properties in Determining the Available Content of Al, Cu, Zn, Mn, and Cd in Soil

Department of Agro-Environmental Chemistry and Plant Nutrition, Faculty of Agrobiology, Food and Natural Resources, Czech University of Life Sciences Prague, Kamýcká 129, 165 00 Prague-Suchdol, Czech Republic
*
Author to whom correspondence should be addressed.
Agronomy 2020, 10(6), 885; https://doi.org/10.3390/agronomy10060885
Submission received: 18 May 2020 / Revised: 10 June 2020 / Accepted: 16 June 2020 / Published: 20 June 2020
(This article belongs to the Special Issue Agronomic Approaches for Remediation of Contaminated Soils)

Abstract

:
The purpose of the study was to understand the mechanisms of biochar-induced changes in the available content of aluminum (Al), cadmium (Cd), zinc (Zn), copper (Cu), and manganese (Mn) in a wide range of soils. Five soils from different regions of the Czech Republic were incubated for 12 weeks with four rates of biochar (0.5%, 2%, 4%, and 8% w/w). The available concentrations of Al, Cd, Zn, Cu, and Mn were determined on the 7th and 84th day of incubation. There was a significant decline in the available content of Al, Zn, Cu, Mn, and Cd except in the available content of Al in one soil, which is characterized by very low Al content, higher cation exchange capacity (CEC), and neutral pH = 7.0. The decline in the mobile contents of Al, Zn, Cu, Mn, and Cd was significant in all cases of 8% biochar rate. The decline in the content of Al, Zn, Cu, Mn, and Cd was mainly due to the increment in soil pH and increment in CEC, decline in dissolved organic carbon (DOC), and the release of exchangeable Ca2+ and K+ from biochar. The application of high amounts of biochar to soil could increase the available content of some metals like Al. On the other hand, biochar could efficiently reduce the mobility of Al, Zn, Cu, Mn, and Cd in soil, while the decline is mainly caused by biochar-induced changes in soil pH, CEC, DOC, and exchangeable Ca2+ and K+ content of treated soils.

1. Introduction

Soil acidification connected with increased mobility of metals like Al, Cu, Zn, Mn. and Cd can result in higher environmental risk of these elements, especially via potential leaching to surface and/or groundwater, or via higher bio accessibility of these elements [1]. For instance, acidification of soil from pH 5.6 to pH 4.5 and pH 3.0 by simulated acid rain substantially increased the mobile proportions of Cu, Pb (lead), Cd, and Zn [2]. Shifts in the distribution of elements due to the soil acidification were documented [3]. Effect of soil acidification and the subsequent mobilization of Cd and Zn is well documented [4]. Besides Cd and Zn, the enhanced mobility of elements such as Cu, Fe, Mn, and Al is often discussed within the potential detrimental impact of soil acidification on soil parameters [5,6]. Higher uptake of elements such as Cd and Zn by plants growing in the acidified soil can cause toxic effects to plants [7]. The rise in the mobile content of Al (reaching the phytotoxic levels of this element in soil solution) was reported by Singh et al. [8] when the soil was acidified to a pH level of less than 5. According to these authors, the toxicity of Al in acidic soils represents a worldwide problem resulting in reduced crop yields.
Various materials have been tested to mitigate the long-term acidification of soils, such as calcium silicate (i.e., wollastonite), clay minerals (zeolite, montmorillonite, illite, and sepiolite), lime, hydroxyapatite, and biochar [9,10,11,12,13]. The ability of biochar to remediate both organic and inorganic contaminants is reported [14,15,16,17,18,19]. For example, the application of both bamboo and rice straw biochar was effective in decreasing extractability of Cu, Cd, and Zn [20]. In this context, biochar showed better Cd immobilization efficiency compared to liming, especially in the soils with low buffering capacity [9]. Wang et al. [21] also observed better Cd immobilization of wheat straw biochar compared to other organic matter sources (vermicompost) due to the higher stability of Cd complexes. In addition to this, Lu et al. [22] highlighted the effectivity of poultry litter and eucalyptus biochar (3% rate) to reduce the mobility of Cd in acidic soil. However, Mukwaturi and Lin [23] reported the reductive dissolution of Fe and Mn from the organic matter content of soil, resulting in the increased mobile proportions of these elements in soil. According to the findings of Alozie et al. [24] biochar in combination with low molecular weight organic acids could potentially enhance the reductive dissolution of iron and manganese oxides in the soil, leading to enhanced release of Fe and Mn originally bound to these oxides. The main mechanisms for the adsorption of metal by biochar are thought to be complexation, cation exchange, precipitation, and electrostatic interactions [25]. The functional groups, which are responsible for the sorption of metals are carboxylic, amino, and hydroxyl groups [25]. Addition of biochar could increase soil pH and CEC and result in the increase of negative surface charges on both soil and biochar, which in turn enhances the sorption of As, Cr, Cd, Pb, and Hg [15,25]. Hence, the role of biochar-induced changes of soil pH, CEC, DOC, and exchangeable Ca2+ and K+ in determining the available content of Al, Cu, Zn, Mn, and Cd has been poorly studied. The main objectives of the study were to: i) investigate the interaction of biochar-induced changes in soil pH, CEC, DOC, and exchangeable Ca2+ and K+ with the immobility of Al, Zn, Cu, Mn, and Cd and ii) assess the potential of biochar to alter mobility of Al, Zn, Cu, Mn, and Cd in a set of soils varying from acidic to neutral pH. We hypothesized that the change in soil properties (pH, CEC, exchangeable Ca2+, K+, and DOC) would be responsible for biochar-induced changes in the available content of Al, Zn, Cu, Mn, and Cd.

2. Material and Methods

2.1. Soil Sampling and Biochar Production

Five soils have been selected with a wide range of properties (pH, CEC, nutrient content and textural classes) were collected from five different agricultural sites in the Czech Republic. The selection of soils with a wide range of properties was manly intended to enable the investigation of biochar-induced change in soil properties on the immobilization and/or mobilization of Al, Zn, Cu, Mn, and Cd. Each soil was collected from the top layer (0–20 cm), air-dried, and passed through a 2 mm sieve prior to use. Biochar was produced from willow tree chips at 700 °C by fast pyrolysis in a fluidized bed reactor then milled to pass through a 2 mm sieve. The above-mentioned temperature of biochar production was selected to obtain stable biochar after exploitation of the highest possible energy. The localization and specific properties of soils and biochar are shown in Table 1. More detailed characterization of soils and biochar used in this study is presented in Hailegnaw et al. [26,27].

2.2. Experimental Design

Incubation experiment was set up using 500 mL plastic pots for 12 weeks in controlled environmental conditions at room temperature (25 ± 2 °C). The experiment was designed with 5 treatments: Control (soil + no biochar), soil + 0.5% biochar, soil + 2% biochar, soil + 4% biochar, and soil + 8% biochar (w/w ratio). Four rates of biochar (0.5, 2, 4, and 8% were selected to simulate field application rates of biochar of 0.5% and 2% and the slightly higher rates of 4% and 8% to determine the biochar effect. Individual pots of soil–biochar mixture were weighed and thoroughly mixed separately, then each pot was filled at the beginning of incubation to ensure homogeneity and pots were regularly irrigated every third day to reach 60% of maximum water holding capacity. Soil maximum water holding capacity was determined by filling Mitscherlich columns with air-dried soil of known weight and moisture content. Subsequently, the columns were soaked in water for two hours to ensure saturation of soil in the column, then the water in the soil was drained for 12 h. The maximum water holding capacity was calculated gravimetrically as the amount of water retained by the known amount of soil (dry weight) in the Mitscherlich columns. Samples of incubated soil and/or soil-biochar mixture were sampled on the 7th day (week 1) and 84th day (week 12) of incubation.

2.3. Chemical Analysis

The pH of soil and biochar was determined after extraction with 0.01 M CaCl2 (w/v = 1/5) ISO 10390 [28] by Argus pH meter (Sentron) with transistor CupFET probe. The concentration of available Al, Zn, Cu, Mn, and Cd in soil samples was determined by inductively-coupled plasma–optical emission spectrometer (ICP–OES, Agilent 720, Agilent Technologies Inc., Santa Clara, CA, USA) after extraction for 2 h with 0.01 M CaCl2 (w/v = 1/10). Determination of CEC was done according to [29]. Soil samples of 2.5 g were added in a 50 mL Nalgene tube and agitated with 30 mL of 0.1 M BaCl2 for 1 h and the supernatant was collected after centrifugation. The saturation was done three times, with the supernatant added to a 100 mL flask for the determination of exchangeable cations (Ca2+, K+, and Mg2+) by ICP–OES. After the three-step saturation of soil sample with 0.1 M BaCl2 solution, the exchanged Ba2+ was released by agitating the centrifuged pellet with 30 mL of 0.02 M MgSO4 solution for 2 h. After the 2-h agitation, the solution was centrifuged and the remaining Mg2+ in the supernatant was determined for the estimation of CEC. The total proportion of carbon was determined by a CHNS Vario MACRO cube (Elemental Analyzer system GmbH, Hanau, Germany) analyzer. DOC was measured after extraction of soils for 2 h with 0.01 M CaCl2 (w/v = 1:10), and measured using the Skalar San Plus System continuous flow segmented analyzer (Skalar, Netherlands) according to the method used by Jászberényi and Sarkadi [30]. The pseudo total content of elements (Al, Zn, Cu, Mn, and Cd) in soils was determined by ICP–OES after microwave-assisted aqua regia extraction [31]. Aliquots (~0.5 g) of air-dried soil samples were placed in a digestion vessel with 10 mL of qua regia (i.e., nitric and hydrochloric acid mixture in the ratio φr = 1:3) and heated in an Ethos 1 (MLS, Germany) microwave-assisted wet digestion system for 45 min at 210 °C. After cooling, the digest was transferred into a 50 mL Teflon vessel and evaporated to dryness at 160 °C. Then the remaining digest was transferred to a 25 mL glass tube, filled with deionized water, and concentration of elements was determined by inductively-coupled plasma–optical emission spectrometer (ICP-OES).

2.4. Data Processing

One-way analysis of variance (ANOVA) was used to determine the effect of biochar application on soil-available Al, Zn, Cu, Mn, and Cd under Tukey’s significance difference test at p < 0.05. Multivariate analysis of variance (MANOVA) was done to determine the effect of factors (soil type, biochar, and their interaction effect).
Decline or increase in percentage of soil-available Al, Zn, Cu, Mn, and Cd in biochar-amended soils was calculated according to Equation (1).
X   ( % ) = ( C 0   C n C 0 ) × 100
where X denotes change in percentage of available Al, Cu, Zn, Mn, and Cd; C0 is the concentration in the control (mmol kg−1); and Cn is the concentration in the biochar-amended treatments (mmol kg−1). Correlation analysis was used for the assessment of relationships between variables, where Pearson’s correlation of p < 0.05 was used as the criterion for significance. All the statistical analyses were performed using SPSS 17.0 software.

3. Results

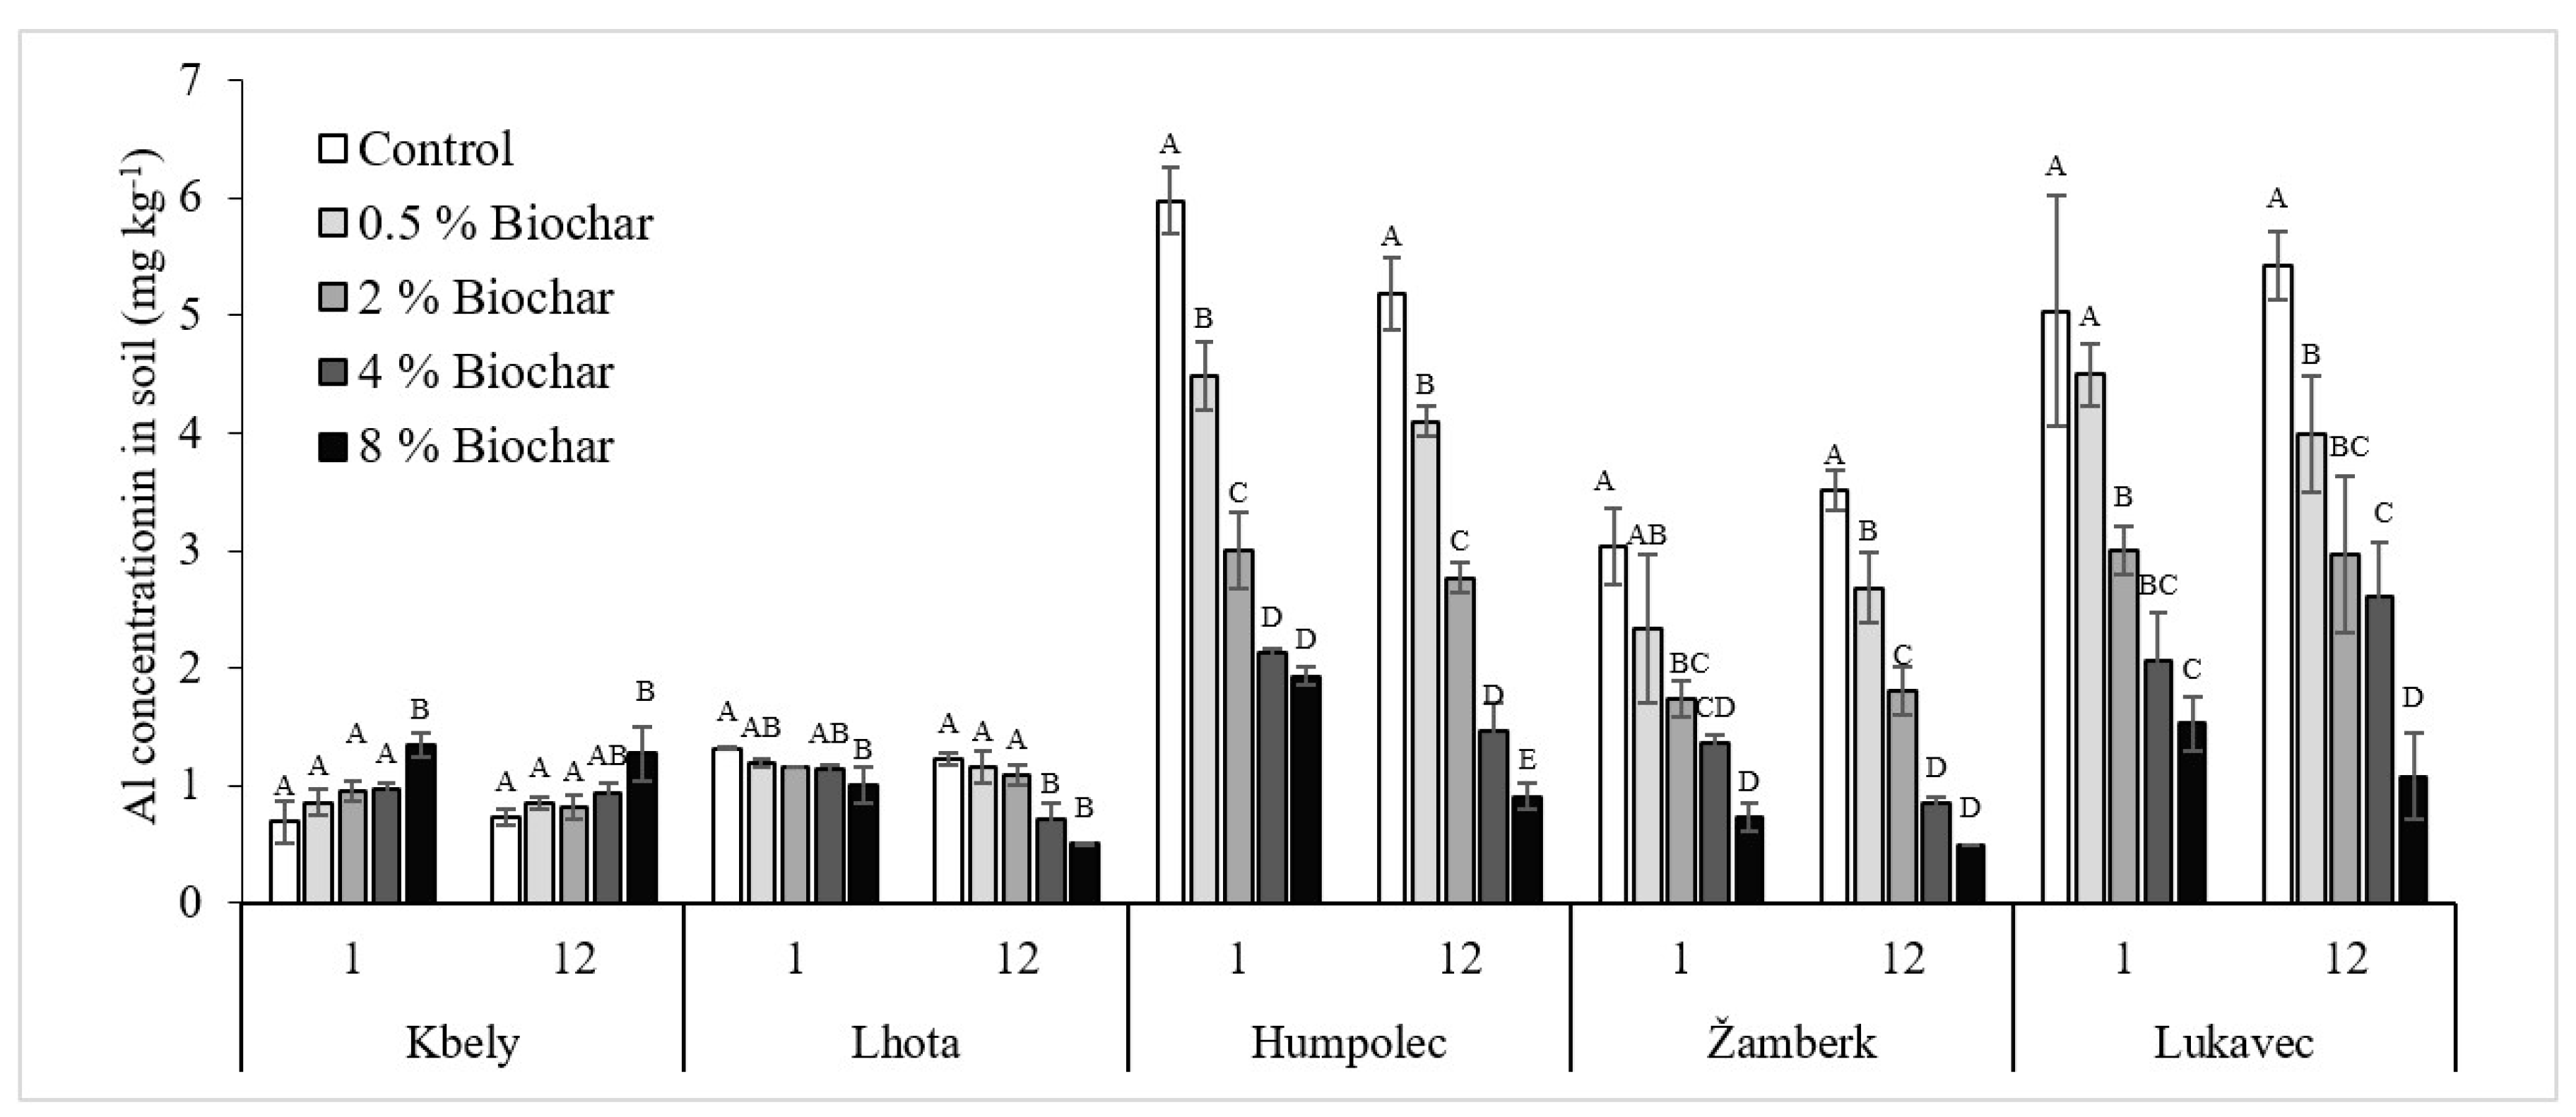
3.1. Availability of Al

The application of 8% biochar significantly (p = 0.05) increased the available content of Al in Kbely soil (Figure 1). In the remaining four soils 8% biochar significantly (p = 0.05) decreased the available content of Al. In the three acidic soils, namely, Humpolec (pH = 4.5), Žamberk (pH = 4.8), and Lukavec (pH = 5.3), the significant decline started from the application of 2% biochar rate, while only 8% caused a significant decline in Lhota soil (pH = 5.91). The amount of available Al content decline was in the range of 6% and 86% at 0.5% and 8% biochar application rate, respectively. The available content of Al was negatively correlated (r > −0.67) with soil pH, CEC, and exchangeable Ca2+ and K+ except for a positive correlation (r > 0.9) with pH and exchangeable K+ in Kbely soil (Table 2). Moreover, based on the result reported in Table 3, the available content of Al was positively correlated with the percentage of change in the DOC in all soils. As is indicated by the multivariate analysis of variance (Table 4), the soil was the source of the highest variation (F = 117, p = 0.00), followed by the biochar (F = 14.3, p = 0.00), and finally, the interaction between soil and biochar (F = 9.21, p = 0.00).

3.2. Availability of Cu

The addition of biochar decreased the available content of Cu in all soils up to 58%, irrespective of soil types (Figure 2). The application of biochar at low rates (0.5% and 2%) showed a significant decline only in some cases, whereas 4% and 8% biochar rates significantly decreased the available content of Cu in all five soils. Available Cu content after biochar addition had a significant negative correlation with soil pH, CEC, and exchangeable Ca2+ and K+ in most cases except in Lhota soil insignificant correlation and Kbely soil, which had a strong positive correlation (p = 0.05) with CEC and exchangeable Ca2+ (Table 5). Additionally, there was a positive correlation between the available content of Cu and the percentage of change in the DOC (Table 3). Based on the multivariate analysis of variance (Table 4), biochar was the highest source of variation (F = 18.0, p = 0.00), followed by soil (F = 8.41, p = 0.00). The available content of Cu was negatively correlated (r > −0.62) with soil pH, CEC, and exchangeable Ca2+ and K+ except for a positive correlation (r > 0.99) with CEC and exchangeable Ca2+ in Kbely soil (Table 5).

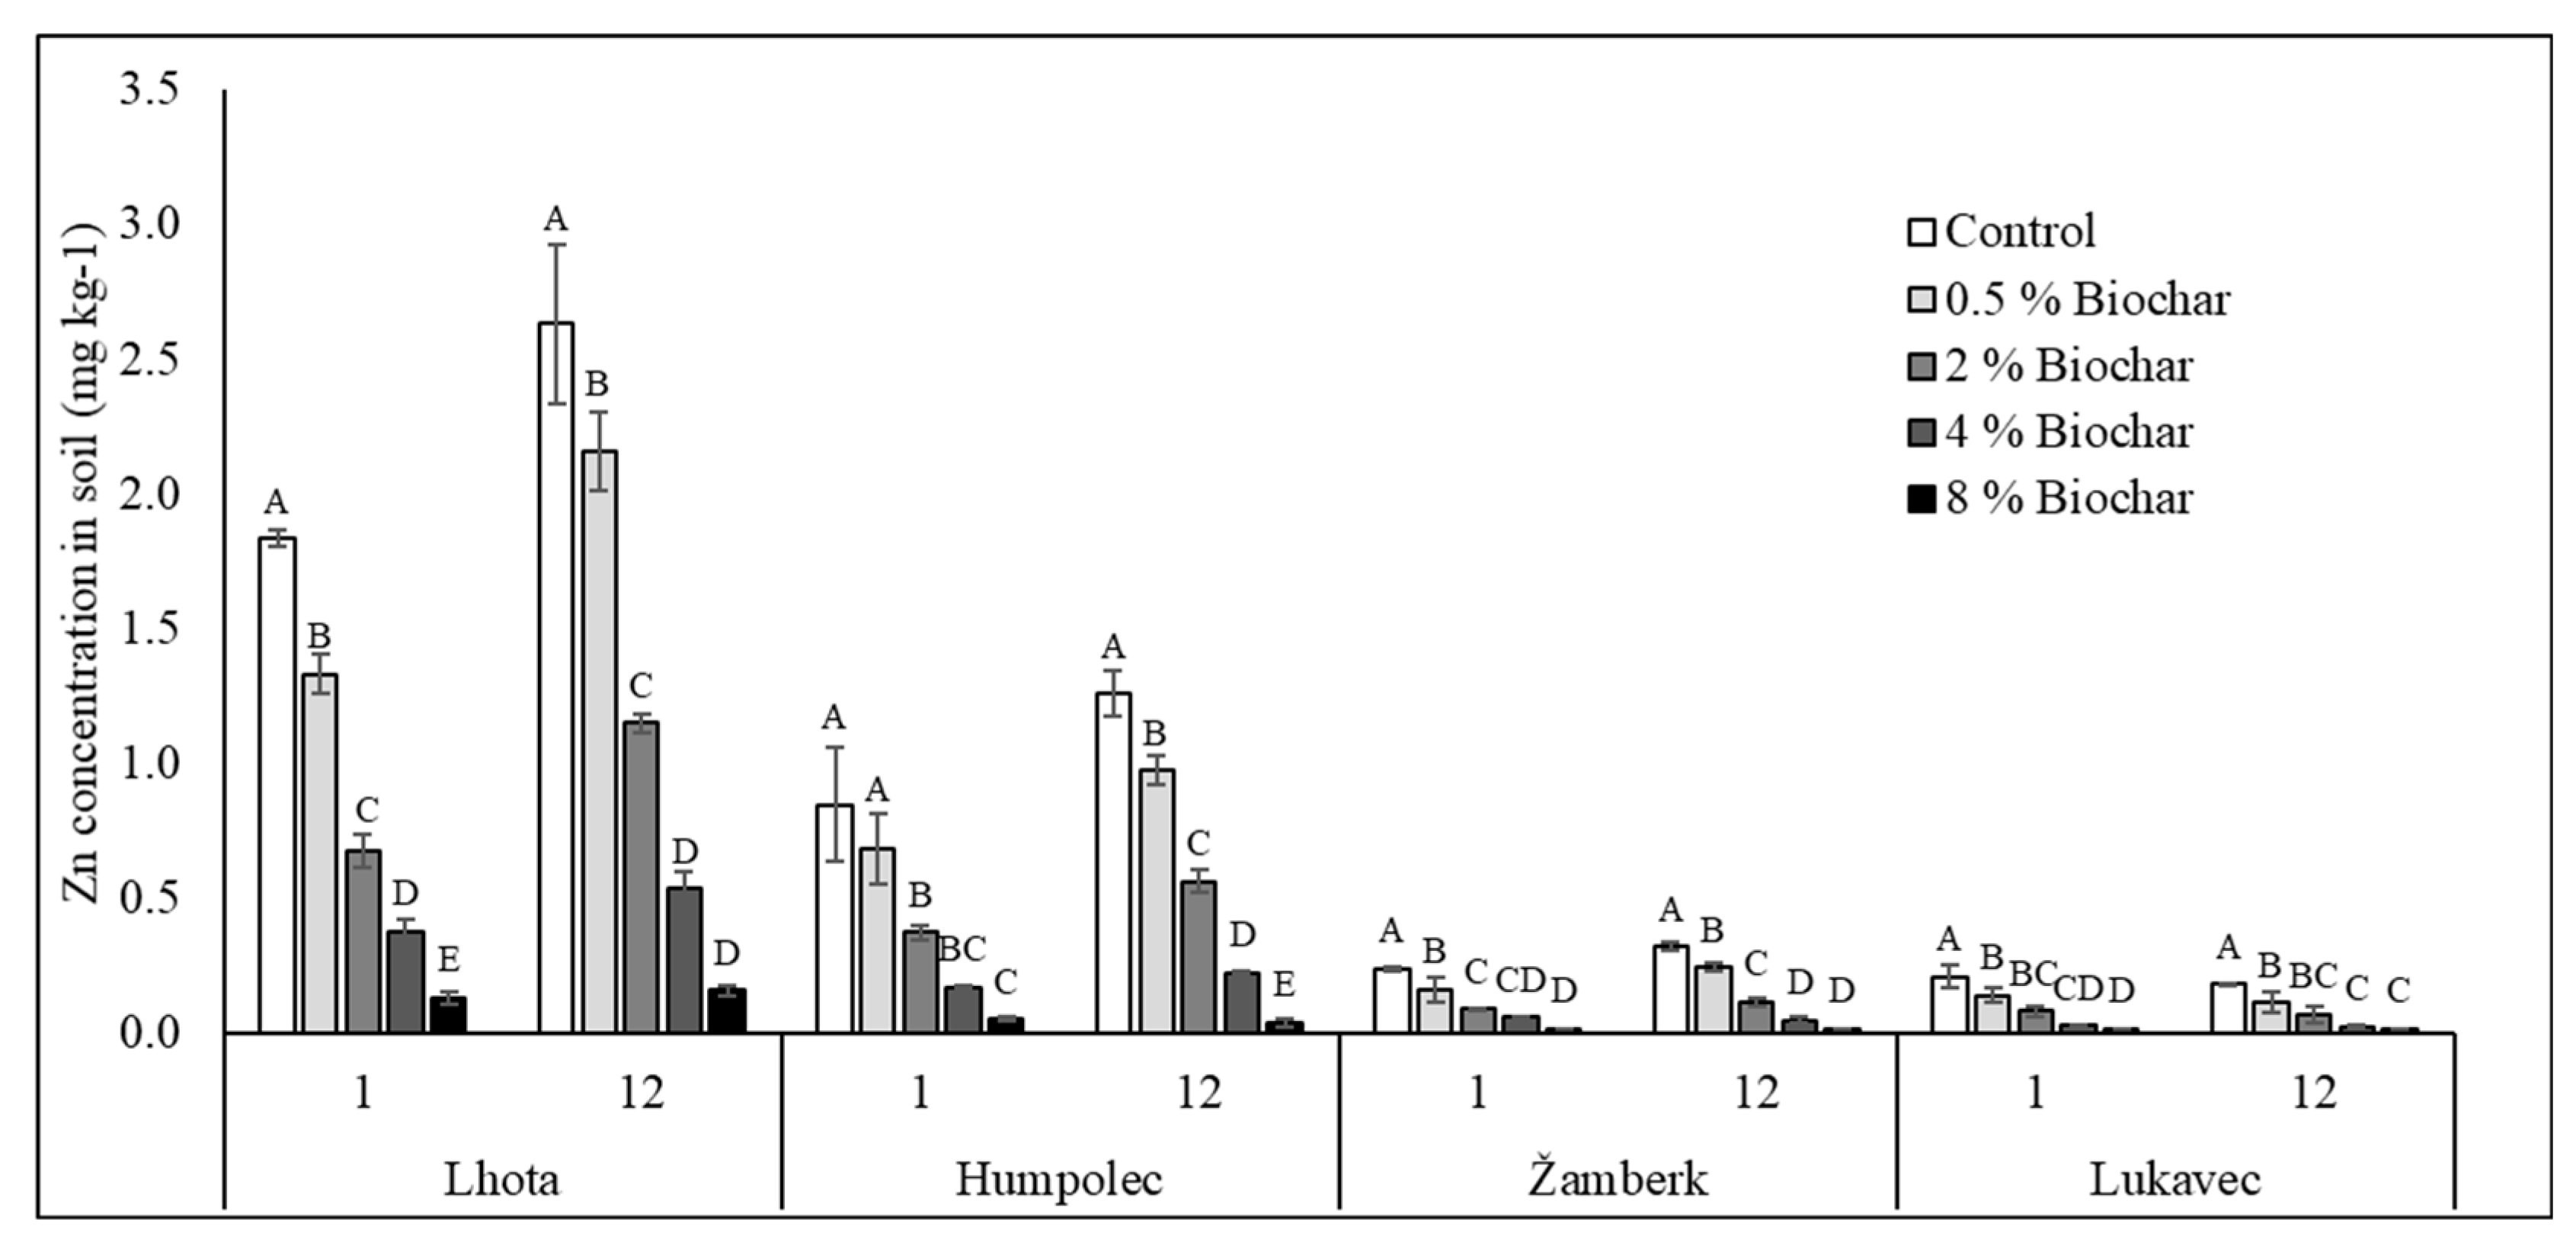
3.3. Availability of Zn

Available content of Zn declined in four soils with biochar addition except Kbely soil (Figure 3). In the four soils, the decline ranged between 18% and 97% at 0.5% and 8% of biochar application rate, respectively. The addition of 0.5% biochar was enough to induce a significant decline in Lhota, Humpolec, Žamberk, and Lukavec soils. The fifth soil, Kbely, had an available content of Zn below the detection limit of ICP-OES used in this study (below 0.02 mg kg −1). Based on the multivariate analysis of variance (Table 4), biochar was the source of the highest variation (F = 604, p = 0.00) then soil (F = 3.39, p = 0.041) and the interaction between soil and biochar (F = 2.77, p = 0.036). The available content of Zn was negatively correlated (r > −0.62) with soil pH, CEC, and exchangeable Ca2+ and K+ in all soils except Kbely (Table 6). There was also a positive correlation between the available content of Zn and the percentage of change in the DOC in all soils except Kbely (Table 3).

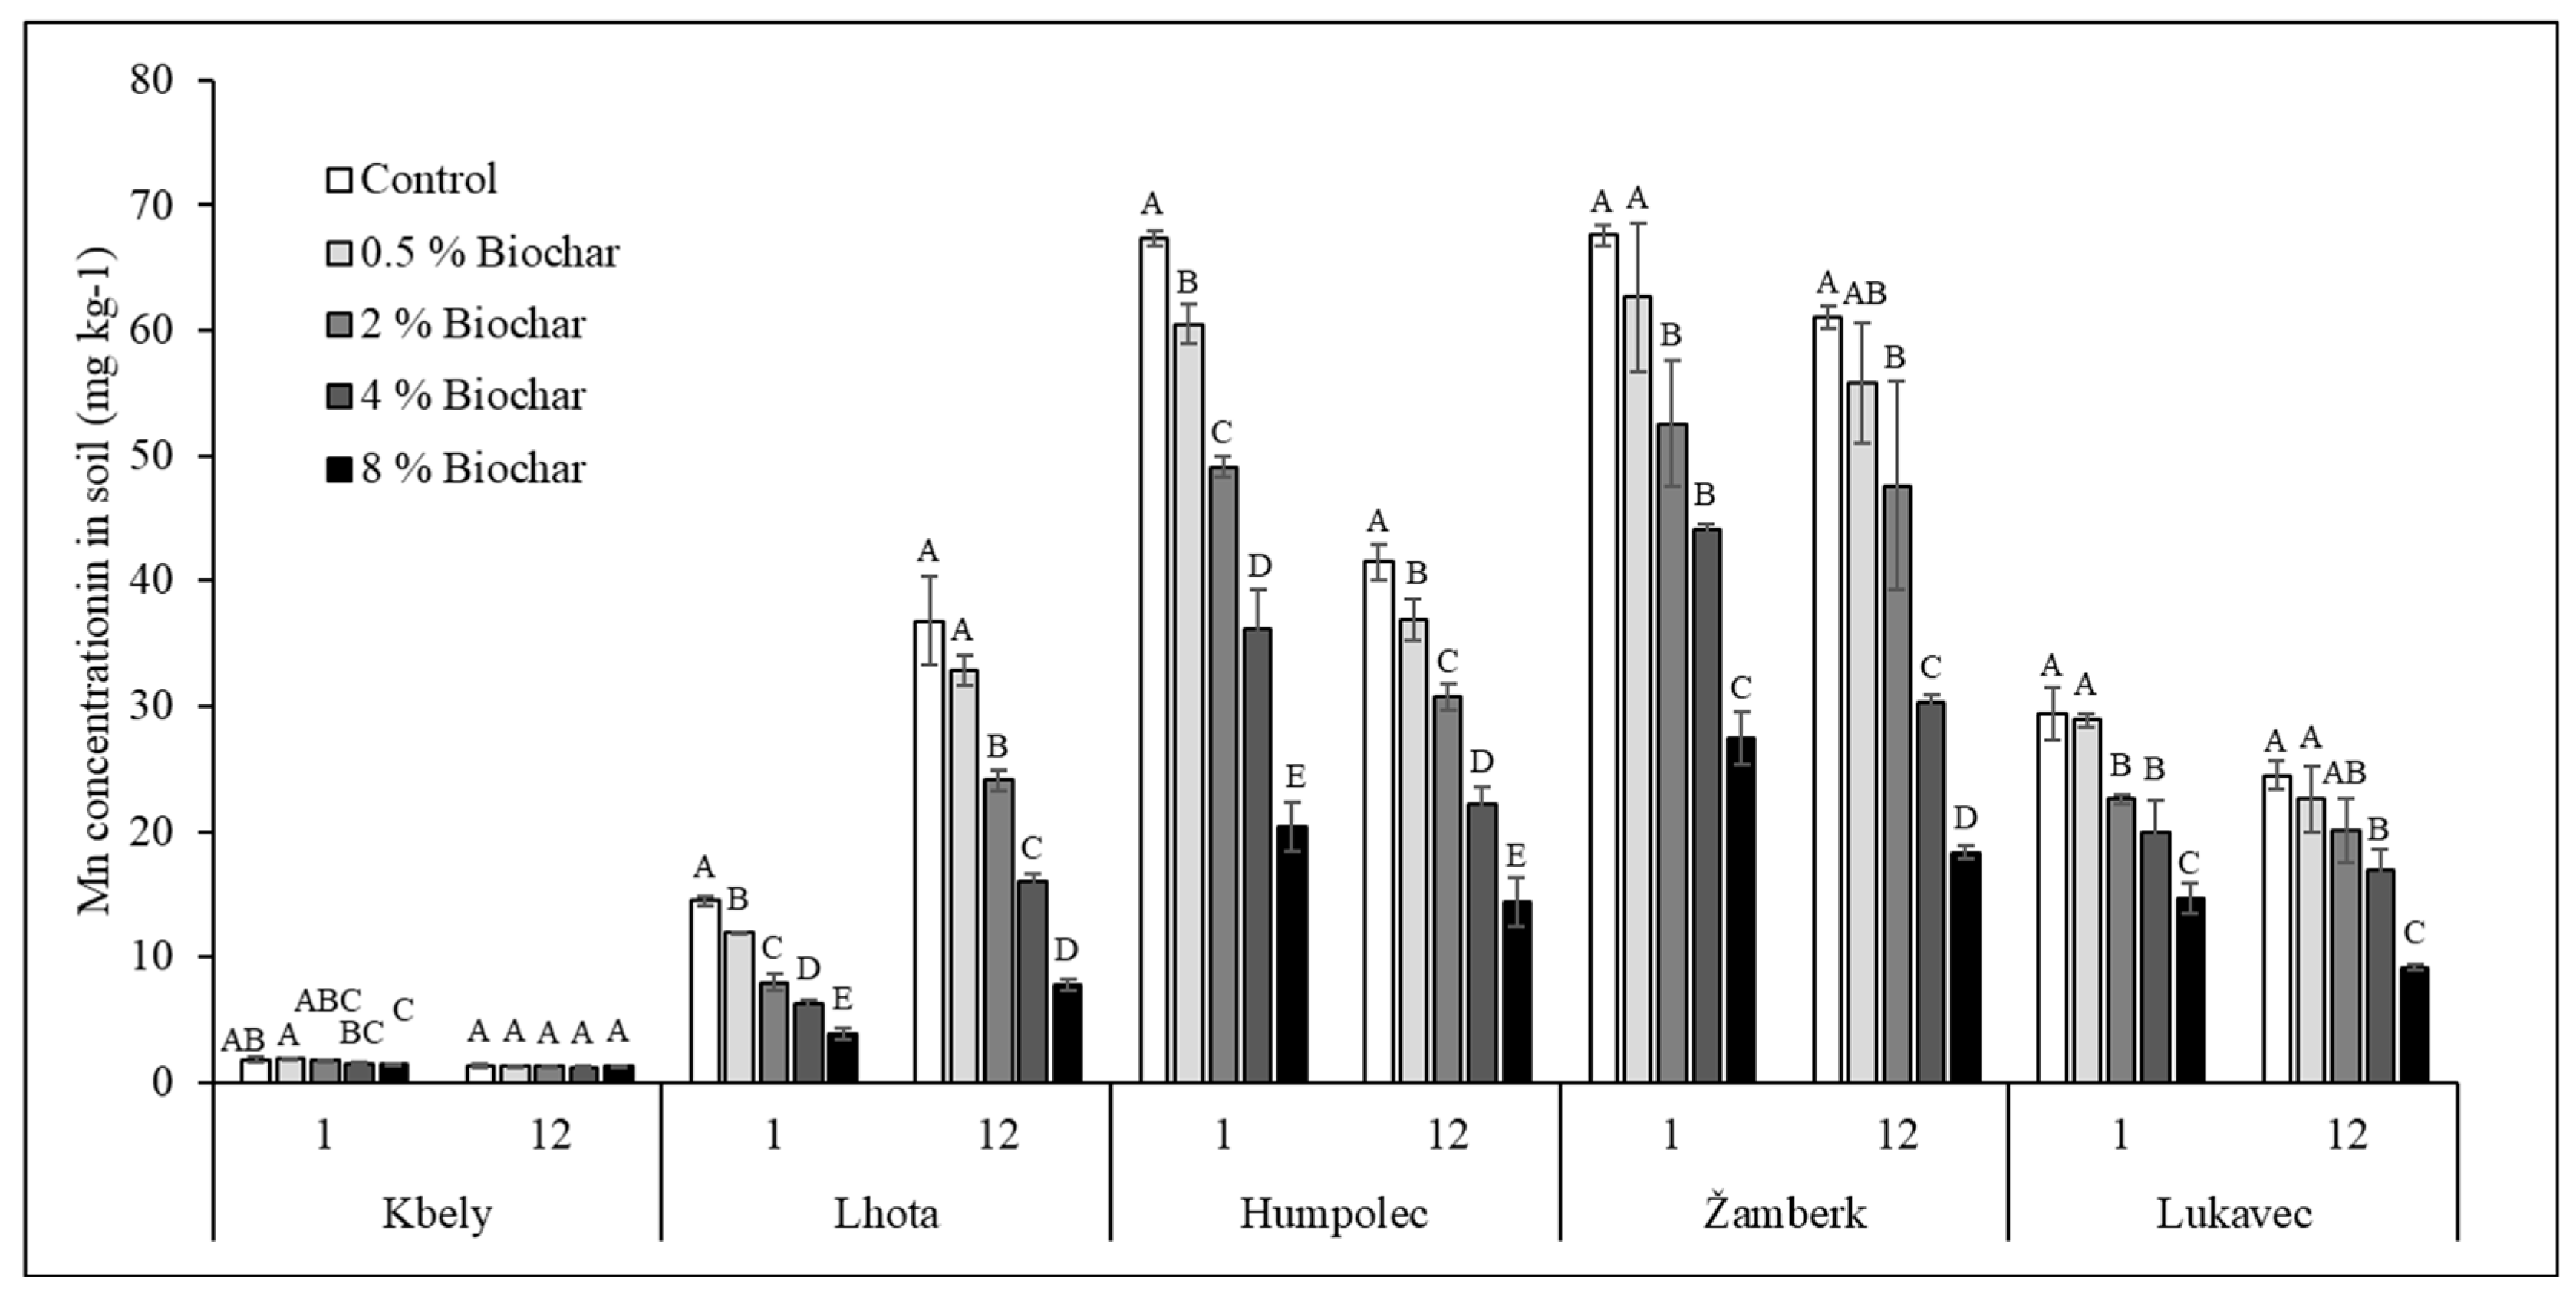
3.4. Availability of Mn

Effect of biochar on soil-available Mn was similar to that of available Cu. However, the decline in Kbely was significant (p = 0.05) only during the first week of incubation at the 8% biochar rate (Figure 4). In the remaining four soils, the content of available Mn was significantly decreased starting at 2% of biochar application rate with the decline up to 79% relative to the control. The trend in soil-available Mn content after biochar addition of these four soils was negatively correlated with soil pH, CEC, and exchangeable Ca2+ and K+ content except for Kbely soil (Table 7). Based on the multivariate analysis (Table 4), the biochar was the source of the highest variation (F = 135, p = 0.00), followed by soil (F = 46.6, p = 0.00), and the interaction between soil and biochar (F = 2.75, p = 0.02). The available content of Mn was negatively correlated (r > −0.8) with soil pH, CEC, and exchangeable Ca2+ and K+ except a positive correlation with CEC and exchangeable Ca2+ in Kbely soil (Table 7). Additionally, there was a positive correlation between the available content of Mn and the percentage of change in the DOC of all soils except Kbely (Table 3).

3.5. Availability of Cd

The Cd content of all soil decreased due to biochar addition (Figure 5). The amount of Cd decline was in the range between 0.1% and 81% at the 0.5% and 8% biochar application rate, respectively. The application of 0.5% biochar did not induce a significant decline in many cases but the 2% biochar rate induced a significant (p = 0.05) available Cd content decline in the four acidic soils (Lhota, Humpolec, Žamberk and Lukavec), whereas 4% and 8% biochar rate induced a significant decline of Cd in all soils at both incubation periods. Based on the multivariate analysis (Table 4), biochar was the source of the highest variation (F = 134, p = 0.00), soil (F = 56.9, p = 0.00) and the interaction between soil and biochar (F = 4.95, p = 0.02). The available content of Cd was correlated in negative way (r > −0.5) with soil pH, CEC, and exchangeable Ca2+ and K+ except for a positive correlation (r > 0.8) with CEC and exchangeable Ca2+ in Kbely soil (Table 8). Additionally, there was a positive correlation between the available content of Cd and the percentage of change in the DOC in all soils except Kbely (Table 3).

4. Discussion

4.1. Availability of Al

The addition of biochar significantly decreased the available content of Al in four soils. The result is consistent with the finding of Yuan and Xu [32], who reported decline in the exchangeable content of Al by 33.4% and 55% after the application of canola and peanut straw biochar produced at 350 °C, respectively. An increment of soil pH up to 1.2 was also evident in the four soils with a significant Al content decline [26]. The increment in the pH of soils could play two vital roles. Firstly, as the pH increases, the freely-available Al could decrease by the precipitation of Al3+ to the insoluble Al oxides/hydroxides [33]. Thus the increment in pH of soil converts the aluminum species to the monomer of Al(OH)2+ and Al(OH)2+, which are easily adsorbed by biochar through ion exchange with –COOH or phenolic –OH groups [34]. The complexation of Al with the organic hydroxyl and carboxyl functional groups of biochar through ion exchange was confirmed by Qian and Chen [35]. The complexation of Al with the organic functional groups of biochar is attributed to the hydrolysis of Al and the esterification reaction of carboxylate groups [36]. Similarly, Jansen et al. [37] reported the formation of insoluble Al–DOC precipitate complexes at a higher pH by the formation of stable ring structures on the functional groups of DOC and decline in the available content of both Al and DOC. This is evident from Table 3, which shows that the percentage of declined available Al content of biochar treatments relative to control was significantly correlated with the percentage of decline in DOC (r > 0.8, p = 0.01). Secondly, the increment in the pH of soils could result in the dissociation of organic matter, which add more deprotonated acidic functional groups (increased CEC), and this further contributes to the binding of metals like Al on the surface of organic matter. The complexation of humic substance-originated carboxylic and phenolic groups with Al3+ is also an important mechanism for the retention of Al by soils [38]. Other possible reasons explaining the decline could be the exchange of exchangeable Al with exchangeable Ca2+ and K+ content of biochar. The full report of biochar effect on the pH, exchangeable Ca2+, K+, and CEC of these soils is contained in our previously-published paper [26]. The release of base cations (Ca2+, Mg2+, and K+) and their replacement by exchangeable Al3+ at the surface of biochar has been widely studied [32]. On the contrary, the content of available Al increased in Kbely soil up to 0.54 mg kg−1 at 8% of biochar addition rate. The increment was significant (p = 0.05) at 8% of biochar addition and it ranged from 10% up to 94% at the 0.5% and 8% of biochar rate, respectively. However, the increment of available Al content in Kbely soil was by far lower than the toxic level of Al as the base cations (Ca, K, Mg)/Al molar ratio at 8% of biochar addition was 105. The possible toxicity of Al could be reached when sum of cations (Ca, K, Mg) to Al ratio is lower than 1 [39]. The exceptional case of Kbely is due to soil-specific properties. This is supported by our multivariate analysis of variance (Table 4), which revealed the higher main effect attributed from soil (F = 117, p < 0.001) rather than biochar (F = 14.3, p < 0.001) and the interaction effect soil with biochar (F = 9.21, p < 0.001). Kbely soil is characterized by neutral pH, higher exchangeable Ca2+, higher CEC, and higher DOC as compared to other soils (Table 1). The neutral pH (7.01) of Kbely soil, which is much higher than other soils and the further increment by biochar resulted in mobility of Al. This is indicated by a positive significant (r = 0.98, p = 0.01) correlation between pH and available content of Al in Kbely soil after the addition of biochar (Table 2). The stability of Al up to the pH value near 6.5 and the increment in the mobility of Al above this pH point is reported by the study of Driscoll and Schecher [40]. The addition of biochar in Kbely soil decreased soil CEC and content of exchangeable Ca2+ [26]. Therefore, the increment in the available content of Al in Kbely soil could be also due to the release of Al to soil solution from biochar and the replacement by exchangeable Ca2+. Our biochar was characterized by much higher content of available Al content than all used soils in this incubation (Table 1).

4.2. Availability of Cu

The addition of biochar significantly decreased the available content of Cu in all soils. The first reason for the biochar caused decline in the available content of Cu was the increment of soil pH. The biochar-induced decline in the available content of Cu was significantly and negatively correlated with the change in soil pH (Table 5). Meaning that, the biochar-induced increment in the pH of soil resulted in the decline of available Cu content. The increment of pH could facilitate the adsorption of hydrolyzed CuOH+ species by biochar [41]. Additionally, the increment of CEC because of the oxygen-containing organic functional groups of soil and biochar (–COOH and –OH) could contribute to the decline in the available content of Cu through ionic exchange. The carboxyl groups originated from the organic fraction of biochar have the potential to immobilize Cu in soil [42]. In our study, the relative percentage of declined DOC as a result of biochar addition is significantly and positively correlated (r > 0.9, p = 0.05) with percentage of declined Cu content (Table 3), meaning that the greater amount of decline in DOC induced by biochar addition matched with the greater decline in the available content of Cu. This could clearly indicate the direct link between the decline in the available Cu content and the decline in soil DOC content. The mechanism behind this could be the complexation of Cu with DOC through the ion exchange on oxygen-containing functional groups of DOC on both soil and biochar. Similar trends of available Cu and DOC content have been reported [43]. The adsorption of Cu could be also facilitated by biochar-induced decline in DOC [44] and facilitated the binding of organic matter with Cu [20]. An increment in the adsorption of Cu up to 28.2% due to the organic matter loading of biochar has been reported [45]. Based on their findings, the loading of humic acid (HA) up to <100 mg of carbon per L on the surface of biochar increased the negative surface functional groups of biochar and resulted in higher Cu adsorption [45]. From Table 5, it can be also concluded that there is an involvement of biochar-induced CEC increment in the decline of available Cu content in all soils except Kbely (characterized by the highest CEC level among the set of soils). The increment in the CEC of soils could increase the negatively-charged surface functional groups of both soil and biochar, thus facilitating the adsorption of Cu. Our biochar also had higher aromatic character as the production temperature was high (700 °C) with and H/C atomic ratio of 0.11. The increment in the production temperature of biochar could result in the decline of H/C ratio, leading to an increase in the aromaticity of biochar and thus causing the immobilization of Cu [46]. The multivariate analysis of variance (Table 4) revealed the highest effect was from biochar (F = 18, p < 0.01) rather than soil (F = 8.4, p < 0.01) or their interaction effect (F = 0.3, p = 0.96). This could indicate the efficiency of biochar in decreasing the availability of Cu irrespective of soils, with the effect size varying with soil properties discussed above.

4.3. Availability of Zn

The addition of biochar decreased the available content of Zn in all soils except Kbely. Similarly, the findings of Yang et al. [19] presented a decrease in the available Zn from 62.2% to 52.9% at 5% of fine and coarse textured straw biochar, respectively. Removal of Zn in pore water up to 66% by 5% rice straw biochar was reported by [20]. In another study, application of sugarcane-derived biochar (700 °C) at the rate of 5% reduced the available content of Zn by 54% [17]. In our study, the availability of Zn after the addition of biochar negatively correlated with soil pH, CEC, and exchangeable Ca2+ and K+, and was significant (p = 0.05) in most cases for all soils except Kbely (Table 6). The highest effect of biochar (F = 604, p < 0.01), followed by soil (F = 3.39, p = 0.041) and their interaction effect (F = 3.39, p = 0.036) on the induced changes, has been confirmed by the multivariate analysis of variance (Table 4). This is evidence of the clear contribution of biochar-induced pH and CEC increment in the decline in the available content of Zn. The high linkage of mobile Zn with soil pH and the enhanced immobilization of Zn with the increment in pH have been widely discussed by He et al. [47]. This is due to the increment in the pH-dependent negative charges of soil, the dominance of hydrolyzed Zn forms and the co-precipitation with Fe oxides [48]. Additionally, the formation of hemimorphite (Zn4(H2O)(Si2O7)(OH)2) and hydrozincite (Zn5(CO3)2(OH)6) was reported as a possible mechanism for the immobilization of Zn2+ by biochar [49]. However, due to the very low content of CO32− in the biochar used in this study (Table 1), we did not expect the formation of hydrozincite. However, the alkalinity of soil after the addition of biochar could favor the formation of colloid Zn(OH)2, then dissolved silicates could be adsorbed on the colloids of Zn(OH)2 and this could result in the co-precipitates structure forming amorphous hemimorphite. When we come to the exceptional Kbely soil, the low content of Zn could be highly linked to the high content of carbonate in Kbely soil as compared to other soils (Table 1). The mobility of Zn in soils with high carbonate content is low due the formation of ZnCO3 [50].

4.4. Availability of Mn

The decline in the available content of Mn was significantly correlated with the increment in soil pH. This association indicates one of the reasons for the decline in the available content of Mn is due to the low mobility of Mn at the higher pH induced by biochar [51]. Additionally, the increment of soil pH could contribute to the decline in the available content of Mn by enhancing the binding Mn with DOC-originated oxygen containing functional groups from both biochar and soil. Biochar-induced pH increment and binding of Mn with OH group are responsible for the decline in the mobility of Mn [51]. The potential for Mn2+ complexation with organic solid increases at a higher pH [52]. Furthermore, the exchange of Mn from soil exchange sites with exchangeable Ca2+ and K+ originated from biochar could contribute to the decline. The multivariate analysis of variance (Table 4) has shown high variation in biochar treatments (F = 134, p < 0.01) rather than soil (F = 56.9, p < 0.01) and their interaction effect (F = 4.95, p < 0.00). This could again confirm the ability of biochar to reduce the availability of Mn irrespective of soils.

4.5. Availability of Cd

The application of biochar was able to induce a significant decline in the available content of Cd. Yang et al. [19] reported a significant decline of Cd in naturally-contaminated soil at 5% rice straw biochar application. Similarly, the application of 10% biochar produced at 500 °C from residues of orchards was able to reduce the available content of Cd by the factor of 10 compared to control without biochar [53]. From the multivariate analysis of variance (Table 4), we observed a higher effect of biochar (F =135, p < 0.01) rather than soil type (F =135, p < 0.01) and their interaction effect (F =135, p < 0.01), thus confirming that the key factor in the decline of Cd content is biochar rather than soil type, with soil properties determining the amount of decline. The decline in the available content of Cd in all tested soils was negatively correlated with the trend in soil pH, CEC, and exchangeable Ca2+, K+ content of all soils except Kbely, whereas CEC and exchangeable Ca2+ were positively correlated (Table 8). An increment in the pH of soils could generally reduce the mobility of Cd. This is in agreement with the finding of Beesley and Marmiroli [54], where the increment of soil pH was the main reason for the decline in the available content of Cd in biochar-applied soil. The increment in soil pH after biochar application to soil was again reported to reduce mobility of Cd in soils [20]. The increment of exchangeable Ca2+ and K+ could indicate the exchange of cations for the decline in the available content of Cd. The increment in CEC of soils after biochar addition is always related to the abundance of more surface negative charges, thus facilitating the adsorption of Cd. This is supported by other studies [55,56]. For example, based on the finding of Zhang et al. [56], the release of the sum of K, Ca, Na, and Mg was equal to the amount of adsorbed Cd by biochar. Furthermore, the decline in the available content of Cd could be linked to the decline in DOC induced by biochar due to the complex formation with oxygenated functional groups of DOC from both soil and biochar. The complexation of Cd with –COOH and –OH functional groups through ion exchange is thought to be the main reason for metal removal by the biochar [57]. This is also supported by the positive correlation of DOC decline with the decline in the available content of Cd in biochar treatments (Table 3).

5. Conclusions

In this study, we incubated five soils with a wide range of physicochemical properties from different regions of the Czech Republic for 12 weeks. The available content of Al increased in one soil having low original available content of Al, high pH, and high cation exchange capacity compared to other soils and the increment was significant only at 8% of biochar application rate, while a decline in the remaining four soils was prevalent. The increment in the available content of Al is mainly attributed to the increment in the pH of soil above 6.5, the exchange of Al with exchangeable Ca2+ portion of biochar, and decline in the CEC of Kbely soil. The available content of Cu and Cd was decreased by biochar in all soils. Application of 0.5% biochar was not able to induce significant decline as well as 2% biochar in some cases but 4% and 8% of biochar significantly reduced the available content of Cu and Cd in all five soils at both incubation periods. Biochar decreased the available content of Zn and Mn in all soils except Kbely. This is due to the low available content of Zn and Mn in Kbely soil, which could be linked to the high content of carbonate in this soil. In the remaining four soils, 4% and 8% biochar rates induced a significant decline of available Zn and Mn content at both incubation periods. The immobilization of all studied elements was potentially related to the increment in the pH and cation exchange capacity of soils by biochar, the exchange with exchangeable Ca2+ and K+, and the decline in the dissolved organic carbon content of soils.

Author Contributions

N.S.H carried out the experiment and wrote the manuscript, N.S.H., F.M., K.P. and P.T. participated in the conceptualization of the experimental design and reviewing the manuscript, J.S., and L.P. reviewed the manuscript, P.T. supervised the overall experiment. All authors have read and agreed to the published version of the manuscript.

Funding

This study was funded by GAČR 19-02836S project, and European Regional Development Fund—Project No. CZ.02.1.01/0.0/0.0/16_019/ 0000845.

Acknowledgments

The authors would like to thank Laboratory technician Hana Zámečníková and Jana Najmanová for their analyses of the samples.

Conflicts of Interest

The authors declare that there is no conflict of interest.

References

  1. Jin, Z.; Liu, T.; Yang, Y.; Jackson, D. Leaching of cadmium, chromium, copper, lead, and zinc from two slag dumps with different environmental exposure periods under dynamic acidic condition. Ecotoxicol. Environ. Saf. 2014, 104, 43–50. [Google Scholar] [CrossRef] [PubMed]
  2. Zheng, S.; Zheng, X.; Chen, C. Leaching behavior of heavy metals and transformation of their speciation in polluted soil receiving simulated acid rain. PLoS ONE 2012, 7, e49664. [Google Scholar] [CrossRef] [PubMed] [Green Version]
  3. Moharami, S.; Jalali, M. Effect of acid rain on the fractionation of heavy metals and major elements in contaminated soils. Chem. Ecol. 2015, 31, 160–172. [Google Scholar] [CrossRef]
  4. Bewley, R.J.F.; Stotzky, G. Effects of combinations of simulated acid rain and cadmium or zinc on microbial activity in soil. Environ. Res. 1983, 31, 332–339. [Google Scholar] [CrossRef]
  5. Nawaz, R.; Parkpian, P.; Arshad, M.; Ahmad, F.; Garivait, H.; Ali, A.S. Mobilization and Leaching of Trace Elements (Fe, Al and Mn) in Agricultural Soils as Affected by Simulated Acid Rain. Asian J. Chem. 2013, 25, 9891. [Google Scholar] [CrossRef]
  6. Zhang, X.; Yang, H.; Cui, Z. A new indicator to evaluate the pollution of iron and manganese. RSC Adv. 2016, 6, 27963–27968. [Google Scholar] [CrossRef]
  7. Liao, B.; Liu, H.; Zeng, Q.; Yu, P.; Probst, A.; Probst, J.-L. Complex toxic effects of Cd2+, Zn2+, and acid rain on growth of kidney bean (Phaseolus vulgaris L). Environ. Int. 2005, 31, 891–895. [Google Scholar] [CrossRef] [Green Version]
  8. Singh, S.; Tripathi, D.K.; Singh, S.; Sharma, S.; Dubey, N.K.; Chauhan, N.K.; Dubey, D.K.; Vaculík, M. Toxicity of aluminium on various levels of plant cells and organism: A review. Environ. Exp. Bot. 2017, 137, 177–193. [Google Scholar] [CrossRef]
  9. Guo, F.Y.; Ding, C.F.; Zhou, Z.G.; Huang, G.X.; Wang, X.X. Stability of immobilization remediation of several amendments on cadmium contaminated soils as affected by simulated soil acidification. Ecotoxicol. Environ. Saf. 2018, 161, 164–172. [Google Scholar] [CrossRef]
  10. Pabian, S.E.; Ermer, N.M.; Tzilkowski, W.M.; Brittingham, M.C. Effects of liming on forage availability and nutrient content in a forest impacted by acid rain. PLoS ONE 2012, 7, e39755. [Google Scholar] [CrossRef] [Green Version]
  11. Shao, S.; Driscoll, C.T.; Johnson, C.E.; Fahey, T.J.; Battles, J.J.; Blum, J.D. Long-term responses in soil solution and stream-water chemistry at Hubbard Brook after experimental addition of wollastonite. Environ. Chem. 2015, 13, 528–540. [Google Scholar] [CrossRef] [Green Version]
  12. Zhu, X. Study of cadmium adsorption and desorption by simulant acid rain on different silicate clay minerals in soil. In Proceedings of the 2010 4th International Conference on Bioinformatics and Biomedical Engineering, Chengdu, China, 18–20 June 2010; pp. 1–4. [Google Scholar]
  13. Zhu, H.; Wu, C.; Wang, J.; Zhang, X. The effect of simulated acid rain on the stabilization of cadmium in contaminated agricultural soils treated with stabilizing agents. Environ. Sci. Pollut. Res. 2018, 25, 17499–17508. [Google Scholar] [CrossRef] [PubMed]
  14. Brendova, K.; Tlustos, P.; Száková, J. Biochar immobilizes cadmium and zinc and improves phytoextraction potential of willow plants on extremely contaminated soil. Plant Soil Environ. 2015, 61, 303–308. [Google Scholar] [CrossRef] [Green Version]
  15. Jiang, T.; Xu, R.; Gu, T.; Jiang, J. Effect of crop-straw derived biochars on pb (ii) adsorption in two variable charge soils. J. Integr. Agric. 2014, 13, 507–516. [Google Scholar] [CrossRef]
  16. Park, J.H.; Choppala, G.K.; Bolan, N.S.; Chung, J.W.; Chuasavathi, T. Biochar reduces the bioavailability and phytotoxicity of heavy metals. Plant Soil 2011, 348, 439. [Google Scholar] [CrossRef]
  17. Puga, A.P.; Abreu, C.A.; Melo, L.C.A.; Beesley, L. Biochar application to a contaminated soil reduces the availability and plant uptake of zinc, lead and cadmium. J. Environ. Manag. 2015, 159, 86–93. [Google Scholar] [CrossRef] [PubMed]
  18. Yu, X.-Y.; Ying, G.-G.; Kookana, R.S. Reduced plant uptake of pesticides with biochar additions to soil. Chemosphere 2009, 76, 665–671. [Google Scholar] [CrossRef]
  19. Yang, X.; Liu, J.; McGrouther, K.; Huang, H.; Lu, K.; Guo, X.; He, L.; Lin, X.; Che, L.; Ye, Z.; et al. Effect of biochar on the extractability of heavy metals (Cd, Cu, Pb, and Zn) and enzyme activity in soil. Environ. Sci. Pollut. Res. 2016, 23, 974–984. [Google Scholar] [CrossRef]
  20. Lu, K.; Yang, X.; Gielen, G.; Bolan, N.; Ok, Y.S.; Niazi, N.K.; Xu, S.; Yuan, G.; Chen, X.; Zhang, X.; et al. Effect of bamboo and rice straw biochars on the mobility and redistribution of heavy metals (Cd, Cu, Pb and Zn) in contaminated soil. J. Environ. Manag. 2017, 186, 285–292. [Google Scholar] [CrossRef]
  21. Wang, Y.; Xu, Y.; Li, D.; Tang, B.; Man, S.; Jia, Y.; Xu, H. Vermicompost and biochar as bio-conditioners to immobilize heavy metal and improve soil fertility on cadmium contaminated soil under acid rain stress. Sci. Total Environ. 2018, 621, 1057–1065. [Google Scholar] [CrossRef]
  22. Lu, H.; Li, Z.; Fu, S.; Méndez, A.; Gascó, G.; Paz-Ferreiro, J. Effect of biochar in cadmium availability and soil biological activity in an anthrosol following acid rain deposition and aging. Water Air Soil Pollut. 2015, 226, 164. [Google Scholar] [CrossRef]
  23. Mukwaturi, M.; Lin, C. Mobilization of heavy metals from urban contaminated soils under water inundation conditions. J. Hazard. Mater. 2015, 285, 445–452. [Google Scholar] [CrossRef] [PubMed]
  24. Alozie, N.; Heaney, N.; Lin, C. Biochar immobilizes soil-borne arsenic but not cationic metals in the presence of low-molecular-weight organic acids. Sci. Total Environ. 2018, 630, 1188–1194. [Google Scholar] [CrossRef] [PubMed]
  25. Li, H.; Dong, X.; da Silva, E.B.; de Oliveira, L.M.; Chen, Y.; Ma, L.Q. Mechanisms of metal sorption by biochars: Biochar characteristics and modifications. Chemosphere 2017, 178, 466–478. [Google Scholar] [CrossRef]
  26. Hailegnaw, N.S.; Mercl, F.; Pračke, K.; Száková, J.; Tlustoš, P. Mutual relationships of biochar and soil pH, CEC, and exchangeable base cations in a model laboratory experiment. J. Soils Sediments 2019, 19, 2405–2416. [Google Scholar] [CrossRef]
  27. Hailegnaw, N.S.; Mercl, F.; Pračke, K.; Száková, J.; Tlustoš, P. High temperature-produced biochar can be efficient in nitrate loss prevention and carbon sequestration. Geoderma 2019, 338, 48–55. [Google Scholar] [CrossRef]
  28. ISO 10390:2005(en), Soil Quality—Determination of pH [WWW Document], n.d. Available online: https://www.iso.org/obp/ui/#iso:std:iso:10390:ed-2:v1:en (accessed on 26 October 2019).
  29. Gillman, G.P. A proposed method for the measurement of exchange properties of highly weathered soils. Soil Res. 1979, 17, 129–139. [Google Scholar] [CrossRef]
  30. Jászberényi, I.; Loch, J.; Sarkadi, J. Experiences with 0.01 M calcium chloride as an extraction reagent for use as a soil testing procedure in Hungary. Commun. Soil Sci. Plant Anal. 1994, 25, 1771–1777. [Google Scholar] [CrossRef]
  31. Buckley, D.E.; Cranston, R.E. Atomic absorption analyses of 18 elements from a single decomposition of aluminosilicate. Chem. Geol. 1971, 7, 273–284. [Google Scholar] [CrossRef]
  32. Yuan, J.-H.; Xu, R.-K. The amelioration effects of low temperature biochar generated from nine crop residues on an acidic Ultisol. Soil Use Manag. 2011, 27, 110–115. [Google Scholar] [CrossRef]
  33. Ritchie, G.S.P. Role of dissolution and precipitation of minerals in controlling soluble aluminum in acidic soils. Adv. Apronomy 1994, 53, 47. [Google Scholar]
  34. Qian, L.; Chen, B. Interactions of aluminum with biochars and oxidized biochars: Implications for the biochar aging process. J. Agric. Food Chem. 2014, 62, 373–380. [Google Scholar] [CrossRef] [PubMed]
  35. Qian, L.; Chen, B.; Hu, D. Effective alleviation of aluminum phytotoxicity by manure-derived biochar. Environ. Sci. Technol. 2013, 47, 2737–2745. [Google Scholar] [CrossRef] [PubMed]
  36. Wehr, J.B.; Blamey, F.P.C.; Hanna, J.V.; Kopittke, P.M.; Kerven, G.L.; Menzies, N.W. Hydrolysis and speciation of Al bound to pectin and plant cell wall material and its reaction with the dye chrome azurol S. J. Agric. Food Chem. 2010, 58, 5553–5560. [Google Scholar] [CrossRef] [PubMed]
  37. Jansen, B.; Nierop, K.G.; Verstraten, J.M. Influence of pH and metal/carbon ratios on soluble organic complexation of Fe (II), Fe (III) and Al (III) in soil solutions determined by diffusive gradients in thin films. Anal. Chim. Acta 2002, 454, 259–270. [Google Scholar] [CrossRef]
  38. Evans, L.J. Chemistry of metal retention by soils. Environ. Sci. Technol. 1989, 23, 1046–1056. [Google Scholar] [CrossRef]
  39. Sverdrup, H.; De Vries, W. Calculating critical loads for acidity with the simple mass balance method. Water Air Soil Pollut. 1994, 72, 143–162. [Google Scholar] [CrossRef]
  40. Driscoll, C.T.; Schecher, W.D. The chemistry of aluminum in the environment. Environ. Geochem. Health 1990, 12, 28–49. [Google Scholar] [CrossRef]
  41. Atanassova, I.; Okazaki, M. Adsorption-desorption characteristics of high levels of copper in soil clay fractions. Water Air Soil Pollut. 1997, 98, 213–228. [Google Scholar] [CrossRef]
  42. Uchimiya, M.; Lima, I.M.; Thomas Klasson, K.; Chang, S.; Wartelle, L.H.; Rodgers, J.E. Immobilization of heavy metal ions (CuII, CdII, NiII, and PbII) by broiler litter-derived biochars in water and soil. J. Agric. Food Chem. 2010, 58, 5538–5544. [Google Scholar] [CrossRef]
  43. Beesley, L.; Moreno-Jiménez, E.; Gomez-Eyles, J.L. Effects of biochar and greenwaste compost amendments on mobility, bioavailability and toxicity of inorganic and organic contaminants in a multi-element polluted soil. Environ. Pollut. 2010, 158, 2282–2287. [Google Scholar] [CrossRef] [PubMed]
  44. Pietikäinen, J.; Kiikkilä, O.; Fritze, H. Charcoal as a habitat for microbes and its effect on the microbial community of the underlying humus. Oikos 2000, 89, 231–242. [Google Scholar] [CrossRef]
  45. He, P.; Yu, Q.; Zhang, H.; Shao, L.; Lü, F. Removal of Copper (II) by Biochar Mediated by Dissolved Organic Matter. Sci. Rep. 2017, 7, 1–10. [Google Scholar] [CrossRef] [PubMed]
  46. Xiao, X.; Chen, Z.; Chen, B. H/C atomic ratio as a smart linkage between pyrolytic temperatures, aromatic clusters and sorption properties of biochars derived from diverse precursory materials. Sci. Rep. 2016, 6, 22644. [Google Scholar] [CrossRef] [PubMed] [Green Version]
  47. He, Z.L.; Zhang, M.; Yang, X.E.; Stoffella, P.J. Release behavior of copper and zinc from sandy soils. Soil Sci. Soc. Am. J. 2006, 70, 1699–1707. [Google Scholar] [CrossRef]
  48. Alloway, B.J. Soil factors associated with zinc deficiency in crops and humans. Environ. Geochem. Health 2009, 31, 537–548. [Google Scholar] [CrossRef]
  49. Qian, T.; Wang, Y.; Fan, T.; Fang, G.; Zhou, D. A new insight into the immobilization mechanism of Zn on biochar: The role of anions dissolved from ash. Sci. Rep. 2016, 6, 33630. [Google Scholar] [CrossRef] [Green Version]
  50. Madrid, L.; Diaz-Barrientos, E. Influence of carbonate on the reaction of heavy metals in soils. J. Soil Sci. 1992, 43, 709–721. [Google Scholar] [CrossRef]
  51. Idrees, M.; Batool, S.; Ullah, H.; Hussain, Q.; Al-Wabel, M.I.; Ahmad, M.; Hussain, A.; Riaz, M.; Ok, Y.S.; Kong, J. Adsorption and thermodynamic mechanisms of manganese removal from aqueous media by biowaste-derived biochars. J. Mol. Liq. 2018, 266, 373–380. [Google Scholar] [CrossRef]
  52. McBride, M.B. Electron Spin Resonance Investigation of Mn2+ Complexation in Natural and Synthetic Organics 1. Soil Sci. Soc. Am. J. 1982, 46, 1137–1143. [Google Scholar] [CrossRef]
  53. Fellet, G.; Marchiol, L.; Delle Vedove, G.; Peressotti, A. Application of biochar on mine tailings: Effects and perspectives for land reclamation. Chemosphere 2011, 83, 1262–1267. [Google Scholar] [CrossRef] [PubMed]
  54. Beesley, L.; Marmiroli, M. The immobilisation and retention of soluble arsenic, cadmium and zinc by biochar. Environ. Pollut. 2011, 159, 474–480. [Google Scholar] [CrossRef] [PubMed]
  55. Harvey, O.R.; Herbert, B.E.; Rhue, R.D.; Kuo, L.-J. Metal Interactions at the Biochar-Water Interface: Energetics and Structure-Sorption Relationships Elucidated by Flow Adsorption Microcalorimetry. Environ. Sci. Technol. 2011, 45, 5550–5556. [Google Scholar] [CrossRef]
  56. Zhang, F.; Wang, X.; Yin, D.; Peng, B.; Tan, C.; Liu, Y.; Tan, X.; Wu, S. Efficiency and mechanisms of Cd removal from aqueous solution by biochar derived from water hyacinth (Eichornia crassipes). J. Environ. Manag. 2015, 153, 68–73. [Google Scholar] [CrossRef] [PubMed]
  57. Xu, X.; Cao, X.; Zhao, L. Comparison of rice husk- and dairy manure-derived biochars for simultaneously removing heavy metals from aqueous solutions: Role of mineral components in biochars. Chemosphere 2013, 92, 955–961. [Google Scholar] [CrossRef]
Figure 1. Effect of biochar addition on soil-available content of Al (mg kg−1). On the horizontal axis, 1 and 12 stand for 1st and 12th week of incubation period or sample collection time, respectively. Different capital case letters represent significance difference (p < 0.05) of treatments within same sample collection time of same soil.
Agronomy 10 00885 g001
Figure 2. Effect of biochar addition on soil-available content of Cu (mg kg−1). On the horizontal axis, 1 and 12 stand for 1st and 12th week of incubation period or sample collection time, respectively. Different capital case letters represent significance difference (p < 0.05) of treatments within same sample collection time of same soil.
Agronomy 10 00885 g002
Figure 3. Effect of biochar addition on soil-available content of Zn (mg kg−1). On the horizontal axis, 1 and 12 stand for 1st and 12th week of incubation period or sample collection time, respectively. Kbely soil is not presented due to the available content of Zn is below detection limit of ICP used for the measurement (below 0.02 mg kg−1). Different capital case letters represent significance difference (p < 0.05) of treatments within same sample collection time of same soil.
Agronomy 10 00885 g003
Figure 4. Effect of biochar addition on soil-available content of Mn (mg kg−1). On the horizontal axis, 1 and 12 stand for 1st and 12th week of incubation period or sample collection time, respectively. Different capital case letters represent significance difference (p < 0.05) of treatments within same sample collection time of same soil.
Agronomy 10 00885 g004
Figure 5. Effect of biochar addition on soil-available content of Cd (mg kg−1). On the horizontal axis, 1 and 12 stand for 1st and 12th week of incubation period or sample collection time, respectively. Different capital case letters represent significance difference (p < 0.05) of treatments within same sample collection time of same soil.
Agronomy 10 00885 g005
Table 1. Selected physiochemical properties of incubated soils and biochar.
PropertiesKbelyLhotaHumpolecŽamberkLukavecBiochar
Localization50°08′01.9″ N 49°42′00.0″ N 49°33′00.0″ N 50°08′39.6″ N 49°33′00.0″ N -
14°33′56.3″ E13°59′00.0″ E15°21′00.0″ E16°30′50.0″ E14°58′00.0″ E-
Soil typeChernozemFluvisolCambisolCambisolCambisol-
pH7.015.914.504.805.309.50
CEC (mmol kg−1)217 ± 0.30130 ± 4.7090.3 ± 2.0074.9 ± 3.7048.5 ± 6.00102 ± 5.20
Total C (%)4.28 ± 0.092.67 ± 0.041.60 ± 0.091.98 ± 0.091.48 ± 0.1387.5 ± 0.20
DOC (mg kg−1)120 ± 1.7076.3 ± 2.4011.7 ± 0.6063.6 ± 2.0063.4 ± 2.10281 ± 8.67
CO32− (%)2.17 ± 0.010.21 ± 0.000.20 ± 0.000.18 ± 0.000.20 ± 0.010.19 ± 0.01
Al (mg kg−1) †27,205 ± 147025,008 ± 132729,275 ± 83.020,178 ± 86335,811 ± 607988 ± 10.0
Cu (mg kg−1) †46.0 ± 3.9024.0 ± 4.3249.0 ± 2.05102 ± 0.6118.0 ± 0.407.00 ± 1.60
Zn (mg kg−1) †138 ± 0.45240 ± 43.0156 ± 12.061.0 ± 12.980.0 ± 0.6015.0 ± 2.40
Mn (mg kg−1) †417 ± 0.01077 ± 600427 ± 13.1792 ± 53.0735 ± 9.30893 ± 15.0
Cd (mg kg−1) †0.12 ± 1.650.26 ± 0.891.34 ± 0.580.18 ± 0.030.15 ± 0.0010.12 ± 0.01
Al (mg kg−1) §0.81 ± 0.331.19 ± 0.045.97 ± 0.283.04 ± 0.315.04 ± 0.9838.9 ± 0.85
Cu (mg kg−1) §0.25 ± 0.140.11 ± 0.000.16 ± 0.010.07 ± 0.000.09 ± 0.010.04 ± 0.00
Zn (mg kg−1) §n.d1.83 ± 0.030.85 ± 0.210.24 ± 0.000.21 ± 0.040.26 ± 0.02
Mn (mg kg−1) §1.84 ± 0.2714.7 ± 0.3867.4 ± 0.5967.6 ± 0.7829.3 ± 2.120.12 ± 0.017
Cd (mg kg−1) §0.07 ± 0.040.14 ± 0.010.04 ± 0.000.03 ± 0.000.03 ± 0.00n.d
Sand (%)14.939.630.226.127.9-
Silt (%)60.245.548.459.961.2-
Clay (%)24.914.921.414.111.6-
Textural ClassSilt LoamLoamLoamSilt LoamSilt Loam-
†: Pseudo total content, §: 0.01 M CaCl2 extractable content, n.d: not detectable (detection limit of inductively-coupled plasma–optical emission spectrometer (ICP-OES) = 0.01 mg kg−1 Cd, 0.02 mg kg−1 Al), CEC: cation exchange capacity, DOC: dissolved organic carbon.
Table 2. Pearson correlation coefficient of available Al content with soil pH, CEC, and exchangeable Ca2+ and K+ after addition of four levels of biochar (0.5%, 2%, 4%, and 8%) at the 12th week of incubation.
Al (n = 5)
KbelyLhotaHumpolecŽamberkLukavec
pH0.98 **−0.97 **−0.96 **−0.95 **−0.94 **
CEC−0.094 **−0.94 **−0.89 *−0.96 **−0.93 *
Exchangeable Ca2+−0.93 *−0.82 *−0.86 *−0.93 *−0.95 **
Exchangeable K+0.91 *−0.98 **−0.67−0.75−0.85 *
** Correlation is significant at p = 0.01, * correlation is significant at p = 0.05.
Table 3. Pearson correlation coefficient of percentage change in the available content of Al, Cu, Zn, Cd, and Mn (content in the control subtracted from biochar treatments) in individual soils with the percentage of change in DOC.
KbelyLhotaHumpolecŽamberkLukavec
Al (n = 4)0.96 **0.82 **0.97 **0.98 **0.94 **
Zn (n = 4)-0.98 **0.96 **0.94 **0.99 **
Cu (n = 4)0.95 **0.97 **0.97 **0.93 **0.98 **
Mn (n = 4)−0.300.94 **0.98 **0.98 **0.92 **
Cd (n = 4)0.85 **0.96 **0.82 **0.94 **0.99 **
** Significant at p = 0.01; correlation was not done in the case of Kbely due to the available content of Zn being below the detection limit of ICP used for the measurement (below 0.02 mg kg −1).
Table 4. Multivariate analysis of variance in the change of soil Al, Cu, Zn, Cd, and Mn content (content in the control subtracted from biochar treatments) with interaction and single effect of factors.
SoilBiochar Soil * Biochar
AlF11714.39.21
df4312
p0.000.000.00
CuF8.4118.00.36
df4312
p0.000.000.96
ZnF3.396042.77
df339
p0.0410.000.036
CdF46.61352.75
df4312
p0.000.000.02
MnF56.91344.95
df4312
p0.000.000.00
The italicized values indicate the significance level at n = 20. DF: degree of freedom, F: F test, and p: p value, *; interaction effect.
Table 5. Pearson correlation coefficient of available Cu content with soil pH, CEC, and exchangeable Ca2+ and K+ after addition of four levels of biochar (0.5%, 2%, 4% and 8%) at the 12th week of incubation.
Cu (n = 5)
KbelyLhotaHumpolecŽamberkLukavec
pH−0.95 **−0.66−0.99 **−0.87 *−0.97 **
CEC0.99 **−0.68−0.97 **−0.978 **−0.94 **
Exchangeable Ca2+0.99 **−0.23−0.95 **−0.87 *−0.96 **
Exchangeable K+−0.99 **−0.66−0.83*−0.62−0.94 **
** Correlation is significant at p = 0.01, * correlation is significant at p = 0.05.
Table 6. Pearson correlation coefficient of available Zn content with soil pH, CEC, and exchangeable Ca2+ and K+ after addition of four levels of biochar (0.5%, 2%, 4%, and 8%) at the 12th week of incubation.
Zn (n = 5)
KbelyLhotaHumpolecŽamberkLukavec
pH-−0.95 **−0.97 **−0.92 *−0.86 *
CEC-−0.91 *−0.89 *−0.96 **−0.79
Exchangeable Ca2+-−0.7−0.87 *−0.92 *−0.87 *
Exchangeable K+-−0.94 **−0.68−0.71−0.68
** Correlation is significant at p = 0.01, * correlation is significant at p = 0.05; correlation was not done in the case of Kbely due to the available content of Zn is below detection limit of ICP used for the measurement (below 0.02 mg kg −1).
Table 7. Pearson correlation coefficient of available Mn content with soil pH, CEC, and exchangeable Ca2+ and K+ after addition of four levels of biochar (0.5%, 2%, 4%, and 8%) at the 12th week of incubation.
Mn (n = 5)
KbelyLhotaHumpolecŽamberkLukavec
pH−0.56−0.99 **−0.99 **−0.99 **−0.99 **
CEC0.31−0.96 **−0.96 **−0.87 *−0.99 **
Exchangeable Ca2+0.34−0.80−0.93 *−0.98 **−0.99 **
Exchangeable K+−0.28−0.98 **−0.80−0.89 *−0.96 **
** Correlation is significant at p = 0.01, * correlation is significant at p = 0.05.
Table 8. Pearson correlation coefficient of available Cd content with soil pH, CEC, and exchangeable Ca2+ and K+ after addition of four levels of biochar (0.5%, 2%, 4%, and 8%) at the 12th week of incubation.
Cd (n = 5)
KbelyLhotaHumpolecŽamberkLukavec
pH−0.96 **−0.98 **−0.88 *−0.96 **−0.95 **
CEC0.89 *−0.95 **−0.75−0.93 *−0.89 *
Exchangeable Ca2+0.92 *−0.80−0.74−0.96 **−0.96 **
Exchangeable K+−0.89 *−0.97 **−0.51−0.80−0.82 *
** Correlation is significant at p = 0.01, * correlation is significant at p = 0.05.

