Article

Effect of Row Spacing, Sowing Density, and Harvest Time on Floret Yield and Yield Components of Two Safflower Cultivars Grown in Southwestern Germany

Institute of Crop Science, University of Hohenheim, 70599 Stuttgart, Germany
*
Author to whom correspondence should be addressed.
Agronomy 2020, 10(5), 664; https://doi.org/10.3390/agronomy10050664
Submission received: 14 April 2020 / Revised: 4 May 2020 / Accepted: 6 May 2020 / Published: 8 May 2020

Abstract

:
The current demand for safflower florets (Carthamus tinctorius L.) in the food-coloring industry, especially in Europe, is rising. The present production, mainly located in China, is not sufficient. Unlike for the production of seeds, there are currently no recommendations for the cultivation of safflower for floret production in Germany. Therefore, field experiments were conducted at the experimental station Ihinger Hof, Southwestern Germany, in 2017 and 2018. The aim was to evaluate yield and yield parameters, such as number of capitula, floret yield, and carthamidin content for (i) two cultivars grown with (ii) two row spacing (12 and 33 cm) using (iii) two sowing densities (40 and 75 plants m−2), and (iv) five harvest dates. Results showed that lower sowing densities resulted in a significantly larger number of branches and capitula per plant and higher yields of florets and carthamidin. Harvesting two to three weeks after flowering resulted in the significantly highest floret and carthamidin yields. More capitula per plant, higher carthamidin contents, and higher floret and carthamidin yields were obtained with the Chinese cultivar. In general, yields of flowering florets (2.30–468.96 kg ha−1), carthamidin contents (2.53–8.29%), and carthamidin yields (0.04–37.86 kg ha−1) were comparable to or higher than in other studies. In conclusion, this study showed that safflower has great potential for the production of florets in Southwest Germany, for the food-color industry.

1. Introduction

Safflower (Carthamus tinctorius L.) belongs to the Asteraceae family and is one of the oldest crops used by humans [1,2,3]. It is an annual thistle-like plant, which can reach a height between 0.3 and 2.1 m [1,3,4]. Safflower produces primary, secondary, and tertiary branches, each with a globular flower head (capitulum) at its end, with yellow, orange, or red flowers (florets) [1,3,4]. Safflower is a multifunctional plant used, for example, as bird seed, a medicinal plant, livestock forage, tea, or as cut flowers [1,5,6,7]. Currently, safflower is mainly grown for its oil, which is rich in bioactive compounds and highly polyunsaturated fatty acids [1,7,8,9]. In addition, safflower has traditionally been used for its flowers, which were applied as colorant for textiles and foods [1,2,7,9]. After the invention of Mauveine in 1856, which is derived from aniline and therefore cheaper, the need for natural dyes decreased [4,10]. Nowadays, cultivation of safflower as colorant take place, e.g., in China, but other uses were more important globally [4,11].
However, the demand for healthier, safer food due to allergic or carcinogenic effects which can be caused by artificial colorants and the need for biodegradable colorants increased the interest in natural food colorants [12,13,14,15]. Since 2013, the new EU directives “Guidance notes on the classification of food extracts with coloring properties” distinguish between “dyes”, which are regarded as additives and require a legal approval and “Coloring Foods”, which are not subject to any additional approval [9,16,17,18]. Therefore, interest in natural dyes increased even more [9,16,17,19]. According to the directives of the EU the food-coloring industry considers safflower as a suitable yellow- and orange-coloring alternative because it has a low enrichment factor compared to the conventionally used curcuma or paprika extracts [16,20]. The yellow colorants of safflower are increasingly used in cheese, sausages, pastries, candies, fruit syrups, and fruit juices [5,21]. Safflower can be used, for example, as a natural replacement for two of the “Southampton Six” (connection to hyperactivity in children) color additives for confectionery products, Tartrazine (E102) and Quinoline Yellow (E104) [22,23]. The yellow pigment of safflower has many advantages compared to other colorants, e.g., highly soluble in water, cheaper than saffron, stable to light in aqueous solutions, and it can be used at different temperatures and pH values [24,25].
So far, the demand for safflower florets is mainly met by deliveries from Asia [4,26]. However, the existing cultivation area is not sufficient to meet the increased demand [9,19,27,28]. Therefore, cultivation guidelines for other regions must be developed to cover the demand regionally and sustainably.
Many factors, such as environment, cultivar, harvest time, and cultivation system, play an important role in optimizing floret yield and their color content, finally determining color yield [29,30,31,32]. One of the major factors is the selection of cultivar and its origin, which influences the flower color and the number of capitula and branches [29,30,33,34]. The number of capitula and branches, in turn, depends on agronomic practices like sowing density and row spacing and thus impacts the final floret yield [35,36,37,38]. The numbers of capitula and branches are further influenced by environmental conditions, as it was shown in a study of Kizil et al. [30] in which more rain resulted in an increased number of these. On the other hand, drier conditions could also have a positive effect, with an increase in secondary phytochemicals, including colorants [39,40]. Agronomic practices like sowing density and row spacing play an important role for growth and productivity of safflower, and it is essential to determine them for different locations and growing conditions [37,38,41,42]. Furthermore, the color content and the floret yield varies with the cultivar and also depends on the harvest time [29,30,34,36].
The cultivation under Southwestern Germany conditions for floret yield has not been assessed yet and therefore requires testing of the harvest dates and cultivation methods compared to oil production. Therefore, the objectives of the present study were to identify the impact of different (i) row spacing, (ii) sowing densities, and (iii) harvest times on yield parameters like number of capitula and branches, floret yield, color content, and color yield of two different safflower cultivars under the pedoclimatic conditions of Southwestern Germany.

2. Materials and Methods
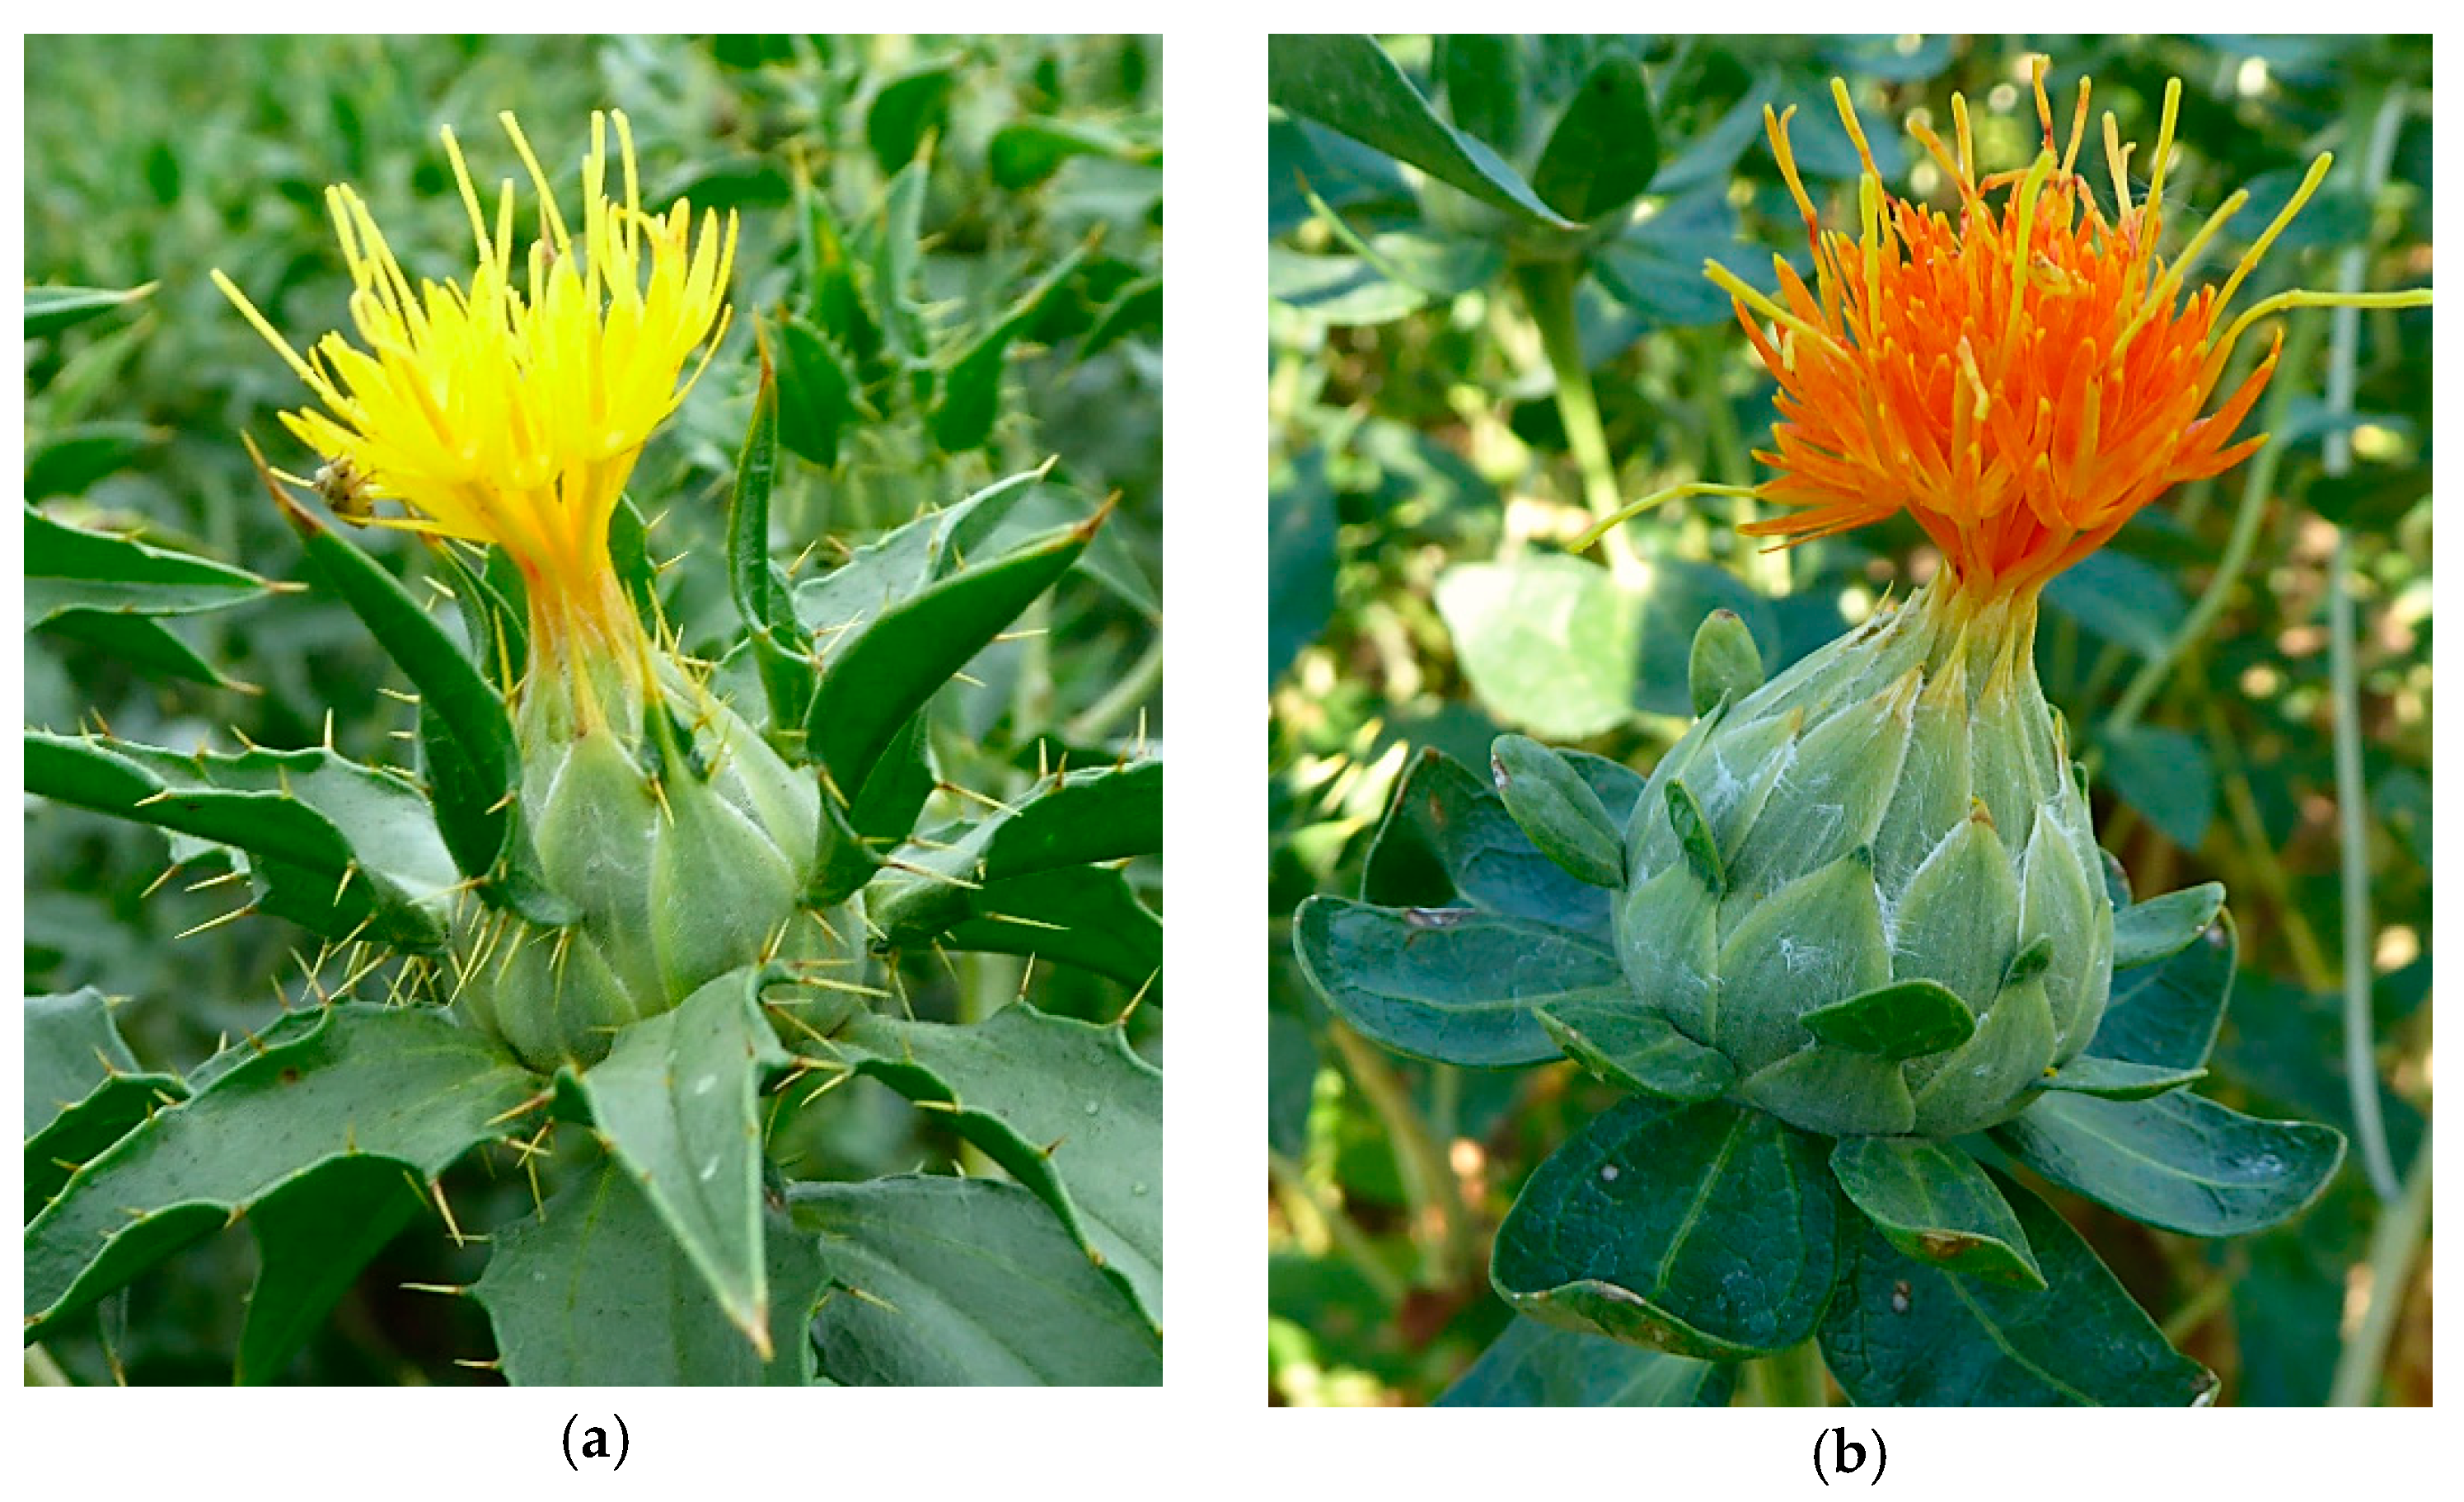
2.1. Plant Material

Two different cultivars of Carthamus tinctorius L. were used in two field trials over two years. Both cultivars are used especially for floret production, but show differences in flower color and origin. The German cultivar cv. “Goldschopf” (Gartenland Produkion GmbH, Aschersleben, Germany) was used. The seeds of the Chinese cultivar were provided by a food-coloring company. The German cultivar (C1) is characterized as spiny, with primarily yellow florets, while the Chinese cultivar (C2) is thornless and has orange florets (Figure 1).

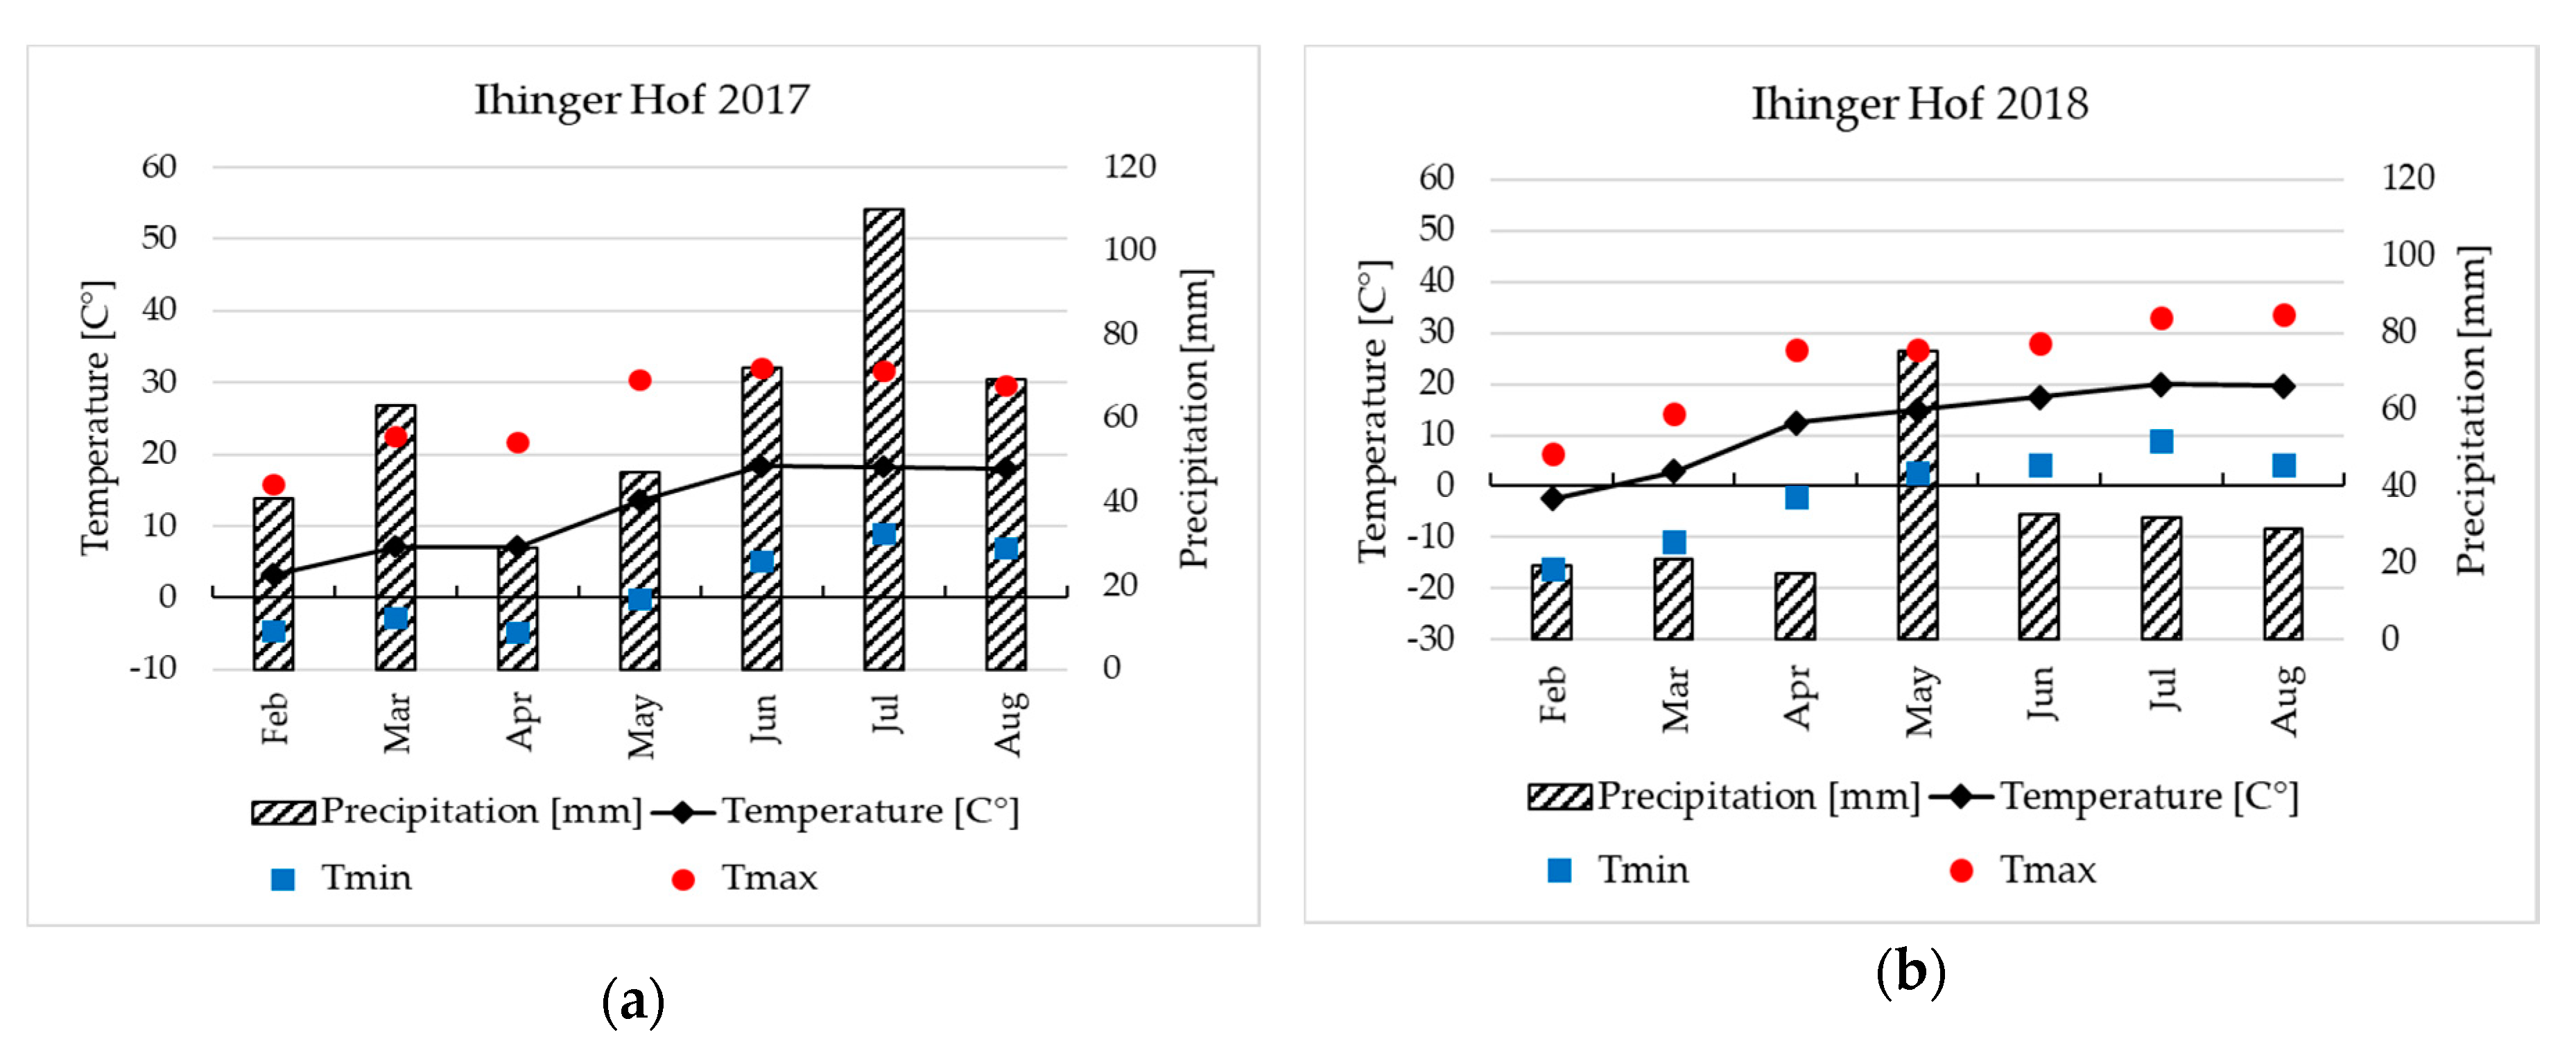
2.2. Field Site Characteristics

The field trials were conducted at the experimental station Ihinger Hof (48°44′ N, 8°55′ E, 478 m a.s.l.) of the University of Hohenheim, in Southwestern Germany, in 2017 and 2018.
According to the World Reference Base, the soils can be classified as vertic Luvisol in 2017 and vertic Cambisol in 2018 [43,44]. Both soil types are known to be fertile and appropriate for growing many different types of crops [43,44]. Soil textures were determined in the depths of 0–30, 30–60, and 60–90 cm, according to Köhn [45]. The clay content was on average 30.5%, the sand content 3%, and the silt content 66.5%. The mineral nitrogen content of the soil (Nmin) was measured according to Thun and Hoffmann [46], using a flow injection analyzer (FIAstar 5000 Analyzer, FOSS GmbH, Hamburg, Germany). The mineral nitrogen contents of the two years were different and resulted in 124 kg ha−1 in 2017 and 45 kg ha−1 in 2018 for 0–90 cm depth.
The average long-term (8 years) temperature at the experimental site is 9.6 °C, with an average annual precipitation of 683.4 mm. In comparison, the experimental year 2017 had both a lower annual average temperature of 9.2 °C and a lower annual precipitation of 653.9 mm. In 2018, however, the annual rainfall was even lower with 525.9 mm, while the average temperature of 10.2 °C was higher than the long-term average. Comparing single months, maximum temperatures were higher in May and June 2017, while in July and August, the maximum temperatures were higher in 2018, respectively.
Weather data were recorded by an automatic weather station at the experimental station. When comparing the vegetation period, we saw there was less rainfall and higher temperatures in 2018 compared to 2017 (Figure 2).

2.3. Field Experiments

The field trials were conducted as randomized, complete block designs with three replicates. Each plot within a replicate was further subdivided into five sub-plots and harvested separately. The two safflower cultivars C1 and C2 were grown in two different row spacings (12 (S1) and 33 cm (S2)) and two different sowing densities (40 (D1) and 75 plants m−2 (D2)), resulting in eight treatment combinations (Table 1). Sequence of harvested sub-plot within a plot was randomized according to a randomized complete block design. A total of 24 plots per year were arranged. Plot size was 32 m2 (8 m × 4 m). Treatments and harvest dates were randomly assigned to plots and sub-plots, using CycDesigN 5 (VSNI, Hemel Hemstead, Unites Kingdom).
The previous crop was wheat and triticale in 2017 and 2018, respectively. With the cultivator “POM Meteor” (MEZGER Landtechnik GmbH & Co. KG, Ditzingen, Germany), the residues of the previous crops were incorporated six months before sowing to a depth of 3–5 cm. At the end of November, the experimental fields were ploughed with “Juwel 8 TCP V” (LEMKEN GmbH and Co. KG, Alpen, Germany) to a depth of around 25 cm. Before sowing, the seedbed was prepared in both years to a depth of 5–8 cm, with the rotary harrow “HRB 403” (Kuhn Maschinen-Vertrieb GmbH, Genthin, Germany) and the prism roller “Simplex” (Güttler GmbH, Kirchheim/Teck, Germany). Sowing was carried out with a plot driller “Deppe D82” (Agrar-Markt DEPPE GmbH, Bad Lauterberg-Barbis, Germany), at a depth of 2 cm, on 25 April 2017 and on 19 April 2018. The target soil mineral nitrogen content was 80 kg N ha−1. Since this value was exceeded in 2017, no fertilizer was applied in that year. In 2018, 40 kg N ha−1 was applied as calcium ammonium nitrate shortly after sowing, using the fertilizer broadcaster “UKS 230” (RAUCH Landmaschinenfabrik GmbH, Sinzheim, Germany). Manual weeding was done twice in 2017 (31 May and on 7 June, 35 and 43 days after sowing (DAS)) and due to high weed pressure eight times in 2018 between 25 April and 30 May (6 to 41 DAS) until safflower plants reached the branching stage at which the plants are no longer susceptible to weeds [47,48,49]. In 2017, symptoms of Alternaria leaf spot disease were observed for the cultivar C1 in July, but no disease or pest management was applied.

2.4. Data Collection

2.4.1. Destructive Harvests

Harvesting started when most plants had reached the principal growth stage 6 (flowering following the BBCH scale) [49], and were then carried out once a week between 18 July and 15 August 2017, and between 10 July and 7 August 2018 (Table 2). At each harvest, all plants from an area of 0.25 m2 within each sub-plot were cut manually at the soil surface in the center rows, and the fresh matter of the whole sample was recorded. Samples were then separated into capitula, florets, and residual plant parts. The number of capitula was recorded, and florets were removed from the capitula and separated into the categories “flowering” and “withered”. The number of primary branches was recorded on the first and on the third harvest. Afterward, no further change in the number of primary branches was observed. Fresh weights of the mentioned plant parts were determined before drying them to constant weight to record dry matter. The dry matter content was determined by dividing the dry matter by the fresh matter. Florets were dried according to Mohammadi and Tavakoli [29], at 40 °C, and the remaining samples at 100 °C.

2.4.2. Determination of Color Content (Carthamidin Content)

The carthamidin content (yellow pigment) of the flowering florets was determined spectrophotometrically according to Mohammadi and Tavakoli [29] and the method of the FAO [50], with minor modifications. For the extraction of carthamidin, 0.015–0.018 g of dried florets was put into a 50 mL screw cab falcon tube. These were filled to a volume of 50 mL with a citric acid/disodium hydrogen phosphate buffer solution (pH 5.0), which was made after McIlvain [51]. Samples were shaken at room temperature for 90 min, with a frequency of 100 rpm, in the laboratory shaker ‘Swip SM25’ (Edmund Bühler GmbH, Bodeshausen, Germany). Then, 1.5 mL of the sample was filled into single-use fully UV-transparent plastic cuvettes ‘Semi-micro cuvette PS’ (nerbe plus GmbH, Winsen/Luhe, Germany). The cuvettes were placed in the spectrophotometer ‘Ultrospec 3100 pro’ (GE Healthcare Europe GmbH, Freiburg im Breisgau, Germany), and the absorption (A) was identified at an absorption maximum of 400 nm [52,53].
By using the buffer as a blank sample, the percentage of carthamidin content (P) could be determined mathematically by using the following formula [29,50]:
p i = A i 487 · 50 W i
where pi is the percentage of carthamidin content of sample i; Ai and Wi are the maximum absorption (range of 400–408 nm) and weight (in g) of sample i, with 487 being the specific absorption of carthamidin (in g mL−1) and 50 being the volume of mL the sample i was filled to with the buffer solution.
The color yield (carthamidin yield) was calculated according to Mohammadi and Tavakoli, by the multiplication of the floret yields with their carthamidin content [29].

2.5. Statistical Analysis

Data were analyzed by a mixed-model approach. The model can be represented in the syntax of Piepho [54] as follows:
Y × B + Y × C × S × D × H:Y∙B∙H + B∙Y∙C∙S∙D∙H
where Y, B, H, C, S, and D denoted effects for year, block, harvest date within a year, cultivar, row spacing, and sowing density, respectively. Moreover, × is the crossing operator, e.g., Y × B expands to Y + B + Y · B. Furthermore Y · B and Y · B · H correspond to complete block effects within years across harvest dates and for each harvest date. As years were very different from each other, interest was in the optimal agronomic strategy for both years. Thus, effects for years were taken as fixed. Main effects for complete block were taken as fixed. In contrast, harvest-date-specific block effects were assumed as random denoted by writing these effects behind the colon. All other factors were taken as fixed. Note that block effects across harvest dates and error (=B·Y·C·S·D·H) effects are potentially correlated within a year, as data were repeatedly taken from the same plot. Different variance–covariance structures were tested for both effects, and the best model was selected via AIC [55]. The tested variance–covariance structures are the first order autoregressive with homogeneous or heterogeneous variances (with harvest date-by-year specific variances) and an unstructured variance–covariance matrix. Residual plots of each trait were visually checked for homogeneous variance and normal distribution. If one or both of these two assumptions were fulfilled, a logarithmic transformation was performed to meet the assumptions. For traits floret yield and carthamidin yield, some values were below the detection boundary. These values were replaced prior to analysis by half of the minimum value measured. Results of multiple comparisons were presented as letter display [56], using the Fisher´s Least Significant Difference test, at α = 5%, after finding significant corresponding F-tests. In the case of multiple relevant two-, three-, and four-way interactions, displaying significant differences for all relevant marginal means get complicated. In this case, simple means or margin means for a single higher-way interaction are presented to simplify presentation. For instance, if interactions Y∙C∙S, Y∙C∙D, and Y∙D∙S were significant, marginal means of Y∙C∙S∙D are presented within the main text dropping results from the letter display. Note that, in this case, all relevant means and their comparisons for all significant interactions (including a letter display) were additionally shown in the Appendix A.
In case of logarithmical transformed data, means were back-transformed and denoted as median. Standard errors were back-transformed using the delta method. In this case, letter display was omitted. All analyses were performed within the statistical software SAS 9.4 (SAS Institute Inc., Cary, North Carolina, USA).

3. Results and Discussion

3.1. Yield Parameters

3.1.1. Primary Branches per Plant

The mean number of primary branches is presented for sowing density and year-by-harvest date combinations, as only these two model terms showed significance (Table 3 and Table 4).
The highest number of primary branches per plant was observed on the first harvest date in 2018 (14.15), while the lowest number was achieved on the third harvest date in 2017 (9.54; Table 3). The number of primary branches in 2017 did not differ significantly between harvest dates, whereas on the first harvest date in 2018, plants had more primary branches (14.15) than on the third harvest date (11.02). Plants sown at a lower sowing density (D1) produced a significantly higher number of primary branches per plant (13.0 ± 0.40) than at the higher sowing density (D2) (9.54 ± 0.40) (Table A2), which is in line with other studies [35,57,58,59]. The total number of primary branches is within the range [60,61]. The number varied between 4.0 and 24.8 and indicated, in most cases, that less than 20 primary branches, depending on cultivars, were formed [60,61]. In the current study, effects of row spacing and cultivar were not significant. In contrast, Oad et al. showed that, for larger inter- and intra-row spacing, the number of primary branches increased from around 7 to 10 [62].
Furthermore, the number of branches varied between years, probably due to differences in temperatures and precipitation [63]. Numbers of branches were higher in years with cooler growing conditions [64,65]. In this study, however, a higher number of branches was found in the warmer, but drier year, 2018 (Figure 2). This might be explained by the susceptibility to diseases under humid conditions [66,67], and therefore a higher productivity of, e.g., branches under dry and warm conditions like in 2018. Moreover, the lower maximum temperatures in May and June, when the branches are formed, could explain the delay in growth and, thus, the higher number of branches in 2018 (Figure 2).

3.1.2. Number of Capitula per Plant

Significant differences for the number of capitula were found for sowing density and year-by-cultivar interactions (Table 4 and Table 5).
The highest number of capitula was produced with cultivar C2 in both years (2017: 12.46; 2018: 16.32) (Table 5). At a lower sowing density (D1), more capitula per plant (14.35 ± 0.36) were observed compared to the higher sowing density (D2) (8.73 ± 0.22) (Table A2).
The number of capitula per plant is within the range of other studies demonstrating 9.7–20.3 capitula per plant depending on cultivar, row spacing, sowing density, and year [61,68,69]. The higher number of capitula at lower sowing densities could be explained by several studies [31,58,70,71], showing correlations between the number of branches and number of capitula per plant [61,64,72,73]. In our study, a higher number of branches and capitula was obtained at a lower sowing density. Effects of cultivars were shown in several studies [30,61,74,75]. One possible reason for the higher productivity of C2 in both years in the current study could be that this cultivar is explicitly used in colorant production in China and is therefore designed for high productivity. The slightly longer time to flowering and, thus, the delay in development could also explain the higher number of capitula of cultivar C2. The delay in 2018 could also be explained by the lower maximum temperatures in June, when the capitula were formed (Figure 2).

3.2. Yield and Quality Parameters

3.2.1. Yield of Flowering Florets

The simple least square means of flowering floret yields are presented, as model terms showed significant differences for several three-way interaction terms (Figure 3 and Table 6).
The yield of flowering florets ranged from 2.30 to 468.96 kg ha−1 (Figure 3) and was comparable to studies with average floret yields between 168 and 188 kg ha−1, depending on year, cultivar, and sowing density [30,57,76].
The cultivar C1 achieved its highest floret yield earlier compared to C2, which can be explained by an earlier start of flowering. Furthermore, in all years and most harvest dates, C2 achieved higher floret yields than C1 (Table A1). The highest yield for C1 was obtained at the second harvest date (2017: 90.64; 2018: 167.81 kg ha−1), and the lowest yields were obtained on the two last harvest dates (2.36–8.89 kg ha−1) (Table A1). For C2, highest yields of flowering florets were harvested in 2017, at the second and third harvest dates (181.82 and 167.56 kg ha−1), and in 2018, at the third harvest date (458.70 kg ha−1) (Table A1). The lowest yields of flowering florets were achieved, depending on year, at the first (2018: 0.67 kg ha−1) or at the last harvest date (2017: 18.98 kg ha−1), which could be explained by the fact that it was not yet flowering or had already withered toward the end.
In 2017, most flowering florets were harvested on the second harvest date (D1: 118.27; D2: 139.35 kg ha−1), while in 2018, most flowering florets were harvested on the third harvest date (D1: 206.71; D2: 245.37 kg ha−1) (Table A2). On these two harvest dates (second harvest date in 2017 and third harvest date in 2018), D2 achieved higher floret yields than D1. In 2018, however, no significant influence on the yield of flowering florets between the sowing densities were found.
The year-effect on the floret yield is also reflected in other studies that reported higher floret yields at higher temperatures and lower precipitation [77,78,79]. The lower disease infestation with lower precipitation [66] could explain the higher floret yields in the hotter and drier year, 2018, in this study (Figure 2 and Figure 3). Moreover, the lower maximum temperatures in May and June 2018 may have led to a delayed development (Figure 2). Furthermore, the higher maximum temperatures during flowering in 2018 (July and August) may have had a positive effect on the floret yields. Other studies also reported differences in floret yield of cultivars, harvest dates, and years [29,30,57,76]. Yields peaked in the middle of the flowering period (Harvest 2 to 3), which could be explained by the successive flowering of the secondary and tertiary capitula [3,4]. A reason for the higher floret yields of C2 could be the higher number of capitula, as it determines final floret yield [36,80]. Additionally, the effect of row spacing and sowing density on floret yield is in line with studies of Azari et al. and Hamza et al. showing higher floret yield with lower sowing density and lower row spacing [31,57].

3.2.2. Carthamidin Content of Flowering Florets

For the carthamidin content, the model showed significant differences for all two-way interactions of year, harvest date, and cultivar. Therefore, least square means of the corresponding three-way interactions are presented (Table 7).
The cultivar C2 reached higher carthamidin contents in 2018 (6.98%–8.12%) compared to 2017 (5.91%–7.29%) (Table 7). In addition, cultivar C2 had higher carthamidin contents (6.45%–7.71%) than C1 (2.94%–4.56%) on all existing harvest dates and in both years (Table A1).
The range of carthamidin contents was comparable to a study of Mohammadi and Tavakoli in which the carthamidin contents were between 4.60% and 5.93% [29]. This study showed the difference in carthamidin contents between harvest dates, cultivars, and their interaction, which was also shown in other studies [29,30,34,81]. The higher carthamidin content at earlier harvest dates in this study (Table 7 and Table A1) can be explained by the presence of an oxidative enzyme (β-glucose oxidase) which leads to a color change from yellow to red during ripening [82,83,84]. The carthamidin content is also affected by the environmental weather conditions, wherefore the harvest date is a determining factor for the carthamidin content [29,66,81,82]. As it was shown for number of capitula per plant and for floret yield (Table 4 and Figure 3), C2 is better adapted to the hot and dry weather conditions, and this could also explain the higher carthamidin contents. These conditions, and also the highest maximum temperatures in July and August 2018, are advantageous during the flowering period, for good development and less disease formation in safflower (Figure 2) [66,77,78,79].

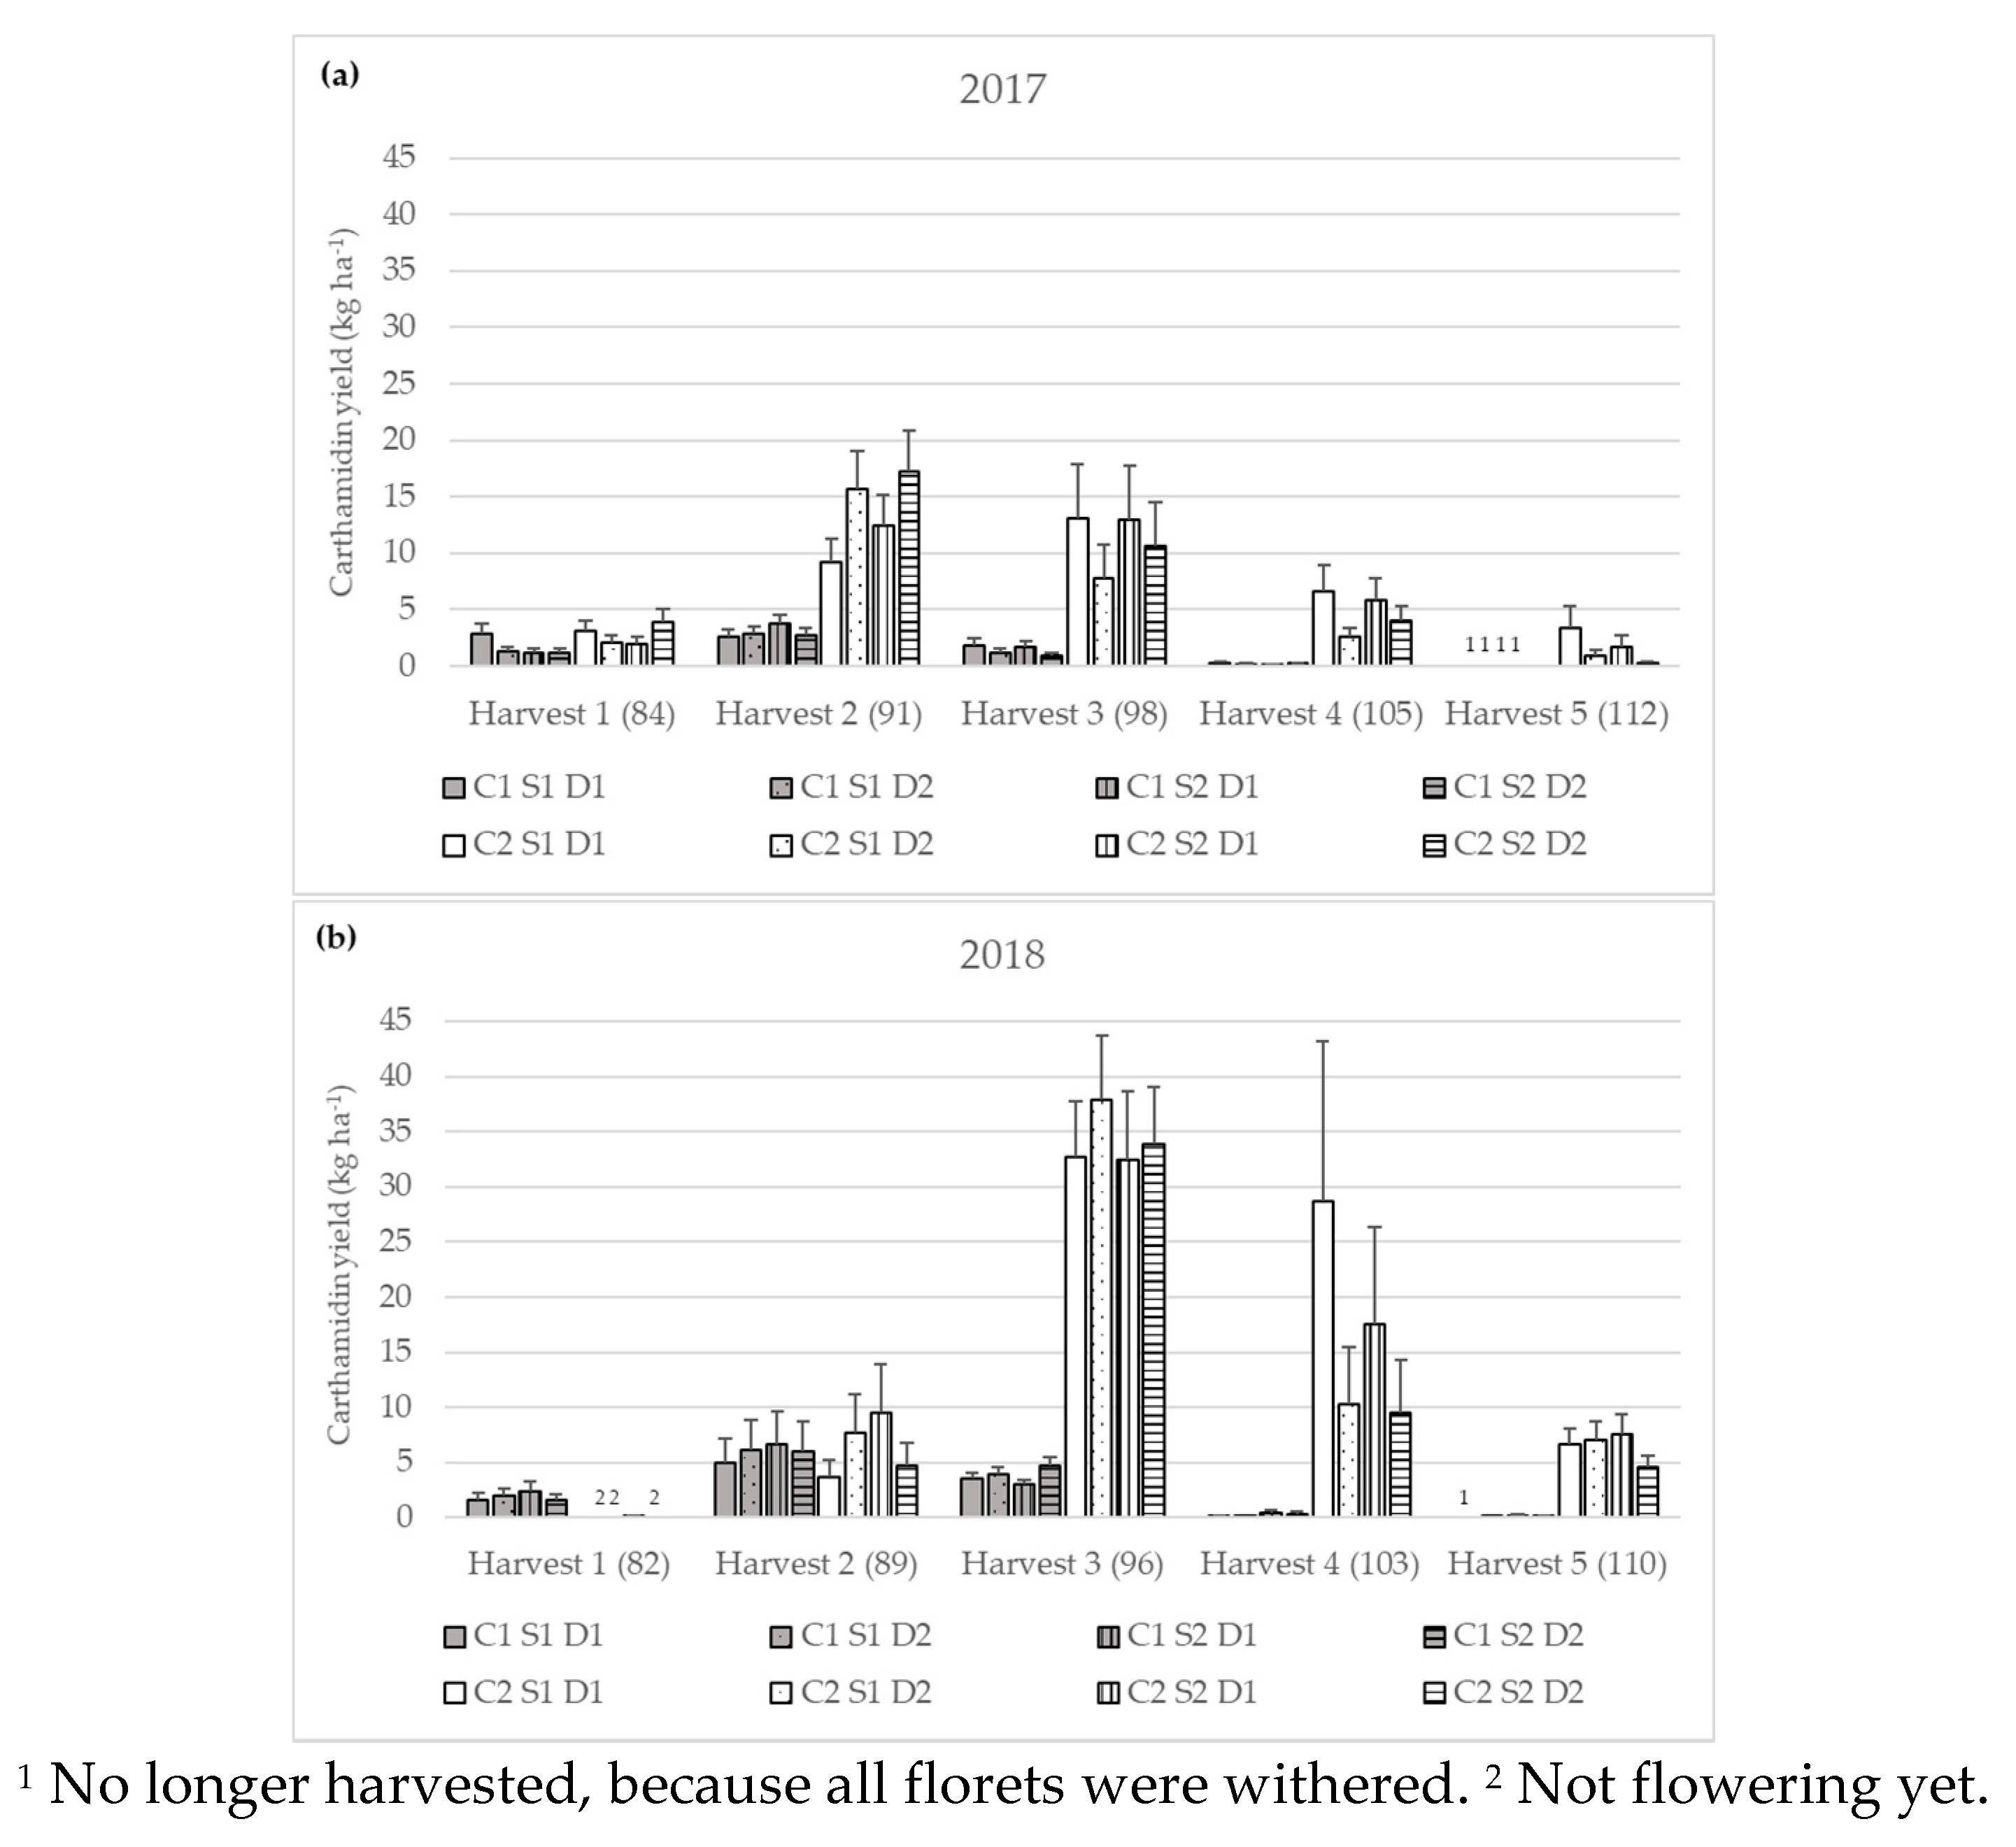
3.2.3. Carthamidin Yield

As the analysis showed significant differences between sowing density as well as several three-way interactions of cultivar, row-spacing, harvest date and year, means for sowing density, and the corresponding four-way interactions are presented (Figure 4 and Table 8).
In both years, C1 produced the highest carthamidin yields on the second harvest date (2017: 2.94; 2018: 5.93 kg ha−1) (Table A1). C2 had the highest carthamidin yield on the second harvest date in 2017 and on the third harvest date in 2018 (2017: 13.28; 2018: 34.13 kg ha−1). The product of the factors floret yield and carthamidin content (Figure 3 and Table 7) in the carthamidin yield explains the peak at the beginning of the flowering period (Figure 4).
The highest carthamidin yields were achieved with C2 on the third harvest date (S1: 18.86; S2: 19.69 kg ha−1) (Table A3). Furthermore, it could be shown that, in 2018, S2 produced higher carthamidin yields (2.18 kg ha−1) compared to S1 (1.58 kg ha−1) (Table A3).
The carthamidin yield ranged between 0.04 and 37.86 kg ha−1 (Figure 4), which is comparable to a study of Mohammadi and Tavakoli, with carthamidin yields depending on cultivars and harvest dates between 26.33 and 36.62 kg ha−1 [29].
In both years, cultivar C2 produced the highest carthamidin yields, which could be due to the origin and its genetic potential, because it is designed for colorant production in China. Both the higher floret yields and the higher carthamidin contents of C2 led to the highest carthamidin yields in 2018, which could be explained by the drier and hotter weather conditions and the higher maximum temperatures during flowering in 2018 (Figure 2). Disease infestation is less likely to occur under these conditions (Figure 2, Figure 3 and Figure 4 and Table 7) [66,77,78,79]. Moreover, the drier conditions by which secondary phytochemicals can be increased according to different studies could be the reason for the higher carthamidin yields in 2018 [39,40]. Environmental differences between years and agronomic practices (e.g., row spacing and sowing density) can affect competition for nutrients, light, and water [3,64]. This could be a possible explanation even for differences in carthamidin yield.

4. Conclusions

In general, the results of the study show that the experimental factors year, harvest time, cultivar, and sowing density had significant influences on most traits. Row spacing indicated a significant impact on two traits and just in interactions with other effects, wherefore further experiments should be carried out. Based on this study, the Chinese cultivar (C2), a plant density of 40 plants m−2 (D1), and a harvest time of two to three weeks after flowering can be recommended to achieve maximum floret and carthamidin yields under the conditions in Southwest Germany.
The most critical factor for safflower cultivation in Southwest Germany seems to be the impact of diseases under rainy conditions during flowering, wherefore selection of resistant accessions should be carried out in a first step. Further studies should also test the cultivation of safflower at warmer and drier locations in Southwest Germany.

Author Contributions

Conceptualization, K.S. and S.G.-H.; methodology, K.S., S.M., and S.G.-H.; software, K.S. and J.H.; formal analysis, K.S.; investigation, K.S.; resources, K.S. and S.G.-H.; data curation, K.S.; writing—original draft preparation, K.S.; writing—review and editing, K.S., J.H., S.M., and S.G.-H.; visualization, K.S.; supervision, S.G.-H.; project administration, S.G.-H.; funding acquisition, S.G.-H. All authors have read and agreed to the published version of the manuscript.

Funding

This research was funded by the German Federal Ministry for Economic Affairs and Energy within the Central Innovation Program for SMEs, grant number 16KN050530.

Acknowledgments

The authors would like to thank the technical staff of the Experimental Station Ihinger Hof of the University of Hohenheim for the agronomic management of the field trials, manpower, and the possibility to use the devices. The authors would also like to thank Andrea Richter for her help during the field trials.

Conflicts of Interest

The authors declare no conflict of interest. The funders had no role in the design of the study; in the collection, analyses, or interpretation of data; in the writing of the manuscript; or in the decision to publish the results.

Appendix A

Table A1. Mean values ± standard error and significant differences of the Fisher’s LSD test (α = 0.05) for the factors year (2017 and 2018), harvest date (Harvest 1–5), and cultivar (C1 and C2). Mean values with at least one identical lowercase letter are not significantly different between harvest dates (within columns). Mean values with at least one identical capital letter are not significantly different between cultivars (within rows).
ParameterYearHarvest NumberCultivar
C1C2
Yield of flowering florets (kg ha−1)2017Harvest 126.76 bA ± 3.8640.30 cA ± 5.81
Harvest 290.64 aB ± 4.28181.82 aA ± 8.59
Harvest 336.41 bB ± 4.06167.56 aA ± 18.68
Harvest 48.89 cB ± 1.4974.99 bA ± 12.56
Harvest 5n.d.18.98 dA ± 5.22
2018Harvest 155.38 bA ± 8.700.67 dB ± 0.11
Harvest 2167.81aA ± 34.8373.30 cB ± 15.21
Harvest 3110.57 aB ± 7.58458.70 aA ± 33.75
Harvest 45.47 cB ± 1.50209.34 bA ± 57.27
Harvest 52.36 dB ± 0.3191.22 cA ± 12.12
Carthamidin content of flowering florets (%) Harvest 14.56 ± 0.17n.d.
Harvest 23.48 B ± 0.177.71 A ± 0.17
Harvest 33.75 B ± 0.177.03 A ± 0.17
Harvest 42.94 B ± 0.176.56 A ± 0.17
Harvest 5n.d.6.45 ± 0.17
Carthamidin yield (kg ha−1)2017Harvest 11.51 bB ± 0.232.65 cA ± 0.40
Harvest 22.94 aB ± 0.3213.28 aA ± 1.45
Harvest 31.30 bB ± 0.2410.88 aA ± 2.00
Harvest 40.19 cB ± 0.034.46 bA ± 0.75
Harvest 5n.d.1.09 dA ± 0.32
2018Harvest 11.88 bA ± 0.330.04 dB ± 0.01
Harvest 25.93 aA ± 1.335.94 cA ± 1.33
Harvest 33.76 aB ± 0.2934.13 aA ± 2.81
Harvest 40.19 cB ± 0.0514.92 bA ± 3.75
Harvest 50.08 dB ± 0.01 6.34 cA ± 0.73
Table A2. Mean values ± standard error and significant differences of the Fisher’s LSD test (α = 0.05) for the factors year (2017 and 2018), harvest date (Harvest 1–5), and sowing density (D1 and D2). Mean values with at least one identical lowercase letter are not significantly different between harvest dates (within columns). Mean values with at least one identical capital letter are not significantly different between sowing densities (within rows).
ParameterYearHarvest NumberSowing Density
D1D2
Number of primary branches per plant 13.0 A ± 0.409.54 B ± 0.40
Number of capitula per plant 14.35 A ± 0.368.73 B ± 0.22
Yield of flowering florets (kg ha−1)2017Harvest 133.93 A ± 4.8931.79 A ± 4.59
Harvest 2118.27 B ± 5.59139.35 A ± 6.58
Harvest 3101.57 A ± 11.3260.06 B ± 6.70
Harvest 431.57 A ± 5.2921.12 A ± 3.54
Harvest 5n.d.n.d.
2018Harvest 16.87 eA ± 1.085.41dA ± 0.85
Harvest 2110.19 bA ± 22.29111.63 bA ± 23.17
Harvest 3206.71 aA ± 15.21245.37 aA ± 16.82
Harvest 449.57 cA ± 13.5623 08 cA ± 6.31
Harvest 514.22 dA ± 1.8915.15 cA ± 2.01
Carthamidin yield (kg ha−1) n.d.n.d.
Table A3. Mean values ± standard error and significant differences of the Fisher’s LSD test (α = 0.05) for the factors cultivar (C1 and C2), year (2017 and 2018), harvest date (Harvest 1–5), and row spacing (S1 and S2). Mean values with at least one identical lowercase letter are not significantly different between harvest dates (within columns). Mean values with at least one identical capital letter are not significantly different between row spacing (within rows).
ParameterCultivarYearHarvest NumberRow Spacing
S1S2
Carthamidin yield (kg ha−1)C1 Harvest 11.85 A ± 0.301.53 A ± 0.25
Harvest 23.87 A ± 0.684.51 A ± 0.79
Harvest 32.33 A ± 0.332.10 A ± 0.30
Harvest 40.15 A ± 0.030.25 A ± 0.05
Harvest 5n.d.n.d.
C2 Harvest 10.28 dA ± 0.050.37dA ± 0.06
Harvest 27.95 bA ± 1.409.88 bA ± 1.74
Harvest 318.86 aA ± 2.6619.69 aA ± 2.83
Harvest 48.42 bA ± 1.807.90 bA ± 1.68
Harvest 53.46 cA ± 0.772.00 cA ± 0.44
Carthamidin yield (kg ha−1) 2017 n.d.n.d.
2018 7.9B ± 0.7 110.9A ± 0.95 1
1 Here are presented values over all harvest dates.

References

  1. Emongor, V. Safflower (Carthamus tinctorius L.) the underutilized and neglected crop: A review. Asian J. Plant Sci. 2010, 9, 299–306. [Google Scholar] [CrossRef] [Green Version]
  2. Weiss, E.A. Oilseed Crops, 2nd ed.; Blackwell Science: Oxford, UK, 2000; ISBN 0632052597. [Google Scholar]
  3. Emongor, V.; Oagile, O. Safflower Production; Impression House Publication: Gaborone, Botswana, 2017; ISBN 978-99968-0-607-0. [Google Scholar]
  4. Dajue, L.; Mündel, H.H. Safflower. Carthamus tinctorius L.; IPGRI, IPK, Eds.; IPGRI: Rome, Italy, 1996; ISBN 9290432977. [Google Scholar]
  5. Ekin, Z. Resurgence of safflower (Carthamus tinctorius L.) utilization: A global view. J. Agron. 2005, 4, 83–87. [Google Scholar]
  6. Corleto, A.; Alba, E.; Polignano, G.B.; Vonghio, G. Safflower: A multipurpose species with unexploited potential and world adaptability. The research in Italy. In Safflower: A Multipurpose Species with Unexploited Potential and World Adaptability. Proceedings of the Fourth International Safflower Conference, Bari, Italy, 2–7 June, 1997; Corleto, A., Mündel, H.-H., Eds.; Adruatica Editrice: Bari, Italy, 1997; pp. 23–31. [Google Scholar]
  7. Sirel, Z.; Aytac, Z. Relationship between the seed yield and some agronomic characteristics of safflower (Carthamus tinctorius L.) under semi-arid conditions. Turk. J. Field Crops 2016, 21, 39. [Google Scholar] [CrossRef]
  8. Chakradhari, S.; Perkons, I.; Mišina, I.; Sipeniece, E.; Radziejewska-Kubzdela, E.; Grygier, A.; Rudzińska, M.; Patel, K.S.; Radzimirska-Graczyk, M.; Górnaś, P. Profiling of the bioactive components of safflower seeds and seed oil: Cultivated (Carthamus tinctorius L.) vs. wild (Carthamus oxyacantha M. Bieb.). Eur. Food Res. Technol. 2020, 246, 449–459. [Google Scholar] [CrossRef]
  9. Singh, V.; Nimbkar, N. Safflower (Carthamus tinctorius L.), Chapter 6. In Genetic Resources, Chromosome Engineering, and Crop Improvement; Singh, R.J., Ed.; CRC Press: Boca Raton, FL, USA, 2007; pp. 167–194. ISBN 9780849336393. [Google Scholar]
  10. Garfield, S. Mauve. How One Man Invented a Color that Changed the World; W.W. Norton & Company: New York, NY, USA, 2002; ISBN 9780393323139. [Google Scholar]
  11. Zhaomu, W.; Lijie, D. Current situation and prospects of safflower products development in China. In Safflower: A Multipurpose Species with Unexploited Potential and World Adaptability. Proceedings of the Fifth International Safflower Conference, Williston, ND, USA, 23–27 July, 2001; Bergman, J.W., Mündel, H.H., Eds.; North Dakota State University: Fargo, ND, USA, 2001; pp. 315–319. [Google Scholar]
  12. Future Market Insights. Natural Food Colours Market: Significant Demand for Clean Label and Naturally Sourced Ingredients in Food Products Spurring Revenue Growth: Global Industry Analysis (2013–2017) & Opportunity Assessment (2018–2028). Available online: https://www.futuremarketinsights.com/reports/global-natural-food-colours-market (accessed on 6 May 2019).
  13. Grand View Research, Inc. Natural Food Colors Market Estimates & Trend Analysis by Product (Curcumin, Carotenoids, Anthocyanin, Carmine, Chlorophyllin), by Application (Bakery & Confectionery, Beverages, Dairy & Frozen Products, Meat Products), and Segment Forecasts, 2018–2025. Available online: https://www.grandviewresearch.com/industry-analysis/natural-food-colors-market (accessed on 6 May 2019).
  14. Křížová, H. Natural dyes: Their past, present, future and sustainability. Recent Dev. Fibrous Mater. Sci. 2015, 12, 59–71. [Google Scholar]
  15. Yusuf, M.; Shabbir, M.; Mohammad, F. Natural colorants: Historical, processing and sustainable prospects. Nat. Prod. Bioprospect. 2017, 7, 123–145. [Google Scholar] [CrossRef] [Green Version]
  16. European Commission. Guidance Notes on the Classification of Food Extracts with Colouring Properties. Available online: https://ec.europa.eu/food/safety/food_improvement_agents/additives/eu_rules_en (accessed on 20 November 2019).
  17. GNT International B.V. Europäische Union Verabschiedet Guidance Notes Zur Klassifizierung Färbender Lebensmittel. 2013. Available online: https://www.food-monitor.de/2013/12/europaeische-union-verabschiedet-giudance-notes-zur-klassifizierung-faerbender-lebensmittel/ (accessed on 20 August 2019).
  18. Bratinova, S. Provision of Scientific and Technical Support with Respect to the Classification of Extracts/Concentrates with Colouring Properties Either as Food Colours (Food Additives Falling under Regulation (EC) No 1333/2008) or Colouring Foods; Publications Office of the European Union: Luxembourg, 2015; ISBN 978-92-79-50607-9. [Google Scholar]
  19. Gao, W.Y.; Fan, L.; Paek, K.Y. Yellow and red pigment production by cell cultures of Carthamus tinctorius in a bioreactor. Plant Cell Tissue Organ Cult. 2000, 60, 95–100. [Google Scholar] [CrossRef]
  20. Rudolf Wild GmbH & Co., KG. EU-Leitlinien: Die Übergangsfrist für Färbende Lebensmittel Endet. 2015. Available online: https://www.lvt-web.de/topstories/fooddesign-hygiene-und-ueberwachung/eu-leitlinien-die-uebergangsfrist-fuer-faerbende-lebe (accessed on 20 August 2019).
  21. Dajue, L. Progress research and production in China. In Proceedings of the Third International Safflower Conference, Beijing, China, 14–18 June 1993; Dajue, L., Yuanzhou, H., Eds.; Beijing Botanical Garden, Institute of Botany, Chinese Academy of Sciences: Beijing, China, 1993; pp. 35–46. [Google Scholar]
  22. Food Standards Agency. Importing Confectionary. Guidance on Licensing, Labelling, Packaging, Chemical Safety When Importing Confectionery Products. Available online: https://www.food.gov.uk/business-guidance/importing-confectionery (accessed on 29 April 2020).
  23. Fusaro, D. When It Comes to Synthetic Food Colours: Beware the ‘Southampton Six’. Available online: https://www.foodprocessing.com/articles/2010/colorants/ (accessed on 29 April 2020).
  24. Shin, Y.-S.; Yoo, D.-I. Storage stability and color reproducibility of yellow and red dyes extracted from Carthamus tinctorius L. Text. Color. Finish. 2012, 24, 165–172. [Google Scholar] [CrossRef]
  25. Yoon, J.-M.; Cho, M.-H.; Park, J.-E.; Kim, Y.-H.; Hahn, T.-R.; Paik, Y.-S. Thermal stability of the pigments hydroxysafflor yellow A, safflor yellow B, and precarthamin from safflower (Carthamus tinctorius). J. Food Sci. 2003, 68, 839–843. [Google Scholar] [CrossRef]
  26. Food and Agriculture Organization of the United Nations. FAOSTAT-Crop Statistics: Safflower. Available online: http://www.fao.org/faostat/en/#data/QC (accessed on 7 May 2019).
  27. Rudometova, N.V.; Pasovskij, A.P.; Blohina, E.A. Method of isolation and identification of carthamin in safflower. Application´s perspectives in Russian food products. In Safflower: A Multipurpose Species with Unexploited Potential and World Adaptability. Proceedings of the Fifth International Safflower Conference, Williston, ND, USA, 23–27 July, 2001; Bergman, J.W., Mündel, H.H., Eds.; North Dakota State University: Fargo, ND, USA, 2001; pp. 309–313. [Google Scholar]
  28. Yu, H.; Xu, L.X. Separation and determination of flavonols in the flowers of Carthamus tinctorius by RP-HPLC. Yaoxue Xuebao (Acta Pharm. Sin.) 1997, 32, 120–122. [Google Scholar]
  29. Mohammadi, M.; Tavakoli, A. Effect of harvest time of spring safflower (Carthamus tinctorius L.) florets on the production of red and yellow pigments. Q. Assur. Saf. Crops Foods 2015, 7, 581–588. [Google Scholar] [CrossRef]
  30. Kizil, S.; Çakmak, Ö.; Kirici, S.; İnan, M. A Comprehensive Study on Safflower (Carthamus Tinctorius L.) in Semi-Arid Conditions. Biotechnol. Biotechnol. Equip. 2008, 22, 947–953. [Google Scholar] [CrossRef]
  31. Azari, A.; Khajehpour, M.R. Effect of planting pattern on development, growth, yield components and seed and petal yields of safflower in summer planting, local variety of Isfahan, Koseh. Person. J. Sci. Technol. Agric. Nat. Resour. 2005, 9, 131–142. [Google Scholar]
  32. Camaş, N.; Esendal, E. Estimates of broad-sense heritability for seed yield and yield components of safflower (Carthamus tinctorius L.). Hereditas 2006, 143, 55–57. [Google Scholar] [CrossRef] [PubMed]
  33. Knowles, P.F. Centers of plant diversity and conservation of crop germ plasm: Safflower. Econ. Bot. 1969, 23, 324–329. [Google Scholar] [CrossRef]
  34. Omidi, A.H.; Sharifmoghaddasi, M. Study of safflower varieties for flower and grain yields and fatty acids composition. Adv. Environ. Biol. 2010, 4, 524–527. [Google Scholar]
  35. Sharifmoghaddasi, M.; Omidi, A.H. Determination of optimum row-spacing and plant density in Goldasht safflower variety. Adv. Environ. Biol. 2009, 3, 233–238. [Google Scholar]
  36. Zheng, N.; Futang, C.; Xinchun, S.; Yancai, W. Path analysis of correkated characters on flower yield of safflower individuals. In Proceedings of the Third International Safflower Conference, Beijing, China, 14–18 June 1993; Dajue, L., Yuanzhou, H., Eds.; Beijing Botanical Garden, Institute of Botany, Chinese Academy of Sciences: Beijing, China, 1993; pp. 582–588. [Google Scholar]
  37. Caliskan, S.; Caliskan, M.E. Row and plant spacing effects on the yield and yield components of safflower in mediterrranean-type environment. Turk. J. Field Crops 2018, 23, 85–92. [Google Scholar] [CrossRef] [Green Version]
  38. Köse, A.; Bilir, Ö. The influence of row spacing and seed rate on yield and yield components of safflower (Carthamus tinctorius L.). Tarla Bitk. Merk. Araşt. Enst. Derg. 2017, 26, 45–52. [Google Scholar] [CrossRef] [Green Version]
  39. Salem, N.; Msaada, K.; Sriti, J.; Mejri, H.; Limam, F.; Marzouk, B.; Dhifi, W. Effect of drought on safflower natural dyes and their biological activities. EXCLI J. 2014, 13, 1–18. [Google Scholar]
  40. Horner, J.D. Nonlinear effects of water deficits on foliar tannin concentration. Biochem. Syst. Ecol. 1990, 18, 211–213. [Google Scholar] [CrossRef]
  41. Mohammadi, M.; Karimizadeh, R. Response of safflower to row spacing and intra-row plant distance in semi-warm dryland condition. Agric. For. 2013, 59, 147–155. [Google Scholar]
  42. Mündel, H.-H.; Morrison, R.J.; Entz, T.; Blackshaw, R.E.; Roth, B.T.; Kiehn, F.; Vandenberg, A. Row spacing and seeding rates to optimize safflower yield on the Canadian prairies. Can. J. Plant Sci. 1994, 74, 319–321. [Google Scholar] [CrossRef]
  43. IUSS Working Group WRB. World Reference Base for Soil Resources 2006. A Framework for International Classification, Correlation and Communication; FAO: Rome, Italy, 2006; ISBN 9251055114. [Google Scholar]
  44. International Soil Reference and Information Centre; FAO. Lecture Notes on the Major Soils of the World; Food and Agriculture Organization of the United Nations: Rome, Italy, 2001; ISBN 9251046379. [Google Scholar]
  45. Thun, R.; Hoffmann, G. Texturanalyse des Feinbodens. Kombination von Nasssiebung und Pipettmethode nach KÖHN. In Die Untersuchung von Böden, 4th ed.; Bassler, R., Ed.; VDLUFA-Verl.: Darmstadt, Germany, 2012; ISBN 9783941273139. [Google Scholar]
  46. Thun, R.; Hoffmann, G. Bestimmung von mineralischem Stickstoff (Nitrat und Ammonium) in Bodenprofilen (Nmin-Labormethode). In Die Untersuchung von Böden, 4th ed.; Bassler, R., Ed.; VDLUFA-Verl.: Darmstadt, Germany, 2012; ISBN 9783941273139. [Google Scholar]
  47. Anderson, R.L. Broadleaf weed control in safflower (Carthamus tinctorius) with sulfonylurea herbicides. Weed Technol. 1987, 1, 242–246. [Google Scholar] [CrossRef]
  48. Blackshaw, R.E.; Mündel, H.-H.; Derksen, D.A. Herbicides for weed control in safflower (Carthamus tinctorius). Can. J. Plant Sci. 1990, 70, 237–245. [Google Scholar] [CrossRef]
  49. Flemmer, A.C.; Franchini, M.C.; Lindström, L.I. Description of safflower (Carthamus tinctorius) phenological growth stages according to the extended BBCH scale. Ann. Appl. Biol. 2015, 166, 331–339. [Google Scholar] [CrossRef]
  50. Food and Agriculture Organization of the United Nations. Carthamus yellow. In Compendium of Food Additive Specifications, Addendum 6, 52; Food and Nutrition Paper; FAO: Rome, Italy, 1998. [Google Scholar]
  51. McIlvaine, T.C. A buffer solution for colorimetric comparison. J. Biol. Chem. 1921, 49, 183–186. [Google Scholar]
  52. Jadhav, B.A.; Joshi, A.A. Extraction and quantitative estimation of bio active component (yellow and red carthamin) from dried safflower petals. Indian J. Sci. Technol. 2015, 8, 1–5. [Google Scholar] [CrossRef] [Green Version]
  53. Clementi, C.; Basconi, G.; Pellegrino, R.; Romani, A. Carthamus tinctorius L.: A photophysical study of the main coloured species for artwork diagnostic purposes. Dyes Pigment. 2014, 103, 127–137. [Google Scholar] [CrossRef]
  54. Piepho, H.P.; Buchse, A.; Emrich, K. A Hitchhiker’s Guide to Mixed Models for Randomized Experiments. J. Agron. Crop Sci. 2003, 189, 310–322. [Google Scholar] [CrossRef]
  55. Wolfinger, R. Covariance structure selection in general mixed models. Commun. Stat. Simul. Comput. 1993, 22, 1079–1106. [Google Scholar] [CrossRef]
  56. Piepho, H.-P. A SAS macro for generating letter displays of pairwise mean comparisons. Commun. Biometry Crop Sci. 2012, 7, 4–13. [Google Scholar]
  57. Hamza, M. Influence of different plant densities on crop yield of six safflower genotypes under Egyptian newly reclaimed soils conditions. Int. J. Agric. Crop Sci. (IJACS) 2015, 8, 168–173. [Google Scholar]
  58. Ehsanzadeh, P.; Baghdad-Abadi, A.Z. Yield, yield components and growth characteristics of two safflower genotypes under varying plant densities. J. Sci. Technol. Agric. Nat. Resour. 2003, 7, 129–140. [Google Scholar]
  59. Zarei, G.; Shamsi, H.; Fazeli, F. Effect of planting density on yield and yield components of safflower cultivars in spring planting. Int. J. Biol. Biomol. Agric. Food Biotechnol. Eng. 2011, 5, 929–931. [Google Scholar] [CrossRef]
  60. Usha Kiran, B.; Mukta, N.; Kadirvel, P.; Alivelu, K.; Senthilvel, S.; Kishore, P.; Varaprasad, K.S. Genetic diversity of safflower (Carthamus tinctorius L.) germplasm as revealed by SSR markers. Plant Genet. Resour. 2017, 15, 1–11. [Google Scholar] [CrossRef]
  61. Rampure, N.H.; Majumdar, P.N.; Badere, R.S. Genetic variability for morphological and biochemical characters in safflower (Carthamus tinctorius L.). Indian J. Genet. Plant Breed. 2014, 74, 353–361. [Google Scholar] [CrossRef]
  62. Oad, F.C.; Samo, M.A.; Qayyum, S.M.; Oad, N.L. Inter and intra row spacing effect in the growth, seed yield and oil content of safflower Carthamus tinctorius L. Asian J. Plant Sci. 2002, 1, 18–19. [Google Scholar]
  63. Houmanat, K.; Mazouz, H.; Fechtali, M.E.; Nabloussi, A. Evaluation and pooling of safflower (Carthamus tinctorius L.) accessions from different world origins using agro-morphologicla traits. IJAR 2017, 5, 926–934. [Google Scholar] [CrossRef] [Green Version]
  64. Eryigit, T.; Yilldirim, B.; Kumlay, A.M.; Sancaktaroglu, S. The effects of different row distances and nitrogen fertilizer rates on yield and yield components of safflower (Carthamus tinctorious) under micro-climate conditions of Iğdır Plain –Turkey. In Proceedings of the 3rd International Conference on Biological, Chemical and Environmental Sciences, Kuala Lumpur, Malaysia, 21–22 September 2015; Rahman, A., Ahmadi, R., Eds.; International Institute of Chemical, Biological & Environmental Engineering: Kuala Lumpur, Malaysia, 2015; pp. 17–22, ISBN 9789384422387. [Google Scholar]
  65. Abel, G.H. Growth and yield of safflower in three temperature regimes. Agron. J. 1975, 67, 639–642. [Google Scholar] [CrossRef]
  66. Mündel, H.H.; Blackshaw, R.E.; Byers, J.R.; Huang, H.C.; Johnson, D.L.; Keon, R.; Kubik, J.; McKenzie, R.; Otto, B.; Roth, B.; et al. Safflower Production on the Canadian Prairies: Revisited in 2004; Graphcom Printers Ltd.: Lethbridge, AB, Canada, 2004; ISBN 0662382099. [Google Scholar]
  67. Oelke, E.A.; Oplinger, E.S.; Teynor, T.M.; Putman, D.H.; Doll, J.D.; Kelling, K.A.; Durgan, B.R.; Noetzel, D.M. Safflower; University of Winsconsin-Extension, Cooperative Extendion; University of Minnisota: Center for Alternative Plant & Animal Products; Minnesota Extension Service. Available online: https://hort.purdue.edu/newcrop/afcm/safflower.html (accessed on 29 March 2020).
  68. Marchione, V. Effect of plant population and row spacing on the yield and some biometric characters of safflower. In Safflower: A Multipurpose Species with Unexploited Potential and World Adaptability. Proceedings of the Fourth International Safflower Conference, Bari, Italy, 2–7 June, 1997; Corleto, A., Mündel, H.-H., Eds.; Adruatica Editrice: Bari, Italy, 1997; pp. 108–111. [Google Scholar]
  69. Abbadi, J.; Gerendás, J.; Sattelmacher, B. Effects of nitrogen supply on growth, yield and yield components of safflower and sunflower. Plant Soil 2008, 306, 167–180. [Google Scholar] [CrossRef]
  70. Elfadl, E.; Reinbrecht, C.; Frick, C.; Claupein, W. Optimization of nitrogen rate and seed density for safflower (Carthamus tinctorius L.) production under low-input farming conditions in temperate climate. Field Crops Res. 2009, 114, 2–13. [Google Scholar] [CrossRef]
  71. Sampaio, M.C.; Santos, R.F.; Bassegio, D.; de Vasconselos, E.S.; da Silveira, L.; Barchinski Galant Lenz, N.; Lewandoski, C.F.; Tokuro, L.K. Effect of plant density on oil yield of safflower. Afr. J. Agric. Res. 2017, 12, 2147–2152. [Google Scholar] [CrossRef] [Green Version]
  72. Bardhi, N.; Susaj, E.; Dodona, E.; Kallco, I.; Mero, G.; Susaj, L. Producticity indicators of five safflower cultivars (Carthamus tinctorius L.) grown under Lushnja, Albania, climatic conditions. Online Int. Interdiscip. Res. J. 2013, 3, 1–10. [Google Scholar]
  73. Pascual-Villalobos, M.J.; Alburquerque, N. Genetic variation of a safflower germplasm collection grown as a winter crop in southern Spain. Euphytica 1996, 92, 327–332. [Google Scholar] [CrossRef]
  74. Arslan, B. Assessing of heritability and variance components of yield and some agronomic traits in different safflower (Carthamus tinctorius L.) cultivars. Asian J. Plant Sci. 2007, 6, 554–557. [Google Scholar]
  75. Bina, E.; Mirhadi, M.J.; Delkhosh, B.; Omidi, A.H. Study of Agronomically Important and Physiological Traitson Quantitative and Qualitative Yield of 15 Genotypes of Domestic and Forign Safflower. Biosci. Biotechnol. Res. Asia 2014, 11, 461–467. [Google Scholar] [CrossRef]
  76. Nagaraj, G. Oilseeds. Properties, Processing, Products and Procedures; New India Publ. Agency: Pitam Pura, India, 2009; ISBN 9788190723756. [Google Scholar]
  77. Knowles, P.F. The plant geneticist’ contribution toward changing lipid and amino acid composition of safflower. J. Am. Oil Chem. Soc. 1972, 49, 27–29. [Google Scholar] [CrossRef]
  78. Armah-Agyeman, G.; Loiland, J.; Karow, R.; Hang, A.N. Safflower. In Dryland Cropping Systems; Oregon State University: Corvallis, OR, USA, 2002; pp. 1–7. [Google Scholar]
  79. Koutroubas, S.D.; Papakosta, D.K.; Doitsinis, A. Phenotypic variation in physiological determinants of yield in spring sown safflower under Mediterranean conditions. Field Crops Res. 2009, 112, 199–204. [Google Scholar] [CrossRef]
  80. Singh, V.; Kolekar, N.M.; Nimbkar, N. Breeding strategy for improvement of flowers and seed yields in safflower. In Safflower: Unexploited Potential and World Adaptability. Proceedings of the Seventh International Safflower Conference, Wagga Wagga, Australia, 3–6 November, 2008; Knights, S.E., Potter, T.D., Eds.; Agri-MC Marketing and Communication: Bendigo, Australia, 2008; ISBN 978-0-646-50329-5. [Google Scholar]
  81. Tabrizi, A.H.O. Floret removal effects on grain and oil yield and their components in spring safflower. In Sesame and Safflower Newsletter; Instituto de Agricultura Sostenible: Cordoba, Spain, 2002; pp. 71–75. [Google Scholar]
  82. Ghorbani, E.; Keleshteri, R.H.; Shahbazi, M.; Moradi, F.; Sadri, M. Optimization of extraction yield of carthamine and safflower yellow pigments from safflower (Carthamus tinctorious L.) under different treatments and solvent systems. Res. J. Pharm. (RJP) 2015, 2, 17–23. [Google Scholar]
  83. Cho, M.H.; Paik, Y.S.; Hahn, T.R. Enzymatic conversion of precarthamin to carthamin by a purified enzyme from the yellow petals of safflower. J. Agric. Food Chem. 2000, 48, 3917–3921. [Google Scholar] [CrossRef] [PubMed]
  84. Saito, K. A new enzymatic method for the extraction of precarthamine from dyer’s saffron florets. Z. Lebensmittel-Unters. Forsch. 1993, 34–36. [Google Scholar] [CrossRef]
Figure 1. The two cultivars of Carthamus tinctorius L. used in the field trials: (a) German, spiny cultivar; (b) Chinese, thornless cultivar.
Agronomy 10 00664 g001
Figure 2. Average temperature (°C, connected points), mean monthly maximum (Tmax, °C, red points) and minimum temperature (Tmin, °C, blue points), and accumulated monthly precipitation (mm, bars) during the field experiments in (a) 2017 and (b) 2018.
Agronomy 10 00664 g002
Figure 3. Yield of flowering florets (kg ha−1) for the two years ((a) 2017 and (b) 2018) and the eight different treatments (German and Chinese cultivar (C1 and C2), row spacing of 12 and 33 cm (S1 and S2), and sowing densities of 40 and 75 plants m−2 (D1 and D2) of the five harvests (Harvest 1–5) (DAS, days after sowing) represented as mean values ± standard error.
Agronomy 10 00664 g003
Figure 4. Carthamidin yield (kg ha−1) for the two years ((a) 2017 and (b) 2018) and the eight different treatments (German and Chinese cultivar (C1 and C2), row spacing of 12 and 33 cm (S1 and S2), and sowing densities of 40 and 75 plants m−2 (D1 and D2) of the five harvests (Harvest 1–5) (DAS, days after sowing) represented as mean values ± standard error.
Agronomy 10 00664 g004
Table 1. Experimental treatments and abbreviations: two cultivars (C1 = German, C2 = Chinese cultivar), two row spacings (S1 = 12 cm, S2 = 33 cm), and two sowing densities (D1 = 40, D2 = 75 plants m−2).
Abbreviation TreatmentOrigin and CultivarRow Spacing (cm)Sowing Density (plants m−2)
C1 S1 D1Germany (C1)12 (S1)40 (D1)
C1 S1 D2Germany (C1)12 (S1)75 (D2)
C1 S2 D1Germany (C1)33 (S2)40 (D1)
C1 S2 D2Germany (C1)33 (S2)75 (D2)
C2 S1 D1China (C2)12 (S1)40 (D1)
C2 S1 D2China (C2)12 (S1)75 (D2)
C2 S2 D1China (C2)33 (S2)40 (D1)
C2 S2 D2China (C2)33 (S2)75 (D2)
Table 2. Sowing dates and the number and date of harvests (days after sowing (DAS)) in the experimental years 2017 and 2018.
YearSowing DateNumber of HarvestDate of Harvest (DAS)
201725.04.2017118.07 (84)
225.07 (91)
301.08 (98)
408.08 (105)
515.08 (112)
201819.04.2018110.07 (82)
217.07 (89)
324.07 (96)
431.07 (103)
507.08 (110)
Table 3. Mean values ± standard error and significant differences of the Fisher’s LSD test (α = 0.05) for number of primary branches for the factor year (2017 and 2018) and harvest date (Harvest 1 (2017: 84, 2018: 82 DAS) and 3 (2017: 98, 2018: 96 DAS) (DAS, days after sowing). Mean values with at least one identical lowercase letter are not significantly different within a column. Mean values with at least one identical capital letter are not significantly different within a row.
YearHarvest Date
13
201710.38 bA ± 0.539.54 aA ± 0.53
201814.15 aA ± 0.6011.02 aB ± 0.60
Table 4. ANOVA table of the significant terms and interactions in number of primary branches and capitula per plant.
TraitANOVA Table of the Significant Terms and Interactions
Model TermDegree of Freedomp-Value 1
BranchesSowing density1<0.0001
Year * Harvest date10.0477
CapitulaSowing density1<0.0001
Year * Cultivar1<0.0001
1p-value of an F-test for differences between levels of the corresponding factor or factor combinations.
Table 5. Mean values ± standard error and significant differences of the Fisher’s LSD test (α = 0.05) for number of capitula for the factor year (2017 and 2018) and cultivar (C1 and C2). Mean values with at least one identical lowercase letter are not significantly different within a column. Mean values with at least one identical capital letter are not significantly different within a row.
YearCultivar
C1C2
20178.97 aB ± 0.2712.46 bA ± 0.37
20188.61 aB ± 0.6016.32 aA ± 0.60
Table 6. ANOVA table of the significant terms and interactions in yield of flowering florets.
ANOVA Table of the Significant Terms and Interactions
Model TermDegree of Freedomp-Value 1
Harvest date * Cultivar * Row spacing40.0027
Year * Harvest date * Cultivar3<0.0001
Year * Harvest date * Sowing density40.0258
1p-value of an F-test for differences between levels of the corresponding factor or factor combinations.
Table 7. Carthamidin content of flowering florets (%) for the two years (2017 and 2018) and the two cultivars (German and Chinese cultivar (C1 and C2)) of the five harvests (Harvest 1–5) (DAS, days after sowing) represented as mean values ± standard error.
CultivarHarvest 1Harvest 2Harvest 3Harvest 4Harvest 5
84 DAS91 DAS98 DAS105 DAS112 DAS
2017C1 5.72 ± 0.323.43 ± 0.324.08 ± 0.322.68 ± 0.311
C2 6.58 ± 0.327.29 ± 0.326.51 ± 0.325.97 ± 0.315.91 ± 0.34
82 DAS89 DAS96 DAS103 DAS110 DAS
2018C13.40 ± 0.143.54 ± 0.143.41 ± 0.143.19 ± 0.181
C228.12 ± 0.147.55 ± 0.147.14 ± 0.146.98 ± 0.14
ANOVA table of the significant terms and interactions.
Model termDegree of freedomp-value3
Harvest date * Cultivar40.0006
Year * Cultivar1<0.0001
Year * Harvest date40.0007
1 No longer harvested, because all florets were withered. 2 Not flowering yet. 3 The p-value of an F-test for differences between levels of the corresponding factor or factor combinations.
Table 8. ANOVA table of the significant terms and interactions in carthamidin yield.
ANOVA Table of the Significant Terms and Interactions
Model TermDegree of Freedomp-Value 1
Sowing density10.0026
Harvest date * Cultivar * Row spacing40.0242
Year * Row spacing10.0299
Year * Harvest date * Cultivar3<0.0001
1p-value of an F-test for differences between levels of the corresponding factor or factor combinations.

