Article

Multifaceted Analysis of Barley Landraces Collected during Gene Bank Expeditions in Poland at the End of the 20th Century

National Centre for Plant Genetic Resources, Plant Breeding and Acclimatization National Research Institute, Radzików, 05-870 Błonie, Poland
*
Author to whom correspondence should be addressed.
Agronomy 2020, 10(12), 1958; https://doi.org/10.3390/agronomy10121958
Submission received: 11 November 2020 / Revised: 4 December 2020 / Accepted: 10 December 2020 / Published: 12 December 2020

Abstract

:
The extensive genetic diversity of crop landraces deposited in gene banks is an important part of future breeding programs. However, in order to exploit this potential, it is necessary both to preserve germplasm and to collect and share a wide range of data on its characteristics and evaluation. The main objective of the presented paper was to evaluate the diversity of spring barley landraces originating from Poland. Historical data from standard field evaluation of agronomic traits, genetic data obtained from Inter Simple Sequence Repeat (ISSR) analysis and grain morphometric data were used. The analysis showed that groups of hulled and hulls barley accessions were substantially separate. Genetic and grain morphological variation did not show any relationship with eco-geographical conditions in the place of origin. There was also no clear division into forms with two- and six-row ears. The combination of the results of various types of analyzes describing this collection makes us believe that its chances of being used in research and breeding will increase.

1. Introduction

The European countries are at the forefront of barley cultivation and production worldwide. According to FAO data, in 2018, barley production in Poland amounted to about 3.04 million tons, which places the country in 14th place in the world and 8th in Europe in terms of grain produced in that year. On a national scale, barley is classified as the 7th most important crop species and the 4th most important cereal crop. Since 1961, the barley yield in Poland has increased almost 2.4 times and production almost 3.5 times [1]. The global increase in barley production has resulted from significant progress in breeding and the development of more productive cultivars, more efficient disease and pest control, progress in agricultural production, and agrotechnics [2].
There are currently about 1400 cultivars registered in the European Union [3], of which about 70% are double-row barley. This indicates the intensity of breeding programs for this species. However, the restriction of the use of genetic modification technologies in plant breeding in the EU, as well as the largely limited gene pool of modern breeding populations, may significantly limit further progress in breeding this species [4]. The genetic resources stored in gene banks have potential to enable further improvements.
Approximately 340,000 accessions of Hordeum genus are stored in 108 gene banks spread across 64 countries worldwide. The collection comprises accessions representing 20 species including wild relative species. However, 98.5% of the accessions represent common barley (Hordeum vulgare L.). Among them, 31.8% are traditional cultivars/landraces, 29.4% are breeding/research materials, 11.6% are advanced/improved cultivars, and 2.5% are wild accessions; as much as 24.7% of the barley accessions in the world collection have not been assigned to any of the previously mentioned biological statuses [5]. In Poland, the collection of barley genetic resources is stored in the gene bank, the National Centre for Plant Genetic Resources (NCPGR), of the Plant Breeding and Acclimatization Institute-National Research Institute in Radzików. It consists of 6597 accessions representing 10 species originating from 54 countries and it is the 4th largest collection in Europe. A total of 98.3% of the accessions represent common barley [6].
Landraces stored in gene banks represent an important element of future breeding programs due to their high potential for adaptation to environmental conditions and high level of genetic diversity. Although they are less productive than modern commercial cultivars, they have recently become an important source of variation in the search for resistance or tolerance genes to biotic and abiotic stresses important for agriculture [7]. Significant work has been undertaken to introduce the desired wild barley and landrace alleles into the breeding programs that has provided a catalog of useful cultivars. Among them, the most successful have focused on disease resistance [2,8], abiotic stress [9,10,11] and on root architecture features [12]. In order to use plant genetic resources effectively, it is necessary to develop a comprehensive set of accessions that captures most of the existing genetic variants, and to characterize them in phenotypic and genetic terms.
The objectives of the work reported here were: (a) to study the relationships and diversity of spring barley landraces collected during gene bank expeditions; (b) to evaluate grain morphology; (c) to mobilize the historical evaluation data stored in the gene bank database; (d) identify accessions showing resistance to disease under field conditions and assess their relatedness; (e) to increase the interest of breeders and scientists in the genetic resources stored in the gene bank for the inclusion them in pre-breeding programs; (f) to pay attention to traditional knowledge retained in the form of genetic resources.
Due to the turbulent and traumatic history of Poland, farmers demonstrated an attachment to tradition, including the growing of traditional cultivars and landraces. Combined with the high level of small-scale farming, which is still maintained to date, although on a smaller scale, cereal landraces were found and collected during field expeditions as late as the 1990s [13]. The southern, southeastern, and eastern regions of the country were considered as areas rich in the genetic resources of crops [14,15,16]. All barley landraces that were analyzed here were obtained from these particular regions.

2. Materials and Methods

2.1. Plant Material

The study encompassed 64 landraces of spring barley. The survey included all accessions originating from the expedition in Poland with biological status of landrace and stored in the National Centre for Plant Genetic Resources (NCPGR), i.e., the Polish gene bank. Accessions were gathered during the field expeditions that took place in the 1970s and 1980s in Poland (Table 1).

2.2. Agro-Morphological Traits

The data were obtained from the EGISET, i.e., the database of NCPGR [6]. Accessions were evaluated in a series of three-year field experiments in the years 1978–1990, using standardized scales and descriptors. The trials were carried out in the experimental field of the Plant Breeding and Acclimatization Institute at Radzików, Poland. The soil was classified as good, i.e., leached brown soil (pH 5.8) which may be used for cultivating wheat and sugar beet. During the vegetation period (IV–VIII), the average multiannual temperature for this location is about 16.3 °C and the average multiannual total precipitation is 312 mm.
Each accession had 1000 grains sown on the 2.5 m2 plots represented each accession. Standard fertilization with multi-component mineral fertilizer (100 kg/ha) was applied. During the vegetation season, herbicide spraying was applied against dicot weeds. Monocot weeds were removed manually. Fungicides were not used due to observations of resistance to pathogens. The characteristics of the plant phenotype were based on twelve traits. Days to heading were defined as the number of days from sowing to the time when half the plants started flowering. Grain filling duration was measured as a number of days from the time that half of the plants have started flowering to full maturity of the grain. Days to maturity was measured as the number of days from sowing to full maturity of the grain. The plant height was measured at full maturity from the ground level to the top of the spike excluding awns. Ear length was taken from the neck to the base of the lemma awns of the uppermost grain. Thousand grain weight was converted from weighing a load of 250 grains. The number of grains per ear was the average number for 20 manually harvested and threshed ears. Resistance to lodging, powdery mildew, net blotch, stem rust, and scald was expressed in a bonitation scale where 1 meant no resistance and 9 means total resistance. A summary is presented in Table 2 and detailed results are available in the EGISET database [6]. Botanical variety was determined according to the morphological description published by Mansfeld [17].

2.3. Grain Morphometrics

Approximately 400 grains from each accession were scattered on Canon CanoScan LiDE 700 F desktop flat scanner and scanned in 300 dpi resolution then the results were saved as JPEG format files. Files created in this way were analyzed using the CSIRO GrainScan software [18] program. The software uses automated image recognition to identify individual grains, providing the measurement for each grain in an image file. The following grains’ parameters were determined: surface area (mm2), perimeter (mm), length (mm), width (mm), and color (described in a device independent color 3D CIELAB space as 3 RGB channels).

2.4. DNA Isolation

Seeds obtained from the long-term storage facility were sown in a greenhouse, into pots filled with peat substrate. In the second leaf phase, from 24 healthy seedlings, the middle section of the second leaf blade (about 10 mm long) was collected. Therefore, each accession was represented by 24 plants, from which a bulk sample was made up. Tissue samples were lyophilized, ground in bead mill (Mixer Mill MM 100 Retsh, Retsch, Haan, Germany). Total genomic DNA was extracted by Genomic Mini AX Plant (A & A Biotechnology, Gdynia, Poland) kit. DNA integrity was evaluated by electrophoresis on 1.5% (w/v) agarose gel and its concentration was determined spectrometrically (NanoDrop Spectrophotometer ND-1000, NanoDrop Technologies, Willmington, DA, USA).

2.5. ISSR Analysis

Based on the literature review, 20 ISSR primers with the highest potential for polymorphism detection in cereals were selected. Eight of them that amplified the highest number of polymorphic fragments with high reproducibility were selected (Table 3). The primers were marked with fluorescent dyes at 5′ end. PCR amplification was carried out in a total volume of 10 µL. Each time, the reaction mixture contained 25ng of genomic DNA, 1x Incomplete NH4 Reaction Buffer, 1u DFS-Taq DNA Polymerase (Bioron, Römerberg, Germany), 1.9 mM MgCl2, 0.2 mM dNTP’s mix and 1.5 µM primer. Amplification conditions were as follows: 2 min initial denaturation step (94 °C) followed by 45 cycles of 30s (94 °C), 45 s (54/58 °C), and 2 min (72 °C) The reactions were completed by a final extension step of 10 min (72 °C).
Fragments were analyzed by capillary sequencer ABI 3130xl Genetic Analyzer supplied with 36 cm capillaries array filled with POP-7 polymer (Thermo Fisher Scientific, Waltham, MA, USA). Length of fragments were assessed against GeneScan1200 LIZ Size Standard (Thermo Fisher Scientific, Waltham, MA, USA). Each PCR reaction and fragment analysis were performed in three independent replicates. Only repeatable fragments were scored.

2.6. Scoring and Data Analysis

Only reproducible ISSR fragments were analyzed. The raw results were converted to a 0/1 matrix, so that 0 meant the absence and 1 meant the presence of a fragment of a certain length. The percentage of polymorphic fragments and the Polymorphic Information Content (PIC) coefficient were calculated. The formula of PIC was as follows:
P I C = 1 i = 1 n p i 2
where i is the ith allele of the jth marker, n is the number of alleles of the jth marker and p is an allele frequency. Nei unbiased genetic diversity (uHe) coefficient was calculated as follows:
u H e = n n 1 ( 1 i = 1 n p i 2 )
where pi is the frequency of the ith allele and n is the sample size. The significance of differences in groups was assessed using ANOVA and the post-hoc Tukey’s HSD test. Genetic distance was measured by using Dice coefficient according to the formula:
D ( i 1 ,   i 2 ) =   2 a ( 2 a + b + c )
where a is the number of variables present in both individuals being compared, b is the number of variables present in the first individual and absent from the second individual and c is the number of variables present in the second individual and absent from the first one. Based on symmetrical distance matrix, hierarchical grouping by Ward’s method and the analysis of principal coordinates (PCoA) and hierarchical analysis of molecular variance (AMOVA) were performed.
To test genetic structure, Bayesian model-based clustering implemented in STRUCTURE v2.3.4 [19] was used. An admixture model with correlated allele frequencies among accessions was used. Batch runs were carried out on a LINUX cluster hosted by the Interdisciplinary Centre for Mathematical and Computational Modelling at the Warsaw University. A search for the most likely value of K by performing 10 replicate runs at each value of K ranging from 1 to 10 was conducted. Burn-in time and replication number were up to 104 and 105, respectively, in each run. Determination of the number of true clusters was performed based on the posterior probability of the data for a given K, and the ΔK [20]. The best alignment to the replicated results of the cluster analysis was performed with a full search algorithm. The maximum likelihood ratio was used to assign landraces to clusters, and the cut-off probability for assignment to a cluster was 0.8.
The data of seven morphological parameters for individual grains were averaged within the accession. Then, for each parameter within the examined collection, minimum, maximum, average, and standard deviation were defined. Averages in groups were compared using ANOVA and the post-hoc Tukey’s HSD test. The averaged data has been standardized using unbiased standard deviation. A matrix of dissimilarities was calculated based on the Gower coefficient. A hierarchical grouping was performed using the Ward’s method. The principal component analysis (PCA) was then performed.
Based on passport data (collection site information), geographical distance matrices (in km) and absolute difference in altitude between collection sites were developed. Annual precipitation and average annual temperature at the accessions collection sites were also determined based on passport data and matrices of absolute difference were also computed. Data were extracted from the WorldClim Version 1.4 database [21].
A Mantel test (103 permutations) was used to test for a correlation between genetic distance and all the other dissimilarity matrices. A consensus configuration of genetic and grain morphologic data for barley collection was obtained by the generalized Procrustes analysis (GPA) [22].
All above-mentioned analyses were performed using Microsoft Excel 2016, XLSTAT Ecology (Addinsoft, Inc., Brooklyn, NY, USA), GenAlEx 6.501 [23], STRUCTURE v2.3.4 [19], CLUMPAK [24], QGIS 3.16.0 [25], and R library rworldxtra [26]. The chart and photo adjustments were made in the GIMP v 2.10.22 software [27]. The data analysis was performed within the framework of the Computational Grant (G72-19) of the Interdisciplinary Centre for Mathematical and Computational Modelling, University of Warsaw (ICM UW).
Due to the different number of agro-morphological features that were evaluated in particular experiments, the results were not subjected to statistical analysis. For phenological and quantitative traits only the mean value was calculated from a multi-year study and for qualitative traits the minimum value noted during the three-year evaluation was indicated. The variation coefficient was calculated and expressed as a percentage. It was computed as a ratio of standard deviation of each trait to the corresponding entire data mean.

3. Results

3.1. Summary of Passport Data

Out of the 64 landraces collected during field expeditions of the Polish gene bank, 72% were collected in the 1970s and 28% in the 1980s. The collection of Polish barley landraces includes accessions representing six botanical varieties. The most numerous (41 accessions) was var. nutans (Rodf.) Alef. According to the morphological description published by Mansfeld [17], var. nutans has dropping, two rowed, yellow, long, lax spike, rough lemma awn barbs, and hulled grain. Ten accessions were classified as var. brunneinudum (Vav. et Orl.) Mansf., which has two-rowed, faint gray blackish, long, lax spike, long awns, and hulless, yellow-to-dark-brown grain. Additionally, ten accessions were classified as var. nigripallidum R.Reg., which has six-rowed, black or black and grey, long, lax spike, long and yellow awns, and yellow, hulled grain. One accession each belonged to var. coeleste L., rikotense Regel and viride Vav. et Orl. The var. coeleste has six-rowed, yellow, long, lax spike, long awns rough barbs and hulless, yellow to dark yellow grain. The var. rikotense has also six-rowed, long, lax, yellow spike, smooth yellow awns, and hulled grain. The var. viride has two-rowed, long, lax, yellow spike, long awns, and hulless green grains. Based on the above descriptions, it can be stated that the collection was dominated by two-row barley with hulled, yellow grain. Figure 1 provides photos of grains representing each of six identified botanical varieties.

3.2. Summary of Eco-Geographic Conditions

Barley landraces were collected mainly in the south-eastern (SE) and southern (S) parts of Poland (42% and 39%, respectively). Three accessions originated from the eastern (E) part and only one from the north-eastern (NE) part of the country (Table 1, Figure 2). For 11% of accessions, passport data were incomplete, i.e., there was no information about the collection sites. The geographic coordinate ranges of the collection sites were 49°19′–53°16′ N latitude and 20°06′–23°47′ E longitude. The altitude of the collection sites was in the range from 155 to 900 m above sea level (MASL) with the mean 455 MASL. Only five landraces were collected at an altitude below 200 MASL. In Poland, this altitude is considered to be the lower boundary of the highlands. According to meteorological data, the average annual temperature in Poland is estimated at approximately 7–8 °C; however, in mountains, it is significantly below the average. Average annual precipitation in Poland is about 630 mm but in mountains it reaches up to 1200 mm. In the collection sites, the annual average temperature was between 4.5 and 8.1 °C with the mean 7.2 °C, and annual precipitation ranged from 512 to 1122 mm with the average approximately equal to 810 mm.

3.3. Agro-Morphological Diversity

All presented data from the field evaluation of landraces are historical and were obtained from the NCPGR database and were collected in the years 1978–1990. Only for the 27 accessions, i.e., 42% of the collection, were all 12 traits described (Table S1). Individual traits were reported for 46.9–98.4% of the accessions. So far, no evaluation has been carried out for one landrace. Variability of traits in the surveyed accessions ranged from 4 to 65%. A summary for all traits was provided in Table 2. Phenological features, i.e., days to heading, grain filling duration, and days to maturity, showed 9, 11, and 6% variation within the collection, respectively. These traits were described in 98.4% of the accession. Days to heading were in the range of 52 (PL 42389)–82 (PL 41267) days with an average of 71.6 days. The minimal duration of grain filling was observed for PL 42,769 (26.3 days) while the maximal lasted for 44 days (PL 40554). The average in the collection was 36.1 days. The mean value of days to maturity was 108 days and its range was 81.7 (PL 42769)–117 (PL 41532) days. Resistance to lodging was the feature showing the highest degree of variation in the collection, i.e., 65%. It covered a full range of scale. A total of 17 accessions had very low (1) while six had very good (9) resistance to lodging. The resilient landraces were indicated in Table 1. Out of 63 tested accessions, 16 showed very good (9) resistance and two very low/very low (2) resistance to powdery mildew. The average value of this feature in the collection was 6.11. A total of 81% of the surveyed landraces were found to have very good resistance to net blotch. The mean value of this trait in the studied accessions was 8.7 and its variability was 8%. As much as 90% of the evaluated accessions showed very high resistance to stem rust. This trait showed 18% of variability and its average in the collection was 8.5. Out of 32 accessions in which resistance to skald was evaluated, as many as 31 were completely resistant and one had good resistance (PL 40552). The length of plants in the study collection ranged from 69 cm (PL 42017) to 109.3 cm (PL 42389), with an average of 85.4 cm. The ear length was evaluated in 61% of landraces. It showed 11% of variation and ranged from 7 cm (PL 42389) to 11 cm (PL 41365). Only in 30 accessions was the number of grains per ear assessed. It ranged from 7.7 (PL 40553) to 19.3 (PL 41279). The last of the assessed features was thousand seed weight. Its maximum value (55.2 g) was noted for PL 41,730 and its minimum value (36.0 g) was observed for PL 41270. A total of six landraces were very resistant (9) to lodging and three diseases. Half of the accession was resilient to three diseases. Details of the agro-morphological data are given in Table 2 and the distribution of the traits in the collection is shown in Figure 3.

3.4. Grain Morphology

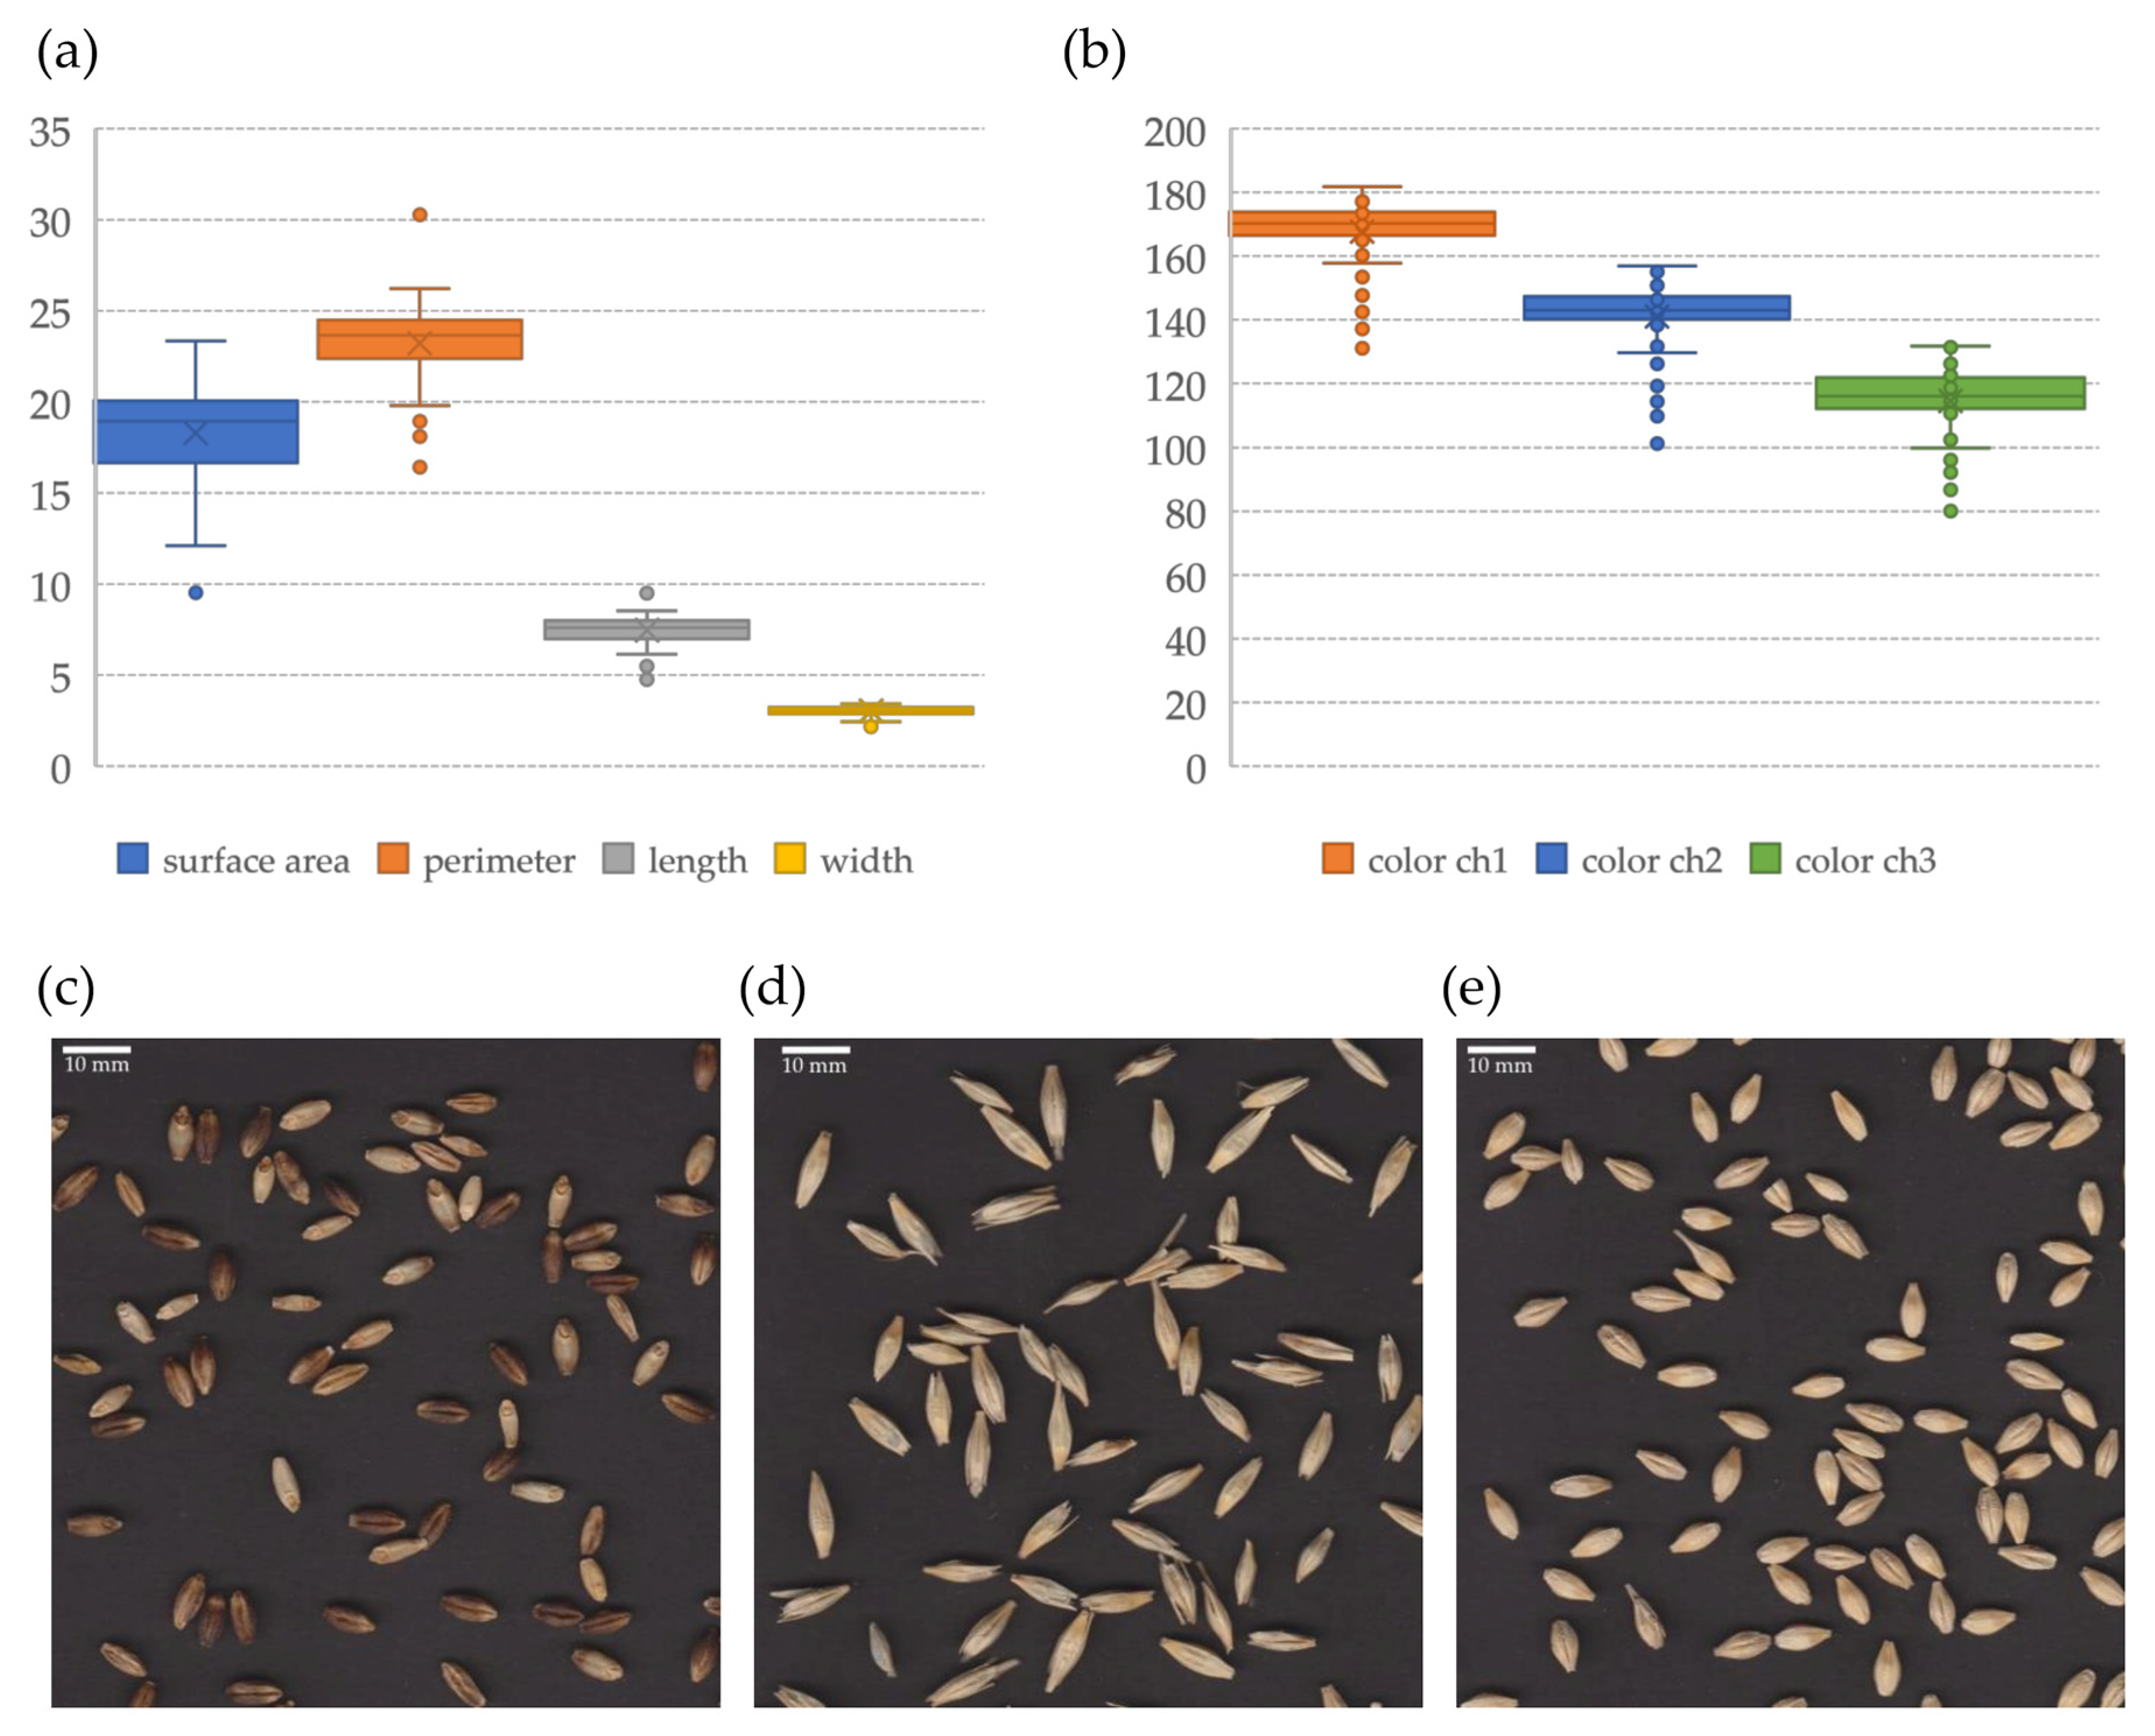
3.4.1. Variation within the Collection

The analysis of grain morphology was performed on samples obtained from the active collection of NCPGR (Figure S1). The variation of seven parameters for the five traits ranged from 6 to 14%. A summary for all traits was provided in Table 4 and the distribution of grain morphology parameters in the collection was shown in Figure 4a,b.
The highest variation within the examined collection was observed in the parameter describing the grain area. Its average value was 18.22 mm2. The minimum value of this parameter was observed in accession PL 42122 and it was 9.53 mm2. The maximum value, i.e., 23.33 mm2, was reached in the accession PL 41533. The perimeter of the grains was between 16.42 and 30.28 mm (PL 42122 and PL 41533, respectively), and its average value in the collection was 23.22 mm. The average length of grains in the tested set of Polish landraces was 7.45 mm and the average width was 3.03 mm. Generally, the smallest grains were found in PL 42122 and the largest in PL 41533 (Figure 4c,d). The widest grains were observed in accession PL 41279 (Figure 4e). The darkest grain was found within the accession PL 42122 and this was expressed by the lowest values of the three parameter describing the color with an additive RGB model.

3.4.2. Variation within Groups

Within the collection, groups were distinguished based on the following information: acquisition year, region of origin, altitude, annual precipitation, average annual temperature, botanical variety, ear type, and grain covering. The significance of differences in average parameter values within the groups was determined using ANOVA (Figure 5). It showed that significant differences for all examined parameters occurred only in case of botanical variety and grain covering classification. In addition, significantly narrower grains were found in the local forms originated from sites with an annual rainfall of 600–800 mm compared to the accession sourced from areas with an annual rainfall exceeding 1000 mm. Wider grains were observed among the accession group collected in areas with the lowest average annual temperature compared to other locations.

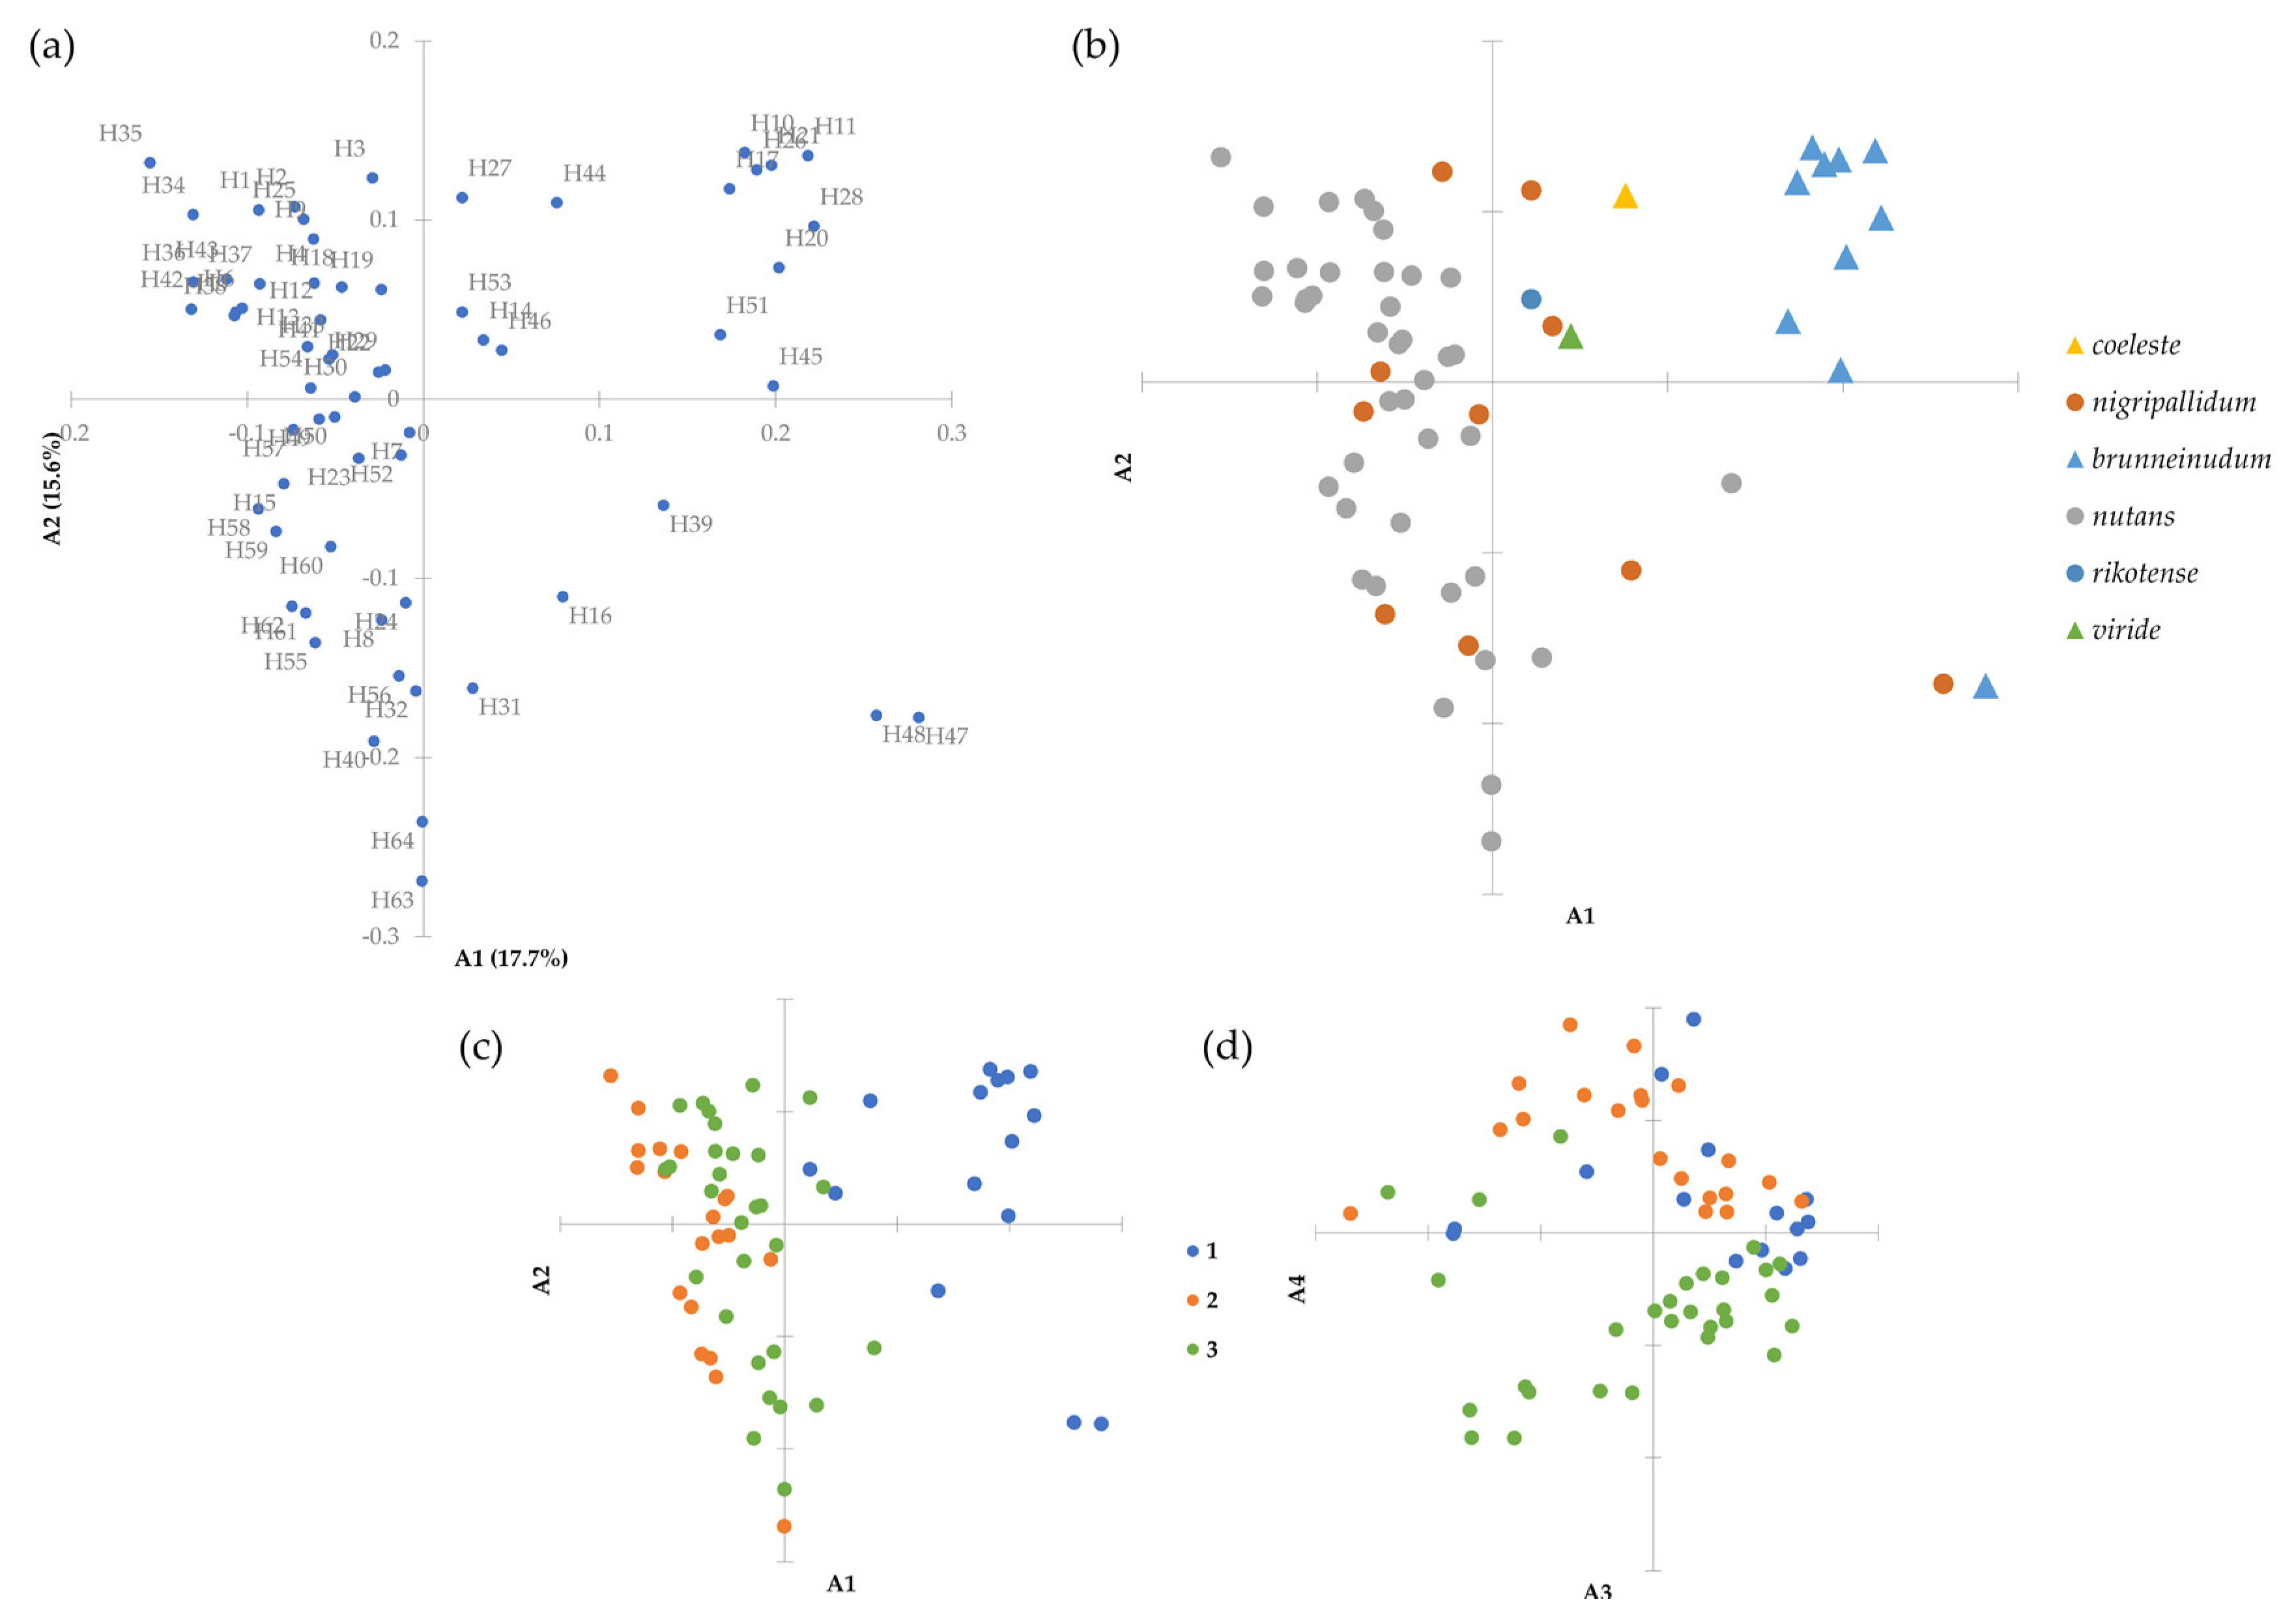
3.4.3. Clustering Analysis

Cluster analysis performed by Ward’s method based on the Gower coefficient indicated four main groups comprising 2, 10, 22, and 30 accessions. In Figure 6, the groups were color-coded. In groups 1 and 2, hulless accessions representing botanical varieties coeleste, brunneinudum, and viride were placed. To the other two groups, the accessions classified as nigripallidum, nutans, and rikotense botanical varieties, i.e., hulled, were assigned.
PCA analysis showed that the cumulative percentage of the first three factors was 98.86%. All described parameters of grain morphology were strongly correlated with the first factor. Graphical presentation of the results of the first two factors showed a clear division into two groups, which corresponded to the classification according to grain covering (Figure 7).

3.5. Genetic Analysis

3.5.1. Marker Efficiency

A total of eight ISSR primers allowed to analyze 693 highly repeatable loci, 53% of which were polymorphic. The highest number of fragments was amplified with UBC 841 (107) primer and the lowest with UBC 856 (61). The mean PIC value was 0.190, and for each primer ranged from 0.106 (UBC 834) to 0.247 (UBC 857). The details are given in Table 3.

3.5.2. Genetic Diversity

The value of the internal variation coefficient (uHe) for the entire collection was 0.185, which results from the high percentage of fragments with high frequency. Within the collection, groups defined according to the same criteria as in the analysis of grain morphology, i.e., acquisition year, region of origin, altitude, annual precipitation, average annual temperature, botanical variety, ear type and grain covering. For each group, the internal variation coefficient was calculated (Figure 8). ANOVA analysis showed that only for botanical varieties and grain covering the differences in the coefficient of variation were statistically significant (p < 0.05).

3.5.3. Genetic Distance

Molecular data were used to calculate the genetic distance using the Dice coefficient. Its values ranged from 0.113 (PL 42120–PL 42121) to 0.573 (PL 41529–PL 41871). The Mantel’s test did not show the existence of a correlation between the genotype and the location of the collection site. Additionally, the relationship between the genotype and the examined environmental parameters (i.e., average annual temperature and annual precipitation) of the collection site was not found.

3.5.4. Clustering Analysis

Cluster analysis performed by Ward’s method based on Dice’s distance showed the presence of three main groups comprising 15, 20, and 29 accessions. In Figure 9, the groups were color-coded. The majority of variance (68.3%) was within the groups, and 31.7% was among them. The values of the uHe coefficient for the groups were 0.191 (se = 0.008), 0.209 (se = 0.009), and 0.188 (se = 0.007), respectively. ANOVA analysis showed that the differences in the coefficient of variation were statistically insignificant (p < 0.05). The first group was the most distinct and included all the landraces that had hulless grain. These accessions also showed high resistance to net blotch and skald. In the second group, half of the accession was highly resistant to powdery mildew.
The results of the Principal Coordinates Analysis (PCoA) revealed that a considerable amount of variation (51.4%) was explained by the first four axes: axes 1, 2, 3, and 4 explained 17.7, 15.6, 12.2, and 5.8% of the variation, respectively. The first 42 axes explain the overall variance. PCoA of barley landraces reinforces the division seen in the hierarchical clustering (Figure 10). The first axis distinguishes the accessions that formed the first group on the dendrogram. The second axis revealed the distinctiveness of the two accessions from the first group (PL 41871 and PL 42017), which was not visible on the dendrogram. The third axis allowed for the dividing of the second and third group.

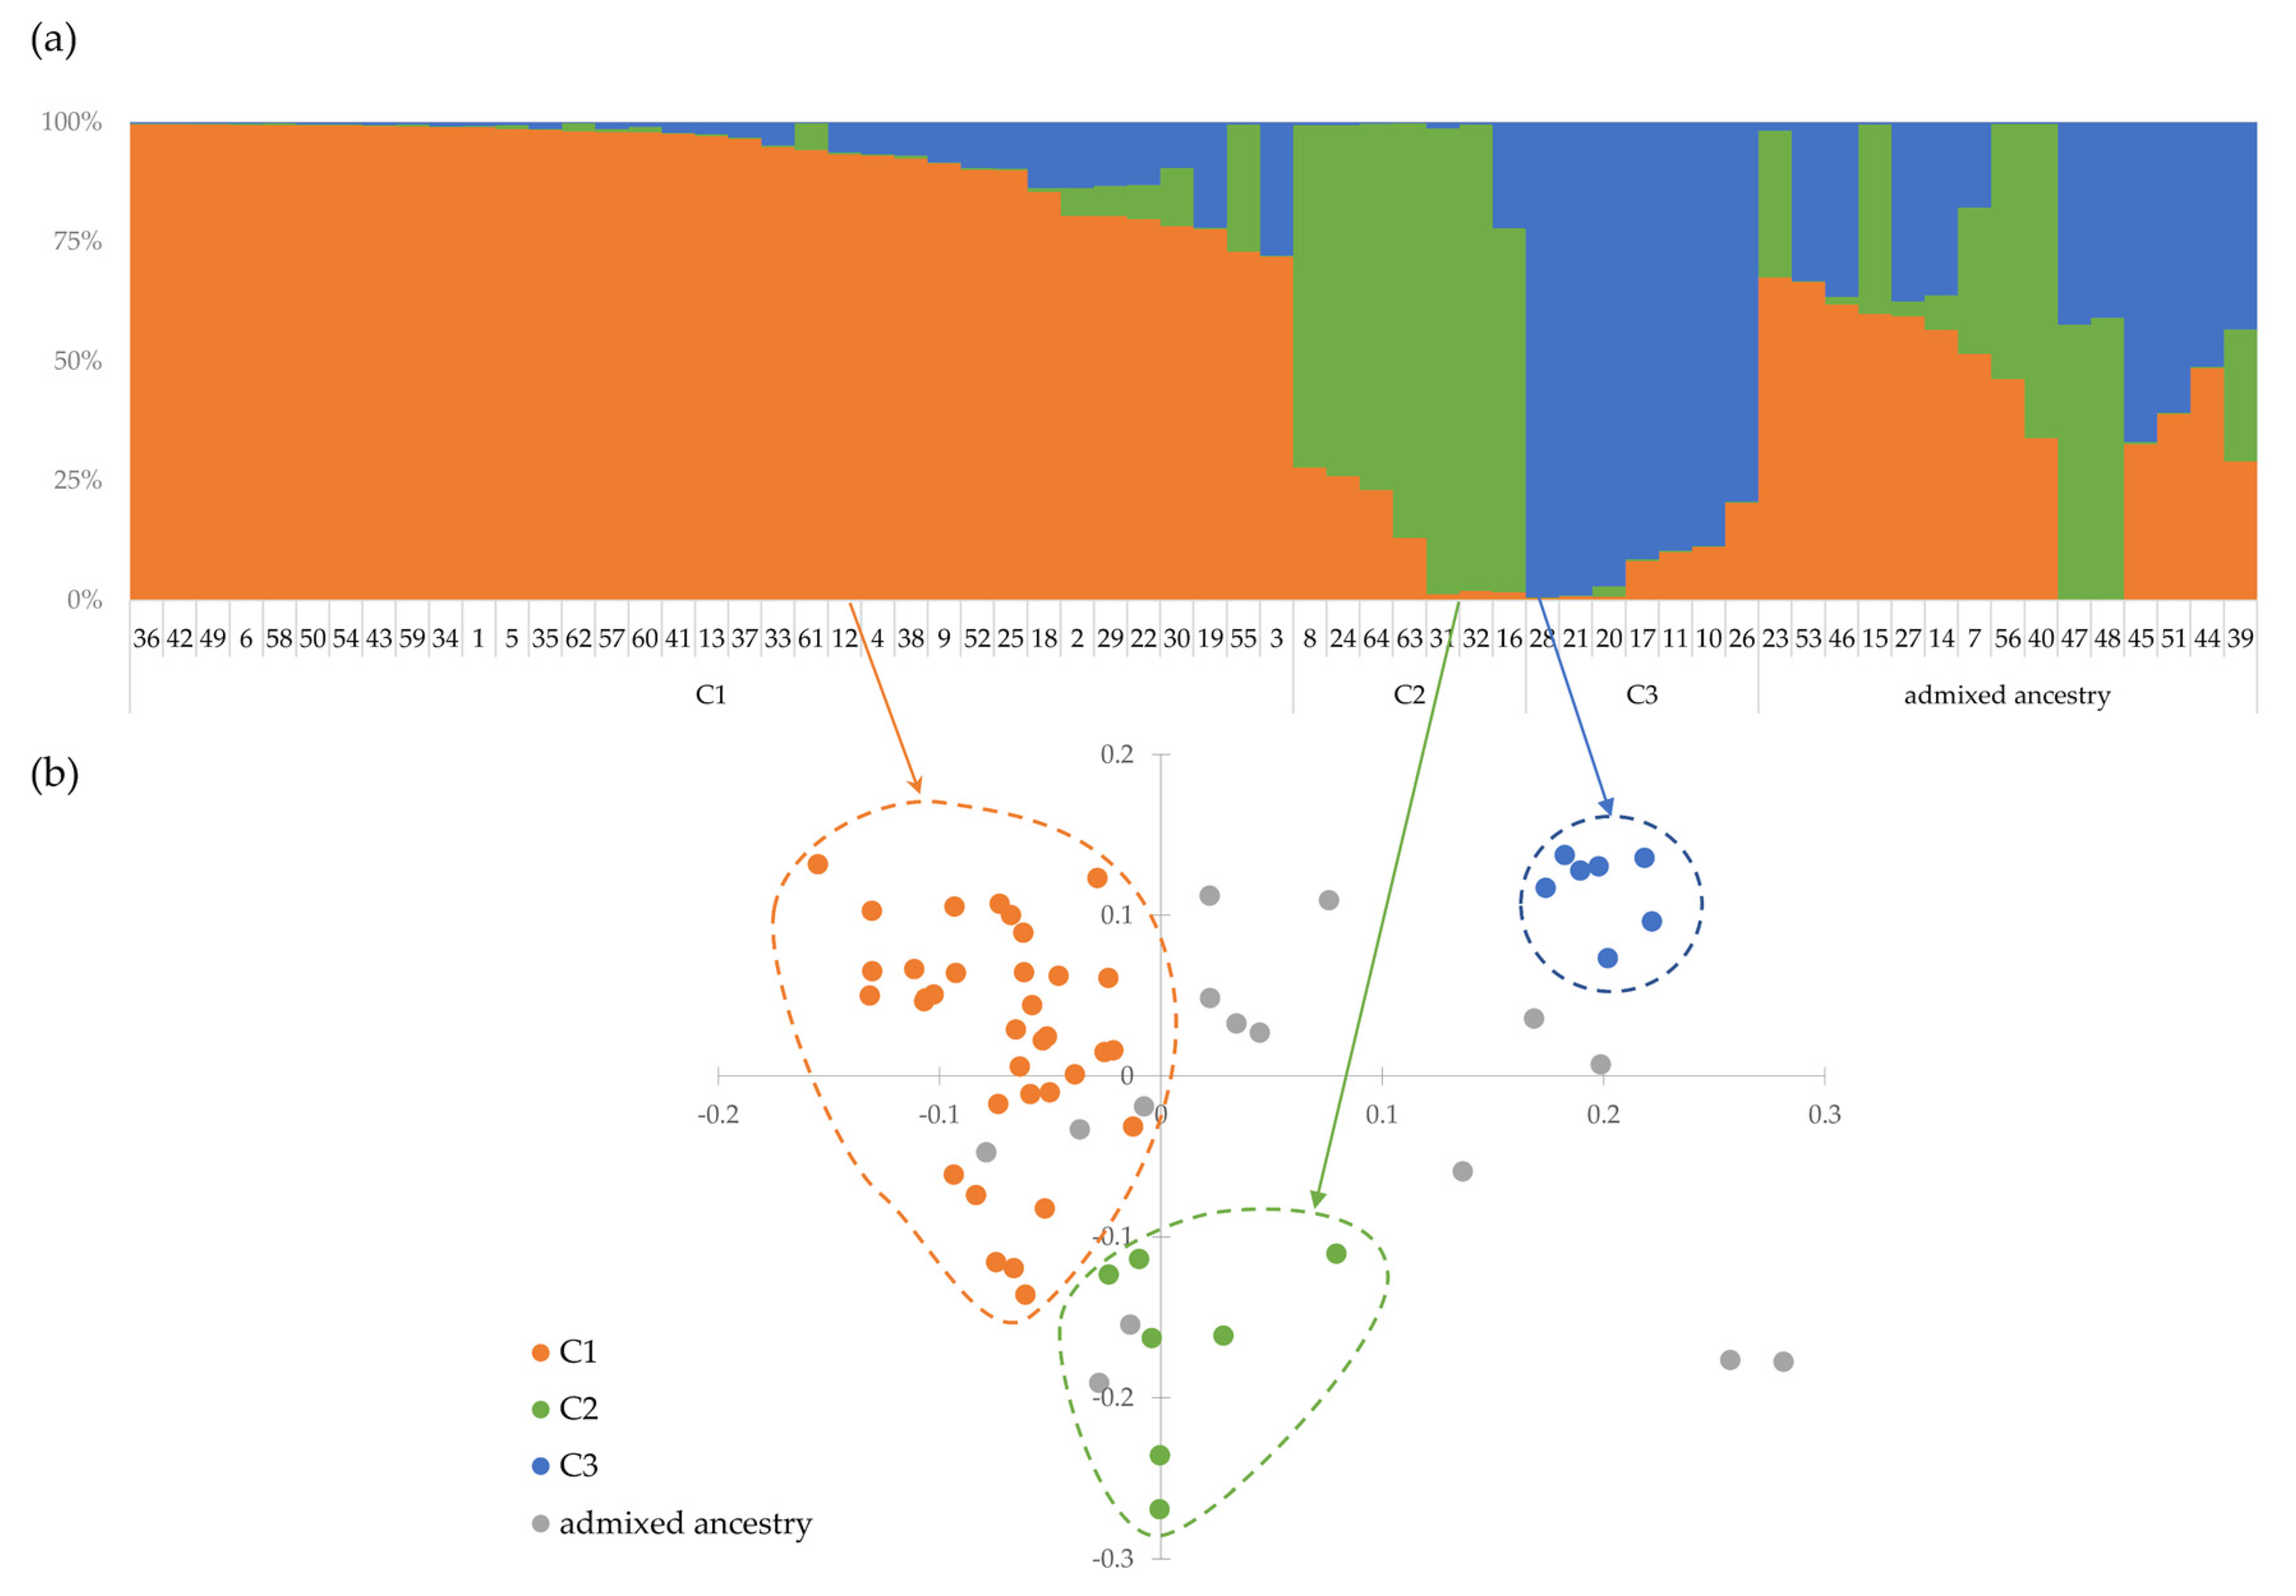
3.5.5. Population Structure
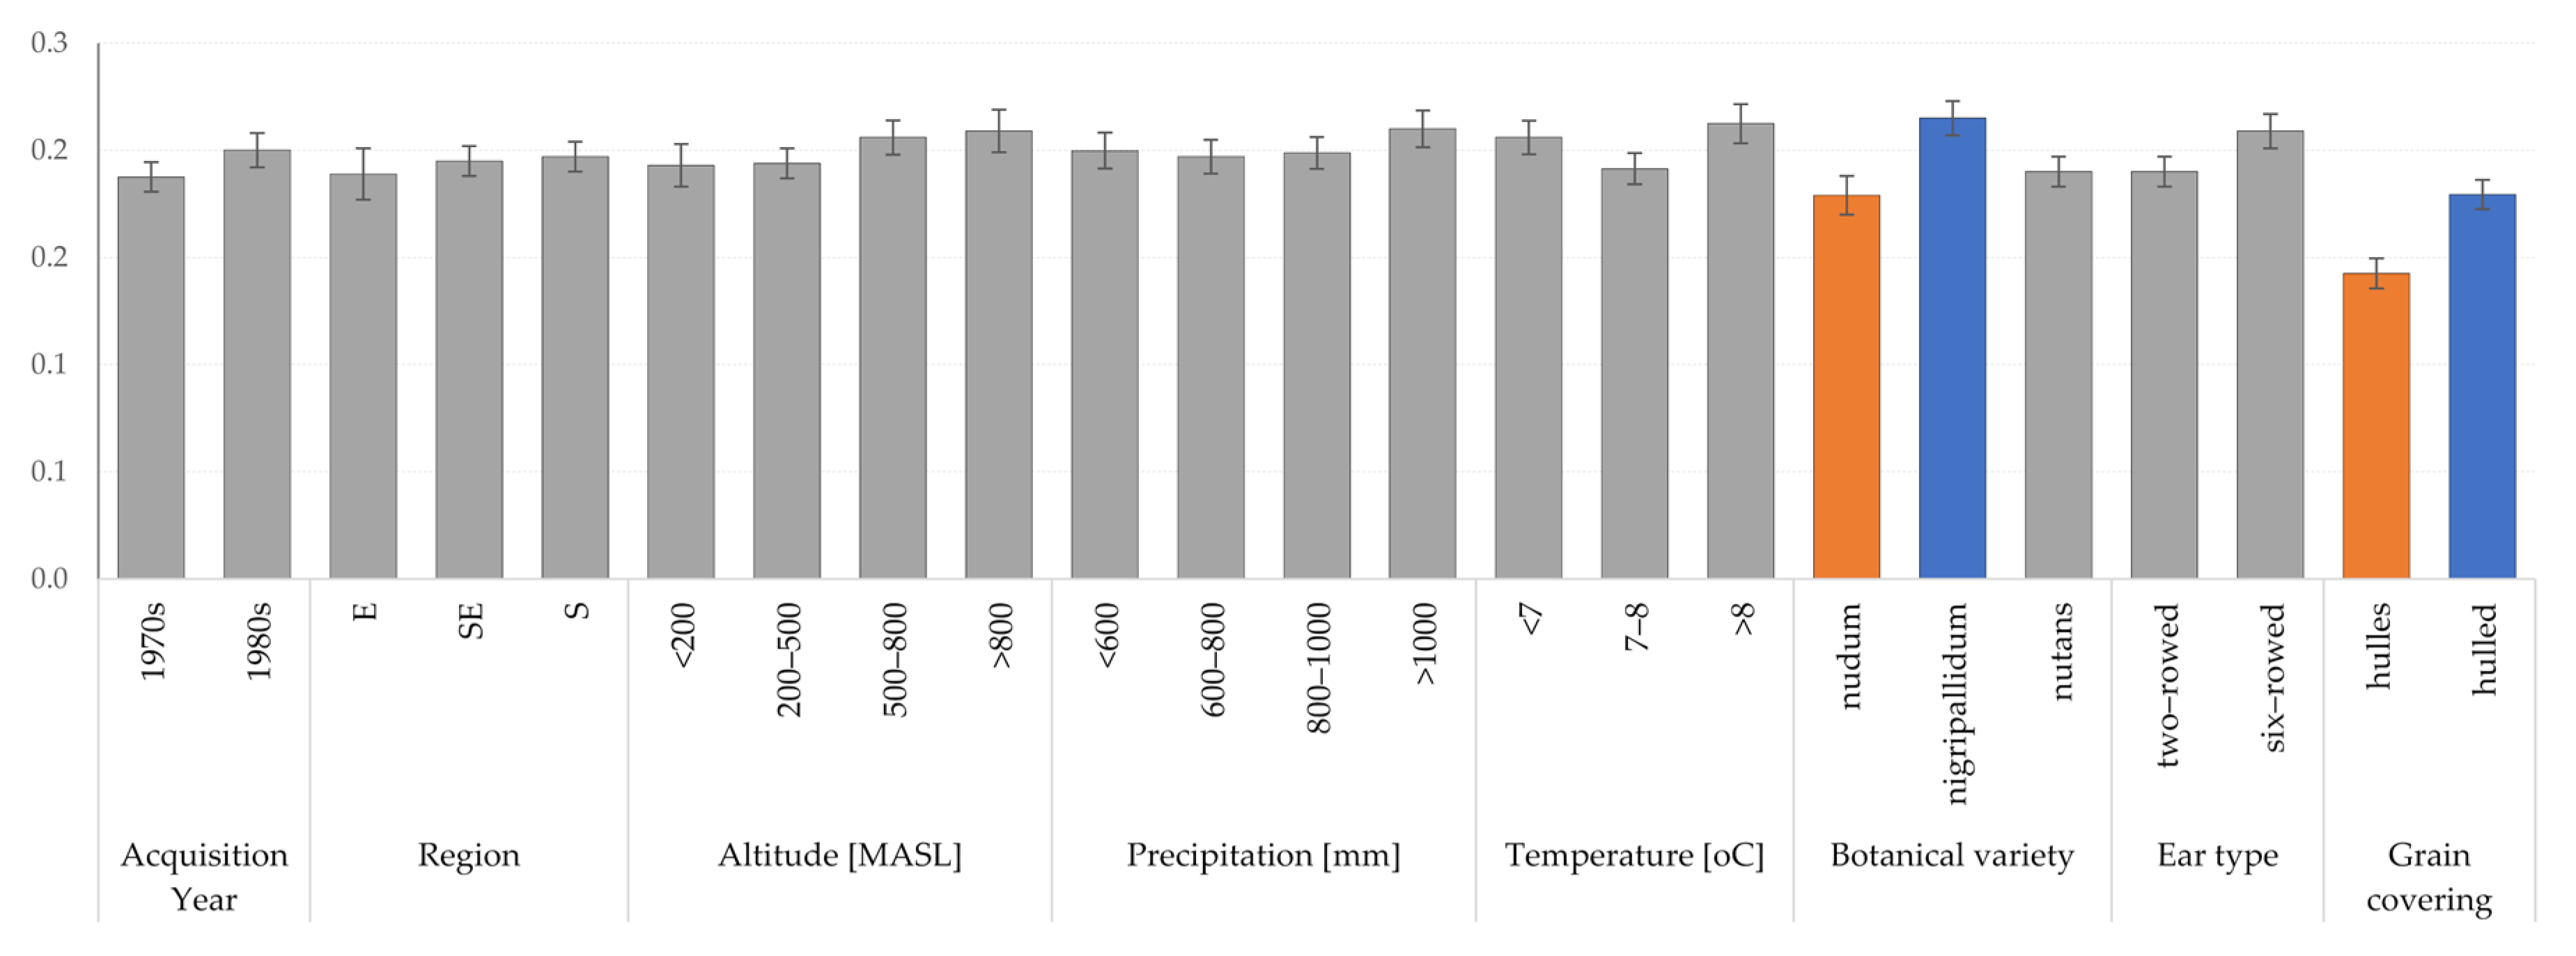
AMOVA results for botanical variety of H. vulgare attributed 0.87 of genetic diversity to the within variety and 0.17 to the between variety variations (Table 5). Results for mean annual temperature showed that 0.97 of genetic diversity resulted from genetic differentiation within groups and only 0.03 from variation among homogeneous groups, which were defined according to the criteria presented in Figure 8. The groups with different acquisition period differed from each other only 0.06 of the molecular variances. In other categories, the results were statistically insignificant. The results indicated that significant population structure may be associated only with a botanical variety and grain covering.
The STRUCTURE [19] analysis indicated that there is a visible population structure in the Polish spring barley landraces. The true number of clusters (K), as reported by Evanno et al. [20], is when ∆K, reached its peak and in the current study was K = 3 (Figure 11). Therefore, the accessions could be divided into three clusters with common ancestry (>0.7), i.e., C1 (n = 35), C2 (n = 7), C3 (n = 7) and 15 accessions had admixed ancestry (<0.7). The plot of STRUCTURE results was presented by Figure 12a. According to the results of AMOVA, this structure is related to the botanical diversity of the studied accessions. In C3 there were only accessions representing the brunneinudum variety. In turn, C1 and C2 were mainly accessions that were classified as var. nutans and, respectively, four and one of var. nigripallidum. These groups reflect only 53% of the division achieved in agglomerative clustering analysis. Definitely better fit was obtained with PCoA results (Figure 12b).

3.6. Joint Analysis

A pairwise Mantel test was performed for all the combinations of dissimilarity matrices. A significant correlation was not proven between genotype and grain morphology, no relation to the collection site location and climatic conditions was detected either.
A consensus configuration of genotype and grain morphology data was obtained by the generalized Procrustes analysis (GPA) [22]. Scaling was the most efficient method of data transformation (Table 6). Both types of data matched the consensus configuration at a similar level that was indicated by an equal value of the residuals by configuration after the transformation; however, the genetic data were nine-fold scaled up. The consensus test pointed out that the configuration was authentic and correspond to 0.68 of the original variance. A scatter plot showed that the studied accessions formed two groups consistent with grain covering (Figure 13).

4. Discussion

The history of agriculture, the size and structure of farms in Poland caused the cereal landraces had been cultivated and thus survived and could be preserved into the gene bank until the 1990s. The NCPGR’s landraces collection can be a valuable source of genetic variability, although its overall variation (uHe) was relatively low (0.185). This results from a significant fraction of high frequency fragments, indicating a significant proportion of the common genetic background. A higher value of differentiation was observed in the spring barley collections from the International Center for Agricultural Research in the Dry Area (ICARDA). However, a much larger and more diverse collection regarding its biological status (i.e., cultivars, breeding lines and landraces) and geographical origin was studied there [28]. The obtained value of the variation coefficient could be reduced by performing an analysis on bulk samples prepared from 24 plants. Therefore, the results presented in here, as well as other results published by teams all over the world [29,30,31], are affected by a similar error. The background to this error is purely economic. Although full-genomic analyzes are becoming cheaper every day, they are still too expensive to perform for all the gene banks accessions represented by a sufficiently large group of individuals. Therefore, the number of markers used in the study as well as bulk analysis may always be questionable. Researchers in gene banks will always be faced with the choice of if it is better to have knowledge with a slight margin of error about the stored accessions or to store uncharacterized materials whose usefulness is then negligible. However, there is a high probability that the barley landraces have relatively high levels of internal heterogeneity. Literature data indicate that landraces, compared to cultivars, are considered being much more genetically diverse [32,33,34,35,36]. A good confirmation of this hypothesis may be found in previous results of a differentiation analysis within a collection of common oats landraces originated from the same regions. The low total variation of the collection was accompanied by considerable internal variation of the studied accessions [37,38,39]. Moreover, the level of internal variation of the oat landraces was significantly higher than that found within the modern and historical cultivars [39].
In the presented paper, 64 landraces of spring barley were evaluated. The supremacy of spring forms in the collection results from the fact that in the past the cultivation of winter barley was marginal in Poland. It was mainly caused by its low winter hardiness in the humid continental climate of Poland. Even nowadays, despite breeding cultivars with a higher winter hardiness, winter barley is much less popular among farmers [40]. This is also reflected in the breeding; out of 115 barley cultivars listed in the National Register of Crop Cultivars, only 32 are winter barleys [41].
According to Vavilov’s botanical–geographical approach to centers of diversity, the investigated area belongs to the Central European and West-Ukrainian agro-ecological groups. This indicated that six-row barley with small grains should dominate. However, the landraces collection under study corresponds more to the description of the Western European group, i.e., two-rowed hulled spring barleys with large caryopses, and susceptibility to lodging [42]. It may have the basis of the historical territorial division of Poland. From the end of the 18th century until 1918, the areas of southern and southeastern Poland were part of the Austro-Hungarian monarchy. As a result, an influx of seed from West European might have occurred, and the information about such origin was not preserved in the memory of the farmers from whom the material was obtained into the gene bank. Therefore, it is recommended to make a comparison of this collection with landraces and historical cultivars from neighboring countries in the future. A comparison with cultivars grown in Poland in the 20th century will show whether the landraces collection whether it contains a unique gene pool or an admixture of modern cultivars. Although analyzing the sowing structure in Poland after 1945, such an admixture seems to be very unlikely. For many years only two cultivars of barley dominated in Poland, i.e., ‘Browarny PZHR’ and ‘Skrzeszowicki’. Other cultivars had a marginal importance [40]. However, taking into account the results obtained during the analysis of the landraces of common oats, it can be expected that the investigated accessions may show affinity to historical cultivars bred before 1939 [39]. Distinction of the gene pool from modern spring barley cultivars is highly probable because, during World War II, a majority of Polish breeding stations and their starting materials were destroyed. The German cultivars that were provided as part of compensation for war losses served as a foundation for the restoration of Polish breeding [39]. In the pedigrees of modern cultivars there is also no trace of the use of landraces. The data on the use of gene resources collected in the EGISET database maintained by the NCPGR show that the landraces are also lacking in interest from breeders today [6]. Breeders routinely concentrate on advanced cultivars or breeding lines with a limited genetic makeup that are easier to use and do not need several backcrossing cycles to eliminate undesirable traits introduced along with the desirable ones [34]. The landraces stored in gene banks still provide a unique source of specific traits such as resistance to diseases and pests, nutritional quality, and tolerance to marginal environmental conditions [43]. The chances of their use are increased by the direct deriving of homozygous lines by single seed descent and providing detailed information on their genotype and phenotype. The effectiveness of such an approach has been demonstrated for example for wheat or maize [44,45,46].
In this work, the results of genetic analysis performed using ISSR markers were combined with historical data of evaluation of important agronomic features and assessment of grain morphology. The passport data of the accession were used for identifying relationships between the genotype and the environment in which the landraces were formed. Von Bothmer et al. [42] indicated that, in domesticated barley, the distribution of genetic diversity is associated with genes of adaptation to different locations and environments. However, the results obtained here did not show the existence of a significant linkage between the genotype and either the place of origin or the environmental conditions. Therefore, it can be supposed that, in the case of Polish barley landraces, selection caused by environmental factors did not play a significant role in their development. Notably, quite often, accessions from the same place of origin showed significant morphological differentiation, i.e., they represented different botanical varieties. For example, the accessions PL 41267, PL 41282, PL 41432, and PL 41867 from the site with the coordinates 49°33′ N and 20°33′ E were described as three botanical varieties, i.e., brunneinudum, coeleste, and nutans. Thus, in the close neighborhood, two- and six-rowed, as well as hulless and hulled barleys, were grown. Different altitude of the collection sites indicates that the accessions could originate from farms located in a single village. These accessions showed at the same time genetic distinctiveness and the average genetic distance between them was 0.4. Moreover, they were characterized by a similar level and spectrum of resistance to pathogens. The above information may indicated the presence of different genes/alleles that determine resistance to the examined pathogens within these accessions. However, the hypothesis should be verified by performing laboratory resistance tests using isolates with different virulence. For comparison, in the common oat landraces, it was clearly visible that the accessions originated from the close neighborhood had a very similar phenotype, although the genotype, just like in barley, showed distinctiveness. However, in oats, the influence of the environment and specifically altitude on the formation of the landraces was clearly visible. This effect was noticeable at the level of genotype, phenotype, and metabolome [47].
None of the performed data analyzes, i.e., hierarchical grouping, PCoA, and population structure analysis based on the results of genetic data showed a clear division into two- and six-row forms. The genetic distinctiveness of these two types of barley was indicated, among others, by tests performed for 336 ICARDA accessions, 116 accessions representing five Chinese eco-geographic populations and 175 accessions from the Spanish barley core collection [28,48,49]. However, there are also reports where such a clear division was not observed, e.g., analysis of spring barley accessions from Kyrgyzstan [50]. Moreover, there were some overlaps between two- and six-row barley in the ICARDA collection [28]. For Polish landraces, the lack of a clear segregation of forms with different ear types may have resulted from too small representation of six-row forms, i.e., they made up 18% of the investigated accessions. It may also have resulted from the fact that there were no significant association between the amplified fragments with the genes determining the ear type. So far, five genes determining ear type were identified in barley vrs1-vrs5 [51,52,53,54,55,56]. However, in natural populations, mutations are detected only within two of them, vrs1 and vrs5 [51,57,58]. Mutations determining the six-row spike have appeared independently multiple times and in the history of barley cultivation [42,51]. Barley breeders pretty often use it to subdivide their germplasm in order to maintain a homogeneous ear type in the breeding materials. This may also be the reason there is no clear distinctiveness of groups with different ear types in the landraces.
The above results indicated a clear separation between the hulless and the hulled forms. The distinctiveness of hulless accessions was clearly visible in the results obtained in the genetic analysis as well as in the evaluation of grain morphometric traits. These two types of barley differ in their husk cover, which is loose in the hulless barley and separates easily from the grain during the threshing process [59]. The distinctive group of hulless accessions showed significantly lower variation than the hulled one. Once again, it was evident at the level of both the genotype and the grain morphotype. Archaeological data indicated that barley was domesticated in the Middle East around 8000 B.C. and the forms were hulled. The hulless barley appeared afterwards, around 6500 B.C. [60]. Studies indicated that the emergence of hulless barley is associated with a single mutation that occurred in either wild or domesticated barley [61]. In hulless barleys, a 17-kb deletion occurs in the locus NUD (for nudum) located on the long arm of the 7H chromosome. In the hulled forms, the locus contains a gene encoding the Ethylene Response Factor (ERF) family belonging to the Wax Inducer 1/Shine 1 (WIN1/SHN1) group [62]. The hulless forms have been present in the entire range of barley distribution and cultivation; however, the frequency of their occurrence varies significantly between regions. Hulless barley has been mainly found in East Asia and, due to its higher winter hardiness, it is grown mainly in mountainous areas. About 95% of hulless barley has been found in the highlands of Nepal, Bhutan, Tibet, Korea, and Japan. Besides these regions, it can be found in Ethiopia [63]. In Europe, North America, and Australia it has been quite rarely cultivated [59]. It may have resulted from their lower resistance to diseases and lower yield [42]. However, hulless barley also has a number of advantages resulting from the quality parameters of grain. Research results indicate that it contains a high amount of β-glucans, which have an anti-cholesterol effect, as well as high protein and lysine content [64,65,66,67,68]. The collection of Polish landraces has not been evaluated in terms of grain composition. Such studies are necessary to determine whether the hulless accessions indeed have higher nutritional value. If the results obtained are consistent with the literature data, these accessions have the potential to be used in the production of organic groats with pro-healthy properties, especially that they were highly resistant to net blotch, stem rust and scalds.
The standard accession assessment in gene banks includes, among others, the evaluation of grain parameters such as thousand grain weight, test weight, number of grains per ear or grain yield. These parameters are easy to evaluate, and the process itself is also cheap and fast. Their disadvantage, however, is the inability to assess the variation of grains within the accession. Grain size is an important feature for farmers, breeders, and scientists as well. It is also one of the components of the yield. However, manual evaluation of parameters describing the size of the grain is too time-consuming to perform as a standard for hundreds or thousands of accessions stored in the gene bank. On the other hand, the organoleptic evaluation of the grain color is always subjective and affected by a significant error [69]. The development of computer techniques of image analysis has been reflected in the development of phenomics and its application in agriculture and biological sciences. The GrainScan, free-of-charge software [18], used in the studies presented here allows for quick and reproducible evaluation of seven morphometric parameters of grain. The collection of Polish barley landraces was evaluated as the first one of the NCPGR germplasm resources. GrainScan software was also used to evaluate 789 bread wheat landraces from the ICARDA collection [70]. In both studies, the highest variation was observed for the parameter describing the grain area. However, the variation of morphometric traits in the Polish collection was higher for all evaluated parameters. This is most probably due to the presence of as many as six different botanical varieties of barley, three of which were hulless.

5. Conclusions

The collection of spring barley landraces acquired during the field expeditions in Poland showed significant morphological diversity. Its genetic variation was comparable to that described for landraces of other cereals from this region. The hulless and the hulled barley accessions formed separate groups, while the distinctness of two- and six-row forms was not visible. A significant part of the accessions was characterized by high resistance to diseases. The combination of the results of various types of analyzes describing this collection increases its chances to be used in research and breeding. However, its description should be extended in further research by high-throughput genotyping using next-generation sequencing techniques applied to single grain individuals, laboratory resistance tests, and qualitative analyzes of grain chemistry. Despite the lack of these detailed data, we strongly suggest that the Polish barley landraces provide an interesting germplasm and traditional indigenous knowledge preserved in the form of grains.

Supplementary Materials

The following are available online at https://www.mdpi.com/2073-4395/10/12/1958/s1, Table S1: Results of fields trial and ISSR markers; Figure S1: Photographs of barley landraces grains.

Author Contributions

Conceptualization, M.B. and G.G.; methodology, M.B. and G.G.; validation, W.P.; formal analysis, W.P.; investigation, J.D., M.B., G.G.; resources, W.P.; data curation, M.P., S.W., P.B.; writing—original draft preparation, J.D. and M.B.; writing—review and editing, G.G. and W.P.; visualization, M.P., S.W. and P.B.; supervision, M.B. All authors have read and agreed to the published version of the manuscript.

Funding

This work was supported by the Multi-annual program: 2015–2020 “Establishment of a scientific basis for biological progress and preservation of plant genetic resources as a source of innovation in order to support sustainable agriculture and food security of the country” coordinated by Plant Breeding and Acclimatization Institute (IHAR)-National Research Institute and financed by the Ministry of Agriculture and Rural Development of Poland. The calculations were performed at the Interdisciplinary Centre for Mathematical and Computational Modelling, University of Warsaw (ICM UW) within the framework of Computational Grant No. G72–19.

Acknowledgments

The team would like to thank Bogusław Łapiński from the Plant Breeding and Acclimatization Institute (IHAR)-National Research Institute for the proofreading and valuable remarks. The team also wants to thank the Director of the Plant Breeding and Acclimatization Institute (IHAR)-National Research Institute for their financial support for the publication of the results.

Conflicts of Interest

The authors declare no conflict of interest. The funders had no role in the design of the study; in the collection, analyses, or interpretation of data; in the writing of the manuscript, or in the decision to publish the results.

References

  1. FAO. Faostat, Statistical Databases; Food and Agriculture Organization of the United Nations: Roma, Italy, 2018. [Google Scholar]
  2. Friedt, W.; Horsley, R.D.; Harvey, B.L.; Poulsen, D.M.; Lance, R.C.; Ceccarelli, S.; Grando, S.; Capettini, F. Barley breeding history, progress, objectives, and technology. In Barley: Production, Improvement, and Uses; Ullrich, S.E., Ed.; Wiley-Blackwell: Hoboken, NJ, USA, 2011; pp. 160–220. [Google Scholar]
  3. European Commission. EU Plant Variety Database. 2020. Available online: https://ec.europa.eu/food/plant/plant_propagation_material/plant_variety_catalogues_databases/search/public/index.cfm (accessed on 10 November 2020).
  4. Caldwell, K.S.; Russell, J.; Langridge, P.; Powell, W. Extreme population-dependent linkage disequilibrium detected in an inbreeding plant species, Hordeum vulgare. Genetics 2006, 172, 557–567. [Google Scholar] [CrossRef] [PubMed] [Green Version]
  5. FAO. WIEWS—World Information and Early Warning System on Plant Genetic Resources for Food and Agriculture; FAO: Roma, Italy, 2018. [Google Scholar]
  6. NCPGR. EGISET. 2015. Available online: https://wyszukiwarka.ihar.edu.pl/pl (accessed on 10 November 2020).
  7. Azeez, M.A.; Adubi, A.O.; Durodola, F.A. Landraces and crop genetic improvement. In Rediscovery of Landraces as a Resource for the Future; IntechOpen: London, UK, 2018. [Google Scholar]
  8. Schmalenbach, I.; Körber, N.; Pillen, K. Selecting a set of wild barley introgression lines and verification of QTL effects for resistance to powdery mildew and leaf rust. Theor. Appl. Genet. 2008, 117, 1093–1106. [Google Scholar] [CrossRef] [PubMed] [Green Version]
  9. Kalladan, R.; Worch, S.; Rolletschek, H.; Harshavardhan, V.T.; Kuntze, L.; Seiler, C.; Sreenivasulu, N.; Röder, M.S. Identification of quantitative trait loci contributing to yield and seed quality parameters under terminal drought in barley advanced backcross lines. Mol. Breed. 2013, 32, 71–90. [Google Scholar] [CrossRef]
  10. Fan, Y.; Shabala, S.; Ma, Y.; Xu, R.; Zhou, M. Using QTL mapping to investigate the relationships between abiotic stress tolerance (drought and salinity) and agronomic and physiological traits. BMC Genom. 2015, 16, 1–11. [Google Scholar] [CrossRef] [PubMed] [Green Version]
  11. Mora, F.; Quitral, Y.A.; Matus, I.; Russell, J.; Waugh, R.; Del Pozo, A. SNP-based QTL mapping of 15 complex traits in barley under rain-fed and well-watered conditions by a mixed modeling approach. Front. Plant Sci. 2016, 7, 909. [Google Scholar] [CrossRef] [PubMed]
  12. Sayed, M.A.; Hamada, A.; Lèon, J.; Naz, A.A. Genetic mapping reveals novel exotic QTL alleles for seminal root architecture in barley advanced backcross double haploid population. Euphytica 2017, 213, 2. [Google Scholar] [CrossRef]
  13. Kloc, G.; Dostatny, D.F.; Sekutowski, T.; Podyma, W. The role of collection missions in gathering plant genetic resources material. Ann. UMCS Sectio E Agric. 2018, 73, 4. [Google Scholar] [CrossRef]
  14. Hammer, K.; Górski, M.; Hanelt, P.; Kühn, F.; Kulpa, W.; Schultze-Motel, J. Variability of wheat land-races from Czechoslovakia and Poland. Die Kult. 1981, 29, 91–97. [Google Scholar] [CrossRef]
  15. Hanelt, P.; Hammer, K. Bericht über eine Reise nach der VR Polen 1976 zur Sammlung autochthoner Sippen von Kulturpflanzen. Die Kult. 1977, 25, 33–44. [Google Scholar] [CrossRef]
  16. Kulpa, W.; Górski, M. Zasoby miejscowych form roślin uprawnych Cz. I. Wyniki eksploracji Płaskowyżu Kolbuszowskiego, Pogórza Karpackiego i Beskidów w latach 1976 i 1978. [Resources of landraces of cultivated plants Part I. Results of the exploration of the Kolbuszowski Plateau, Carpathian Foothills and Beskids in 1976 and 1978]. Biul. IHAR 1986, 160, 27–45. [Google Scholar]
  17. Mansfeld, R. Das morphologische System der Saatgerste, Hordeum vulgare L. sl. Der Züchter 1950, 20, 8–24. [Google Scholar] [CrossRef]
  18. Whan, A.P.; Smith, A.B.; Cavanagh, C.R.; Ral, J.-P.F.; Shaw, L.M.; Howitt, C.A.; Bischof, L. GrainScan: A low cost, fast method for grain size and colour measurements. Plant Methods 2014, 10, 23. [Google Scholar] [CrossRef] [PubMed] [Green Version]
  19. Hubisz, M.J.; Falush, D.; Stephens, M.; Pritchard, J.K. Inferring weak population structure with the assistance of sample group information. Mol. Ecol. Resour. 2009, 9, 1322–1332. [Google Scholar] [CrossRef] [PubMed] [Green Version]
  20. Evanno, G.; Regnaut, S.; Goudet, J. Detecting the number of clusters of individuals using the software STRUCTURE: A simulation study. Mol. Ecol. 2005, 14, 2611–2620. [Google Scholar] [CrossRef] [PubMed] [Green Version]
  21. Hijmans, R.; Cameron, S.; Parra, J. WorldClim. In Version 1.4 (Release 3). A Square Kilometer Resolution Database of Global Terrestrial Surface Climate; 2004; Available online: https://worldclim.org/data/worldclim21.html (accessed on 1 November 2020).
  22. Gower, J.C. Generalized procrustes analysis. Psychometrika 1975, 40, 33–51. [Google Scholar] [CrossRef]
  23. Peakall, R.; Smouse, P.E. GENALEX 6: Genetic analysis in Excel. Population genetic software for teaching and research. Mol. Ecol. Notes 2006, 6, 288–295. [Google Scholar] [CrossRef]
  24. Kopelman, N.M.; Mayzel, J.; Jakobsson, M.; Rosenberg, N.A.; Mayrose, I. Clumpak: A program for identifying clustering modes and packaging population structure inferences across K. Mol. Ecol. Resour. 2015, 15, 1179–1191. [Google Scholar] [CrossRef] [Green Version]
  25. QGIS.org QGIS Geographic Information System. Open Source Geospatial Foundation Project. 2020. Available online: http://www.gdal.org/ogr/ogr_formats.html (accessed on 10 November 2020).
  26. South, A. Rworldxtra: Country Boundaries at High Resolution, R Package Version 1.01; 2012. Available online: https://rdrr.io/cran/rworldxtra/ (accessed on 1 November 2020).
  27. GIMP. 2019. Available online: https://www.gimp.org (accessed on 10 November 2020).
  28. Amezrou, R.; Gyawali, S.; Belqadi, L.; Chao, S.; Arbaoui, M.; Mamidi, S.; Rehman, S.; Sreedasyam, A.; Verma, R.P.S. Molecular and phenotypic diversity of ICARDA spring barley (Hordeum vulgare L.) collection. Genet. Resour. Crop Evol. 2018, 65, 255–269. [Google Scholar] [CrossRef]
  29. Mohammadi, S.A.; Sisi, N.A.; Sadeghzadeh, B. The influence of breeding history, origin and growth type on population structure of barley as revealed by SSR markers. Sci. Rep. 2020, 10, 1–13. [Google Scholar] [CrossRef]
  30. Asmamaw, M.; Keneni, G.; Tesfaye, K. Genetic diversity of Ethiopian durum wheat (Triticum durum Desf.) landrace collections as reveled by SSR markers. Adv. Crop Sci. Technol. 2019, 7, 1–9. [Google Scholar] [CrossRef]
  31. Singh, N.; Choudhury, D.R.; Tiwari, G.; Singh, A.K.; Kumar, S.; Srinivasan, K.; Tyagi, R.; Sharma, A.; Singh, N.; Singh, R. Genetic diversity trend in Indian rice varieties: An analysis using SSR markers. BMC Genet. 2016, 17, 127. [Google Scholar] [CrossRef] [PubMed] [Green Version]
  32. Hoyt, E. Conserving the Wild Relatives of Crops; Nternational Board for Plant Genetic Resources: Rome, Italy, 1988; pp. 1–45. [Google Scholar]
  33. Hawkes, J.G. The Diversity of Crop Plants; Harvard Univerity Press: Cambridge, MA, USA, 1983; pp. 1–184. [Google Scholar]
  34. Villa, T.C.C.; Maxted, N.; Scholten, M.; Ford-Lloyd, B. Defining and identifying crop landraces. Plant Genet. Resour. 2005, 3, 373–384. [Google Scholar] [CrossRef] [Green Version]
  35. FAO. The State of the World’s Plant Genetic Resources for Food and Agriculture; FAO: Roma, Italy, 1998. [Google Scholar]
  36. Brown, A.H. Genes in the Field, Chapter the Genetic Structure of Crop Landraces and the Challenge to Conserve Them In Situ on Farms; Lewis Publishers: Boca Raton, FL, USA, 2000; pp. 29–48. [Google Scholar]
  37. Boczkowska, M.; Łapiński, B.; Kordulasińska, I.; Dostatny, D.F.; Czembor, J.H. Promoting the use of common oat genetic resources through diversity analysis and core collection construction. PLoS ONE 2016, 11, e0167855. [Google Scholar] [CrossRef] [PubMed] [Green Version]
  38. Boczkowska, M.; Tarczyk, E. Genetic diversity among Polish landraces of common oat (Avena sativa L.). Genet. Resour. Crop Evol. 2013, 60, 2157–2169. [Google Scholar] [CrossRef] [Green Version]
  39. Boczkowska, M.; Onyśk, A. Unused genetic resources: A case study of Polish common oat germplasm. Ann. Appl. Biol. 2016, 169, 155–165. [Google Scholar] [CrossRef]
  40. Arseniuk, E.; Krzymuski, J.; Martyniak, J.; Oleksiak, T. Historia Hodowli i Nasiennictwa na Ziemiach Polskich w XX Wieku (The History of Breeding and Seed Production on Polish Territory in the XX Century); IHAR Radzików: Poznań, Poland, 2003. [Google Scholar]
  41. COBORU. Krajowy Rejestr Odmian Gatunków Roślin Uprawnych [National Register of Cultivated Plant Species Cultivars]; Centralny Ośrodek Badania Odmian Roślin Uprawnych: Słupia Wielka, Poland, 2020. [Google Scholar]
  42. Von Bothmer, R.; van Hintum, T.; Knüpffer, H.; Sato, K. Diversity in barley (Hordeum vulgare); Elsevier: Amsterdam, The Netherlands, 2003. [Google Scholar]
  43. Frankel, O.H.; Brown, A.H.; Burdon, J.J. The Conservation of Plant Biodiversity; Cambridge University Press: Cambridge, UK, 1995. [Google Scholar]
  44. Arca, M.; Gouesnard, B.; Mary-Huard, T.; Le Paslier, M.-C.; Bauland, C.; Madur, D.; Combes, V.; Charcosset, A.D.; Nicolas, S.D. Genome-wide SNP genotyping of DNA pools identifies untapped landraces and genomic regions that could enrich the maize breeding pool. bioRxiv 2020. [Google Scholar] [CrossRef]
  45. Riaz, A.; Hathorn, A.; Dinglasan, E.; Ziems, L.; Richard, C.; Singh, D.; Mitrofanova, O.; Afanasenko, O.; Aitken, E.; Godwin, I. Into the vault of the Vavilov wheats: Old diversity for new alleles. Genet. Resour. Crop Evol. 2017, 64, 531–544. [Google Scholar] [CrossRef]
  46. Riaz, A.; Athiyannan, N.; Periyannan, S.K.; Afanasenko, O.; Mitrofanova, O.P.; Platz, G.J.; Aitken, E.A.; Snowdon, R.J.; Lagudah, E.S.; Hickey, L.T. Unlocking new alleles for leaf rust resistance in the Vavilov wheat collection. Theor. Appl. Genet. 2018, 131, 127–144. [Google Scholar] [CrossRef]
  47. Boczkowska, M.; Zebrowski, J.; Nowosielski, J.; Kordulasińska, I.; Nowosielska, D.; Podyma, W. Environmentally-related genotypic, phenotypic and metabolic diversity of oat (Avena sativa L.) landraces based on 67 Polish accessions. Genet. Resour. Crop Evol. 2017, 64, 1829–1840. [Google Scholar] [CrossRef] [Green Version]
  48. Chen, F.; Chen, D.; Vallés, M.-P.; Gao, Z.; Chen, X. Analysis of diversity in Chinese cultivated barley with simple sequence repeats: Differences between eco-geographic populations. Biochem. Genet. 2010, 48, 44–56. [Google Scholar] [CrossRef]
  49. Lasa, J.; Igartua, E.; Ciudad, F.; Codesal, P.; Garcíaa, E.; Gracia, M.; Medina, B.; Romagosa, I.; Molina-Cano, J.; Montoya, J. Morphological and agronomical diversity patterns in the Spanish barley core collection. Hereditas 2001, 135, 217–225. [Google Scholar] [CrossRef] [PubMed] [Green Version]
  50. Usubaliev, B.; Brantestam, A.K.; Salomon, B.; Garkava-Gustavson, L.; von Bothmer, R. Genetic diversity in farmer grown spring barley material from Kyrgyzstan. Genet. Resour. Crop Evol. 2013, 60, 1843–1858. [Google Scholar] [CrossRef]
  51. Komatsuda, T.; Pourkheirandish, M.; He, C.; Azhaguvel, P.; Kanamori, H.; Perovic, D.; Stein, N.; Graner, A.; Wicker, T.; Tagiri, A. Six-rowed barley originated from a mutation in a homeodomain-leucine zipper I-class homeobox gene. Proc. Natl. Acad. Sci. USA 2007, 104, 1424–1429. [Google Scholar] [CrossRef] [PubMed] [Green Version]
  52. Youssef, H.M.; Eggert, K.; Koppolu, R.; Alqudah, A.M.; Poursarebani, N.; Fazeli, A.; Sakuma, S.; Tagiri, A.; Rutten, T.; Govind, G. VRS2 regulates hormone-mediated inflorescence patterning in barley. Nat. Genet. 2017, 49, 157–161. [Google Scholar] [CrossRef]
  53. Bull, H.; Casao, M.C.; Zwirek, M.; Flavell, A.J.; Thomas, W.T.; Guo, W.; Zhang, R.; Rapazote-Flores, P.; Kyriakidis, S.; Russell, J. Barley SIX-ROWED SPIKE3 encodes a putative Jumonji C-type H3K9me2/me3 demethylase that represses lateral spikelet fertility. Nat. Commun. 2017, 8, 1–9. [Google Scholar] [CrossRef] [Green Version]
  54. van Esse, G.W.; Walla, A.; Finke, A.; Koornneef, M.; Pecinka, A.; Von Korff, M. Six-Rowed Spike3 (VRS3) is a histone demethylase that controls lateral spikelet development in barley. Plant Physiol. 2017, 174, 2397–2408. [Google Scholar] [CrossRef] [Green Version]
  55. Koppolu, R.; Anwar, N.; Sakuma, S.; Tagiri, A.; Lundqvist, U.; Pourkheirandish, M.; Rutten, T.; Seiler, C.; Himmelbach, A.; Ariyadasa, R. Six-rowed spike4 (Vrs4) controls spikelet determinacy and row-type in barley. Proc. Natl. Acad. Sci. USA 2013, 110, 13198–13203. [Google Scholar] [CrossRef] [Green Version]
  56. Ramsay, L.; Comadran, J.; Druka, A.; Marshall, D.F.; Thomas, W.T.; Macaulay, M.; MacKenzie, K.; Simpson, C.; Fuller, J.; Bonar, N. INTERMEDIUM-C, a modifier of lateral spikelet fertility in barley, is an ortholog of the maize domestication gene TEOSINTE BRANCHED 1. Nat. Genet. 2011, 43, 169–172. [Google Scholar] [CrossRef]
  57. Saisho, D.; Pourkheirandish, M.; Kanamori, H.; Matsumoto, T.; Komatsuda, T. Allelic variation of row type gene Vrs1 in barley and implication of the functional divergence. Breed. Sci. 2009, 59, 621–628. [Google Scholar] [CrossRef] [Green Version]
  58. Youssef, H.M.; Mascher, M.; Ayoub, M.A.; Stein, N.; Kilian, B.; Schnurbusch, T. Natural diversity of inflorescence architecture traces cryptic domestication genes in barley (Hordeum vulgare L.). Genet. Resour. Crop Evol. 2017, 64, 843–853. [Google Scholar] [CrossRef]
  59. Li, Y.; Long, C.; Kato, K.; Yang, C.; Sato, K. Indigenous knowledge and traditional conservation of hulless barley (Hordeum vulgare) germplasm resources in the Tibetan communities of Shangri-la, Yunnan, SW China. Genet. Resour. Crop Evol. 2011, 58, 645–655. [Google Scholar] [CrossRef]
  60. Zohary, D.; Hopf, M.; Weiss, E. Domestication of Plants in the Old World: The Origin and Spread of Domesticated Plants in Southwest Asia, Europe, and the Mediterranean Basin; Oxford University Press: New York, NY, USA, 2012. [Google Scholar]
  61. Taketa, S.; Kikuchi, S.; Awayama, T.; Yamamoto, S.; Ichii, M.; Kawasaki, S. Monophyletic origin of naked barley inferred from molecular analyses of a marker closely linked to the naked caryopsis gene (nud). Theor. Appl. Genet. 2004, 108, 1236–1242. [Google Scholar] [CrossRef] [PubMed]
  62. Taketa, S.; Amano, S.; Tsujino, Y.; Sato, T.; Saisho, D.; Kakeda, K.; Nomura, M.; Suzuki, T.; Matsumoto, T.; Sato, K. Barley grain with adhering hulls is controlled by an ERF family transcription factor gene regulating a lipid biosynthesis pathway. Proc. Natl. Acad. Sci. USA 2008, 105, 4062–4067. [Google Scholar] [CrossRef] [PubMed] [Green Version]
  63. Assefa, A.; Labuschagne, M.T. Phenotypic variation in barley (Hordeum vulgare L.) landraces from north Shewa in Ethiopia. Biodivers. Conserv. 2004, 13, 1441–1451. [Google Scholar] [CrossRef]
  64. Berglung, P.; Holm, E.; Fastnaught, C. Hulless barley: Alternative uses. Barley Newsl. 1993, 36, 130–131. [Google Scholar]
  65. Dziamba, S.; Rachon, L. Differentiation of yield component in naked-grained and husked spring barley varieties grown in pure and mixed. Biul. Inst. Hod. Aklim. Rosl. 1988, 167, 79–85. [Google Scholar]
  66. Gol’denberg, Z.; Kvachadze, M. Content of protein and of the amino acid tryptophan in the grain of some forms of barley. Soobshcheniya Akad. Nauk Gruz. SSR 1990, 139, 397–400. [Google Scholar]
  67. Oscarsson, M.; Andersson, R.; Salomonsson, A.-C.; Åman, P. Chemical composition of barley samples focusing on dietary fibre components. J. Cereal Sci. 1996, 24, 161–170. [Google Scholar] [CrossRef]
  68. Bhatty, R. The potential of hull-less barley, a review. Cereal Chem. 1986, 63, 97–103. [Google Scholar]
  69. Peterson, C.; Shelton, D.; Martin, T.; Sears, R.; Williams, E.; Graybosch, R. Grain color stability and classification of hard white wheat in the US. Euphytica 2001, 119, 101–107. [Google Scholar] [CrossRef]
  70. Kehel, Z.; Sanchez-Garcia, M.; El Baouchi, A.; Aberkane, H.; Tsivelikas, A.; Chen, C.; Amri, A. Predictive characterization for seed morphometric traits for genebank accessions using genomic selection. Front. Ecol. Evol. 2020, 8, 32. [Google Scholar] [CrossRef] [Green Version]
Figure 1. Photographs of grain representing barley botanical varieties: (a) brunneinudum (PL 41266); (b) coeleste (PL 41867); (c) nigripallidum (PL 40070); (d) nutans (PL 41282); (e) rikotense (PL 42389); (f) viride (PL 41869).
Agronomy 10 01958 g001
Figure 2. Map with marked places of barley landraces origins.
Agronomy 10 01958 g002
Figure 3. The distribution of twelve agro-morphological traits in the collection of 64 Polish barley landraces; (a) phenological; (b) metrical; (c) bonitations.
Agronomy 10 01958 g003
Figure 4. Grains morphology of the collection of 64 Polish barley landraces: (a) distribution of the parameter values describing grain size; (b) distribution of the parameters values describing grain color; (c) a photograph of PL 42122 grains; (d) photograph of PL 41533; (e) photograph of PL 41279.
Agronomy 10 01958 g004
Figure 5. The internal variation of grain morphology of the collection of 64 Polish barley landraces for groups defined according to the following information: acquisition year, region of origin, altitude, annual precipitation, average annual temperature, botanical variety, ear type, grain covering. Significantly different groups (p < 0.05) were highlighted in orange and blue; (a) surface area; (b) perimeter; (c) length; (d) width; (e) color (Red); (f) color (Green); (g) color (Blue).
Agronomy 10 01958 g005
Figure 6. The results of cluster analysis performed by Ward’s method based on the Gower coefficient for grain morphology of 64 Polish spring barley landraces.
Agronomy 10 01958 g006
Figure 7. The results of the Principal Component Analysis (PCA) for grain morphology of 64 Polish spring barley landraces. (a) Plot of results for the first and second axis with indication accession order numbers according to Table 1; (b) Plot of results for the 1st and 2nd axis with indication of botanical variety. The hulless grain was marked with a triangle and the husked with a circle; (c) Plot of results for the 1st and 2nd axis with the indication of groups identified based on agglomerative clustering results (Figure 6).
Agronomy 10 01958 g007
Figure 8. The internal variation coefficient (uHe) of 64 Polish spring barley landraces based on inter simple sequence repeat (ISSR) data, calculated for groups distinguished based on the following information: acquisition year, region of origin, altitude, annual precipitation, average annual temperature, botanical variety, ear type, grain covering. Significantly different groups (p < 0.05) were highlighted in orange and blue.
Agronomy 10 01958 g008
Figure 9. The results of cluster analysis of 64 Polish spring barley landraces performed by Ward’s method based on Dice’s distance of inter simple sequence repeat (ISSR) data.
Agronomy 10 01958 g009
Figure 10. The results of the Principal Coordinates Analysis (PCoA) of 64 Polish spring barley landraces based on inter simple sequence repeat (ISSR) data. (a) Plot of results for the first and second axis with indication accession order numbers according to Table 1; (b) Plot of results for the 1st and 2nd axis with indication of botanical variety. The hulless grain was marked with a triangle and the husked with a circle; (c) Plot of results for the 1st and 2nd axis with the indication of groups identified based on agglomerative clustering results; (d) Plot of results for the 3rd and 4th axis with the indication of groups identified based on agglomerative clustering results (Figure 9).
Agronomy 10 01958 g010
Figure 11. The results of ad hoc measure ∆K [20] generated by CLUMPAK software [24].
Agronomy 10 01958 g011
Figure 12. (a) The results of 100,000 iterations of STRUCTURE software [19] of 64 Polish spring barley landraces based on inter simple sequence repeat (ISSR) data with K values k = 3, where K is the number of ad hoc groups to be formed; each vertical bar represents one accession that is marked by order number (Table 1). The length of the colored segment shows the estimated proportion of membership of that sample to each group. (b) The plot of PCoA results (A1 vs. A2) with the indication of groups identified on the basis of results of STRUCTURE analysis.
Agronomy 10 01958 g012
Figure 13. The results of the Generalized Procrustes Analysis of genotypic and grain morphologic data of 64 Polish spring barley landraces: (a) Plot of results for the first and second axis with indication accession order numbers according to Table 1; (b) Plot of results for the 1st and 2nd axis with indication of botanical variety. The hulless grain was marked with a triangle and the husked with a circle.
Agronomy 10 01958 g013
Table 1. The list of accessions used in the study with eco-geographic description of collection sites.
NumberAccession Number with Country PrefixBotanical VarietyAcquisition YearLatitudeLongitudeAltitude (Meters above Sea Level)RegionResistance
H1PL 400044197849 36 N21 44 E400SEsr, nb
H2PL 400684197849 37 N22 06 E400SEsr, nb, s
H3PL 400703197849 33 N21 56 E400SEsr, nb, s
H4PL 400734197849 36 N20 29 E860Ssr, nb, s
H5PL 402154197849 30 N22 05 E900SEsr, nb, s
H6PL 405524197752 05 N22 07 E160Epm, nb
H7PL 405533197750 49 N22 19 E260SEnb
H8PL 405544197750 22 N21 50 E200SEnb
H9PL 412654197850 18 N21 45 E220SEnb, s
H10PL 412661197849 32 N22 06 E400SEsr, nb, s
H11PL 412671197849 33 N20 33 E340Ssr, nb, s
H12PL 412684197849 36 N21 03 E400SEsr, nb, s
H13PL 412694197849 32 N21 02 E440SEsr, nb, s
H14PL 412703197849 33 N20 59 E400Snb, s
H15PL 412714197849 33 N20 59 E400Ssr, nb, s
H16PL 412723197849 27 N20 59 E680Ssr, nb, s
H17PL 412731197849 39 N20 36 E500Ssr, nb, s
H18PL 412744197849 41 N20 21 E640Ssr, nb, s
H19PL 412794197849 41N20 21 E640Ssr, nb, s
H20PL 412801197849 41 N20 21 E640Ssr, nb, s
H21PL 412811197849 36 N21 03 E360SEsr, nb, s
H22PL 412824197849 22 N20 11 E900Ssr, nb, s
H23PL 412844197849 24 N20 18 E500Snb, s
H24PL 413654197953 16 N23 47 E180NEsr, nb, s
H25PL 414304197849 33 N20 33 E380Ssr, nb, s
H26PL 414311198149 32 N21 02 E400SEsr, s
H27PL 414323198149 33 N20 33 E400Ssr, s
H28PL 414331198149 36 N21 03 E360SEs
H29PL 414344198149 26 N20 19 E400Ssr, s
H30PL 414354198149 24 N20 21 E500Ss
H31PL 415254197749 24 N20 21 E500Spm, sr, nb
H32PL 415264197749 22 N20 11 E660Sl, pm, sr, nb
H33PL 415274197749 35 N20 28 E500Spm, sr, nb
H34PL 415284197749 29 N22 04 E440SEl, pm, sr, nb
H35PL 415294197749 19 N22 41 E500SEpm, sr, nb
H36PL 415304197749 36 N21 48 E540SEpm, sr, nb
H37PL 415314197749 27 N22 20 E500SEpm, sr, nb
H38PL 415324197749 21 N22 17 E500SEl, pm, sr, nb
H39PL 415334197849 32 N22 06 E400SEsr, nb, s
H40PL 417304197749 20 N20 06 E900Spm, sr, nb
H41PL 417314197749 23 N20 08 E800Spm, sr, nb
H42PL 417324197749 30 N20 14 E900Ssr, nb, s
H43PL 417684197749 24 N20 21 E500Sl, pm, sr, nb
H44PL 418672197849 33 N20 33 E400Ssr, nb, s
H45PL 418681197849 39 N20 36 E500Ssr, nb, s
H46PL 418696197749 29 N22 04 E440SEpm, sr, nb
H47PL 418711197849 32 N22 06 E400SEsr, nb, s
H48PL 420173197749 26 N20 44 E505Sl, pm, sr, nb
H49PL 421204197749 33 N20 33 E360Sl, pm, sr, nb
H50PL 421214197749 29 N22 04 E440SEpm, sr, nb
H51PL 421221197749 31 N22 09 E360SEsr, nb
H52PL 423884198451 50 N22 29 E155E
H53PL 423895198451 50 N22 29 E155E
H54PL 427683198650 39 N22 18 E195SE
H55PL 427693198650 39 N23 22 E220SE
H56PL 427703198650 52 N23 04 E210SE
H57PL 427713198650 51 N23 27 E280SE
H58PL 4305141988nanananasr
H59PL 4305241988nanananasr
H60PL 4305341988nanananasr
H61PL 4305441988nananana
H62PL 4305541988nananana
H63PL 4307541988nananana
H64PL 4335741988nanananasr
(Botanical variety: 1—brunneinudum, 2—coeleste, 3—nigripallidum, 4—nutans, 5—rikotense, 6—viride; Region: E—East, NE—North East, S—South, SE—South East; Resistance: l—lodging, pm—powdery mildew, sr—steam rust, nb—net blotch, s—scald).
Table 2. Range and mean of twelve evaluation traits assessed in field experiments. The accession number is in parentheses.
TraitUnit% of Evaluated AccessionsMeanMin.Max.Variation
Phenologicaldays to headingdays98.4%71.652.0 (PL 42 389)82.0 (PL 41267)9%
grain filling durationdays98.4%36.126.3 (PL 42769)44.0 (PL 40554)11%
days to maturitydays98.4%108.181.7 (PL 42769)117.0 (PL 41532)6%
Metricalplant heightcm98.4%85.469.0 (PL 42017)109.0 (PL 42389)10%
ear lengthcm60.9%9.27.0 (PL 42389)11.0 (PL 41365)11%
number of grains per earno.46.9%11.67.7 (PL 40553)19.3 (PL 41279)21%
thousand grain weightg98.4%46.236.0 (PL 41270)55.2 (PL 41730)10%
Bonitationslodging resistancescale 198.4%4.31.0 (17 access.)9.0 (6 access.)65%
powdery mildew resistancescale 198.4%6.12.0 (2 access.)9.0 (16 access.)35%
net blotch resistancescale 190.6%8.76.0 (2 access.)9.0 (47 access.)8%
stem rust resistancescale 179.7%8.53.0 (1 access.)9.0 (46 access.)18%
skald resistancescale 150.0%8.97.0 (1 access.)9.0 (31 access.)4%
1 scale (1—very low, …, 9—very good).
Table 3. Summary of ISSR primers efficiency.
PrimerSequenceDyeNo. Fragments% Polymorphic FragmentsPIC
UBC 807(AG)8T6-FAM8143%0.145
UBC 825(AC)8T8662%0.231
UBC 834(AG)8YTVIC8136%0.106
UBC 841(GA)8YC10760%0.191
UBC 856(AC)8YANED6162%0.219
UBC 857(AC)8YG10276%0.247
UBC 884HBH(AG)7PET8555%0.192
UBC 885BHB(GA)79051%0.189
Table 4. Range and mean of seven parameters describing grain morphology. The accession number is in parentheses.
ParameterUnitMeanMin.Max.Variation
Surface areamm218.289.53 (PL 42122)23.33 (PL 41533)14%
Perimetermm23.2216.42 (PL 42122)30.28 (PL 41533)9%
Lengthmm7.454.75 (PL 42122)9.48 (PL 41533)10%
Widthmm3.032.17 (PL 42122)3.42 (PL 41279)7%
Color (Red)8-bit/channel167.71131.05 (PL 42122)181.75 (PL 41279)6%
Color (Green)8-bit/channel141.04101.14 (PL 42122)156.9 (PL 41270)8%
Color (Blue)8-bit/channel114.5580.04 (PL 42122)131.81 (PL 41270)9%
Table 5. The results of AMOVA analysis.
ΦPTp
Acquisition Year0.060.001
Region0.00ns
Altitude0.00ns
Precipitation0.01ns
Temperature0.030.015
Botanical variety0.170.001
Ear type0.02ns
Grain covering0.2040.001
(ΦPT—analogous to standardized FST, for haploid data; ns—not significant).
Table 6. PANOVA table for individual stages of GPA on the data.
SourceDFSum of SquaresMean SquaresFPr > F
Residuals after scaling419125.9890.301
Scaling183.93183.931279.130<0.0001
Residuals after rotation420209.9200.500
Rotation2123.7011.1293.753<0.0001
Residuals after translation441233.6210.530
Translation70.0000.0000.0001.000
Corrected Total448233.6210.521
Publisher’s Note: MDPI stays neutral with regard to jurisdictional claims in published maps and institutional affiliations.

