Alleviation of Salt Stress by Plant Growth-Promoting Bacteria in Hydroponic Leaf Lettuce


Abstract
:1. Introduction
2. Materials and Methods
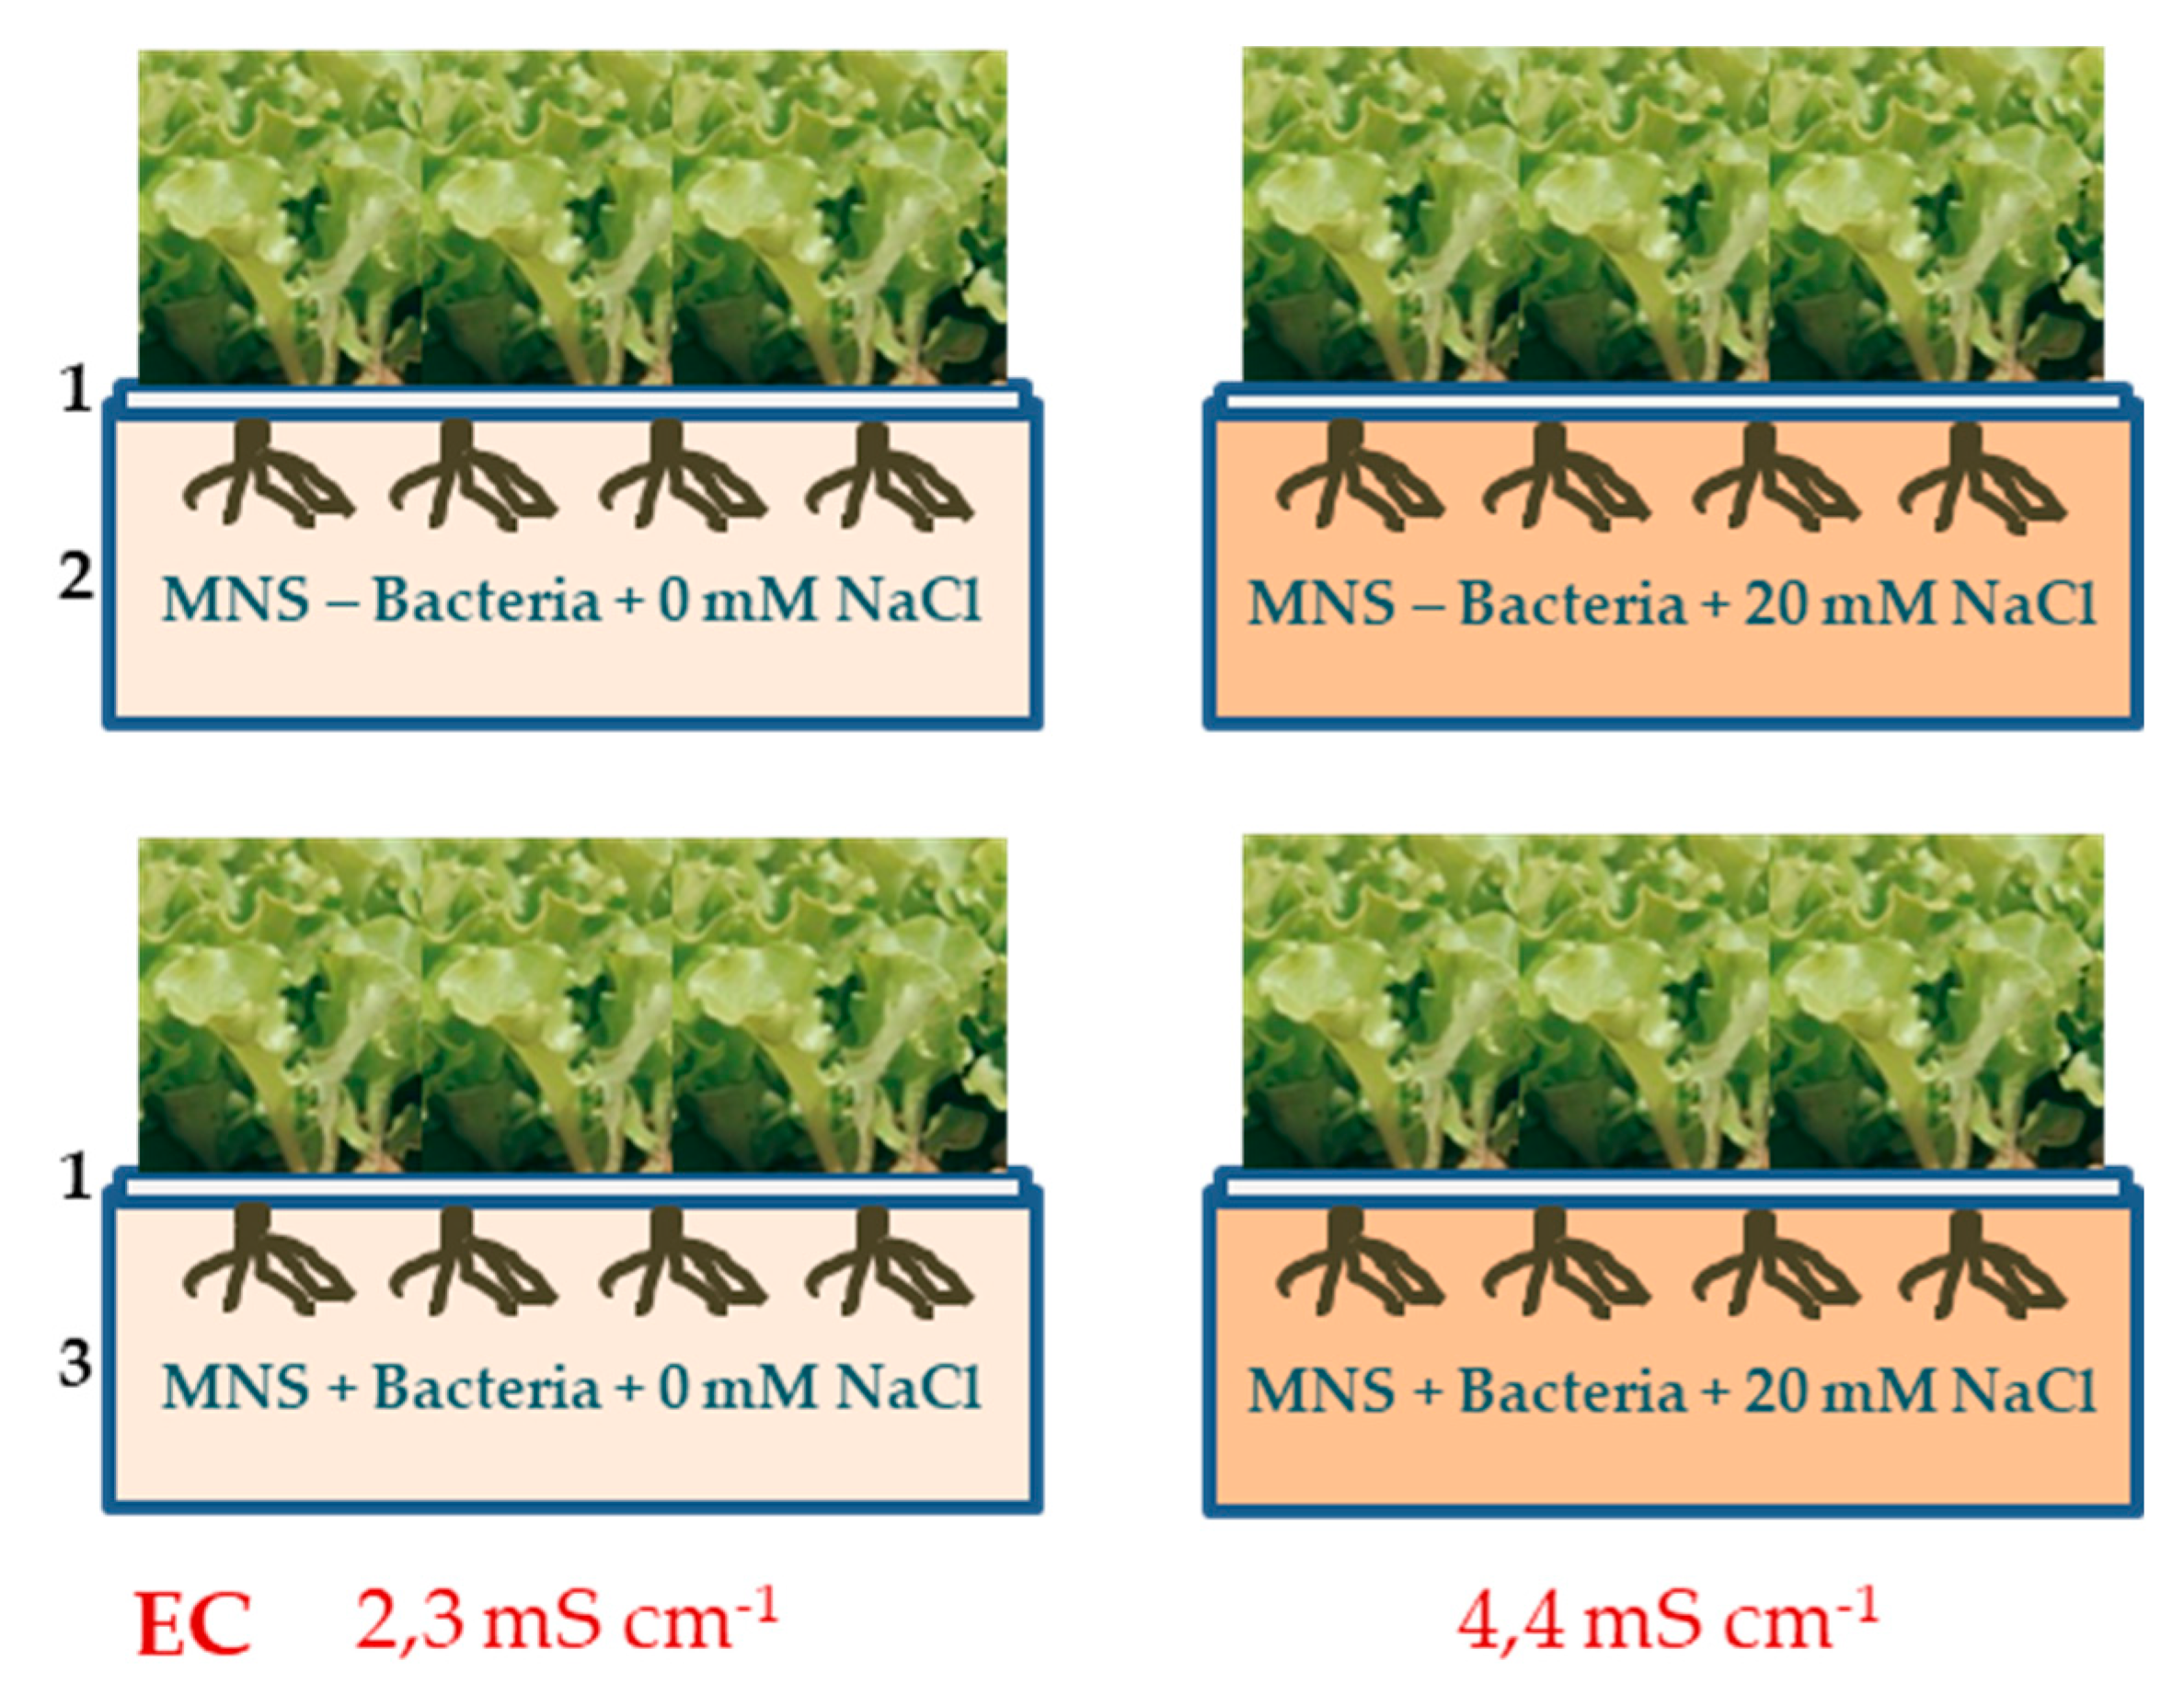
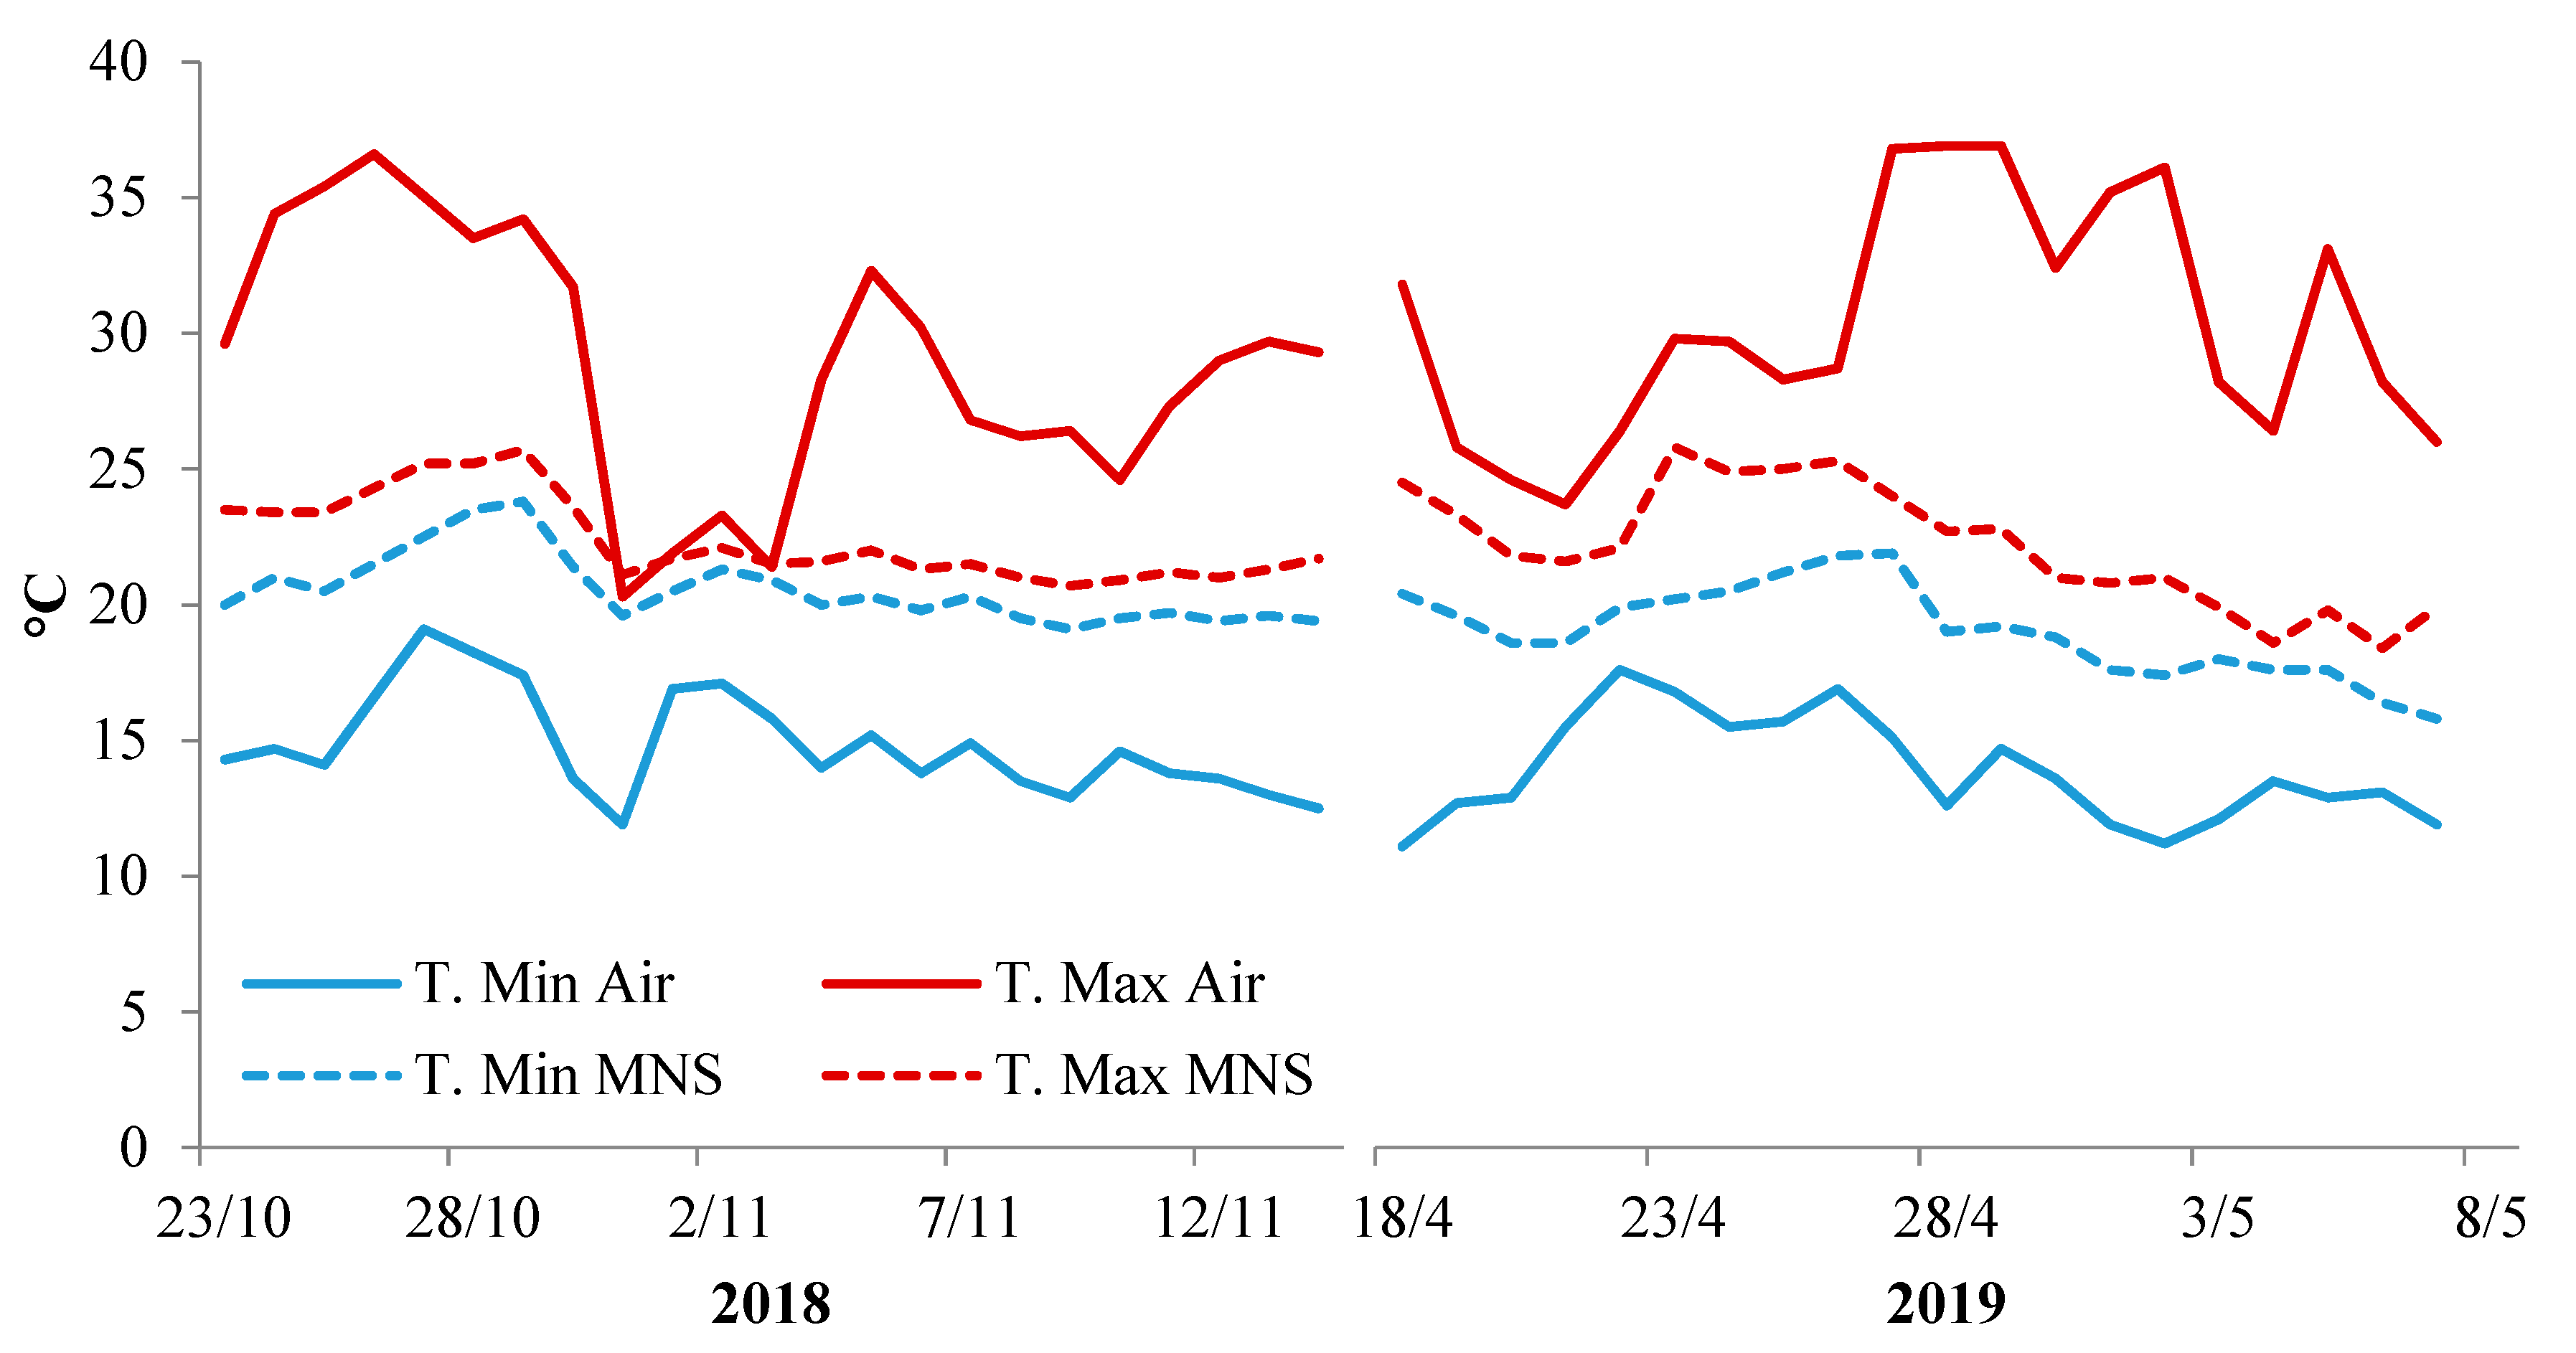
2.1. Leafy Vegetable Cultivation
2.2. Statistics and Principal Component Analysis
3. Results
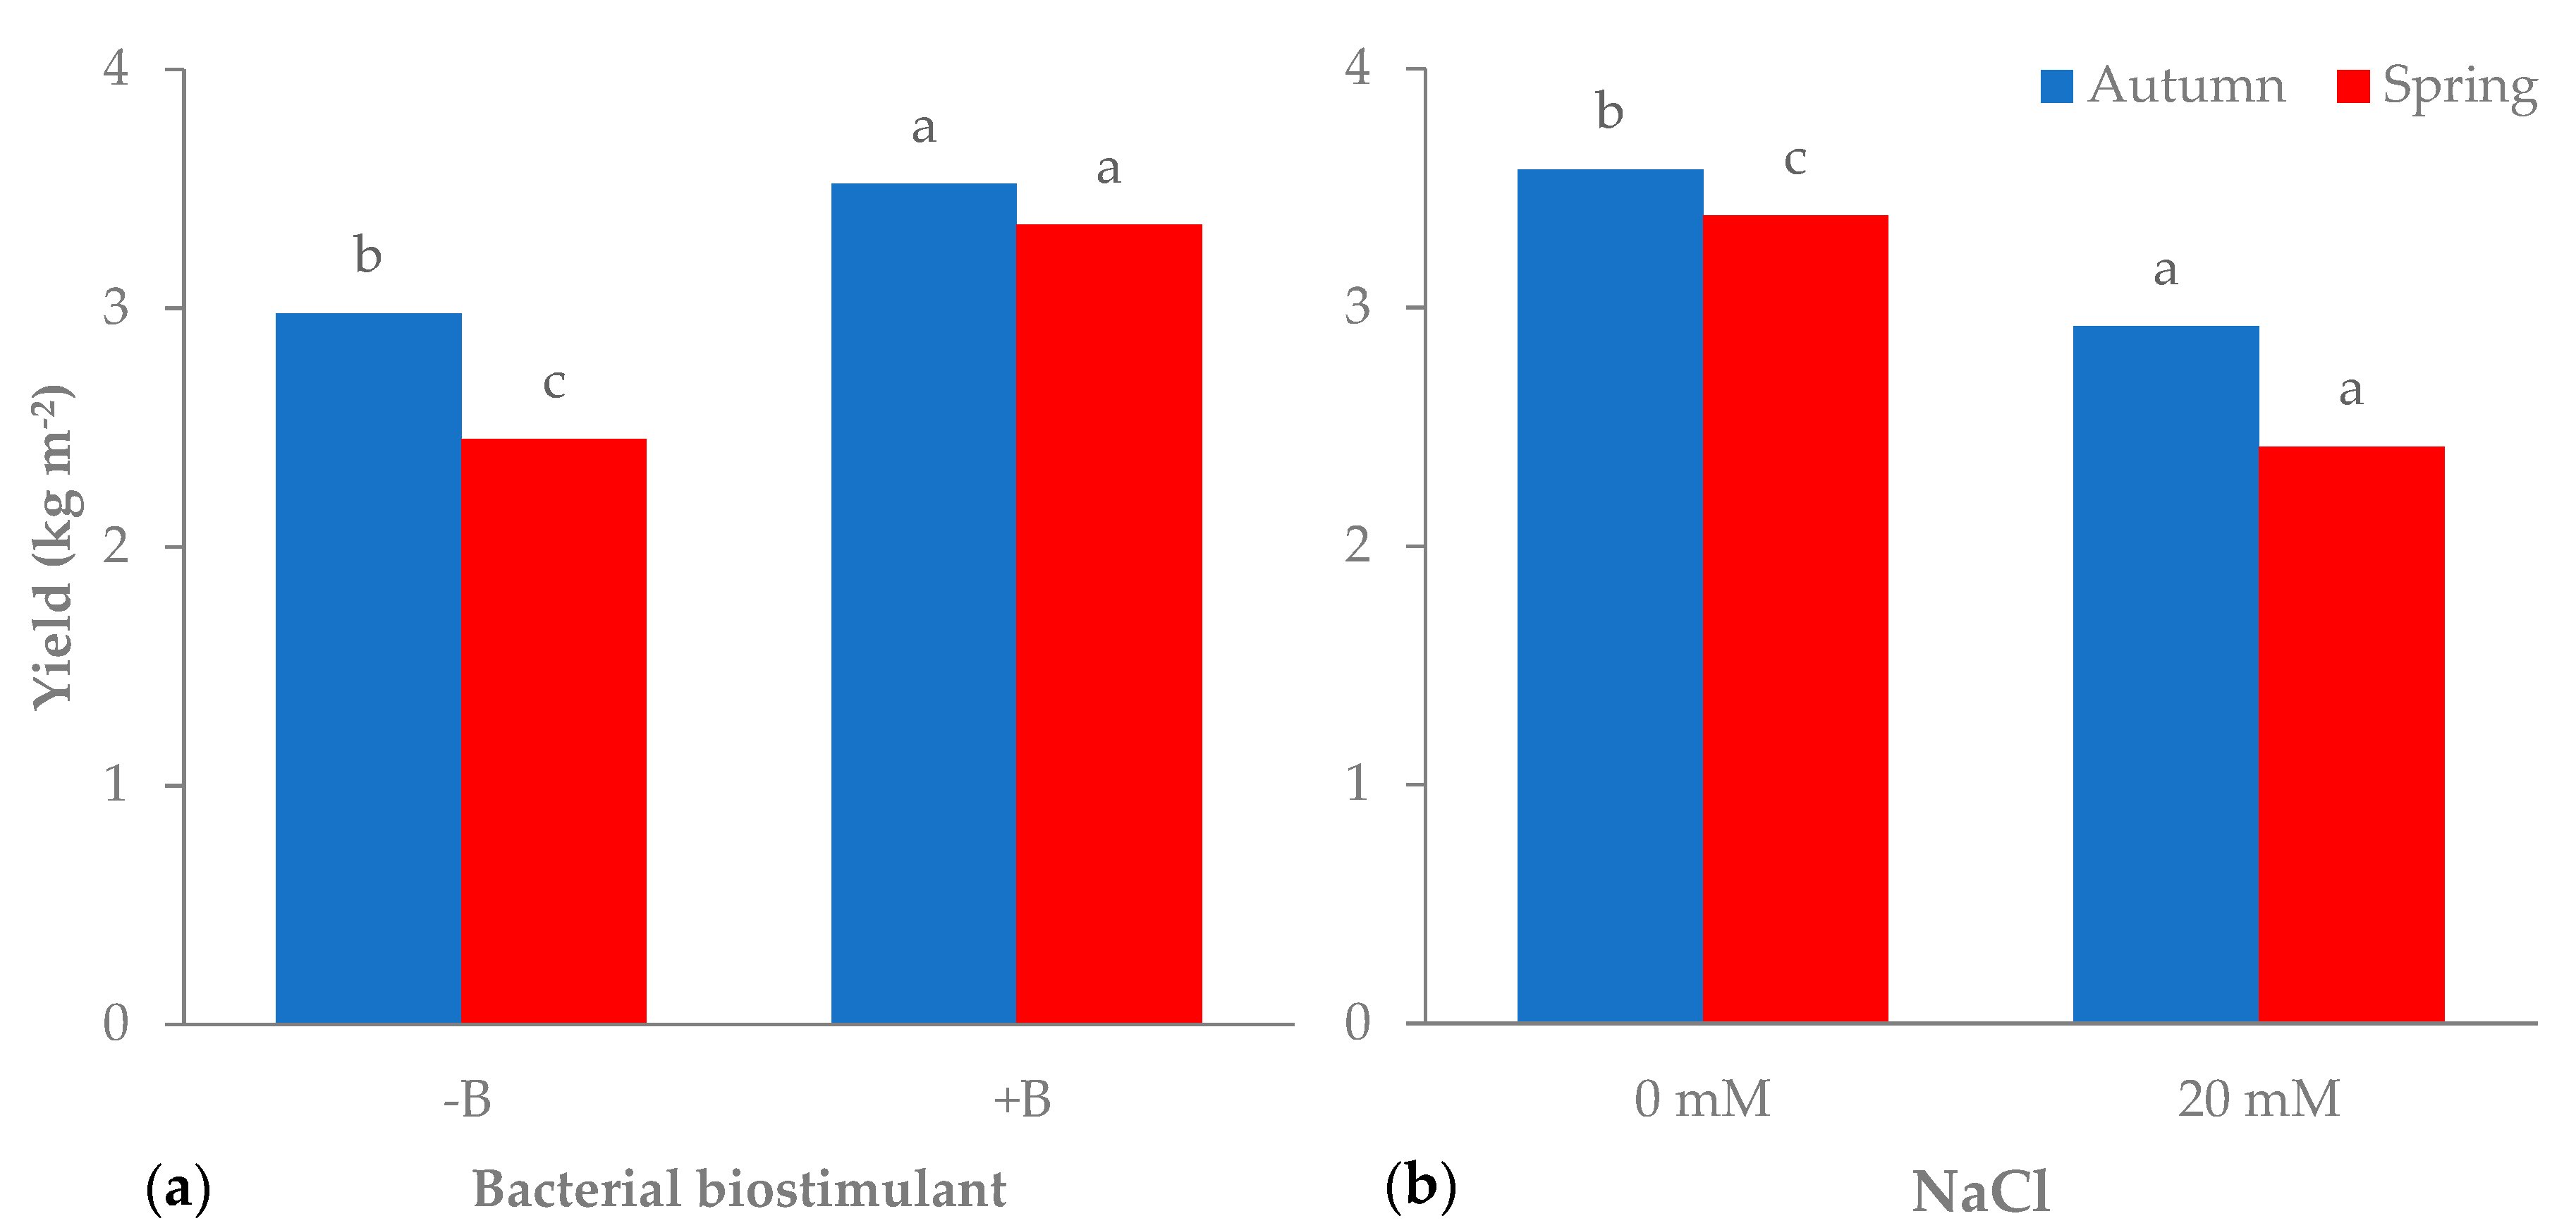
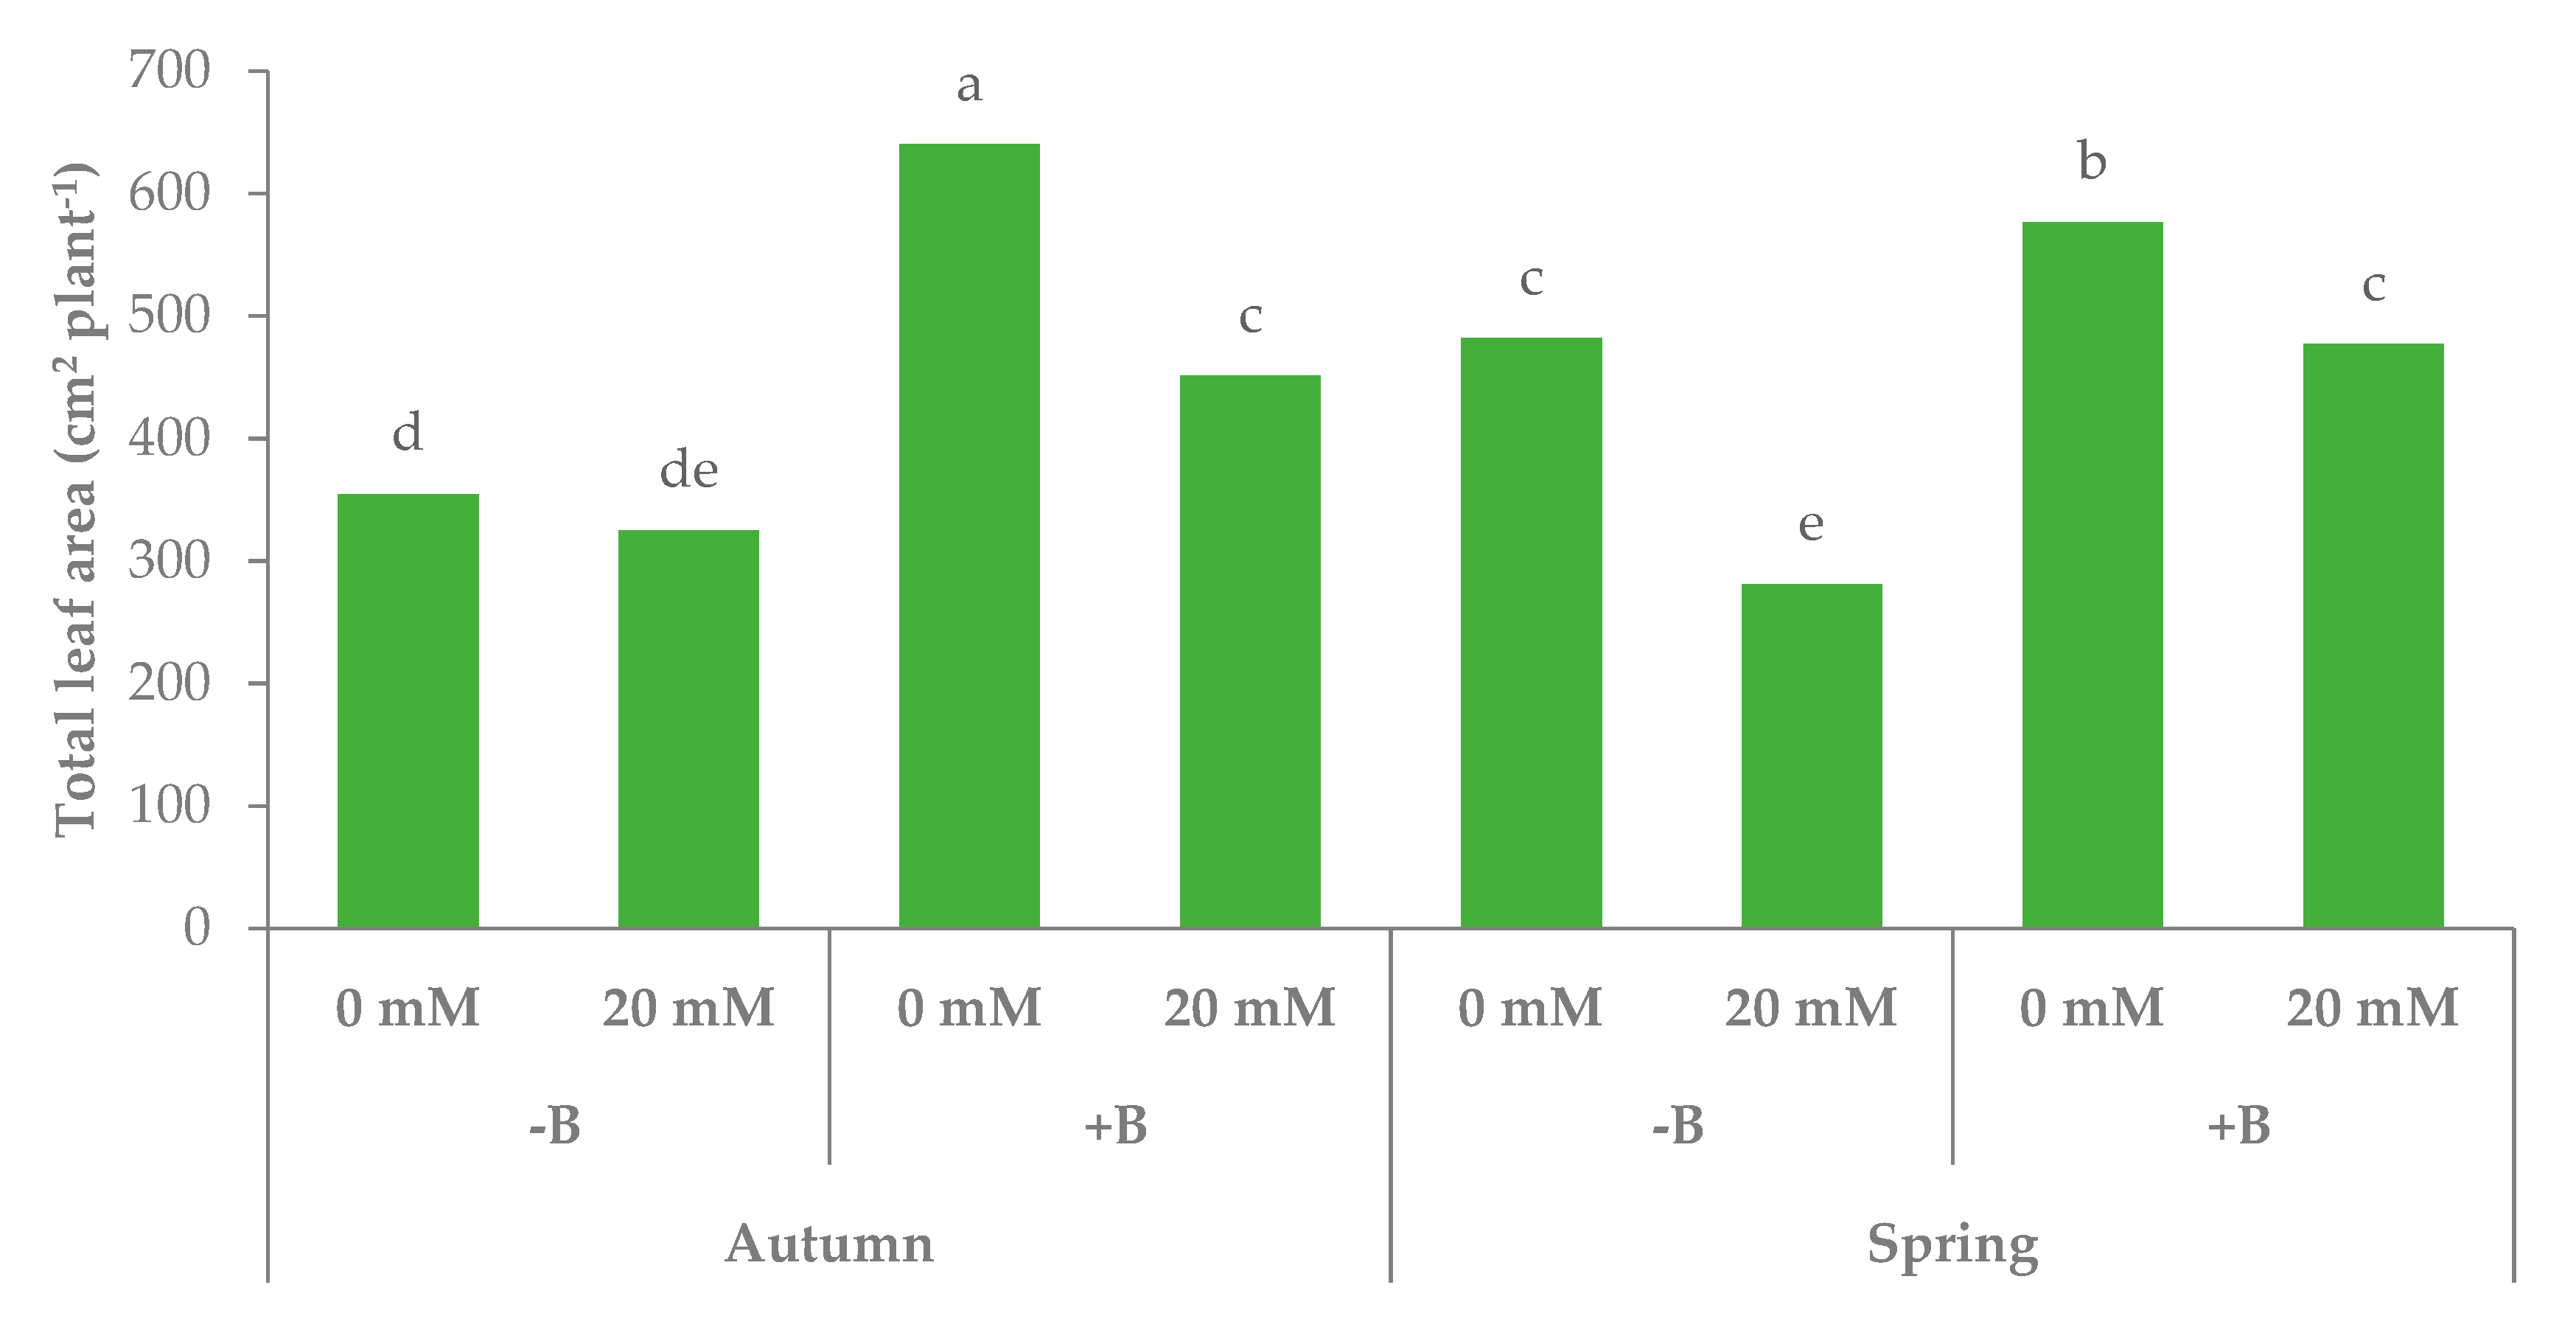
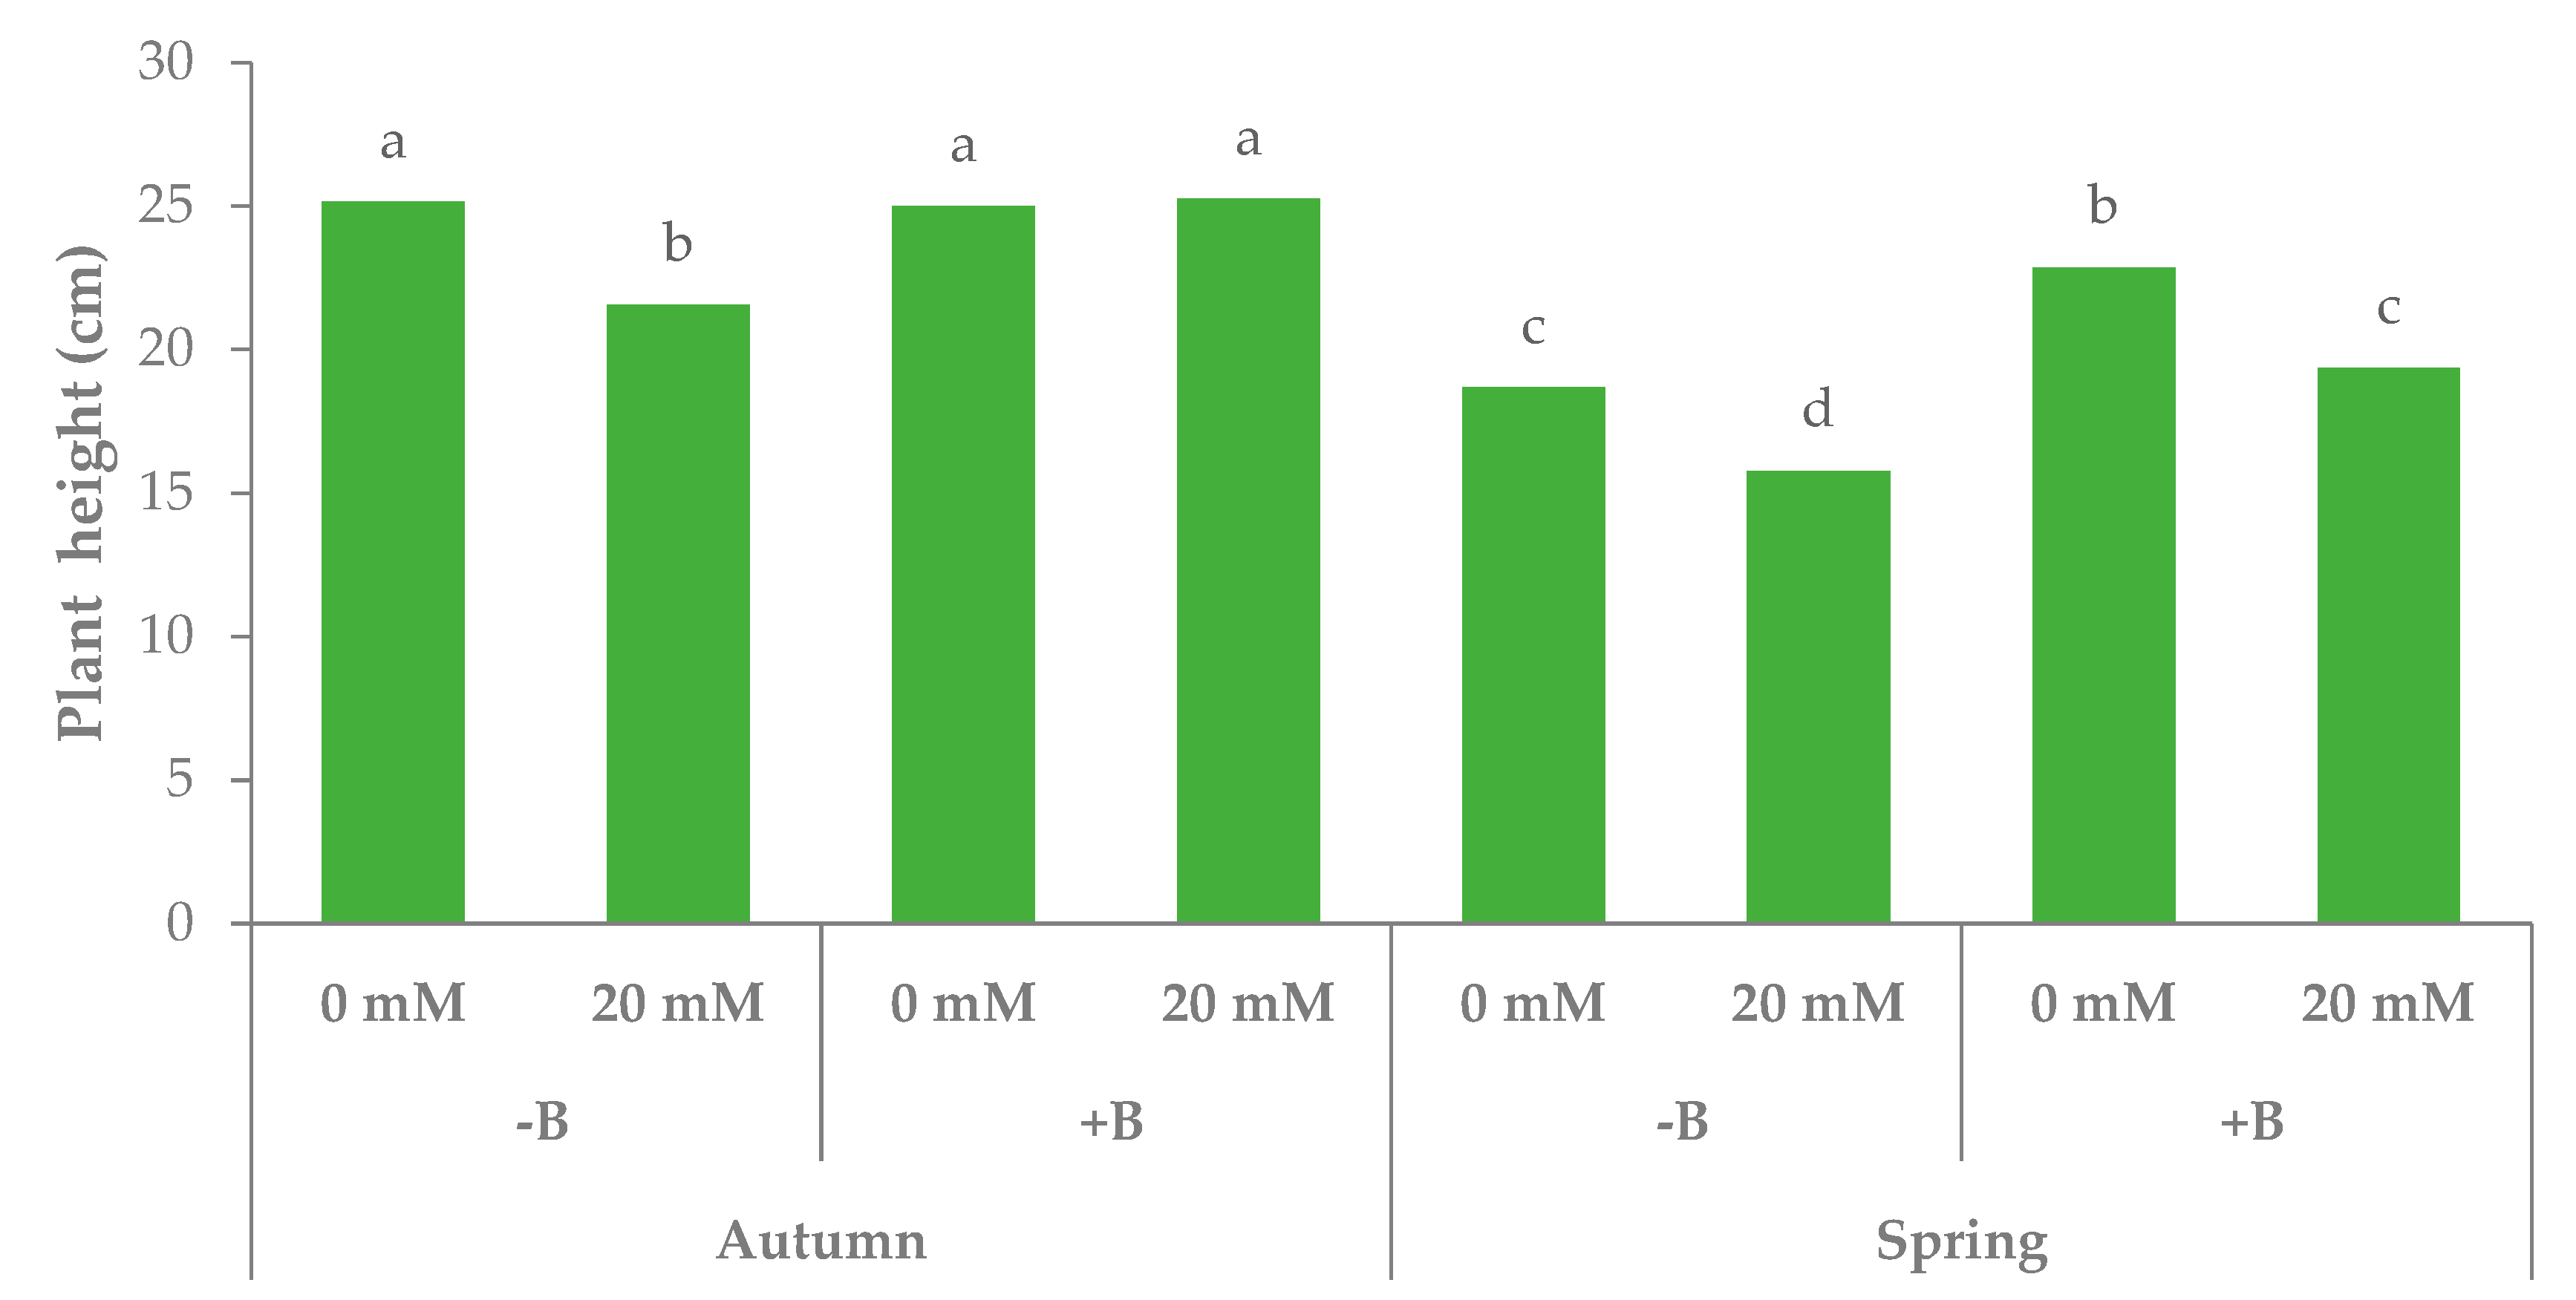
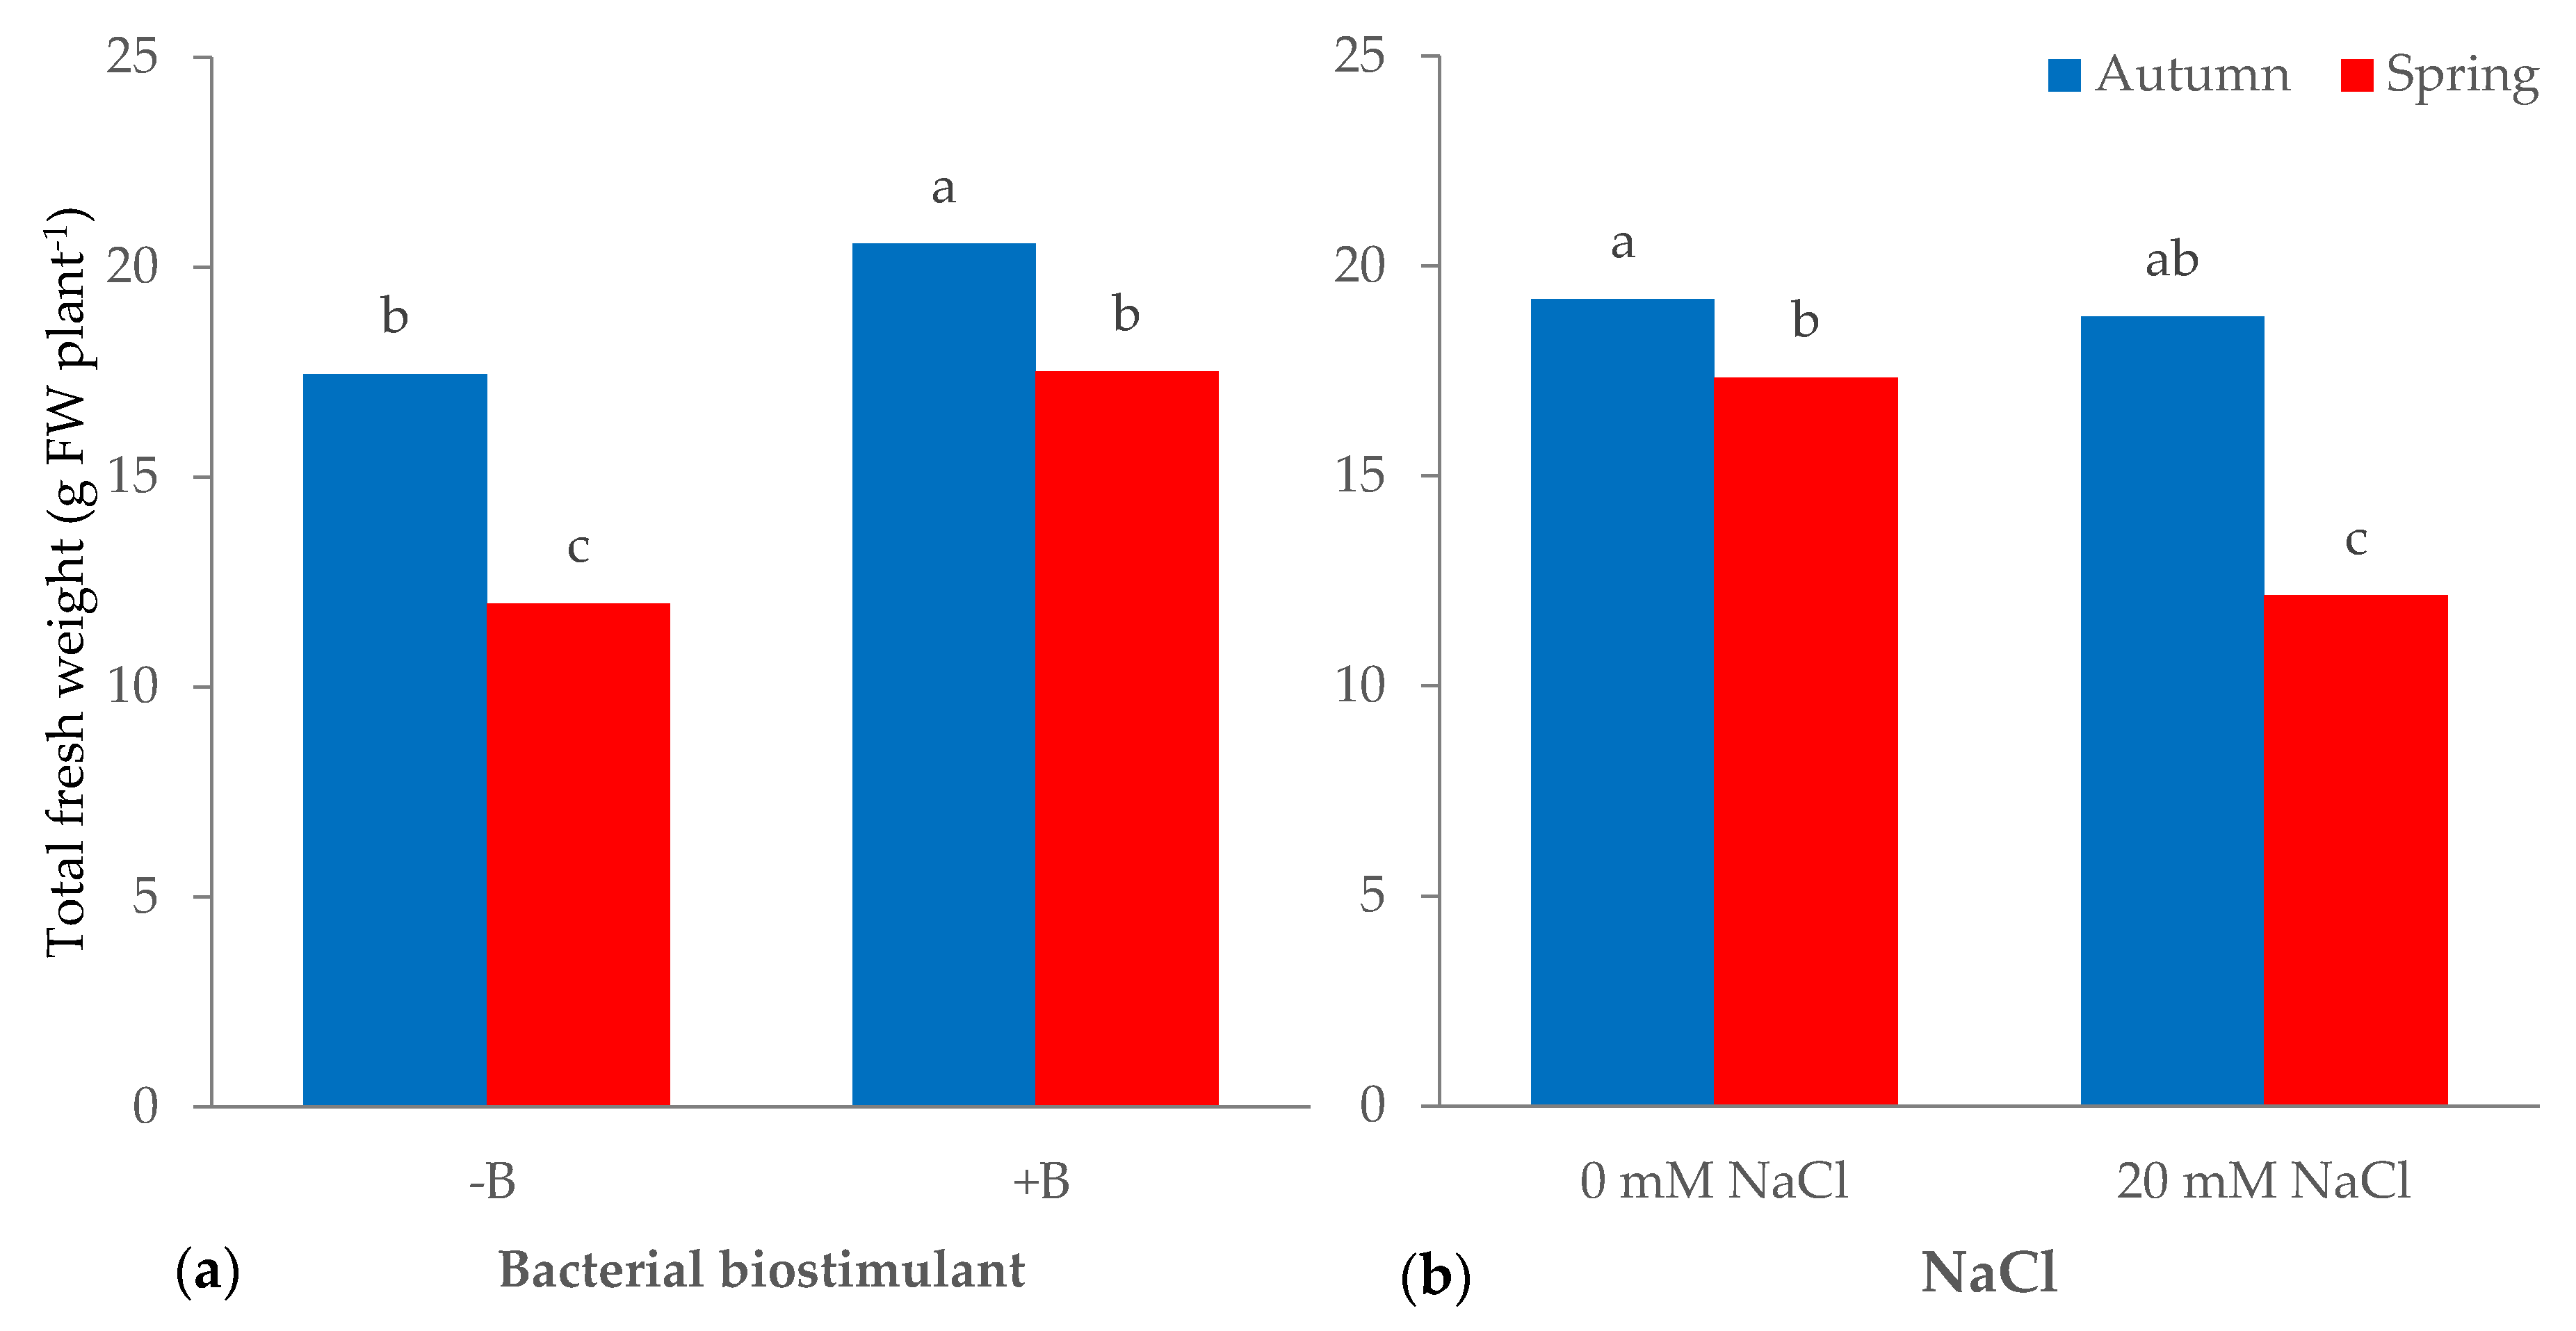
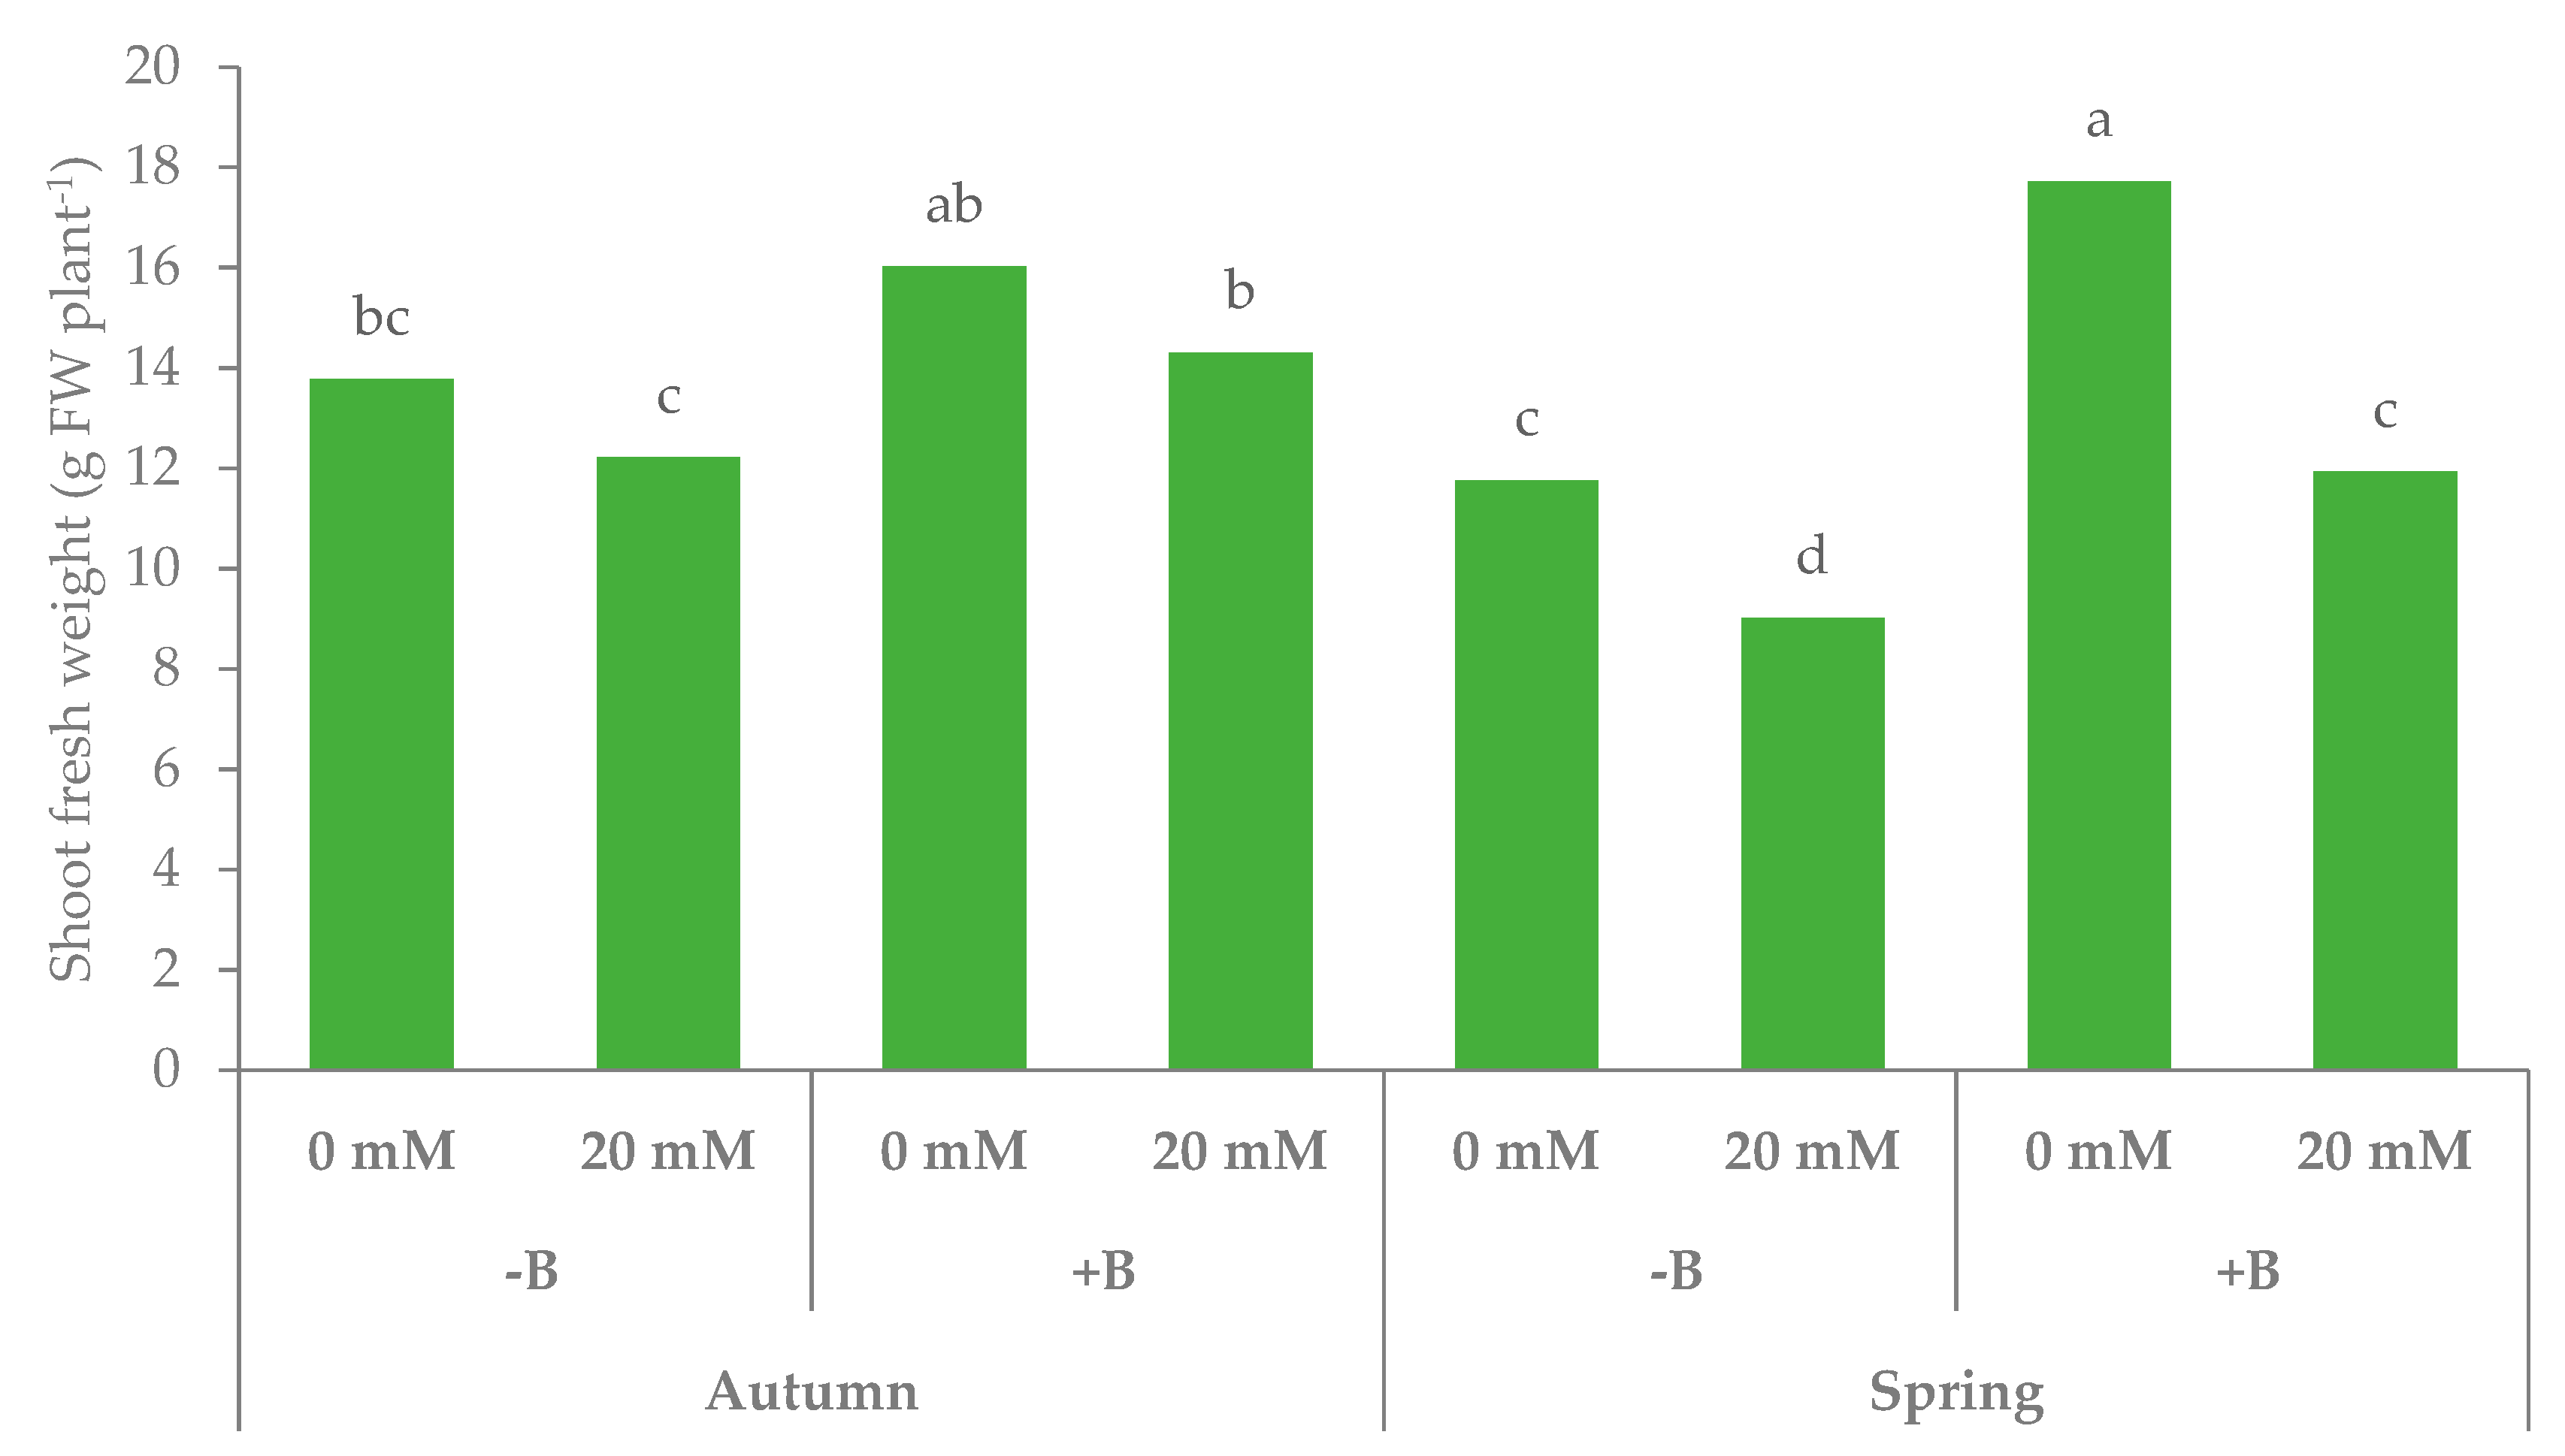
3.1. Morphophysiological Parameters and Yield of Leaf Lettuce
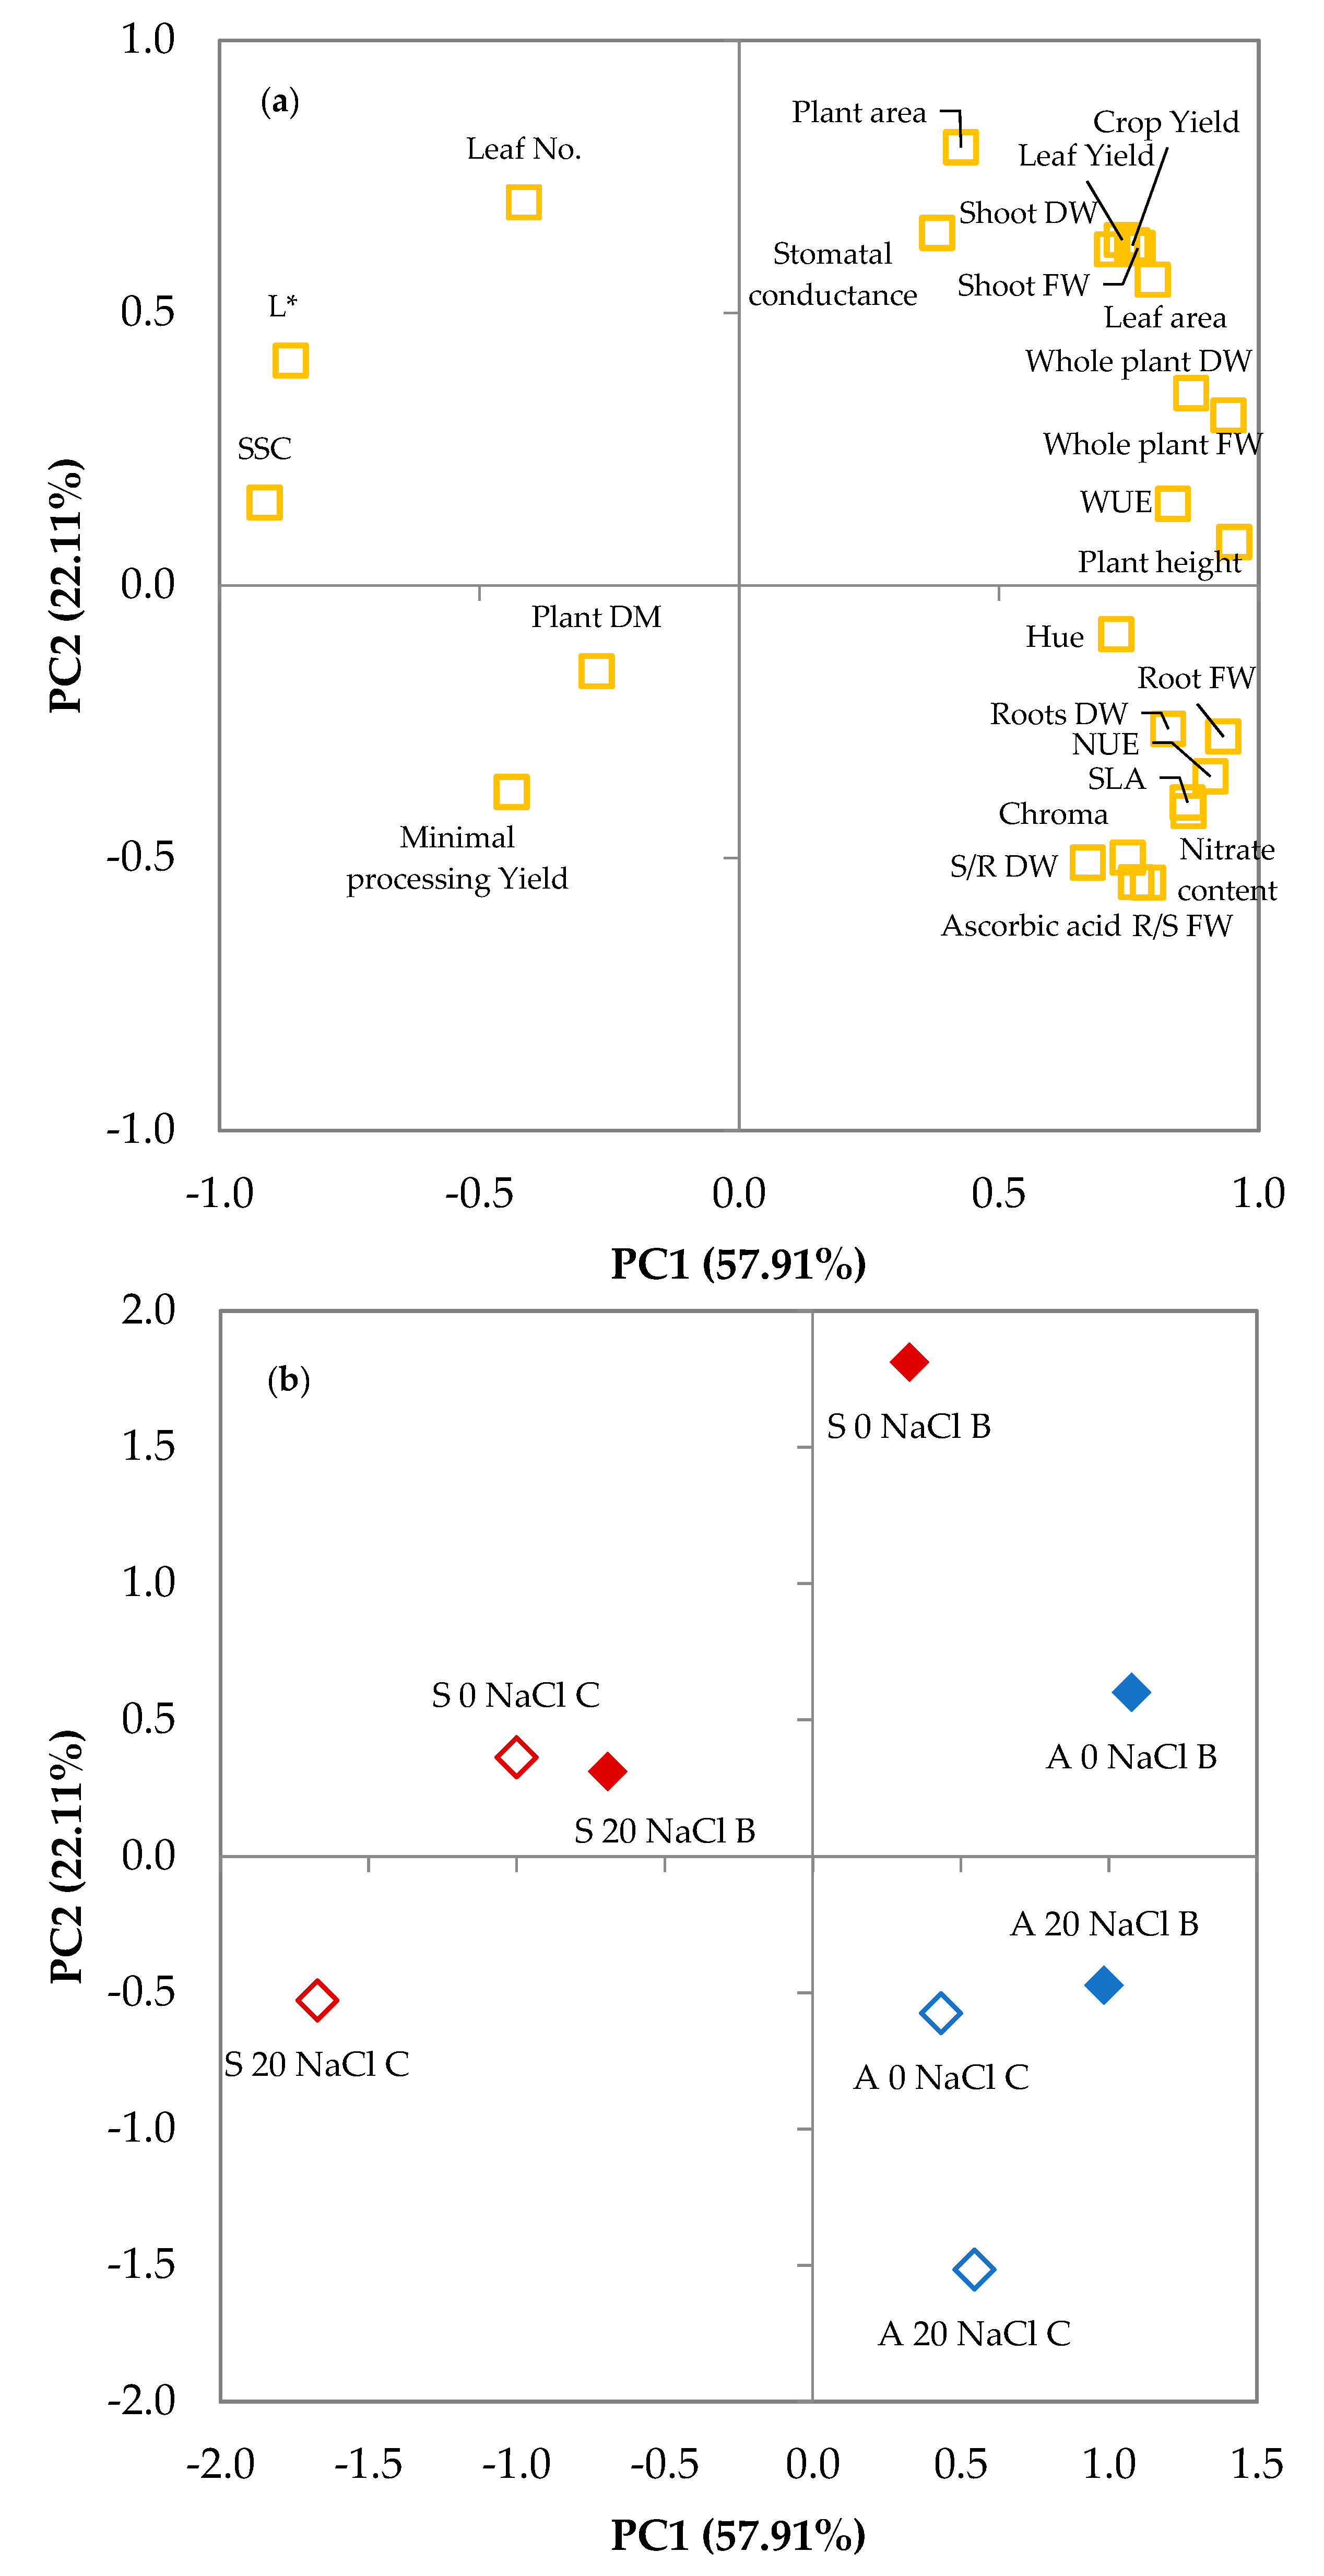
3.2. Principal Components Analysis
4. Discussion
5. Conclusions
Author Contributions
Funding
Acknowledgments
Conflicts of Interest
References
- Cassman, K.G.; Dobermann, A.; Walters, D.T.; Yang, H. Meeting Cereal Demand While Protecting Natural Resources and Improving Environmental Quality. Annu. Rev. Environ. Resour. 2003, 28, 315–358. [Google Scholar] [CrossRef] [Green Version]
- Shahbaz, M.; Ashraf, M.; Al-Qurainy, F.; Harris, P.J.C. Salt Tolerance in Selected Vegetable Crops. Crit. Rev. Plant Sci. 2012, 31, 303–320. [Google Scholar] [CrossRef]
- Shahbaz, M.; Ashraf, M. Improving Salinity Tolerance in Cereals. Crit. Rev. Plant Sci. 2013, 32, 237–249. [Google Scholar] [CrossRef]
- Yamaguchi, T.; Blumwald, E. Developing salt-tolerant crop plants: Challenges and opportunities. Trends Plant Sci. 2005, 10, 615–620. [Google Scholar] [CrossRef] [PubMed]
- Shannon, M.C.; Grieve, C.M. Tolerance of vegetable crops to salinity. Sci. Hortic. 1998, 78, 5–38. [Google Scholar] [CrossRef]
- Munns, R.; Tester, M. Mechanisms of Salinity Tolerance. Annu. Rev. Plant Biol. 2008, 59, 651–681. [Google Scholar] [CrossRef] [PubMed] [Green Version]
- Läuchli, A.; Grattan, S.R. Plant Responses to Saline and Sodic Conditions. In Agricultural Salinity Assessment and Management; American Society of Civil Engineers: Reston, VA, USA, 2011; pp. 169–205. ISBN 9780784476482. [Google Scholar]
- Zahir, Z.A.; Munir, A.; Asghar, H.N.; Shaharoona, B.; Arshad, M. Effectiveness of Rhizobacteria Containing ACC Deaminase for Growth Promotion of Peas (Pisum sativum) Under Drought Conditions. J. Microbiol. Biotechnol. 2008, 18, 958–963. [Google Scholar]
- Miceli, A.; Moncada, A.; D’Anna, F. Effect of salt stress in lettuce cultivation. Acta Hortic. 2003, 609, 371–375. [Google Scholar] [CrossRef]
- Moncada, A.; Miceli, A.; D’Anna, F. Evaluation of strawberry cultivars in soilless cultivation in sicily. Acta Hortic. 2008, 801, 1121–1127. [Google Scholar] [CrossRef]
- Settanni, L.; Miceli, A.; Francesca, N.; Cruciata, M.; Moschetti, G. Microbiological investigation of Raphanus sativus L. grown hydroponically in nutrient solutions contaminated with spoilage and pathogenic bacteria. Int. J. Food Microbiol. 2013, 160, 344–352. [Google Scholar] [CrossRef] [Green Version]
- Moncada, A.; Miceli, A.; Sabatino, L.; Iapichino, G.; D’Anna, F.; Vetrano, F. Effect of molybdenum rate on yield and quality of lettuce, escarole, and curly endive grown in a floating system. Agronomy 2018, 8, 171. [Google Scholar] [CrossRef] [Green Version]
- D’Anna, F.; Miceli, A.; Vetrano, F. First results of floating system cultivation of Eruca sativa L. Acta Hortic. 2003, 609, 361–364. [Google Scholar] [CrossRef]
- Miceli, A.; Moncada, A.; Vetrano, F.; D’Anna, F. First results on yield and quality response of Basil (Ocimum basilicum L.) grown in a floating system. Acta Hortic. 2003, 609, 377–381. [Google Scholar] [CrossRef]
- Moncada, A.; Miceli, A.; Vetrano, F. Use of plant growth-promoting rhizobacteria (PGPR) and organic fertilization for soilless cultivation of basil. Sci. Hortic. 2020, in press. [Google Scholar] [CrossRef]
- Vetrano, F.; Moncada, A.; Miceli, A. Use of Gibberellic Acid to Increase the Salt Tolerance of Leaf Lettuce and Rocket Grown in a Floating System. Agronomy 2020, 10, 505. [Google Scholar] [CrossRef] [Green Version]
- Mariani, L.; Ferrante, A. Agronomic management for enhancing plant tolerance to abiotic stresses—drought, salinity, hypoxia, and lodging. Horticulturae 2017, 3, 52. [Google Scholar] [CrossRef] [Green Version]
- Dajic, Z. Salt stress. In Physiology and Molecular Biology of Stress Tolerance in Plants; Rao, K., Raghavendra, A., Eddy, K., Eds.; Kluwer Academic Publishers: Dordrecht, The Netherlands, 2006; pp. 41–99. [Google Scholar]
- Wang, Y.; Mopper, S.; Hasenstein, K.H. Effects of salinity on endogenous ABA, IAA, JA, and SA in Iris hexagona. J. Chem. Ecol. 2001, 27, 327–342. [Google Scholar] [CrossRef]
- Egamberdieva, D. Alleviation of salt stress by plant growth regulators and IAA producing bacteria in wheat. Acta Physiol. Plant. 2009, 31, 861–864. [Google Scholar] [CrossRef]
- Tate, R.L. Phytohormones in Soils: Microbial Production and Function. Soil Sci. 1996, 161, 202. [Google Scholar] [CrossRef]
- Frankenberger, W.T., Jr.; Arshad, M. Phytohormones in Soils Microbial Production & Function; CRC Press: Boca Raton, FL, USA, 2020; ISBN 1000723607. [Google Scholar]
- Turan, M.; Yildirim, E.; Kitir, N.; Unek, C.; Nikerel, E.; Ozdemir, B.S.; Güneş, A.; Mokhtari, N.E.P. Beneficial role of plant growth-promoting bacteria in vegetable production under abiotic stress. In Microbial Strategies for Vegetable Production; Zaidi, A., Khan, M.S., Eds.; Springer International Publishing: Berlin/Heidelberg, Germany, 2017; pp. 151–166. [Google Scholar]
- Ekinci, M.; Turan, M.; Yildirim, E.; Güneş, A.; Kotan, R.; Dursun, A. Effect of plant growth promoting rhizobacteria on growth, nutrient, organic acid, amino acid and hormone content of cauliflower (Brassica oleracea L. var. botrytis) transplants. Acta Sci Pol Hortorum Cult. 2014, 13, 71–85. [Google Scholar]
- Numan, M.; Bashir, S.; Khan, Y.; Mumtaz, R.; Shinwari, Z.K.; Khan, A.L.; Khan, A.; AL-Harrasi, A. Plant growth promoting bacteria as an alternative strategy for salt tolerance in plants: A review. Microbiol. Res. 2018, 209, 21–32. [Google Scholar] [CrossRef] [PubMed]
- Shrivastava, P.; Kumar, R. Soil salinity: A serious environmental issue and plant growth promoting bacteria as one of the tools for its alleviation. Saudi J. Biol. Sci. 2015, 22, 123–131. [Google Scholar] [CrossRef] [PubMed] [Green Version]
- Sonneveld, C.; Voogt, W. Plant Nutrition of Greenhouse Crops; Springer: Dordrecht, The Netherlands, 2009; ISBN 978-90-481-2531-9. [Google Scholar]
- Miceli, A.; Moncada, A.; Sabatino, L.; Vetrano, F. Effect of Gibberellic Acid on Growth, Yield, and Quality of Leaf Lettuce and Rocket Grown in a Floating System. Agronomy 2019, 9, 382. [Google Scholar] [CrossRef] [Green Version]
- Fageria, N.K.; Baligar, V.C.; Li, Y.C. The role of nutrient efficient plants in improving crop yields in the twenty first century. J. Plant Nutr. 2008, 31, 1121–1157. [Google Scholar] [CrossRef]
- McGuire, R.G. Reporting of objective color measurements. HortScience 1992, 27, 1254–1255. [Google Scholar] [CrossRef] [Green Version]
- Rodrigo, M.C.; Ramos, C. Nitrate sap analysis as a tool to assess nitrogen nutrition in artichoke. In Proceedings of the VI International Symposium on Artichoke, Cardoon and Their Wild Relatives 730, Lorca, Spain, 28–31 March 2006; pp. 251–256. [Google Scholar]
- Miceli, A.; Miceli, C. Effect of nitrogen fertilization on the quality of swiss chard at harvest and during storage as minimally processed produce. J. Food Qual. 2014, 37, 125–134. [Google Scholar] [CrossRef]
- Caracciolo, G.; D’Anna, E.; Moncada, A.; D’Anna, F. Evaluation of the quality and antioxidant capacity of woodland strawberry biotypes in Sicily. J. Food Agric. Environ. 2013, 11, 522–525. [Google Scholar]
- Xu, C.; Mou, B. Evaluation of Lettuce Genotypes for Salinity Tolerance. HortScience 2015, 50, 1441–1446. [Google Scholar] [CrossRef] [Green Version]
- Lunin, J.; Gallatin, M.H.; Batchelder, A.R. Saline Irrigation of Several Vegetable Crops at Various Growth Stages. I. Effect on Yields 1. Agron. J. 1963, 55, 107–110. [Google Scholar] [CrossRef]
- Grieve, C.M.; Grattan, S.R.; Maas, E. V Plant salt tolerance. Agric. Salin. Assess. Manag. 2012, 2, 405–459. [Google Scholar]
- Mass, E. V Salt tolerance of plants. In CRC Handbook of Plant Science in Agriculture.; Christie, B.R., Ed.; CRC Press: Boca Raton, FL, USA, 2019; pp. 57–75. [Google Scholar]
- Chen, T.W.; Kahlen, K.; Stützel, H. Disentangling the contributions of osmotic and ionic effects of salinity on stomatal, mesophyll, biochemical and light limitations to photosynthesis. Plant Cell Environ. 2015. [Google Scholar] [CrossRef] [PubMed]
- Ben-Asher, J.; Garcia y Garcia, A.; Flitcroft, I.; Hoogenboom, G. Effect of atmospheric water vapor on photosynthesis, transpiration and canopy conductance: A case study in corn. Plant Soil Environ. 2013, 59, 549–555. [Google Scholar] [CrossRef] [Green Version]
- Zhang, D.; Zhang, Z.; Li, J.; Chang, Y.; Du, Q.; Pan, T. Regulation of Vapor Pressure Deficit by Greenhouse Micro-Fog Systems Improved Growth and Productivity of Tomato via Enhancing Photosynthesis during Summer Season. PLoS ONE 2015, 10, e0133919. [Google Scholar] [CrossRef] [PubMed]
- Miceli, A.; Gaglio, R.; Francesca, N.; Ciminata, A.; Moschetti, G.; Settanni, L. Evolution of shelf life parameters of ready-to-eat escarole (Cichorium endivia var. latifolium) subjected to different cutting operations. Sci. Hortic. 2019, 247, 175–183. [Google Scholar] [CrossRef]
- Alfonzo, A.; Gaglio, R.; Miceli, A.; Francesca, N.; Di Gerlando, R.; Moschetti, G.; Settanni, L. Shelf life evaluation of fresh-cut red chicory subjected to different minimal processes. Food Microbiol. 2018, 73. [Google Scholar] [CrossRef]
- Miceli, C.; Moncada, A.; Vetrano, F.; Iapichino, G.; D’Anna, F.; Miceli, A. Effect of Agronomic Practices on Yield and Quality of Borage at Harvest and During Storage as Minimally-Processed Produce. Agronomy 2020, 10, 242. [Google Scholar] [CrossRef] [Green Version]
- European Union. Commission Regulation (EC) No. 1258/2011 of 2 December 2011 amending Regulation (EC) No. 1881/2006 as regards maximum levels for nitrates in foodstuffs. Off. J. Eur. Union 2011, 320, 15–17. [Google Scholar]
- Lillo, C.; Appenroth, K.-J. Light Regulation of Nitrate Reductase in Higher Plants: Which Photoreceptors are Involved? Plant Biol. 2001, 3, 455–465. [Google Scholar] [CrossRef]
- Cova, A.M.W.; de Freitas, F.T.O.; Viana, P.C.; Rafael, M.R.S.; de Azevedo Neto, A.D.; Soares, T.M. Content of inorganic solutes in lettuce grown with brackish water in different hydroponic systems. Rev. Bras. Eng. Agrícola e Ambient. 2017, 21, 150–155. [Google Scholar] [CrossRef]
- Pérez-López, U.; Miranda-Apodaca, J.; Lacuesta, M.; Mena-Petite, A.; Muñoz-Rueda, A. Growth and nutritional quality improvement in two differently pigmented lettuce cultivars grown under elevated CO2 and/or salinity. Sci. Hortic. 2015, 195, 56–66. [Google Scholar] [CrossRef]
- Lee, S.K.; Kader, A.A. Preharvest and postharvest factors influencing vitamin C content of horticultural crops. Postharvest Biol. Technol. 2000, 20, 207–220. [Google Scholar] [CrossRef] [Green Version]
- Stefanelli, D.; Goodwin, I.; Jones, R. Minimal nitrogen and water use in horticulture: Effects on quality and content of selected nutrients. Food Res. Int. 2010, 43, 1833–1843. [Google Scholar] [CrossRef]
- Ruzzi, M.; Aroca, R. Plant growth-promoting rhizobacteria act as biostimulants in horticulture. Sci. Hortic. 2015, 196, 124–134. [Google Scholar] [CrossRef]
- Aini, N.; Yamika, W.S.D.; Ulum, B. Effect of nutrient concentration, PGPR and AMF on plant growth, yield, and nutrient uptake of hydroponic lettuce. Int. J. Agric. Biol. 2019, 21, 175–183. [Google Scholar]
- Balanza, V.; Martínez, J.A.; Conesa, E.; Egea-Gilabert, C.; Niñirola, D.; López-Marín, J.; González, A.; Fernández, J.A. Effect of PGPR application and nitrogen doses on baby leaf lettuce grown in a floating system. Acta Hortic. 2012, 952, 679–687. [Google Scholar] [CrossRef]
- Woitke, M.; Hanafi, A.; Schnitzler, W.H. Effect of salinity and bacillus subtilis on white fly (Trialeurodes vaporariorum, Westwood) in hydroponically grown tomatoes (Lycopersicon esculentum Mill.). Acta Hortic. 2004, 659, 323–329. [Google Scholar] [CrossRef]
- Dey, R.; Pal, K.K.; Bhatt, D.M.; Chauhan, S.M. Growth promotion and yield enhancement of peanut (Arachis hypogaea L.) by application of plant growth-promoting rhizobacteria. Microbiol. Res. 2004, 159, 371–394. [Google Scholar] [CrossRef]
- Choudhary, D.K.; Sharma, K.P.; Gaur, R.K. Biotechnological perspectives of microbes in agro-ecosystems. Biotechnol. Lett. 2011, 33, 1905–1910. [Google Scholar] [CrossRef]
- Yuan, L.; Xu, D.-Q. Stimulation effect of gibberellic acid short-term treatment on leaf photosynthesis related to the increase in Rubisco content in broad bean and soybean. Photosynth. Res. 2001, 68, 39–47. [Google Scholar] [CrossRef]
- Bhattacharyya, P.N.; Jha, D.K. Plant growth-promoting rhizobacteria (PGPR): Emergence in agriculture. World J. Microbiol. Biotechnol. 2012, 28, 1327–1350. [Google Scholar] [CrossRef]
- Ahemad, M.; Kibret, M. Mechanisms and applications of plant growth promoting rhizobacteria: Current perspective. J. King Saud Univ. Sci. 2014, 26, 1–20. [Google Scholar] [CrossRef] [Green Version]
- Kumar, A.; Prakash, A.; Johri, B.N. Bacillus as PGPR in Crop Ecosystem. In Bacteria in Agrobiology: Crop Ecosystems; Maheshwari, D., Ed.; Springer: Berlin/Heidelberg, Germany, 2011; pp. 37–59. [Google Scholar]
- Richardson, A.E.; Barea, J.-M.; McNeill, A.M.; Prigent-Combaret, C. Acquisition of phosphorus and nitrogen in the rhizosphere and plant growth promotion by microorganisms. Plant Soil 2009, 321, 305–339. [Google Scholar] [CrossRef]
- Whipps, J.M. Microbial interactions and biocontrol in the rhizosphere. J. Exp. Bot. 2001, 52, 487–511. [Google Scholar] [CrossRef] [PubMed]
- Vetrano, F.; Miceli, C.; Angileri, V.; Frangipane, B.; Moncada, A.; Miceli, A. Effect of Bacterial Inoculum and Fertigation Management on Nursery and Field Production of Lettuce Plants. Agronomy 2020, 10, 1477. [Google Scholar] [CrossRef]
- Moncada, A.; Vetrano, F.; Esposito, A.; Miceli, A. Fertigation management and growth-promoting treatments affect tomato transplant production and plant growth after transplant. Agronomy 2020, 10, 1504. [Google Scholar] [CrossRef]
- Arkhipova, T.N.; Veselov, S.U.; Melentiev, A.I.; Martynenko, E.V.; Kudoyarova, G.R. Ability of bacterium Bacillus subtilis to produce cytokinins and to influence the growth and endogenous hormone content of lettuce plants. Plant Soil 2005, 272, 201–209. [Google Scholar] [CrossRef]
- Dobbelaere, S.; Croonenborghs, A.; Thys, A.; Vande Broek, A.; Vanderleyden, J. Phytostimulatory effect of Azospirillum brasilense wild type and mutant strains altered in IAA production on wheat. Plant Soil 1999, 212, 155–164. [Google Scholar] [CrossRef]
- Radhakrishnan, R.; Lee, I.-J. Gibberellins producing Bacillus methylotrophicus KE2 supports plant growth and enhances nutritional metabolites and food values of lettuce. Plant Physiol. Biochem. 2016, 109, 181–189. [Google Scholar] [CrossRef]
- Chowdhury, S.P.; Dietel, K.; Rändler, M.; Schmid, M.; Junge, H.; Borriss, R.; Hartmann, A.; Grosch, R. Effects of Bacillus amyloliquefaciens FZB42 on lettuce growth and health under pathogen pressure and its impact on the rhizosphere bacterial community. PLoS ONE 2013, 8, e68818. [Google Scholar] [CrossRef] [Green Version]
- Kanjanamaneesathian, M.; Wiwattanapatapee, R.; Rotniam, W.; Wongpetkhiew, W. Spraying hydroponic lettuce roots with a suspension concentrate formulation of Bacillus velezensis to suppress root rot disease and promote plant growth. N. Z. Plant Prot. 2014, 67, 213–219. [Google Scholar] [CrossRef] [Green Version]
- Vurukonda, S.S.K.P.; Vardharajula, S.; Shrivastava, M.; SkZ, A. Enhancement of drought stress tolerance in crops by plant growth promoting rhizobacteria. Microbiol. Res. 2016, 184, 13–24. [Google Scholar] [CrossRef] [PubMed]
- Egamberdieva, D. Survival of Pseudomonas extremorientalis TSAU20 and P. chlororaphis TSAU13 in the rhizosphere of common bean (Phaseolus vulgaris) under saline conditions. Plant Soil Environ. 2011, 57, 122–127. [Google Scholar] [CrossRef] [Green Version]
- Shivakumar, S.; Bhaktavatchalu, S. Role of Plant Growth-Promoting Rhizobacteria (PGPR) in the Improvement of Vegetable Crop Production Under Stress Conditions. In Microbial Strategies for Vegetable Production; Zaidi, A., Khan, M.S., Eds.; Springer International Publishing: Cham, Switzerland, 2017; pp. 81–97. ISBN 978-3-319-54401-4. [Google Scholar]
- Munns, R.; James, R.A.; Läuchli, A. Approaches to increasing the salt tolerance of wheat and other cereals. J. Exp. Bot. 2006, 57, 1025–1043. [Google Scholar] [CrossRef] [PubMed] [Green Version]
- Kaushal, M.; Wani, S.P. Plant-growth-promoting rhizobacteria: Drought stress alleviators to ameliorate crop production in drylands. Ann. Microbiol. 2016, 66, 35–42. [Google Scholar] [CrossRef]
- Jyothsna, P.; Murthy, S.D.S. A review on effect of senescence in plants and the role of phytohormones in delaying senescence. Int. J. Plant Anim. Environ. Sci. 2016, 6, 152–161. [Google Scholar]
- Paul, D.; Lade, H. Plant-growth-promoting rhizobacteria to improve crop growth in saline soils: A review. Agron. Sustain. Dev. 2014, 34, 737–752. [Google Scholar] [CrossRef]
- Vanderlinde, E.M.; Harrison, J.J.; Muszyński, A.; Carlson, R.W.; Turner, R.J.; Yost, C.K. Identification of a novel ABC transporter required for desiccation tolerance, and biofilm formation in Rhizobium leguminosarum bv. viciae 3841. FEMS Microbiol. Ecol. 2010. [Google Scholar] [CrossRef] [Green Version]
- Yang, J.; Kloepper, J.W.; Ryu, C.-M. Rhizosphere bacteria help plants tolerate abiotic stress. Trends Plant Sci. 2009, 14, 1–4. [Google Scholar] [CrossRef]
- Downton, W.J.S.; Grant, W.J.R.; Robinson, S.P. Photosynthetic and stomatal responses of spinach leaves to salt stress. Plant Physiol. 1985, 78, 85–88. [Google Scholar] [CrossRef]
- Pierik, R.; Tholen, D.; Poorter, H.; Visser, E.J.W.; Voesenek, L.A.C.J. The Janus face of ethylene: Growth inhibition and stimulation. Trends Plant Sci. 2006, 11, 176–183. [Google Scholar] [CrossRef]
- Zafar-ul-Hye, M.; Danish, S.; Abbas, M.; Ahmad, M.; Munir, T.M. ACC deaminase producing PGPR Bacillus amyloliquefaciens and Agrobacterium fabrum along with biochar improve wheat productivity under drought stress. Agronomy 2019, 9, 343. [Google Scholar] [CrossRef] [Green Version]
- Saleem, A.R.; Brunetti, C.; Khalid, A.; Della Rocca, G.; Raio, A.; Emiliani, G.; De Carlo, A.; Mahmood, T.; Centritto, M. Drought response of Mucuna pruriens (L.) DC. inoculated with ACC deaminase and IAA producing rhizobacteria. PLoS ONE 2018, 13, e0191218. [Google Scholar] [CrossRef] [PubMed]
- Glick, B.R. Bacteria with ACC deaminase can promote plant growth and help to feed the world. Microbiol. Res. 2014, 169, 30–39. [Google Scholar] [CrossRef] [PubMed]
- Bharti, N.; Barnawal, D. Chapter Five—Amelioration of Salinity Stress by PGPR: ACC Deaminase and ROS Scavenging Enzymes Activity. In PGPR Amelioration in Sustainable Agriculture; Singh, P.K., Kumar, A., Singh, A.K., Eds.; Woodhead Publishing: Sawston, UK, 2019; pp. 85–106. ISBN 978-0-12-815879-1. [Google Scholar]
- Miceli, A.; Moncada, A.; D’Anna, F. Effect of water salinity on seeds-germination of Ocimum basilicum L., Eruca sativa L. and Petroselinum hortense Hoffm. Acta Hortic. 2003, 609, 365–370. [Google Scholar] [CrossRef]
- D’Anna, F.; Incalcaterra, G.; Moncada, A.; Miceli, A. Effects of different electrical conductivity levels on strawberry grown in soilless culture. Acta Hortic. 2003, 609, 355–360. [Google Scholar] [CrossRef]
- Arora, N.K.; Tewari, S.; Singh, S.; Lal, N.; Maheshwari, D.K. PGPR for Protection of Plant Health Under Saline Conditions. In Bacteria in Agrobiology: Stress Management; Maheshwari, D.K., Ed.; Springer: Berlin/Heidelberg, Germany, 2012; pp. 239–258. ISBN 978-3-642-23465-1. [Google Scholar]


| Source of Variance | Plant Height (cm) | Fresh Weight (g plant−1) | Dry Weight (g plant−1) | Dry Matter (%) | |||||||
|---|---|---|---|---|---|---|---|---|---|---|---|
| Total | Shoot (S) | Root (R) | R/S | Total | Shoot (S) | Root (R) | R/S | ||||
| Season | |||||||||||
| Autumn | z 24.2 | 19.0 | 14.1 | 4.9 | 0.35 | 1.20 | 0.93 | 0.27 | 0.29 | 6.6 | |
| Spring | 19.2 | 14.7 | 12.6 | 2.1 | 0.17 | 0.99 | 0.86 | 0.13 | 0.15 | 6.8 | |
| PGPR | |||||||||||
| −B | 20.3 | 14.7 | 11.7 | 3.0 | 0.25 | 0.94 | 0.77 | 0.16 | 0.21 | 6.7 | |
| +B | 23.1 | 19.0 | 15.0 | 4.0 | 0.27 | 1.26 | 1.02 | 0.24 | 0.24 | 6.8 | |
| NaCl (mM) | |||||||||||
| 0 | 22.9 | 18.3 | 14.8 | 3.5 | 0.23 | 1.14 | 0.96 | 0.18 | 0.19 | 6.4 | |
| 20 | 20.5 | 15.5 | 11.9 | 3.6 | 0.29 | 1.05 | 0.83 | 0.23 | 0.26 | 7.0 | |
| Season × PGPR | |||||||||||
| Autumn | −B | 23.3 | 17.5b | 13.0 | 4.5 | 0.35 | 1.06 | 0.84b | 0.22 | 0.26 | 6.5 |
| +B | 25.1 | 20.6a | 15.2 | 5.4 | 0.36 | 1.35 | 1.02a | 0.33 | 0.32 | 6.7 | |
| Spring | −B | 17.2 | 12.0c | 10.4 | 1.6 | 0.15 | 0.81 | 0.70c | 0.10 | 0.15 | 6.9 |
| +B | 21.1 | 17.5b | 14.8 | 2.7 | 0.18 | 1.17 | 1.01a | 0.16 | 0.16 | 6.8 | |
| Season × NaCl | |||||||||||
| Autumn | 0 | 25.1 | 19.2a | 14.9 | 4.3b | 0.29b | 1.17ab | 0.96a | 0.21b | 0.22b | 6.4 |
| 20 | 23.4 | 18.8ab | 13.3 | 5.5a | 0.42a | 1.24a | 0.90a | 0.34a | 0.37a | 6.8 | |
| Spring | 0 | 20.8 | 17.3b | 14.7 | 2.6c | 0.18c | 1.11b | 0.96a | 0.15bc | 0.16b | 6.5 |
| 20 | 17.6 | 12.2c | 10.5 | 1.7d | 0.16c | 0.87c | 0.75b | 0.11c | 0.15b | 7.2 | |
| PGPR × NaCl | |||||||||||
| −B | 0 | 21.9 | 15.7 | 12.8 | 2.9 | 0.22 | 0.92c | 0.78c | 0.14 | 0.18 | 6.1b |
| 20 | 18.7 | 13.7 | 10.6 | 3.1 | 0.27 | 0.95c | 0.77c | 0.18 | 0.23 | 7.3a | |
| +B | 0 | 23.9 | 20.9 | 16.9 | 4.0 | 0.24 | 1.36a | 1.14a | 0.22 | 0.19 | 6.8a |
| 20 | 22.3 | 17.2 | 13.1 | 4.1 | 0.30 | 1.15b | 0.89b | 0.27 | 0.29 | 6.8a | |
| Significance x | |||||||||||
| Season | *** | *** | *** | *** | *** | *** | * | *** | *** | ns | |
| PGPR | *** | *** | *** | *** | ns | *** | *** | *** | ns | ns | |
| NaCl | *** | *** | *** | ns | *** | * | *** | * | ** | *** | |
| Season × PGPR | ** | ** | ** | ns | ns | ns | * | ns | ns | ns | |
| Season × NaCl | * | *** | *** | *** | *** | *** | * | *** | *** | ns | |
| PGPR × NaCl | * | ns | * | ns | ns | ** | *** | ns | ns | *** | |
| Season × PGPR × NaCl | ** | ns | * | ns | ns | ns | ns | ns | ns | ns | |
| Source of Variance | Crop Yield (kg m2) | Minimal Processing Yield (%) | Leaf Yield (kg m2) | WUE (g DW L−1 H2O) | NUE (g DW g−1 N) | |
|---|---|---|---|---|---|---|
| Season | ||||||
| Autumn | z 3.2 | 89.5 | 2.9 | 3.2 | 23.2 | |
| Spring | 2.9 | 90.6 | 2.6 | 2.6 | 11.1 | |
| PGPR | ||||||
| −B | 2.7 | 90.7 | 2.4 | 2.6 | 15.4 | |
| +B | 3.4 | 89.4 | 3.0 | 3.2 | 18.8 | |
| NaCl (mM) | ||||||
| 0 | 3.5 | 89.0b | 3.0 | 2.9 | 16.6 | |
| 20 | 2.7 | 91.0a | 2.4 | 2.8 | 17.7 | |
| Season × PGPR | ||||||
| Autumn | −B | 3.0b | 90.6 | 2.7b | 3.0b | 21.6 |
| +B | 3.5a | 88.3 | 3.0a | 3.4a | 24.7 | |
| Spring | −B | 2.5c | 90.9 | 2.2c | 2.2c | 9.3 |
| +B | 3.3a | 90.4 | 3.0a | 3.0b | 12.9 | |
| Season × NaCl | ||||||
| Autumn | 0 | 3.6a | 87.7 | 3.0a | 3.1a | 21.4b |
| 20 | 2.9b | 91.2 | 2.7b | 3.3a | 24.9a | |
| Spring | 0 | 3.4a | 90.4 | 3.0a | 2.7b | 11.8c |
| 20 | 2.4c | 90.9 | 2.2c | 2.4c | 10.4c | |
| PGPR × NaCl | ||||||
| −B | 0 | 3.1 | 89.6 | 2.7 | 2.3c | 13.6c |
| 20 | 2.4 | 91.9 | 2.2 | 2.8b | 17.3b | |
| +B | 0 | 3.9 | 88.5 | 3.4 | 3.5a | 19.6a |
| 20 | 3.0 | 90.2 | 2.7 | 2.8b | 18.0ab | |
| Significance x | ||||||
| Season | *** | ns | ** | *** | *** | |
| PGPR | *** | ns | *** | *** | *** | |
| NaCl | *** | * | *** | ns | ns | |
| Season × PGPR | * | ns | ** | *** | ns | |
| Season × NaCl | * | ns | *** | *** | *** | |
| PGPR × NaCl | ns | ns | ns | *** | *** | |
| Season × PGPR × NaCl | ns | ns | ns | ns | ns | |
| Source of Variance | Number of Leaves | Leaf Area (cm2 plant−1) | Leaf Area (cm2 leaf−1) | SLA (cm2 g DW−1) | Stomatal Conductance (mmol m2 s−1) | |
|---|---|---|---|---|---|---|
| Season | ||||||
| Autumn | z 8.8 | 442.6 | 49.1a | 904.7a | 617.3 | |
| Spring | 10.5 | 454.1 | 42.9b | 662.8b | 646.5 | |
| PGPR | ||||||
| −B | 9.2 | 360.6 | 40.9b | 774.9 | 550.8 | |
| +B | 10.1 | 536.1 | 51.1a | 792.5 | 713.0 | |
| NaCl (mM) | ||||||
| 0 | 10.0a | 513.2 | 51.0a | 798.4 | 648.9 | |
| 20 | 9.3b | 383.5 | 41.0b | 769.1 | 614.9 | |
| Season × PGPR | ||||||
| Autumn | −B | 7.6c | 339.7 | 44.4 | 917.0 | 579.7bc |
| +B | 10.0b | 545.5 | 53.8 | 892.3 | 654.8b | |
| Spring | −B | 10.8a | 381.5 | 37.5 | 632.9 | 521.9c |
| +B | 10.1ab | 526.7 | 48.3 | 692.8 | 771.1a | |
| Season × NaCl | ||||||
| Autumn | 0 | 9.2 | 497.3 | 52.8a | 926.8 | 615.4 |
| 20 | 8.5 | 387.9 | 45.4b | 882.5 | 619.1 | |
| Spring | 0 | 10.8 | 529.1 | 49.2a | 670.0 | 682.4 |
| 20 | 10.1 | 379.1 | 36.6c | 655.6 | 610.7 | |
| PGPR × NaCl | ||||||
| −B | 0 | 9.5 | 418.2 | 45.2 | 791.1 | 591.7b |
| 20 | 9.0 | 303.0 | 36.6 | 758.8 | 509.9c | |
| +B | 0 | 10.5 | 608.2 | 56.8 | 805.7 | 706.0a |
| 20 | 9.7 | 464.0 | 45.3 | 779.4 | 719.9a | |
| Significance x | ||||||
| Season | *** | ns | ** | *** | ns | |
| PGPR | *** | *** | *** | ns | *** | |
| NaCl | *** | *** | *** | ns | ns | |
| Season × PGPR | *** | ns | ns | ns | *** | |
| Season × NaCl | ns | ns | ns | ns | ns | |
| PGPR × NaCl | ns | ns | ns | ns | * | |
| Season × PGPR × NaCl | ns | *** | ns | ns | ns | |
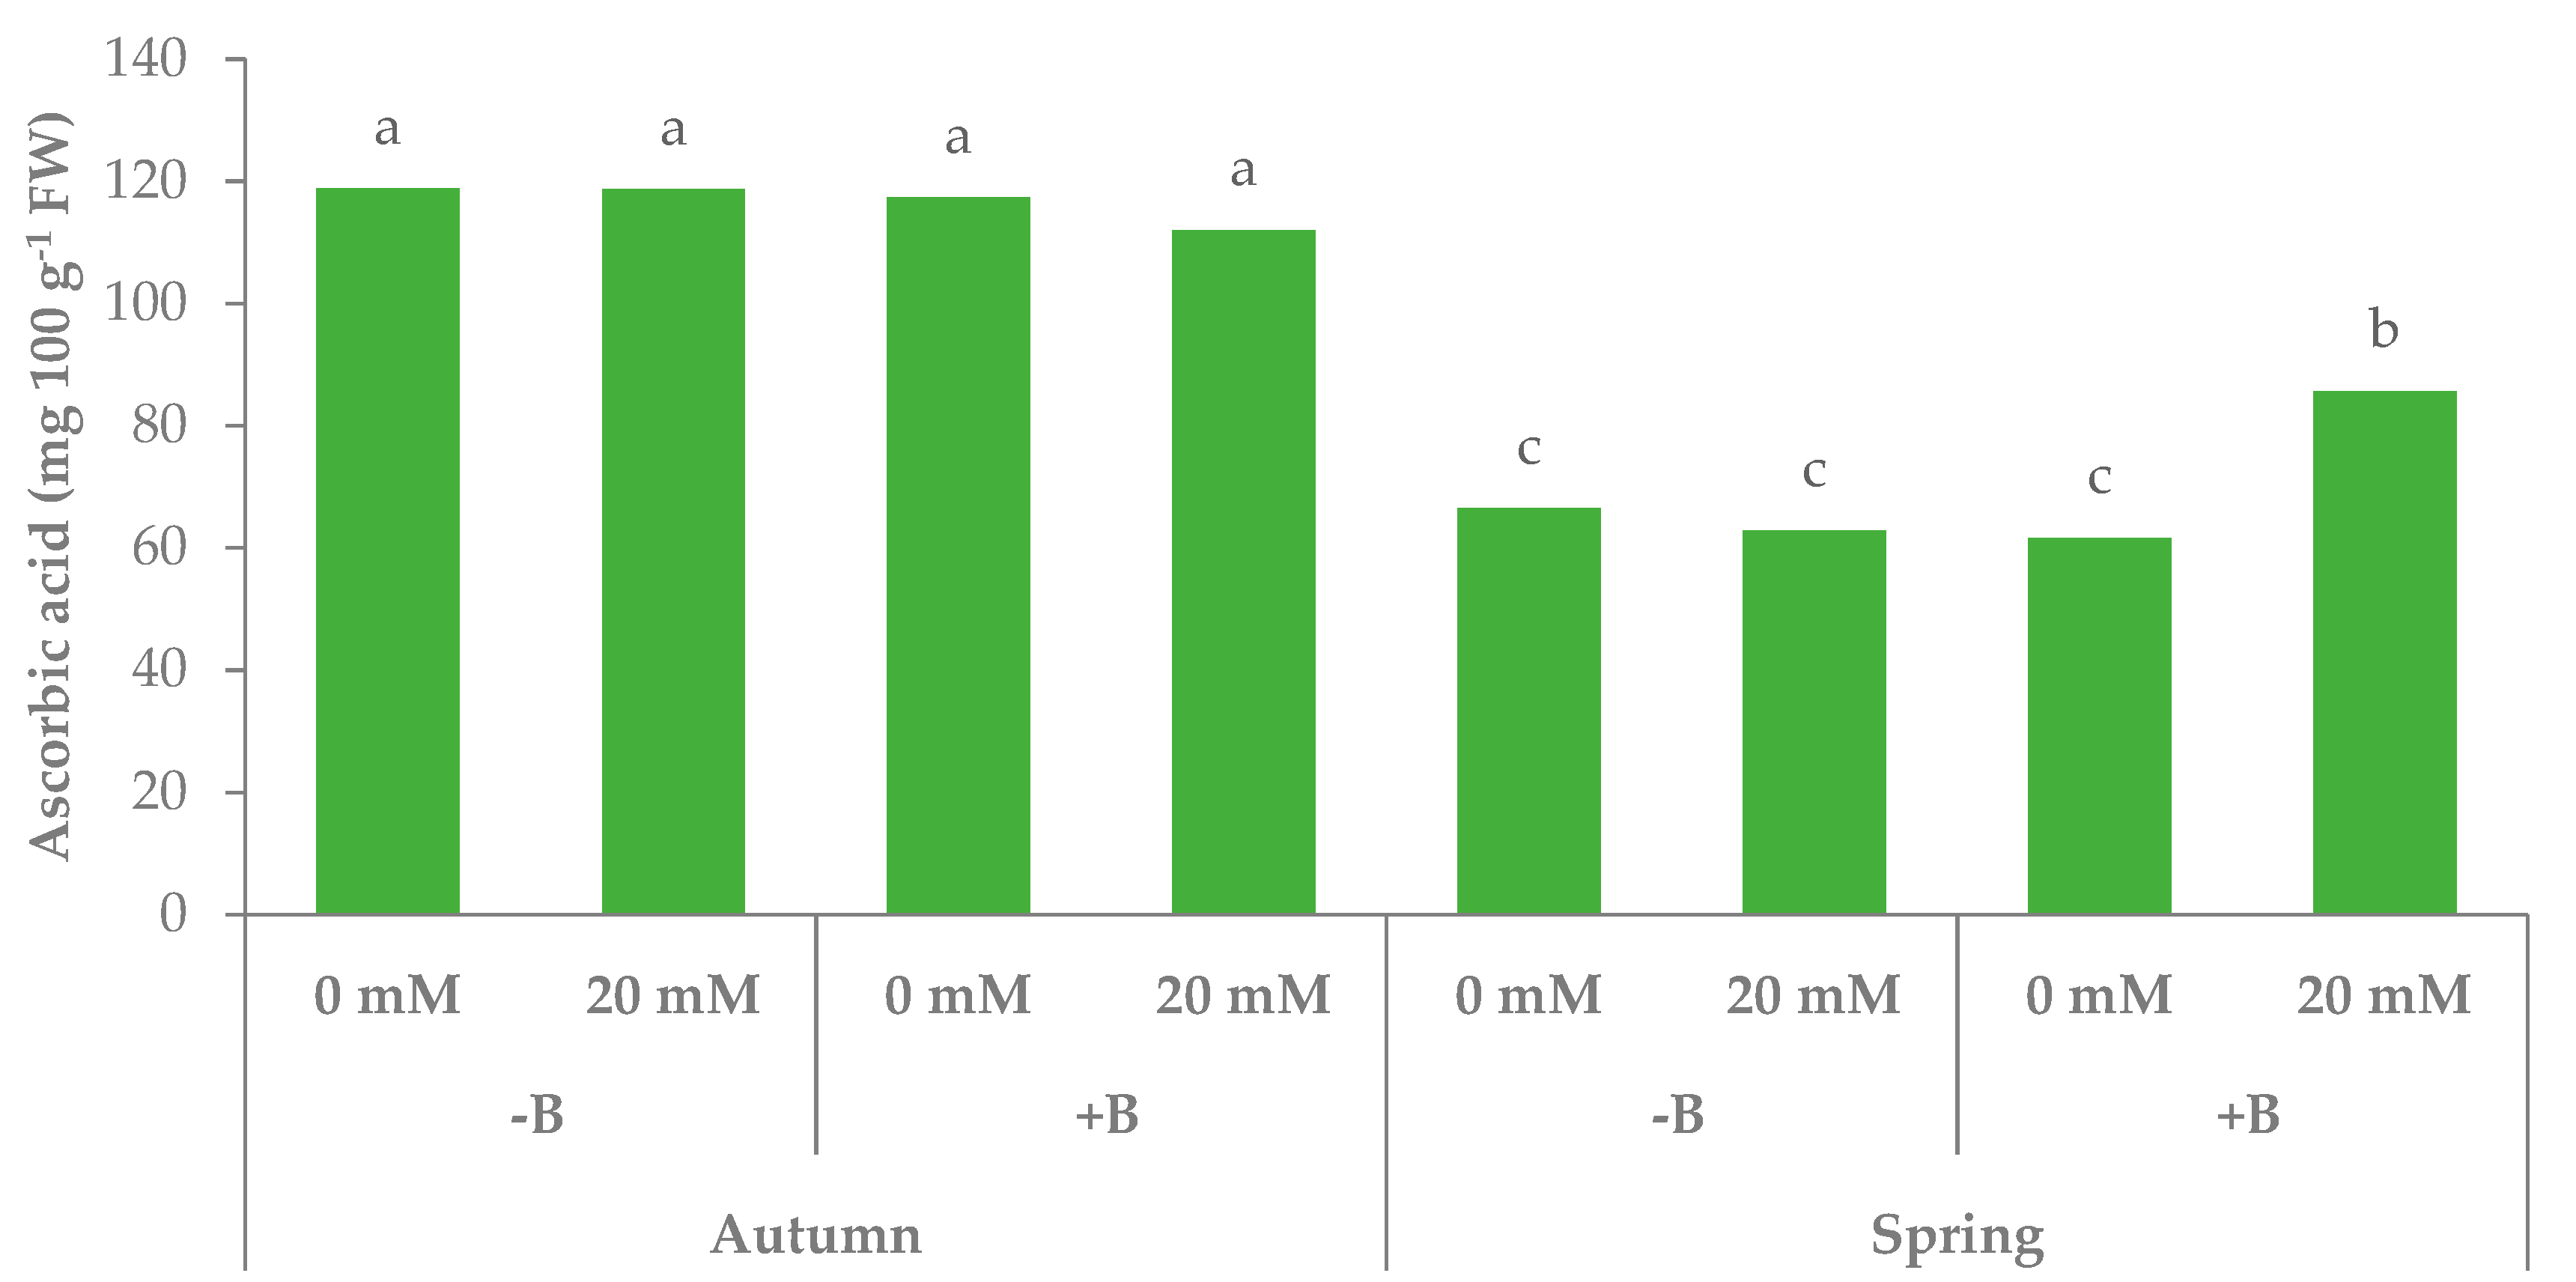
| Source of variance | L* | Chroma | Hue° | TSS (°Brix) | Ascorbic acid (mg 100 g−1 FW) | N-NO3− (mg kg−1 FW) | |
|---|---|---|---|---|---|---|---|
| Season | |||||||
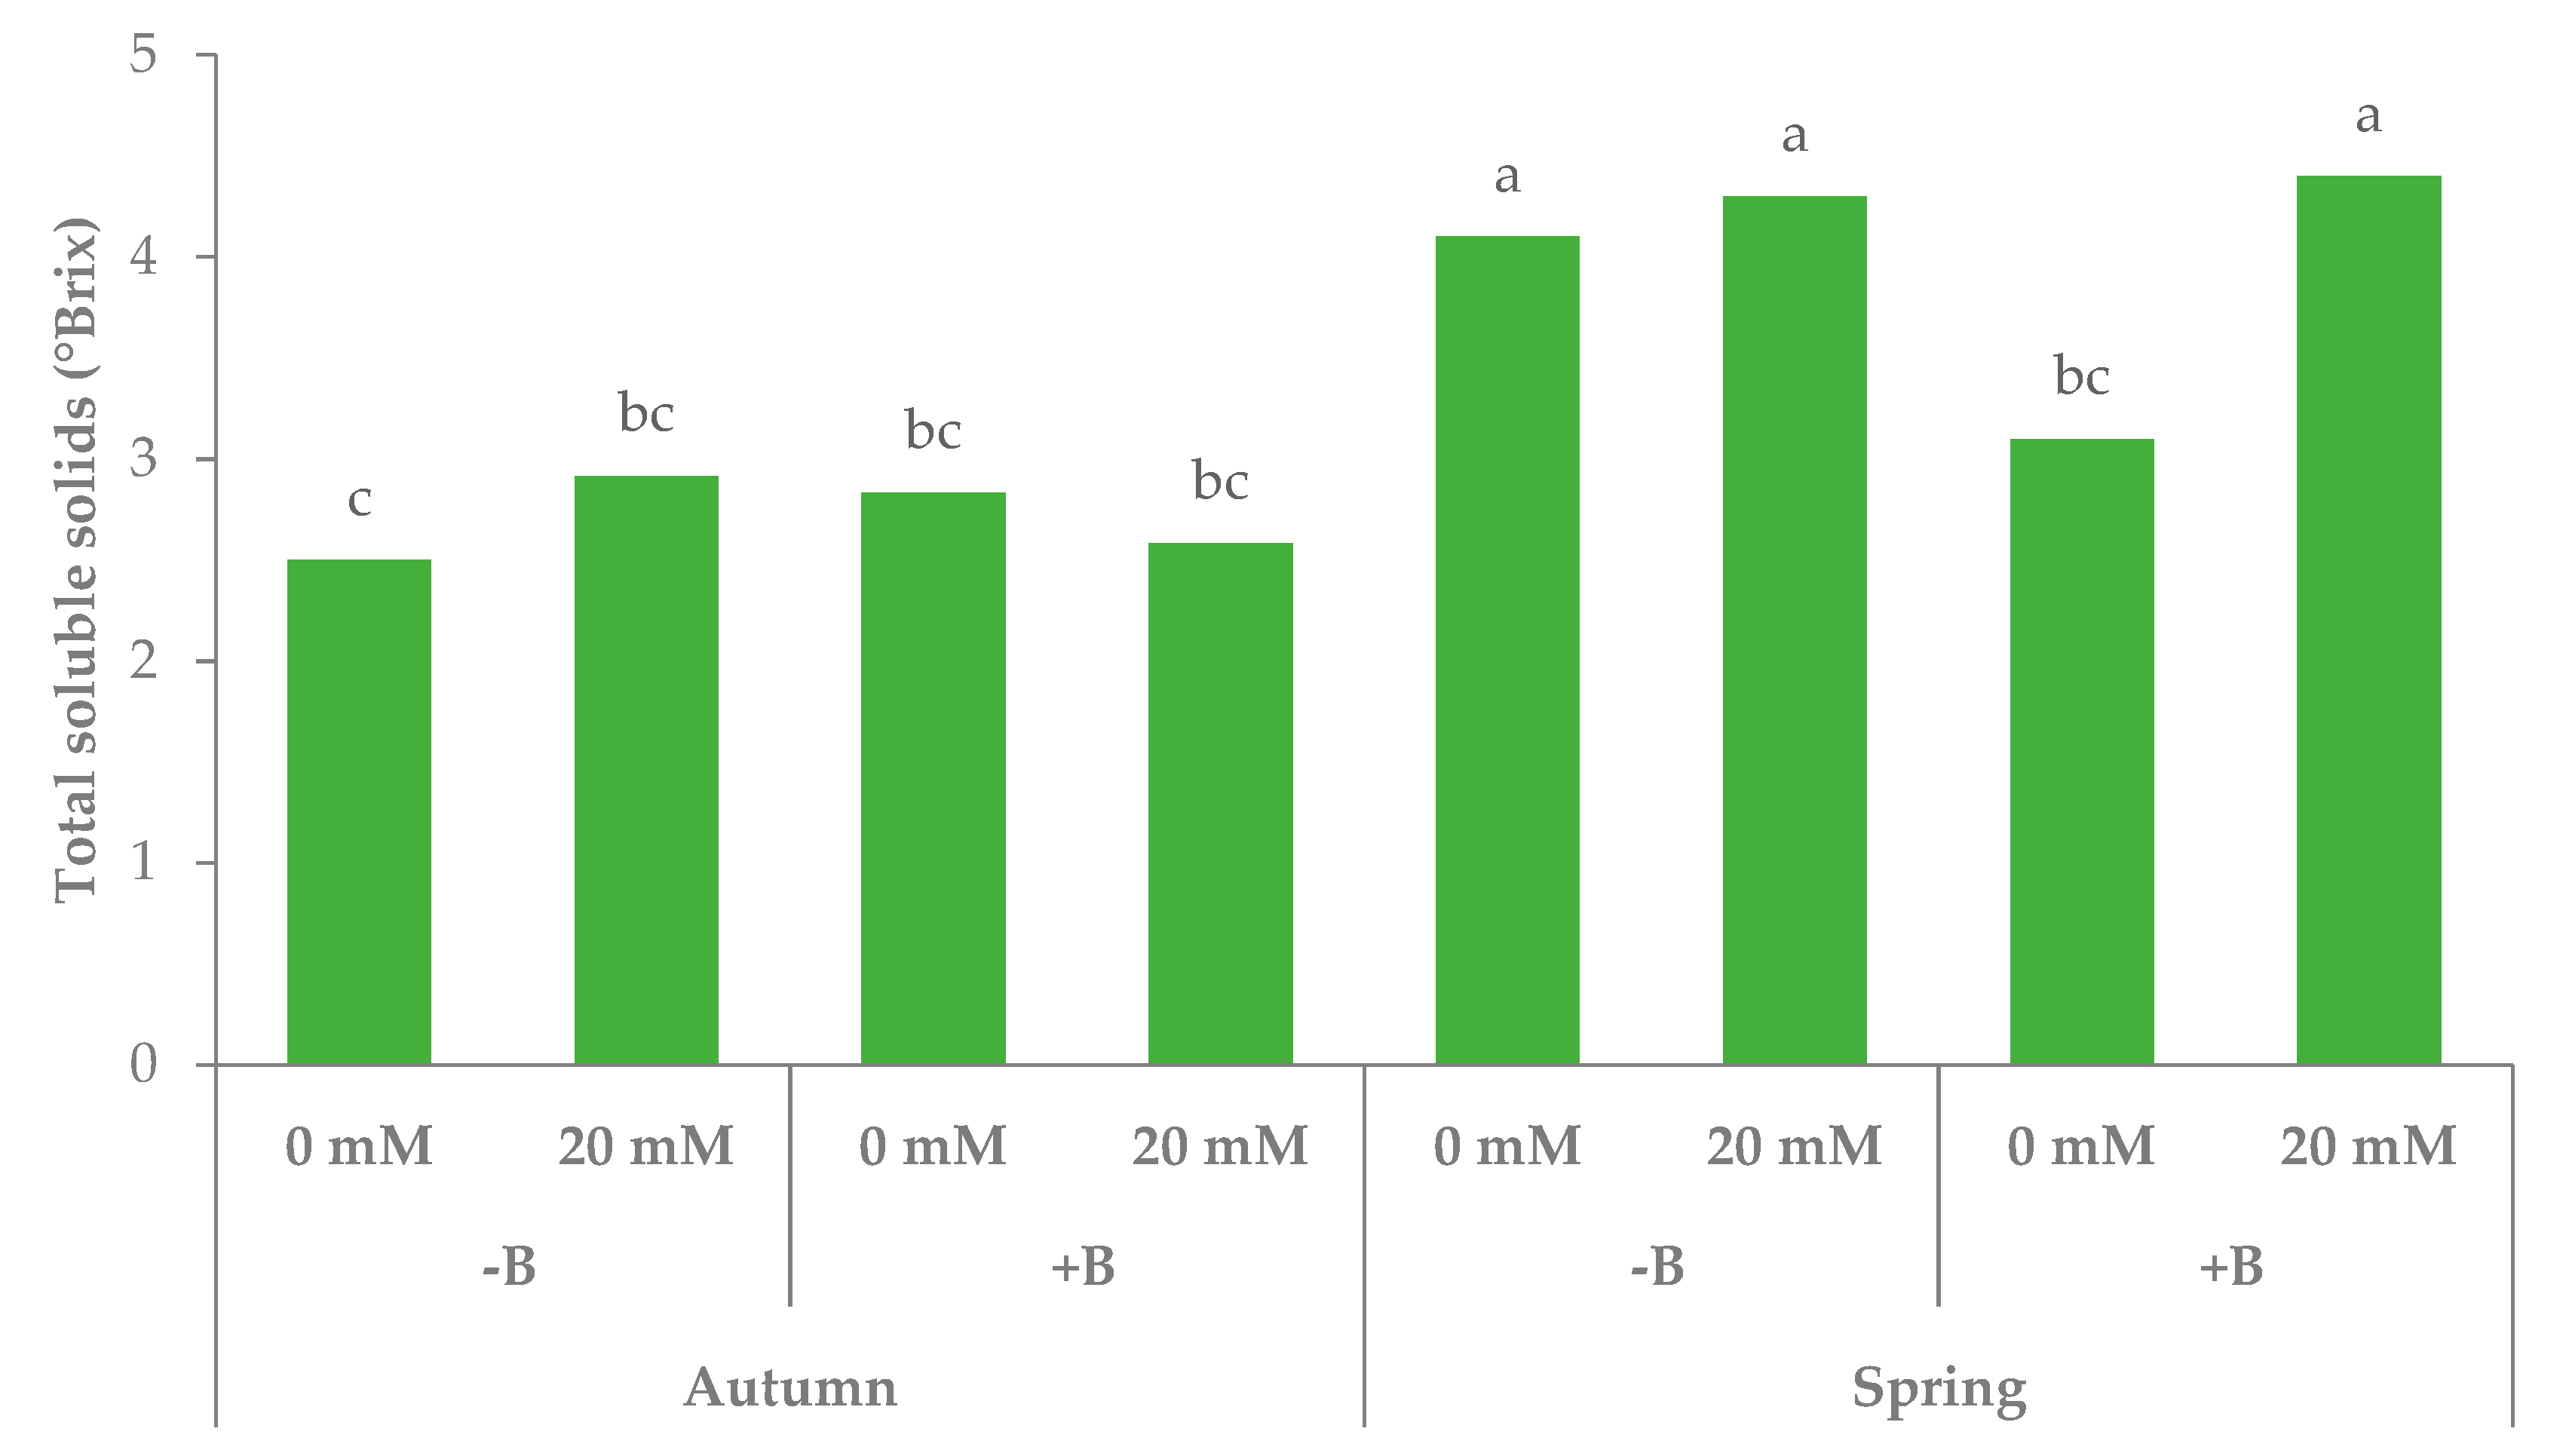
| Autumn | z 47.6 | 56.9a | 123.1 | 2.7 | 116.7 | 3749.6 | |
| Spring | 54.0 | 40.8b | 122.1 | 4.0 | 69.1 | 1348.5 | |
| PGPR | |||||||
| −B | 51.2 | 49.8 | 122.1 | 3.5 | 91.7 | 2495.2 | |
| +B | 50.4 | 47.9 | 123.0 | 3.2 | 94.1 | 2602.9 | |
| NaCl (mM) | |||||||
| 0 | 50.9 | 50.0 | 122.5 | 3.1 | 91.1 | 2693.3 | |
| 20 | 50.7 | 47.7 | 122.7 | 3.6 | 94.8 | 2404.9 | |
| Season × PGPR | |||||||
| Autumn | −B | 46.7b | 57.7 | 123.3a | 2.7 | 118.8 | 3635.8 |
| +B | 48.6b | 56.2 | 122.9a | 2.7 | 114.7 | 3863.3 | |
| Spring | −B | 55.8a | 41.9 | 121.0b | 4.2 | 64.6 | 1354.5 |
| +B | 52.3ab | 39.6 | 123.1a | 3.8 | 73.6 | 1342.5 | |
| Season × NaCl | |||||||
| Autumn | 0 | 48.2 | 58.9 | 122.9 | 2.7 | 118.1 | 3715.8a |
| 20 | 47.0 | 55.0 | 123.3 | 2.8 | 115.3 | 3783.3a | |
| Spring | 0 | 53.6 | 41.1 | 122.1 | 3.6 | 64.0 | 1670.7a |
| 20 | 54.5 | 40.5 | 122.1 | 4.4 | 74.2 | 1026.4c | |
| PGPR × NaCl | |||||||
| −B | 0 | 51.5 | 50.4 | 122.1 | 3.3 | 92.6 | 2631.5 |
| 20 | 51.0 | 49.2 | 122.2 | 3.6 | 90.7 | 2358.9 | |
| +B | 0 | 50.4 | 49.6 | 122.8 | 3.0 | 89.5 | 2755.0 |
| 20 | 50.5 | 46.2 | 123.2 | 3.5 | 98.8 | 2450.9 | |
| Significance x | |||||||
| Season | *** | *** | * | *** | *** | * | |
| PGPR | ns | ns | * | ns | ns | ns | |
| NaCl | ns | ns | ns | ** | ns | * | |
| Season × PGPR | * | ns | * | ns | * | ns | |
| Season × NaCl | ns | ns | ns | * | ns | ** | |
| PGPR × NaCl | ns | ns | ns | ns | ns | ns | |
| Season × PGPR × NaCl | ns | ns | ns | ** | * | ns | |
| Variable | PC1 | PC2 | PC3 | PC4 |
|---|---|---|---|---|
| Plant height | 0.953 | 0.080 | −0.234 | −0.048 |
| Whole plant FW | 0.942 | 0.312 | 0.039 | 0.017 |
| Shoot FW | 0.767 | 0.619 | −0.025 | −0.022 |
| Root FW | 0.932 | −0.277 | 0.124 | 0.072 |
| R/S FW | 0.787 | −0.545 | 0.212 | −0.005 |
| Whole plant DW | 0.870 | 0.353 | 0.285 | 0.168 |
| Shoot DW | 0.718 | 0.617 | 0.212 | 0.143 |
| Roots DW | 0.826 | −0.263 | 0.294 | 0.170 |
| S/R DW | 0.671 | −0.508 | 0.291 | 0.074 |
| Plant DM | −0.274 | −0.157 | 0.619 | 0.568 |
| Crop Yield | 0.757 | 0.624 | −0.175 | −0.014 |
| Minimal processing Yield | −0.438 | −0.379 | 0.611 | −0.368 |
| Leaf Yield | 0.737 | 0.634 | −0.039 | −0.111 |
| WUE | 0.835 | 0.150 | 0.378 | 0.218 |
| NUE | 0.907 | −0.350 | 0.116 | 0.183 |
| Leaf No. | −0.414 | 0.703 | 0.023 | 0.409 |
| Plant area | 0.427 | 0.804 | 0.013 | 0.000 |
| Leaf area | 0.796 | 0.561 | −0.136 | 0.000 |
| SLA | 0.863 | −0.398 | −0.268 | −0.004 |
| Stomatal conductance | 0.381 | 0.647 | 0.314 | −0.499 |
| L* | −0.863 | 0.413 | −0.039 | 0.214 |
| Chroma | 0.748 | −0.499 | −0.362 | 0.148 |
| Hue angle | 0.726 | −0.089 | 0.320 | −0.541 |
| SSC | −0.913 | 0.152 | 0.213 | −0.110 |
| Ascorbic acid | 0.764 | −0.544 | −0.182 | −0.098 |
| Nitrate content | 0.865 | −0.414 | −0.205 | 0.101 |
© 2020 by the authors. Licensee MDPI, Basel, Switzerland. This article is an open access article distributed under the terms and conditions of the Creative Commons Attribution (CC BY) license (http://creativecommons.org/licenses/by/4.0/).
Share and Cite
Moncada, A.; Vetrano, F.; Miceli, A. Alleviation of Salt Stress by Plant Growth-Promoting Bacteria in Hydroponic Leaf Lettuce. Agronomy 2020, 10, 1523. https://doi.org/10.3390/agronomy10101523
Moncada A, Vetrano F, Miceli A. Alleviation of Salt Stress by Plant Growth-Promoting Bacteria in Hydroponic Leaf Lettuce. Agronomy. 2020; 10(10):1523. https://doi.org/10.3390/agronomy10101523
Chicago/Turabian StyleMoncada, Alessandra, Filippo Vetrano, and Alessandro Miceli. 2020. "Alleviation of Salt Stress by Plant Growth-Promoting Bacteria in Hydroponic Leaf Lettuce" Agronomy 10, no. 10: 1523. https://doi.org/10.3390/agronomy10101523
APA StyleMoncada, A., Vetrano, F., & Miceli, A. (2020). Alleviation of Salt Stress by Plant Growth-Promoting Bacteria in Hydroponic Leaf Lettuce. Agronomy, 10(10), 1523. https://doi.org/10.3390/agronomy10101523