

Analysis of Electrical Conductivity in Commercial Adhesives Incorporating Graphene Nanoplatelets for Industrial Applications


Abstract
1. Introduction
2. Materials and Methods
3. Results
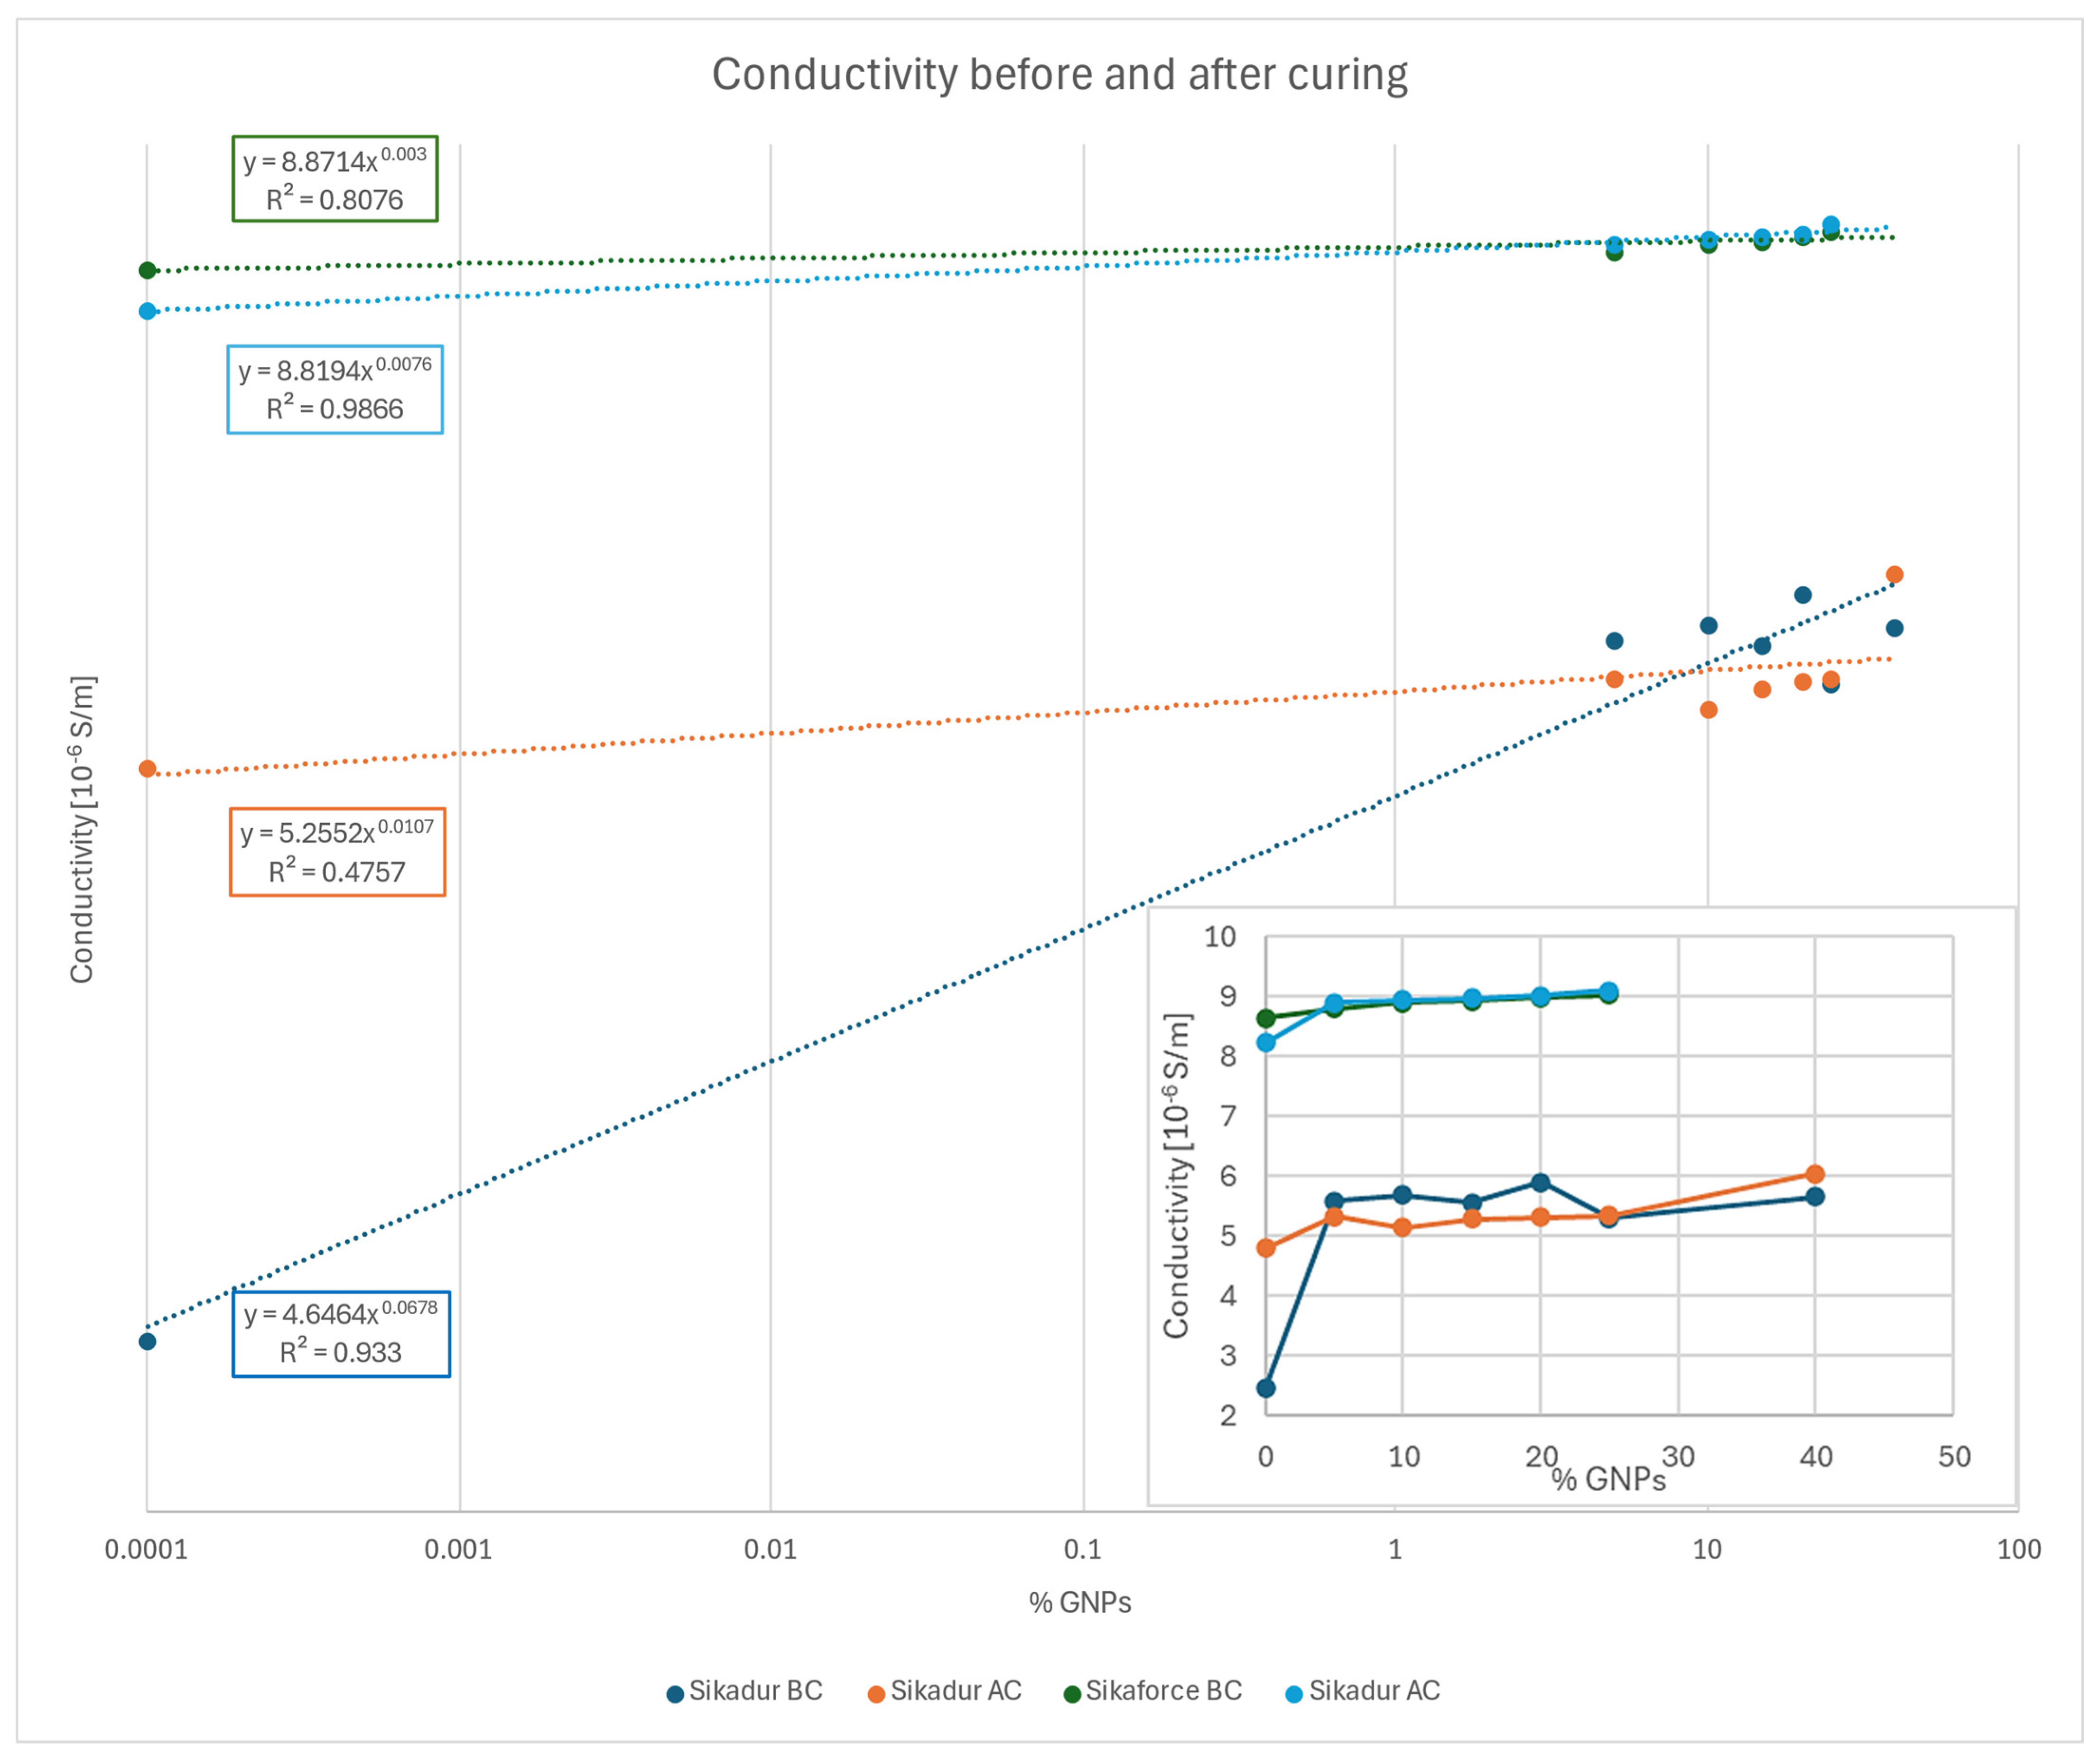
Conductivity
4. Discussion
5. Conclusions
Author Contributions
Funding
Institutional Review Board Statement
Data Availability Statement
Acknowledgments
Conflicts of Interest
Appendix A. Conductivity Measures

| % GNP | Specimen | D mean [mm] | T mean [mm] | Voltage [V] | Amperage [μA] | R [Ω] | S [mm2] | k [mm] | Resistivity [Ωmm] | Conductivity [S/m] |
|---|---|---|---|---|---|---|---|---|---|---|
| 0 | 1 | 89.64 | 3.848 | 11.97 | 32.4 | 0.3694 | 6310.9331 | 1640.0554 | 605.9093 | 1.6504 × 10⁻⁶ |
| 2 | 89.9 | 3.846 | 12.02 | 36.1 | 0.3330 | 6347.5958 | 1650.4409 | 549.5374 | 1.8197 × 10⁻⁶ | |
| 3 | 89.9066667 | 4.008 | 11.92 | 45.7 | 0.2608 | 6348.5373 | 1583.9664 | 413.1483 | 2.4204 × 10⁻⁶ | |
| 4 | 86.2833333 | 6.212 | 12.07 | 58.6 | 0.2060 | 5847.1429 | 941.2658 | 193.8750 | 5.158 × 10⁻⁶ | |
| 5 | 86.3166667 | 6.288 | 12.02 | 36.2 | 0.3320 | 5851.6616 | 930.6078 | 309.0029 | 3.2362 × 10⁻⁶ | |
| 6 | 86.25 | 6.154 | 12 | 35.6 | 0.3371 | 5842.6260 | 949.4030 | 320.0235 | 3.1248 × 10⁻⁶ | |
| 5 | 1 | 89.6166667 | 3.99 | 12.06 | 87.7 | 0.1375 | 6307.6481 | 1580.8642 | 217.3914 | 4.6 × 10⁻⁶ |
| 2 | 89.72 | 3.388 | 12.05 | 92 | 0.1310 | 6322.2026 | 1866.0574 | 244.4130 | 4.0914 × 10⁻⁶ | |
| 3 | 89.77 | 4.26 | 12.03 | 87.4 | 0.1376 | 6329.2512 | 1485.7397 | 204.5017 | 4.8899 × 10⁻⁶ | |
| 4 | 86.2566667 | 5.838 | 12.02 | 81.4 | 0.1477 | 5843.5293 | 1000.9471 | 147.8057 | 6.7656 × 10⁻⁶ | |
| 5 | 86.14 | 5.112 | 12.01 | 85.1 | 0.1411 | 5827.7326 | 1140.0103 | 160.8875 | 6.2155 × 10⁻⁶ | |
| 6 | 86.2733333 | 6.176 | 12.01 | 79.5 | 0.1511 | 5845.7877 | 946.5330 | 142.9920 | 6.9934 × 10⁻⁶ | |
| 10 | 1 | 89.7833333 | 4.344 | 11.98 | 87 | 0.1377 | 6331.1315 | 1457.4428 | 200.6915 | 4.9828 × 10⁻⁶ |
| 2 | 89.75 | 4.056 | 11.98 | 89.6 | 0.1337 | 6326.4313 | 1559.7710 | 208.5497 | 4.795 × 10⁻⁶ | |
| 3 | 89.8066667 | 4.236 | 11.96 | 92.9 | 0.1287 | 6334.4226 | 1495.3783 | 192.5159 | 5.1944 × 10⁻⁶ | |
| 4 | 86.0733333 | 5.072 | 12.02 | 86.3 | 0.1393 | 5818.7155 | 1147.2231 | 159.7870 | 6.2583 × 10⁻⁶ | |
| 5 | 86.0866667 | 4.894 | 12.01 | 92.4 | 0.1300 | 5820.5184 | 1189.3172 | 154.5855 | 6.4689 × 10⁻⁶ | |
| 6 | 86.1566667 | 5.264 | 12 | 85.4 | 0.1405 | 5829.9880 | 1107.5205 | 155.6235 | 6.4258 × 10⁻⁶ | |
| 15 | 1 | 89.7466667 | 3.464 | 11.98 | 98.5 | 0.1216 | 6325.9614 | 1826.2013 | 222.1106 | 4.5023 × 10⁻⁶ |
| 2 | 89.69 | 4.064 | 11.97 | 92.4 | 0.1295 | 6317.9754 | 1554.6199 | 201.3939 | 4.9654 × 10⁻⁶ | |
| 3 | 89.7133333 | 4.496 | 11.97 | 89.1 | 0.1343 | 6321.2631 | 1405.9749 | 188.8835 | 5.2943 × 10⁻⁶ | |
| 4 | 85.96 | 3.928 | 11.97 | 92.9 | 0.1288 | 5803.4025 | 1477.4446 | 190.3661 | 5.253 × 10⁻⁶ | |
| 5 | 86.05 | 4.784 | 12.05 | 89 | 0.1354 | 5815.5612 | 1215.6273 | 164.5877 | 6.0758 × 10⁻⁶ | |
| 6 | 86.13 | 6.092 | 12.04 | 83.5 | 0.1442 | 5826.3796 | 956.3985 | 137.9046 | 7.2514 × 10⁻⁶ | |
| 20 | 1 | 89.7733333 | 4.04 | 12.02 | 101.1 | 0.1189 | 6329.7212 | 1566.7627 | 186.2758 | 5.3684 × 10⁻⁶ |
| 2 | 89.69 | 3.446 | 12.01 | 103.6 | 0.1159 | 6317.9754 | 1833.4229 | 212.5426 | 4.7049 × 10⁻⁶ | |
| 3 | 89.7733333 | 3.78 | 12 | 102.2 | 0.1174 | 6329.7212 | 1674.5294 | 196.6179 | 5.086 × 10⁻⁶ | |
| 4 | 86.2333333 | 5.868 | 11.98 | 93.2 | 0.1285 | 5840.3682 | 995.2911 | 127.9355 | 7.8164 × 10⁻⁶ | |
| 5 | 86.01 | 3.988 | 11.98 | 100.5 | 0.1192 | 5810.1558 | 1456.9097 | 173.6694 | 5.7581 × 10⁻⁶ | |
| 6 | 86.1733333 | 4.618 | 11.98 | 100.7 | 0.1190 | 5832.2438 | 1262.9371 | 150.2481 | 6.6557 × 10⁻⁶ | |
| 25 | 1 | 89.7966667 | 3.27 | 11.98 | 90.8 | 0.1319 | 6333.0120 | 1936.7009 | 255.5251 | 3.9135 × 10⁻⁶ |
| 2 | 89.9 | 3.686 | 11.96 | 97 | 0.1233 | 6347.5958 | 1722.0824 | 212.3310 | 4.7096 × 10⁻⁶ | |
| 3 | 89.9 | 3.58 | 11.96 | 92.2 | 0.1297 | 6347.5958 | 1773.0715 | 229.9993 | 4.3478 × 10⁻⁶ | |
| 4 | 86.2 | 3.89 | 11.95 | 98.4 | 0.1214 | 5835.8539 | 1500.2195 | 182.1913 | 5.4887 × 10⁻⁶ | |
| 5 | 86.1433333 | 4.574 | 11.95 | 94.2 | 0.1269 | 5828.1836 | 1274.1984 | 161.6419 | 6.1865 × 10⁻⁶ | |
| 6 | 86.3866667 | 4.166 | 11.95 | 97.3 | 0.1228 | 5861.1565 | 1406.9027 | 172.7902 | 5.7874 × 10⁻⁶ | |
| 40 | 1 | 89.9466667 | 2.166 | 11.95 | 176.8 | 0.0676 | 6354.1875 | 2933.6046 | 198.2838 | 5.0433 × 10⁻⁶ |
| 2 | 89.8333333 | 3.062 | 11.94 | 137.2 | 0.0870 | 6338.1850 | 2069.9494 | 180.1399 | 5.5512 × 10⁻⁶ | |
| 3 | 89.8966667 | 3.66 | 11.92 | 127.4 | 0.0936 | 6347.1251 | 1734.1872 | 162.2568 | 6.1631 × 10⁻⁶ | |
| 4 | 89.85 | 3.622 | 11.92 | 126.3 | 0.0944 | 6340.5370 | 1750.5624 | 165.2154 | 6.0527 × 10⁻⁶ | |
| 5 | 89.8766667 | 2.8 | 11.9 | 146 | 0.0815 | 6344.3012 | 2265.8219 | 184.6800 | 5.4148 × 10⁻⁶ | |
| 6 | 89.8966667 | 2.924 | 11.89 | 148.6 | 0.0800 | 6347.1251 | 2170.6994 | 173.6852 | 5.7575 × 10⁻⁶ |
| % GNP | Specimen | D mean [mm] | T mean [mm] | Voltage [V] | Amperage [μA] | R [Ω] | S [mm2] | k [mm] | Resistivity [Ωmm] | Conductivity [S/m] |
|---|---|---|---|---|---|---|---|---|---|---|
| 0 | 1 | 89.64 | 3.848 | 11.9 | 78.9 | 0.1508 | 6310.9331 | 1640.0554 | 247.3594 | 4.0427 × 10⁻⁶ |
| 2 | 89.9 | 3.846 | 11.86 | 78.4 | 0.1513 | 6347.5958 | 1650.4409 | 249.6713 | 4.00527 × 10⁻⁶ | |
| 3 | 89.9066667 | 4.008 | 11.83 | 77.7 | 0.1523 | 6348.5373 | 1583.9664 | 241.1624 | 4.14658 × 10⁻⁶ | |
| 4 | 86.2833333 | 6.212 | 11.79 | 60.3 | 0.1955 | 5847.1429 | 941.2658 | 184.0385 | 5.43364 × 10⁻⁶ | |
| 5 | 86.3166667 | 6.288 | 11.77 | 62.3 | 0.1889 | 5851.6616 | 930.6078 | 175.8147 | 5.68781 × 10⁻⁶ | |
| 6 | 86.25 | 6.154 | 11.75 | 61.5 | 0.1911 | 5842.6260 | 949.4030 | 181.3900 | 5.51298 × 10⁻⁶ | |
| 5 | 1 | 89.6166667 | 3.99 | 12.07 | 79.6 | 0.1516 | 6307.6481 | 1580.8642 | 239.7114 | 4.17168 × 10⁻⁶ |
| 2 | 89.72 | 3.388 | 12.06 | 84.3 | 0.1431 | 6322.2026 | 1866.0574 | 266.9591 | 3.74589 × 10⁻⁶ | |
| 3 | 89.77 | 4.26 | 12.05 | 80.7 | 0.1493 | 6329.2512 | 1485.7397 | 221.8484 | 4.50758 × 10⁻⁶ | |
| 4 | 86.2566667 | 5.838 | 12.04 | 74.4 | 0.1618 | 5843.5293 | 1000.9471 | 161.9812 | 6.17355 × 10⁻⁶ | |
| 5 | 86.14 | 5.112 | 12.03 | 77.9 | 0.1544 | 5827.7326 | 1140.0103 | 176.0504 | 5.68019 × 10⁻⁶ | |
| 6 | 86.2733333 | 6.176 | 12.03 | 73.7 | 0.1632 | 5845.7877 | 946.5330 | 154.5019 | 6.47241 × 10⁻⁶ | |
| 10 | 1 | 89.7833333 | 4.344 | 12.01 | 78.6 | 0.1528 | 6331.1315 | 1457.4428 | 222.6958 | 4.49043 × 10⁻⁶ |
| 2 | 89.75 | 4.056 | 12 | 81.4 | 0.1474 | 6326.4313 | 1559.7710 | 229.9417 | 4.34893 × 10⁻⁶ | |
| 3 | 89.8066667 | 4.236 | 12 | 80.67 | 0.1488 | 6334.4226 | 1495.3783 | 222.4438 | 4.49552 × 10⁻⁶ | |
| 4 | 86.0733333 | 5.072 | 11.99 | 78.5 | 0.1527 | 5818.7155 | 1147.2231 | 175.2255 | 5.70693 × 10⁻⁶ | |
| 5 | 86.0866667 | 4.894 | 11.98 | 84.3 | 0.1421 | 5820.5184 | 1189.3172 | 169.0157 | 5.91661 × 10⁻⁶ | |
| 6 | 86.1566667 | 5.264 | 11.98 | 78.6 | 0.1524 | 5829.9880 | 1107.5205 | 168.8053 | 5.92399 × 10⁻⁶ | |
| 15 | 1 | 89.7466667 | 3.464 | 11.96 | 84.9 | 0.1409 | 6325.9614 | 1826.2013 | 257.2599 | 3.88712 × 10⁻⁶ |
| 2 | 89.69 | 4.064 | 11.96 | 83.1 | 0.1439 | 6317.9754 | 1554.6199 | 223.7455 | 4.46936 × 10⁻⁶ | |
| 3 | 89.7133333 | 4.496 | 11.96 | 81.4 | 0.1469 | 6321.2631 | 1405.9749 | 206.5781 | 4.84078 × 10⁻⁶ | |
| 4 | 85.96 | 3.928 | 11.94 | 85.6 | 0.1395 | 5803.4025 | 1477.4446 | 206.0828 | 4.85242 × 10⁻⁶ | |
| 5 | 86.05 | 4.784 | 11.93 | 80.7 | 0.1478 | 5815.5612 | 1215.6273 | 179.7080 | 5.56458 × 10⁻⁶ | |
| 6 | 86.13 | 6.092 | 11.93 | 76.2 | 0.1566 | 5826.3796 | 956.3985 | 149.7354 | 6.67845 × 10⁻⁶ | |
| 20 | 1 | 89.7733333 | 4.04 | 11.92 | 90.2 | 0.1322 | 6329.7212 | 1566.7627 | 207.0489 | 4.82978 × 10⁻⁶ |
| 2 | 89.69 | 3.446 | 11.91 | 91.2 | 0.1306 | 6317.9754 | 1833.4229 | 239.4306 | 4.17658 × 10⁻⁶ | |
| 3 | 89.7733333 | 3.78 | 11.91 | 89.6 | 0.1329 | 6329.7212 | 1674.5294 | 222.5853 | 4.49266 × 10⁻⁶ | |
| 4 | 86.2333333 | 5.868 | 11.92 | 82.3 | 0.1448 | 5840.3682 | 995.2911 | 144.1539 | 6.93703 × 10⁻⁶ | |
| 5 | 86.01 | 3.988 | 11.91 | 95.7 | 0.1245 | 5810.1558 | 1456.9097 | 181.3145 | 5.51528 × 10⁻⁶ | |
| 6 | 86.1733333 | 4.618 | 11.91 | 90 | 0.1323 | 5832.2438 | 1262.9371 | 167.1287 | 5.98341 × 10⁻⁶ | |
| 25 | 1 | 89.7966667 | 3.27 | 11.91 | 60.2 | 0.1978 | 6333.0120 | 1936.7009 | 383.1579 | 2.60989 × 10⁻⁶ |
| 2 | 89.9 | 3.686 | 11.9 | 98.2 | 0.1212 | 6347.5958 | 1722.0824 | 208.6841 | 4.79193 × 10⁻⁶ | |
| 3 | 89.9 | 3.58 | 11.9 | 97.6 | 0.1219 | 6347.5958 | 1773.0715 | 216.1839 | 4.62569 × 10⁻⁶ | |
| 4 | 86.2 | 3.89 | 11.89 | 95.3 | 0.1248 | 5835.8539 | 1500.2195 | 187.1732 | 5.34264 × 10⁻⁶ | |
| 5 | 86.1433333 | 4.574 | 11.89 | 94.6 | 0.1257 | 5828.1836 | 1274.1984 | 160.1503 | 6.24413 × 10⁻⁶ | |
| 6 | 86.3866667 | 4.166 | 11.88 | 95.2 | 0.1248 | 5861.1565 | 1406.9027 | 175.5673 | 5.69582 × 10⁻⁶ | |
| 40 | 1 | 89.9466667 | 2.166 | 12.02 | 193.1 | 0.0622 | 6354.1875 | 2933.6046 | 182.6097 | 5.47616 × 10⁻⁶ |
| 2 | 89.8333333 | 3.062 | 12.03 | 146.1 | 0.0823 | 6338.1850 | 2069.9494 | 170.4414 | 5.86712 × 10⁻⁶ | |
| 3 | 89.8966667 | 3.66 | 12.04 | 131.3 | 0.0917 | 6347.1251 | 1734.1872 | 159.0222 | 6.28843 × 10⁻⁶ | |
| 4 | 89.85 | 3.622 | 12.03 | 135.3 | 0.0889 | 6340.5370 | 1750.5624 | 155.6487 | 6.42473 × 10⁻⁶ | |
| 5 | 89.8766667 | 2.8 | 12 | 167 | 0.0719 | 6344.3012 | 2265.8219 | 162.8135 | 6.142 × 10⁻⁶ | |
| 6 | 89.8966667 | 2.924 | 12 | 158.6 | 0.0757 | 6347.1251 | 2170.6994 | 164.2396 | 6.08867 × 10⁻⁶ |
| % GNP | Specimen | D mean [mm] | T mean [mm] | Voltage [V] | Amperage [μA] | R [Ω] | S [mm2] | k [mm] | Resistivity [Ωmm] | Conductivity [S/m] |
|---|---|---|---|---|---|---|---|---|---|---|
| 0 | 1 | 86.7 | 10.652 | 12.05 | 71.4 | 0.1688 | 5903.7516 | 554.2388 | 93.5375 | 1.0691 × 10⁻⁵ |
| 2 | 86.4266667 | 10.502 | 11.93 | 71.2 | 0.1676 | 5866.5855 | 558.6160 | 93.5996 | 1.0684 × 10⁻⁵ | |
| 3 | 86.5233333 | 10.56 | 12.14 | 72.6 | 0.1672 | 5879.7162 | 556.7913 | 93.1053 | 1.0741 × 10⁻⁵ | |
| 4 | 90.03 | 5.946 | 12.09 | 84 | 0.1439 | 6365.9670 | 1070.6302 | 154.0943 | 6.4895 × 10⁻⁶ | |
| 5 | 89.9833333 | 5.654 | 12.06 | 88.4 | 0.1364 | 6359.3691 | 1124.7558 | 153.4452 | 6.517 × 10⁻⁶ | |
| 6 | 89.9033333 | 5.952 | 12.04 | 86.7 | 0.1389 | 6348.0665 | 1066.5434 | 148.1105 | 6.7517 × 10⁻⁶ | |
| 5 | 1 | 86.1466667 | 10.57 | 11.97 | 72.3 | 0.1656 | 5828.6347 | 551.4319 | 91.2951 | 1.0953 × 10⁻⁵ |
| 2 | 86.3266667 | 10.646 | 11.95 | 72.4 | 0.1651 | 5853.0175 | 549.7856 | 90.7450 | 1.102 × 10⁻⁵ | |
| 3 | 86.42 | 10.654 | 11.94 | 72.4 | 0.1649 | 5865.6805 | 550.5613 | 90.7970 | 1.1014 × 10⁻⁵ | |
| 4 | 90 | 5.866 | 11.92 | 82.7 | 0.1441 | 6361.7251 | 1084.5082 | 156.3161 | 6.3973 × 10⁻⁶ | |
| 5 | 89.98 | 6.06 | 12.06 | 87.2 | 0.1383 | 6358.8980 | 1049.3231 | 145.1243 | 6.8906 × 10⁻⁶ | |
| 6 | 89.7666667 | 5.932 | 12.04 | 84.7 | 0.1421 | 6328.7812 | 1066.8883 | 151.6568 | 6.5938 × 10⁻⁶ | |
| 10 | 1 | 86.3833333 | 10.604 | 12.01 | 74.4 | 0.1614 | 5860.7041 | 552.6881 | 89.2175 | 1.1209 × 10⁻⁵ |
| 2 | 86.38 | 10.654 | 12 | 72.5 | 0.1655 | 5860.2519 | 550.0518 | 91.0431 | 1.0984 × 10⁻⁵ | |
| 3 | 86.4266667 | 10.408 | 11.99 | 73.8 | 0.1625 | 5866.5855 | 563.6612 | 91.5758 | 1.092 × 10⁻⁵ | |
| 4 | 89.9233333 | 6.018 | 11.98 | 85.1 | 0.1408 | 6350.8912 | 1055.3159 | 148.5627 | 6.7312 × 10⁻⁶ | |
| 5 | 89.7933333 | 6.158 | 11.97 | 82.5 | 0.1451 | 6332.5419 | 1028.3439 | 149.2034 | 6.7023 × 10⁻⁶ | |
| 6 | 89.8033333 | 6.172 | 11.96 | 85 | 0.1407 | 6333.9524 | 1026.2399 | 144.3980 | 6.9253 × 10⁻⁶ | |
| 15 | 1 | 86.2633333 | 10.614 | 11.94 | 71.9 | 0.1661 | 5844.4326 | 550.6343 | 91.4405 | 1.0936 × 10⁻⁵ |
| 2 | 86.33 | 10.614 | 11.94 | 72.2 | 0.1654 | 5853.4695 | 551.4857 | 91.2014 | 1.0965 × 10⁻⁵ | |
| 3 | 86.4533333 | 10.646 | 12.05 | 72.5 | 0.1662 | 5870.2063 | 551.4002 | 91.6465 | 1.0911 × 10⁻⁵ | |
| 4 | 89.89 | 6.168 | 12.04 | 82.9 | 0.1452 | 6346.1837 | 1028.8884 | 149.4308 | 6.6921 × 10⁻⁶ | |
| 5 | 89.8833333 | 6.3 | 12.03 | 85.2 | 0.1412 | 6345.2425 | 1007.1813 | 142.2112 | 7.0318 × 10⁻⁶ | |
| 6 | 89.9066667 | 6.364 | 12.03 | 84.6 | 0.1422 | 6348.5373 | 997.5703 | 141.8531 | 7.0495 × 10⁻⁶ | |
| 20 | 1 | 86.2833333 | 10.288 | 12.01 | 73.6 | 0.1632 | 5847.1429 | 568.3459 | 92.7423 | 1.0783 × 10⁻⁵ |
| 2 | 86.2233333 | 10.09 | 12.01 | 78.6 | 0.1528 | 5839.0138 | 578.6931 | 88.4237 | 1.1309 × 10⁻⁵ | |
| 3 | 86.2733333 | 10.67 | 12 | 71.3 | 0.1683 | 5845.7877 | 547.8714 | 92.2084 | 1.0845 × 10⁻⁵ | |
| 4 | 89.9733333 | 6.226 | 11.99 | 83.8 | 0.1431 | 6357.9558 | 1021.1943 | 146.1112 | 6.8441 × 10⁻⁶ | |
| 5 | 89.9366667 | 6.154 | 11.98 | 87.8 | 0.1364 | 6352.7747 | 1032.3001 | 140.8537 | 7.0996 × 10⁻⁶ | |
| 6 | 89.7966667 | 6.388 | 11.98 | 84.3 | 0.1421 | 6333.0120 | 991.3920 | 140.8882 | 7.0978 × 10⁻⁶ | |
| 25 | 1 | 86.2766667 | 9.91 | 11.97 | 77.2 | 0.1551 | 5846.2394 | 589.9333 | 91.4702 | 1.0933 × 10⁻⁵ |
| 2 | 86.27 | 10.474 | 11.97 | 77.4 | 0.1547 | 5845.3360 | 558.0806 | 86.3078 | 1.1586 × 10⁻⁵ | |
| 3 | 86.2733333 | 9.666 | 11.97 | 79.3 | 0.1509 | 5845.7877 | 604.7784 | 91.2887 | 1.0954 × 10⁻⁵ | |
| 4 | 89.8866667 | 6.034 | 11.97 | 94.5 | 0.1267 | 6345.7131 | 1051.6594 | 133.2102 | 7.5069 × 10⁻⁶ | |
| 5 | 89.9033333 | 5.832 | 11.96 | 88.1 | 0.1358 | 6348.0665 | 1088.4888 | 147.7676 | 6.7674 × 10⁻⁶ | |
| 6 | 89.89 | 5.676 | 11.96 | 86.3 | 0.1386 | 6346.1837 | 1118.0732 | 154.9497 | 6.4537 × 10⁻⁶ |
| % GNP | Specimen | D mean [mm] | T mean [mm] | Voltage [V] | Amperage [μA] | R [Ω] | S [mm2] | k [mm] | Resistivity [Ωmm] | Conductivity [S/m] |
|---|---|---|---|---|---|---|---|---|---|---|
| 0 | 1 | 86.7 | 10.652 | 12.06 | 63.8 | 0.1890 | 5903.7516 | 554.2388 | 104.7668 | 9.545 × 10⁻⁶ |
| 2 | 86.4266667 | 10.502 | 12.05 | 64.3 | 0.1874 | 5866.5855 | 558.6160 | 104.6862 | 9.5524 × 10⁻⁶ | |
| 3 | 86.5233333 | 10.56 | 12.05 | 66.5 | 0.1812 | 5879.7162 | 556.7913 | 100.8923 | 9.9116 × 10⁻⁶ | |
| 4 | 90.03 | 5.946 | 12.05 | 88.6 | 0.1360 | 6365.9670 | 1070.6302 | 145.6105 | 6.8676 × 10⁻⁶ | |
| 5 | 89.9833333 | 5.654 | 12.05 | 90.5 | 0.1331 | 6359.3691 | 1124.7558 | 149.7603 | 6.6773 × 10⁻⁶ | |
| 6 | 89.9033333 | 5.952 | 12.04 | 87.7 | 0.1373 | 6348.0665 | 1066.5434 | 146.4217 | 6.8296 × 10⁻⁶ | |
| 5 | 1 | 86.1466667 | 10.57 | 12.03 | 73.1 | 0.1646 | 5828.6347 | 551.4319 | 90.7486 | 1.0748 × 10⁻⁵ |
| 2 | 86.3266667 | 10.646 | 12.04 | 72.1 | 0.1670 | 5853.0175 | 549.7856 | 91.8089 | 1.059 × 10⁻⁵ | |
| 3 | 86.42 | 10.654 | 12.04 | 73.2 | 0.1645 | 5865.6805 | 550.5613 | 90.5568 | 1.0605 × 10⁻⁵ | |
| 4 | 90 | 5.866 | 12.03 | 86.5 | 0.1391 | 6361.7251 | 1084.5082 | 150.8281 | 6.6301 × 10⁻⁶ | |
| 5 | 89.98 | 6.06 | 12.05 | 87.2 | 0.1382 | 6358.8980 | 1049.3231 | 145.0039 | 6.5247 × 10⁻⁶ | |
| 6 | 89.7666667 | 5.932 | 12.05 | 89.2 | 0.1351 | 6328.7812 | 1066.8883 | 144.1256 | 6.4639 × 10⁻⁶ | |
| 10 | 1 | 86.3833333 | 10.604 | 12.03 | 73 | 0.1648 | 5860.7041 | 552.6881 | 91.0800 | 1.0573 × 10⁻⁵ |
| 2 | 86.38 | 10.654 | 12.03 | 72.1 | 0.1669 | 5860.2519 | 550.0518 | 91.7770 | 1.0564 × 10⁻⁵ | |
| 3 | 86.4266667 | 10.408 | 12.03 | 71.4 | 0.1685 | 5866.5855 | 563.6612 | 94.9698 | 1.053 × 10⁻⁵ | |
| 4 | 89.9233333 | 6.018 | 12.03 | 88 | 0.1367 | 6350.8912 | 1055.3159 | 144.2665 | 6.522 × 10⁻⁶ | |
| 5 | 89.7933333 | 6.158 | 12.02 | 88.3 | 0.1361 | 6332.5419 | 1028.3439 | 139.9852 | 6.642 × 10⁻⁶ | |
| 6 | 89.8033333 | 6.172 | 11.99 | 88.5 | 0.1355 | 6333.9524 | 1026.2399 | 139.0352 | 7.0949 × 10⁻⁶ | |
| 15 | 1 | 86.2633333 | 10.614 | 12.01 | 70.3 | 0.1708 | 5844.4326 | 550.6343 | 94.0700 | 1.063 × 10⁻⁵ |
| 2 | 86.33 | 10.614 | 12 | 71.4 | 0.1681 | 5853.4695 | 551.4857 | 92.6867 | 1.0789 × 10⁻⁵ | |
| 3 | 86.4533333 | 10.646 | 12.01 | 71.5 | 0.1680 | 5870.2063 | 551.4002 | 92.6198 | 1.0797 × 10⁻⁵ | |
| 4 | 89.89 | 6.168 | 12 | 89.3 | 0.1344 | 6346.1837 | 1028.8884 | 138.2605 | 7.2327 × 10⁻⁶ | |
| 5 | 89.8833333 | 6.3 | 12 | 86.5 | 0.1387 | 6345.2425 | 1007.1813 | 139.7246 | 7.1569 × 10⁻⁶ | |
| 6 | 89.9066667 | 6.364 | 12 | 87.3 | 0.1375 | 6348.5373 | 997.5703 | 137.1231 | 7.2927 × 10⁻⁶ | |
| 20 | 1 | 86.2833333 | 10.288 | 11.99 | 73.2 | 0.1638 | 5847.1429 | 568.3459 | 93.0938 | 1.0742 × 10⁻⁵ |
| 2 | 86.2233333 | 10.09 | 11.99 | 76 | 0.1578 | 5839.0138 | 578.6931 | 91.2965 | 1.0953 × 10⁻⁵ | |
| 3 | 86.2733333 | 10.67 | 11.98 | 74.1 | 0.1617 | 5845.7877 | 547.8714 | 88.5762 | 1.129 × 10⁻⁵ | |
| 4 | 89.9733333 | 6.226 | 11.97 | 85.4 | 0.1402 | 6357.9558 | 1021.1943 | 143.1346 | 6.9864 × 10⁻⁶ | |
| 5 | 89.9366667 | 6.154 | 11.97 | 88 | 0.1360 | 6352.7747 | 1032.3001 | 140.4163 | 7.1217 × 10⁻⁶ | |
| 6 | 89.7966667 | 6.388 | 11.98 | 83.4 | 0.1436 | 6333.0120 | 991.3920 | 142.4086 | 7.022 × 10⁻⁶ | |
| 25 | 1 | 86.2766667 | 9.91 | 11.98 | 76.6 | 0.1564 | 5846.2394 | 589.9333 | 92.2637 | 1.0838 × 10⁻⁵ |
| 2 | 86.27 | 10.474 | 11.98 | 75.8 | 0.1580 | 5845.3360 | 558.0806 | 88.2032 | 1.1337 × 10⁻⁵ | |
| 3 | 86.2733333 | 9.666 | 11.98 | 79.6 | 0.1505 | 5845.7877 | 604.7784 | 91.0207 | 1.0987 × 10⁻⁵ | |
| 4 | 89.8866667 | 6.034 | 11.97 | 95 | 0.1260 | 6345.7131 | 1051.6594 | 132.5091 | 7.5467 × 10⁻⁶ | |
| 5 | 89.9033333 | 5.832 | 11.97 | 92.5 | 0.1294 | 6348.0665 | 1088.4888 | 140.8563 | 7.0994 × 10⁻⁶ | |
| 6 | 89.89 | 5.676 | 11.97 | 91.5 | 0.1308 | 6346.1837 | 1118.0732 | 146.2660 | 6.8369 × 10⁻⁶ |
Appendix B
References
- Collado, I.; Jiménez-Suárez, A.; Moriche, R.; Del Rosario, G.; Prolongo, S.G. Electrical, Thermo-Electrical, and Electromagnetic Behaviour of Epoxy Composites Reinforced with Graphene Nanoplatelets with Different Average Surface Area. Polymers 2022, 14, 5520. [Google Scholar] [CrossRef]
- Canales, J.; Muñoz, M.E.; Fernández, M.; Santamaría, A. Rheology, electrical conductivity and crystallinity of a polyurethane/graphene composite: Implications for its use as a hot-melt adhesive. Compos. Part A Appl. Sci. Manuf. 2016, 84, 9–16. [Google Scholar] [CrossRef]
- Arribas, C.; Prolongo, M.G.; Sánchez-Cabezudo, M.; Moriche, R.; Prolongo, S.G. Hydrothermal ageing of graphene/carbon nanotubes/epoxy hybrid nanocomposites. Polym. Degrad. Stab. 2019, 170, 109003. [Google Scholar] [CrossRef]
- Prolongo, S.G.; Moriche, R.; Jiménez-Suárez, A.; Sánchez, M.; Ureña, A. Advantages and disadvantages of the addition of graphene nanoplatelets to epoxy resins. Eur. Polym. J. 2014, 61, 206–214. [Google Scholar] [CrossRef]
- Carmen, C.L.M.-Á. Andrade Perdrix. Recomendación Técnica Sobre la Medida de la Resistividad Eléctrica en Probetas de Hormigón. 2023. Available online: https://alconpat.org/assets/docs/recomendaciones_tecnicas/04_RT.pdf (accessed on 11 April 2024).
- Demir, M.E.; Topkaya, H.; Bağatır, T.; Çelik, Y.H. Impact of Reinforcement Ratio on Mechanical Properties and Wear Behaviour of Graphene Nanoplatelet Reinforced Epoxy Composites. J. Polytech. 2024, 27, 2181–2192. [Google Scholar] [CrossRef]
- Akpinar, S.; Kars, A.; Bayramog, S.; Demiral, M. The influence of combination of surface roughness and nanostructure of adhesive on the strength of adhesively bonded joints. Int. J. Adhes. Adhes. 2024, 133, 103743. [Google Scholar] [CrossRef]
- Jović, N.; Dudić, D.; Montone, A.; Antisari, M.V.; Mitrić, M.; Djoković, V. Temperature dependence of the electrical conductivity of epoxy/expanded graphite nanosheet composites. Scr. Mater. 2008, 58, 846–849. [Google Scholar] [CrossRef]
- Li, Y.; Pan, D.; Chen, S.; Wang, Q.; Pan, G.; Wang, T. In situ polymerization and mechanical, thermal properties of polyurethane/graphene oxide/epoxy nanocomposites. Mater. Des. 2013, 47, 850–856. [Google Scholar] [CrossRef]
- Salom, C.; Prolongo, M.G.; Toribio, A.; Martínez-Martínez, A.J.; de Cárcer, I.A.; Prolongo, S.G. Mechanical properties and adhesive behavior of epoxy-graphene nanocomposites. Int. J. Adhes. Adhes. 2018, 84, 119–125. [Google Scholar] [CrossRef]
- Yadav, S.K.; Cho, J.W. Functionalized graphene nanoplatelets for enhanced mechanical and thermal properties of polyurethane nanocomposites. Appl. Surf. Sci. 2013, 266, 360–367. [Google Scholar] [CrossRef]
- Jia, Z.M.; Liu, Q.; Zhang, Z.C. Effect of water immersion on shear strength of epoxy adhesive filled with graphene nanoplatelets. Rev. Adv. Mater. Sci. 2024, 63, 20240010. [Google Scholar] [CrossRef]
- Khalil, N.Z.; Kong, N.R.A.; Fricke, H. The influence of GNP on the mechanical and thermomechanical properties of epoxy adhesive: Pearson correlation matrix and heatmap application in data interpretation. Polym. Compos. 2024, 45, 8997–9018. [Google Scholar] [CrossRef]
- Cataldi, P.; Athanassiou, A.; Bayer, I.S. Graphene nanoplatelets-based advanced materials and recent progress in sustainable applications. Appl. Sci. 2018, 8, 1438. [Google Scholar] [CrossRef]
- Avanzare Materials. Available online: https://www.avanzarematerials.com/es/ (accessed on 11 April 2024).

| Sikadur 52 | Comp. A | Comp. B | Mixture |
| Mixture proportion (in volume and weight) | 2 | 1 | |
| Density at 20 °C [g/cm3] | 1.1 | 1 | 1.1 |
| Viscosity at 20 °C [Pa·s] | 0.33 | ||
| Lifespan at 20 °C of 1000 g [min] | 70 | ||
| SikaForce-422 L45 | Polyol | Isocyanate | Mixture |
| Mixture proportion (in weight) | 100 | 25 | |
| Mixture proportion (in volume) | 100 | 19 | |
| Viscosity at 23 °C [mPa·s] | 115,000 | 300 | 45,000 |
| Density (before curing) [g/cm3] | 1.60 | 1.23 | 1.53 |
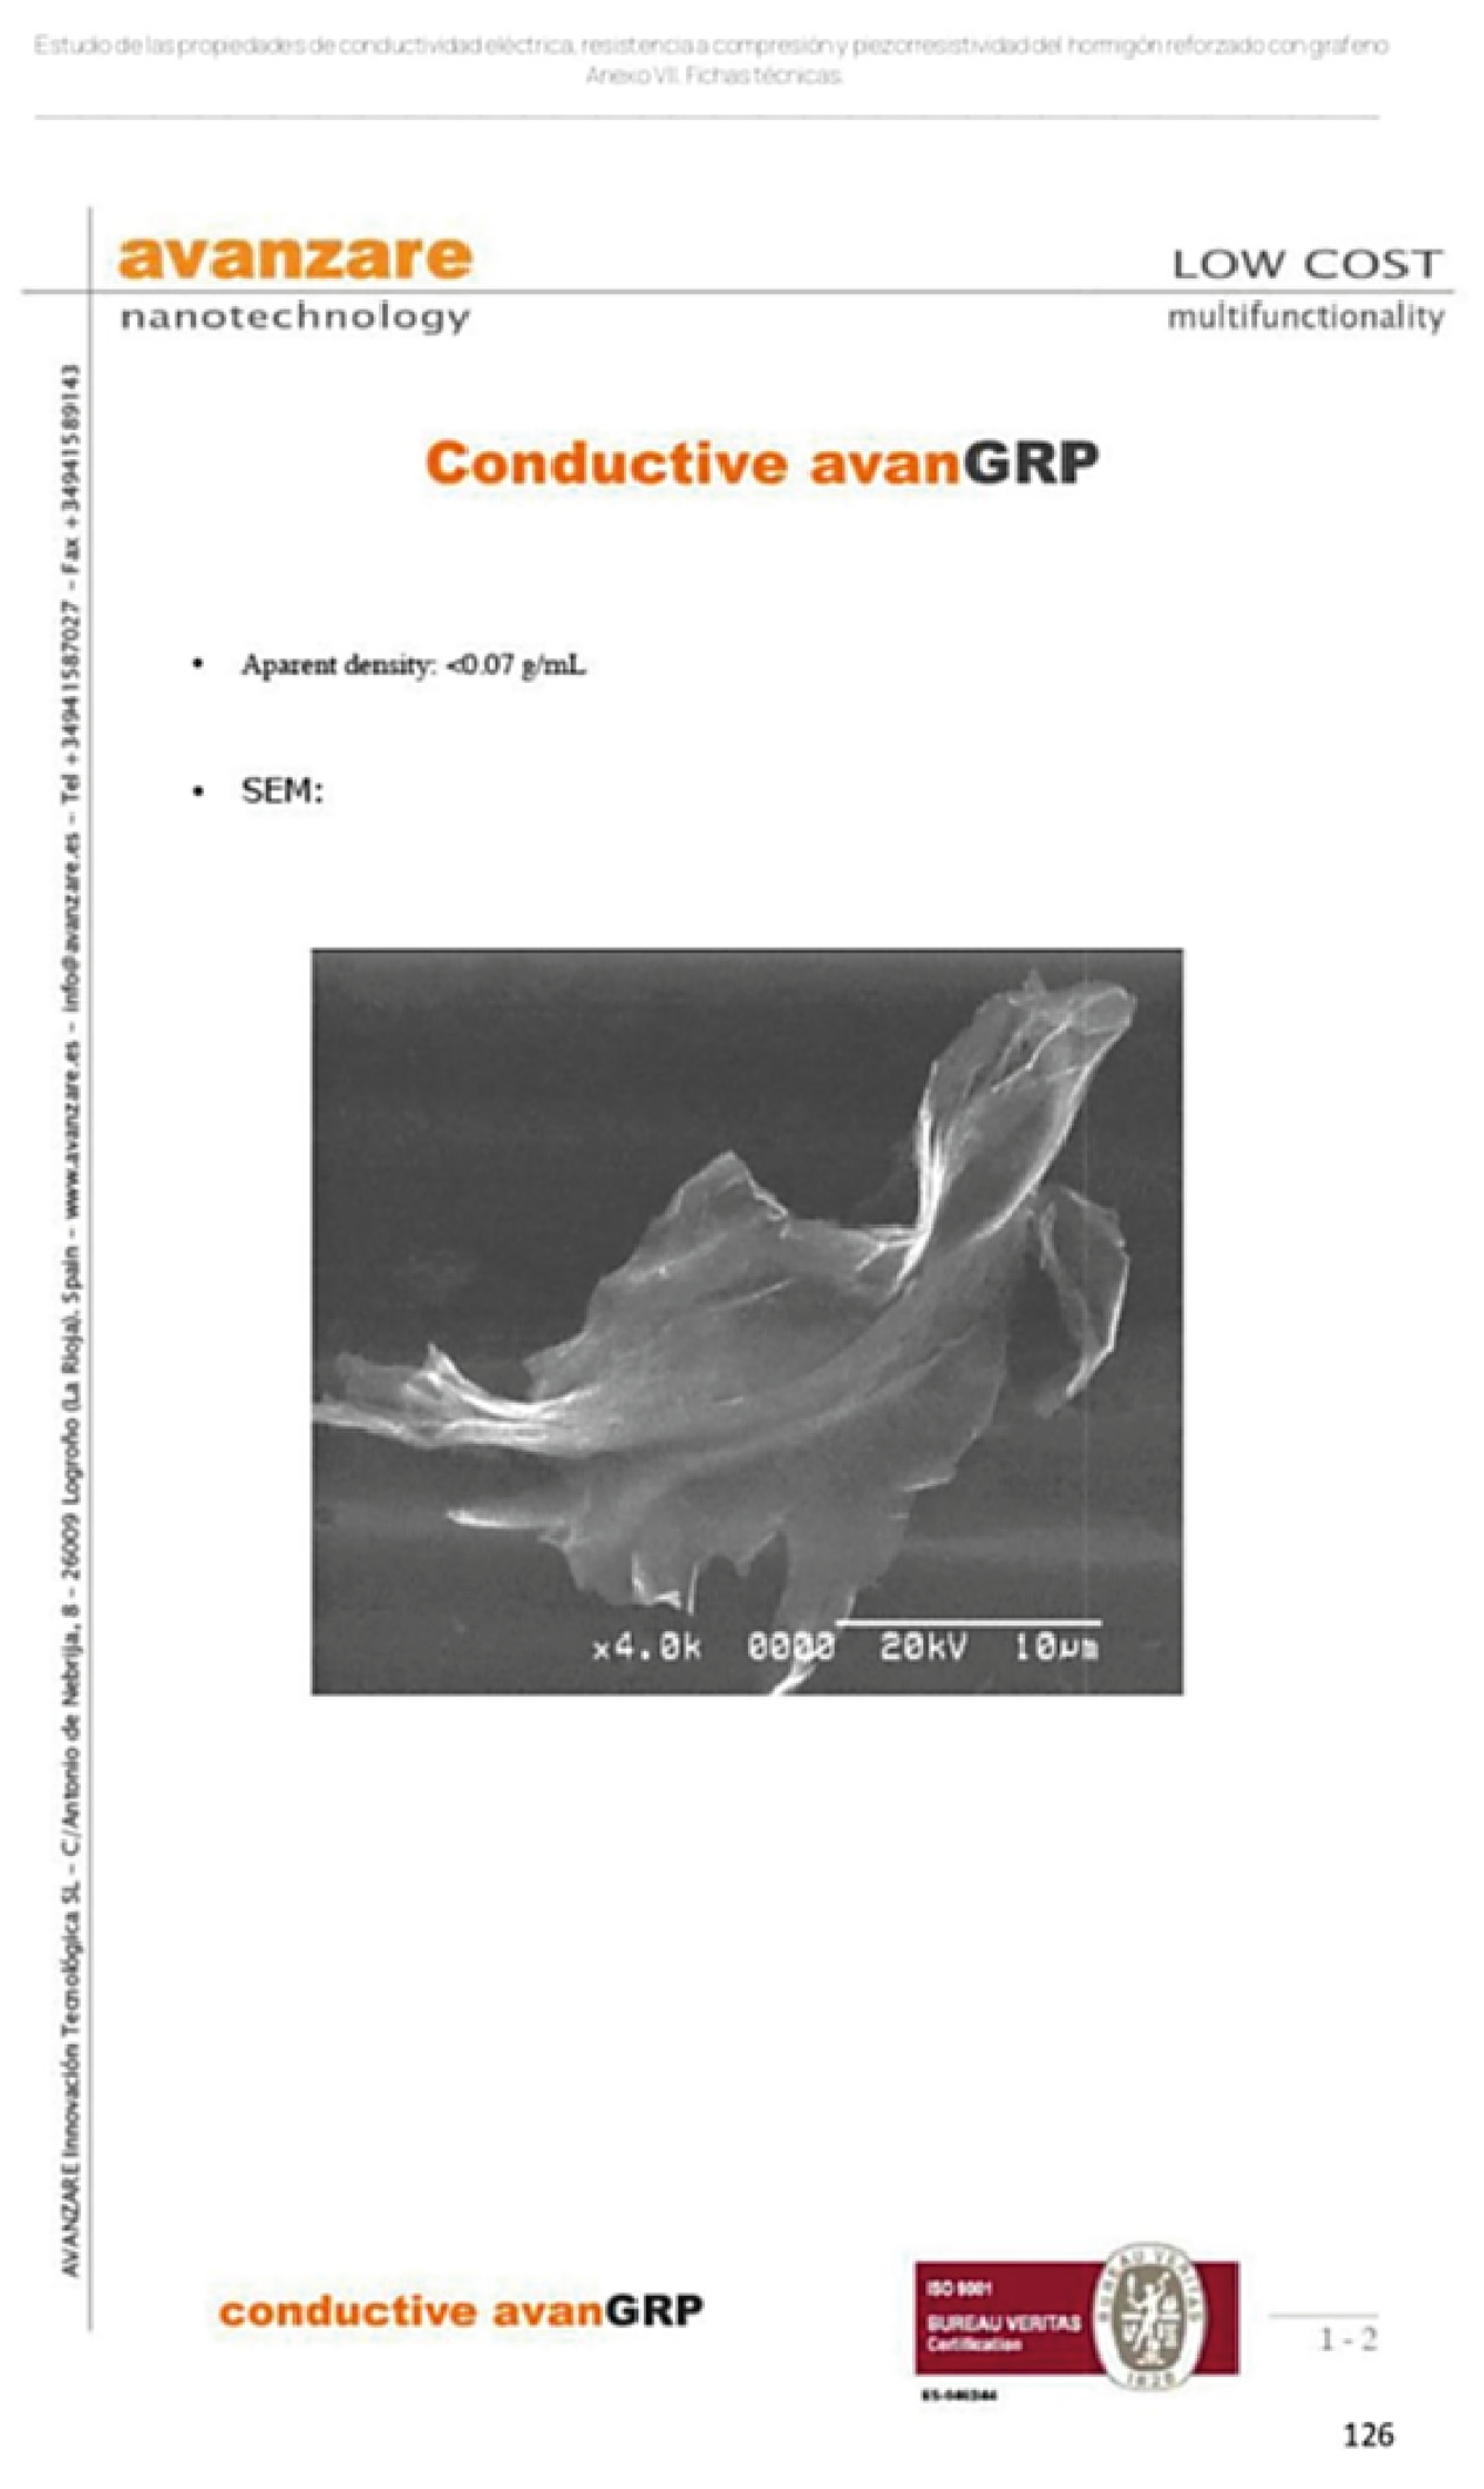
| Lateral size (LD50) [μm] | 7 |
| Average thickness [nm] | 3 |
| Oxygen content (XPS) | <1% |
| BET [m2/g] | 70 |
| Average number of layers: multilayer | 5–10 |
| Conductivity [S/m] | ||||||
|---|---|---|---|---|---|---|
| GNP Volume [%] | ||||||
| 0 | 2.45031 × 10⁻⁶ | 4.8048 × 10⁻⁶ | 96 | 8.6456 × 10⁻⁶ | 8.2306 × 10⁻⁶ | −5 |
| 5 | 5.5927 × 10⁻⁶ | 5.33131 × 10⁻⁶ | −5 | 8.8115 × 10⁻⁶ | 8.9032 × 10⁻⁶ | 1 |
| 10 | 5.6875 × 10⁻⁶ | 5.1471 × 10⁻⁶ | −10 | 8.9118 × 10⁻⁶ | 8.9454 × 10⁻⁶ | 0 |
| 15 | 5.557 × 10⁻⁶ | 5.2811 × 10⁻⁶ | −5 | 8.931 × 10⁻⁶ | 8.9831 × 10⁻⁶ | 1 |
| 20 | 5.8982 × 10⁻⁶ | 5.3225 × 10⁻⁶ | −10 | 8.9964 × 10⁻⁶ | 9.0192 × 10⁻⁶ | 0 |
| 25 | 5.30402 × 10⁻⁶ | 5.34 × 10⁻⁶ | 1 | 9.0335 × 10⁻⁶ | 9.1076 × 10⁻⁶ | 1 |
| 40 | 5.6638 × 10⁻⁶ | 6.0478 × 10⁻⁶ | 7 | - | - | −5 |
| Sikadur 52 BC | Sikadur 52 AC | Sikadur Variation [%] | Sikaforce-422 L45 BC | Sikaforce-422 L45 AC | Sikaforce Variation [%] | |
| Mean standard deviation | 0.015 | 0.137 | - | 0.030 | 0.036 | - |
Disclaimer/Publisher’s Note: The statements, opinions and data contained in all publications are solely those of the individual author(s) and contributor(s) and not of MDPI and/or the editor(s). MDPI and/or the editor(s) disclaim responsibility for any injury to people or property resulting from any ideas, methods, instructions or products referred to in the content. |
© 2024 by the authors. Licensee MDPI, Basel, Switzerland. This article is an open access article distributed under the terms and conditions of the Creative Commons Attribution (CC BY) license (https://creativecommons.org/licenses/by/4.0/).
Share and Cite
Fernández, P.R.; García, C.A. Analysis of Electrical Conductivity in Commercial Adhesives Incorporating Graphene Nanoplatelets for Industrial Applications. Polymers 2025, 17, 47. https://doi.org/10.3390/polym17010047
Fernández PR, García CA. Analysis of Electrical Conductivity in Commercial Adhesives Incorporating Graphene Nanoplatelets for Industrial Applications. Polymers. 2025; 17(1):47. https://doi.org/10.3390/polym17010047
Chicago/Turabian StyleFernández, Pablo Rodríguez, and Cristina Alía García. 2025. "Analysis of Electrical Conductivity in Commercial Adhesives Incorporating Graphene Nanoplatelets for Industrial Applications" Polymers 17, no. 1: 47. https://doi.org/10.3390/polym17010047
APA StyleFernández, P. R., & García, C. A. (2025). Analysis of Electrical Conductivity in Commercial Adhesives Incorporating Graphene Nanoplatelets for Industrial Applications. Polymers, 17(1), 47. https://doi.org/10.3390/polym17010047