Article

Exploring the Interplay Between Soaked Time, Exposed Area, and Solution Volume on Mineral Loss in Enamel and Dentin

Department of Cariology and Operative Dentistry, Graduate School of Medical and Dental Sciences, Institute of Science Tokyo, Tokyo 113-8510, Japan
*
Author to whom correspondence should be addressed.
Crystals 2026, 16(4), 238; https://doi.org/10.3390/cryst16040238
Submission received: 12 March 2026 / Revised: 29 March 2026 / Accepted: 31 March 2026 / Published: 2 April 2026
(This article belongs to the Special Issue Novel Dental Materials for Caries Prevention)

Abstract

Soaking bovine tooth blocks in demineralization solution is a widely used method to simulate caries-like demineralization for further experimental studies. The objective of this study was to evaluate the degree and depth of mineral loss in bovine enamel and dentin blocks under various controlled conditions and to investigate the relationships between these factors and mineral loss, providing guidance for researchers to achieve targeted demineralization outcomes. A total of 54 enamel blocks and 54 dentin blocks were divided into 18 groups according to the exposed area and solution volume and then immersed in demineralization solution. Micro-CT scans were performed before immersion, as well as after 1, 2, 3, 7, and 10 days of immersion. The results were analyzed using data analysis software and subsequently summarized into graphical representations. The analysis revealed that soaking time and solution volume showed positive correlations with mineral loss, whereas the exposed area was negatively correlated with mineral loss. Mean mineral loss increased significantly with immersion time in all groups (e.g., from 6314 to 25,670 vol%·μm in the dentin 3 × 3 mm2, 50 mL group, p < 0.05). After 7 days, specimens immersed in larger solution volumes showed significantly greater mineral loss than those immersed in smaller volumes (p < 0.05). In addition, larger exposed areas resulted in greater mineral loss after 3 days of immersion. Mean mineral loss followed a power function relationship with time when the solution volume was sufficiently high relative to the exposed surface area. In contrast, when the solution volume was limited, a logarithmic relationship between time and mineral loss was observed. Given its superior stability, the mean mineral loss appears to be a more reliable indicator for assessing tooth demineralization. Based on our results, more controlled and reproducible demineralization conditions can be achieved, which may contribute to improving the reliability of in vitro caries models and facilitating the evaluation of preventive and therapeutic strategies.

1. Introduction

Oral health is a crucial aspect of both physical and mental well-being and has a profound impact on patients’ quality of life [1,2]. Dental caries is the most prevalent infectious disease in humans and represents a significant global public health issue [3,4]. Unlike traditional treatments that focus on completely removing the diseased tissue from carious lesions, a growing concept called Minimal Intervention Dentistry is gaining acceptance [5,6,7,8]. A central element of this approach is Regenerative Dentistry, a revolutionary concept that encourages dental research to advance and integrate scientific discoveries into future treatment strategies [9].
Researchers have developed various dental materials to prevent caries, including mouth rinses, varnishes, and toothpaste. Although the process of dental caries is conceptually straightforward, its underlying mechanisms are highly complex [10]. To study the caries-inhibiting properties of dental materials, models simulating the caries process have been developed, such as in vitro demineralization using bacterially generated acids and in vitro demineralization/remineralization with pH-cycling systems [11].
Among these artificial caries models, the simplest approach is in vitro demineralization using acidic buffers, such as acidified gelatin gels or buffers containing lactic or acetic acid [12]. Some researchers use rapid acid attacks, such as applying high-concentration phosphoric acid or ethylenediaminetetraacetic acid (EDTA) solutions to the mineral surface for brief periods [13,14,15]. However, the demineralization induced by these solutions is much faster than in natural caries, leading to a simpler and more superficial demineralization layer. For example, enamel demineralization induced by 37% phosphoric acid for 90 s results in a typical ‘fish-scale’ appearance under scanning electron microscopy (SEM), and dentin demineralization by EDTA reveals a rough surface with collapsed collagen and exposed dentin tubules [15].
Interestingly, in in vitro studies, it has been observed that a layer composed of small inter-crystallite spaces, often inaccessible to large molecules and containing air or vapor with a low refractive index, is absent after rapid acid attack but becomes evident when the acid attack is slower and less severe [16]. This suggests that artificial caries formed through rapid acid attack may lack the porous layer found in natural caries or models using milder acid attacks. It may be attributed to the absence of remineralization during rapid and severe acid attacks. In contrast, gradual acid penetration leads to the formation of a porous structure and continuous ion release from partially dissolved minerals, which may influence subsequent remineralization due to residual crystals and limited ion diffusion within the lesion [17]. Therefore, the results from specimens treated with rapid acid attacks may not fully reflect the behavior of natural caries. Consequently, a demineralization method that is not only simple to execute but also more accurately simulates the structure of natural caries should be considered.
In 1979, Van Dijk first proposed a relatively mild demineralization solution containing Ca, P and acid, which provides an undersaturated environment with respect to Hydroxyapatite (HAp) [18]. J.M. ten Cate et al. optimized the concentration to 1.5 mM CaCl2, 0.9 mM KH2PO4, and 50 mM acetic acid [19]. This solution, which more closely represents natural caries, is now widely used for soaking not only bovine teeth but extracted human teeth to simulate caries-induced demineralization in cariology experiments [20,21,22,23,24]. However, when designing demineralization protocols, factors such as soaking time, exposed tooth area, and solution volume can significantly influence the demineralization outcomes, making it challenging to achieve the desired degree and depth of demineralization. Researchers typically select conditions based on their specific needs, but without established guidelines, pilot experiments can be both time-consuming and costly. Furthermore, past studies often involved daily solution changes, which not only consumed more time but also led to unnecessary waste. Moreover, few studies have investigated the relationship between these conditions and mineral loss.
Thus, the objective of this study is to evaluate the degree and depth of mineral loss in both enamel and dentin under specific conditions with soaking times of 1, 2, 3, 7, and 10 days, exposed areas of 5 mm × 5 mm, 3 mm × 3 mm, and 2 mm × 2 mm, and solution volumes of 5 mL, 15 mL and 50 mL [25,26,27]. The study aims to establish the relationship between soaking time, exposed area, and solution volume with mineral loss and to provide guidance for researchers to achieve the desired demineralization outcomes. The null hypotheses were that soaking time, area, and solution volume would have no significant effect on demineralization.

2. Materials and Methods

2.1. Enamel Specimen Preparation

A flowchart detailing the specimen preparation process is shown in Figure 1. A priori sample size calculation was performed using G*Power (version 3.1, Heinrich Heine University Düsseldorf, Düsseldorf, Germany). Based on an effect size of 0.6, a significance level of 0.05, and a statistical power of 0.80 for an ANOVA design, the required sample size was estimated to be at least 6 specimens per group. Forty-five non-damaged, freshly extracted bovine incisors, under 30 months old, were stored frozen until the experiment. Soft tissues were thoroughly removed under running water. Enamel specimens were prepared by cutting the crown into blocks measuring 6 mm × 6 mm × 2 mm, 4 mm × 4 mm × 2 mm, and 3 mm × 3 mm × 2 mm using a low-speed diamond saw (Isomet; Buehler, Lake Bluff, IL, USA) (n = 18/group). One crown could yield one 6 mm × 6 mm × 2 mm, one 4 mm × 4 mm × 2 mm enamel block, or two 3 mm × 3 mm × 2 mm enamel blocks. To facilitate precise alignment of serial images, a reference marker approximately 1.0 mm in diameter was created on the lateral surface of each specimen using a diamond bur (440SS ISO #010; Shofu, Kyoto, Japan). The blocks were then embedded in epoxy resin (EpoxiCure 2; Buehler, Lake Bluff, IL, USA), with only the flat enamel surfaces exposed. These surfaces were polished under continuous water-cooling using silicon carbide papers with grit sizes ranging from 600 to 2000 (Fuji Star; Sankyo Rikagaku, Saitama, Japan). Acid-resistant nail varnish (RAVEN RED 721; Revlon, New York, NY, USA) was applied to the exposed surfaces to create windows of 5 mm × 5 mm, 3 mm × 3 mm, and 2 mm × 2 mm for further operations. All specimens were ultrasonicated in deionized water (Milli-Q water; Millipore, Billerica, MA, USA) for 3 min to remove the smear layer produced during cutting and polishing.

2.2. Dentin Specimen Preparation

Twenty-seven bovine incisor roots were used to prepare dentin specimens. The roots were carefully treated to remove all soft tissues while preserving the dentin surface. Each root was split in half and further cut into blocks measuring 6 mm × 6 mm, 4 mm × 4 mm, and 3 mm × 3 mm with flat surfaces using a low-speed diamond saw (n = 18/group). These dentin specimens underwent the same processing procedure as the enamel specimens.

2.3. Specimen Treatment Protocols

The specimens were randomly allocated into 18 groups (n = 6 per group) based on the area of the exposed surface, as shown in Table 1.
Each specimen was immersed in the corresponding volume of demineralization solution. In this experiment, the demineralization solution consisted of 1.5 mM CaCl2, 0.9 mM KH2PO4, and 50 mM acetic acid, and the initial pH was adjusted to 4.5 using KOH. After immersion for 24 h, 48 h, 72 h, 7 days, and 10 days, the specimens were removed from the solution at each time point and individually scanned using micro-computed tomography (micro-CT). The specimens were handled with straight forceps, avoiding direct contact with the exposed surfaces. Following scanning, specimens were washed gently with deionized water to remove any residual solution, preventing interference with the demineralization results. All specimens were placed in a Bioshaker (BR-21UM; TAITEC, Saitama, Japan) at 37 °C with shaking at 100 rpm during the demineralization process.

2.4. Micro-CT Scanning

Micro-CT scanning was performed using an InspeXio SMX-100CT system (InspeXio SMX-100CT; Shimadzu, Kyoto, Japan) to assess enamel and dentin mineral loss. All specimens were scanned with the following parameters: 100 kV tube voltage, 50 μA current, 10.0 μm isotropic voxel dimensions, and 10 μm normal isotropic resolution, with a 400-s integration time. The distance from the X-ray source to the sample was 47.2 mm, and the distance from the X-ray source to the detector was 300 mm. Specimens were placed in a tube and positioned on a computer-controlled turntable, rotating 360° with 0.3° steps for each scan. To prevent drying, a wet wiper roll was positioned above the tube during scanning. A 0.2-mm-thick brass (Cu–Zn) filter was used to reduce beam-hardening effects. A mineral reference aluminum phantom (Phantoms; Ratoc System Engineering, Tokyo, Japan) was scanned each time the system was used to obtain information on mineral density calibration.

2.5. Data Analysis

The mineral density of the specimens was analyzed using 3D-BON software (TRI/3D-BON; Ratoc System Engineering, Tokyo, Japan), which provides both visualization and quantitative volumetric data of mineral density. Each scan generated data in the form of 250 images saved in 16-bit TIFF format, which were then reconstructed into 3D image stacks with a resolution of 1024 × 1024 pixels and an isotropic voxel size of 10 μm. CT values were converted to mineral density (gAl cm−3) using a calibration curve derived from scans of a mineral density phantom (Phantoms; Ratoc System Engineering, Tokyo, Japan). An aluminum step wedge with multiple density levels (2, 3, 4, 6, 8 gAl cm−3) and a pure aluminum wire (1.55 gAl cm−3) were scanned under the same conditions as the specimens. A linear regression analysis was performed to establish the relationship between CT values and mineral density (R2 > 0.98). The mean mineral density of each specimen was measured within a volume of interest (VOI) of 800 × 800 × 1000 μm3 centered on the treated window. Mineral density values (MD) were measured at intervals of 9.7 μm in depth from the VOI. Mean mineral loss (ML) (vol%·μm) and lesion depth (LD) (μm) were calculated from the MD profiles, with ML derived by subtracting the area under the curve before demineralization. LD was then defined as the depth at which the mineral density reached 95% of the maximum value within each specimen, based on the method proposed by ten Bosch et al. [28]. The ML and LD results were then compiled and analyzed using a spreadsheet software package (Microsoft Excel 2024 for Windows; Microsoft, Redmond, WA, USA), where the MD data and corresponding depths were imported for further calculation.
Data were expressed as means ± standard deviations, and statistical analysis was performed using SPSS for Windows (SPSS Version 29; SPSS, Chicago, IL, USA). A one-way analysis of variance (ANOVA) was conducted, followed by the Least Significant Difference (LSD) test. A significance level of p = 0.05 was used for all statistical tests.

3. Results

3.1. Enamel

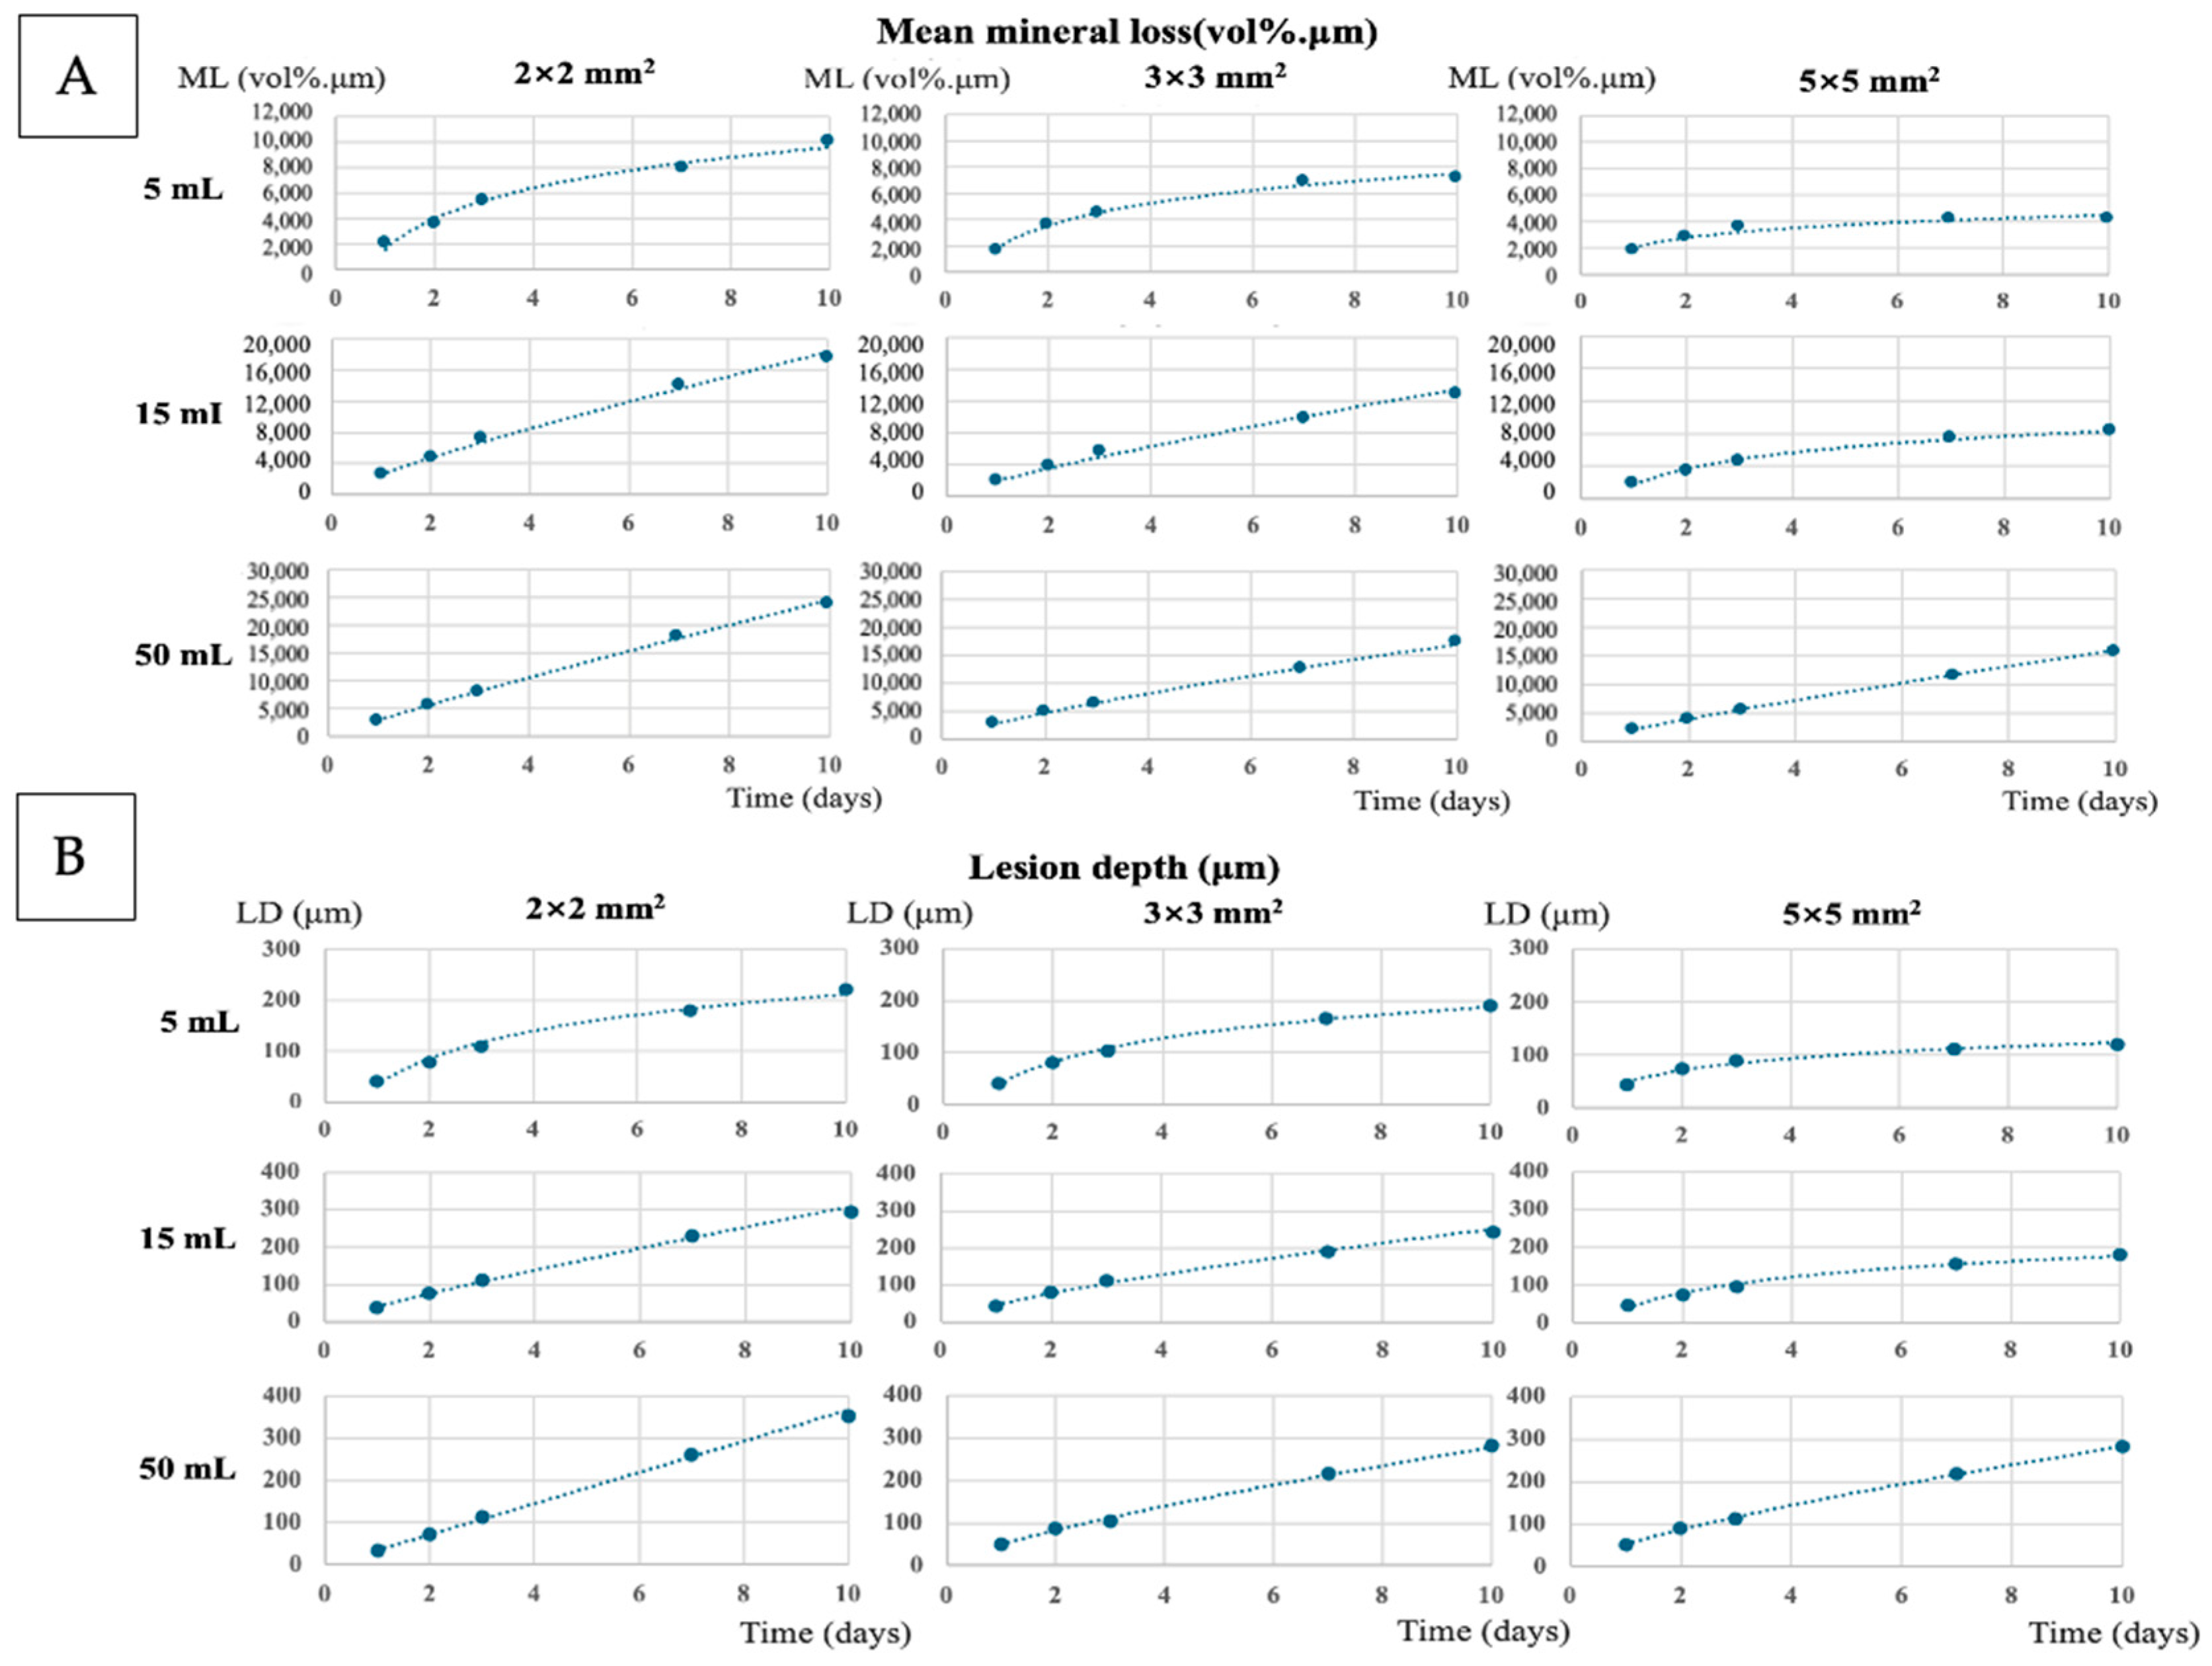
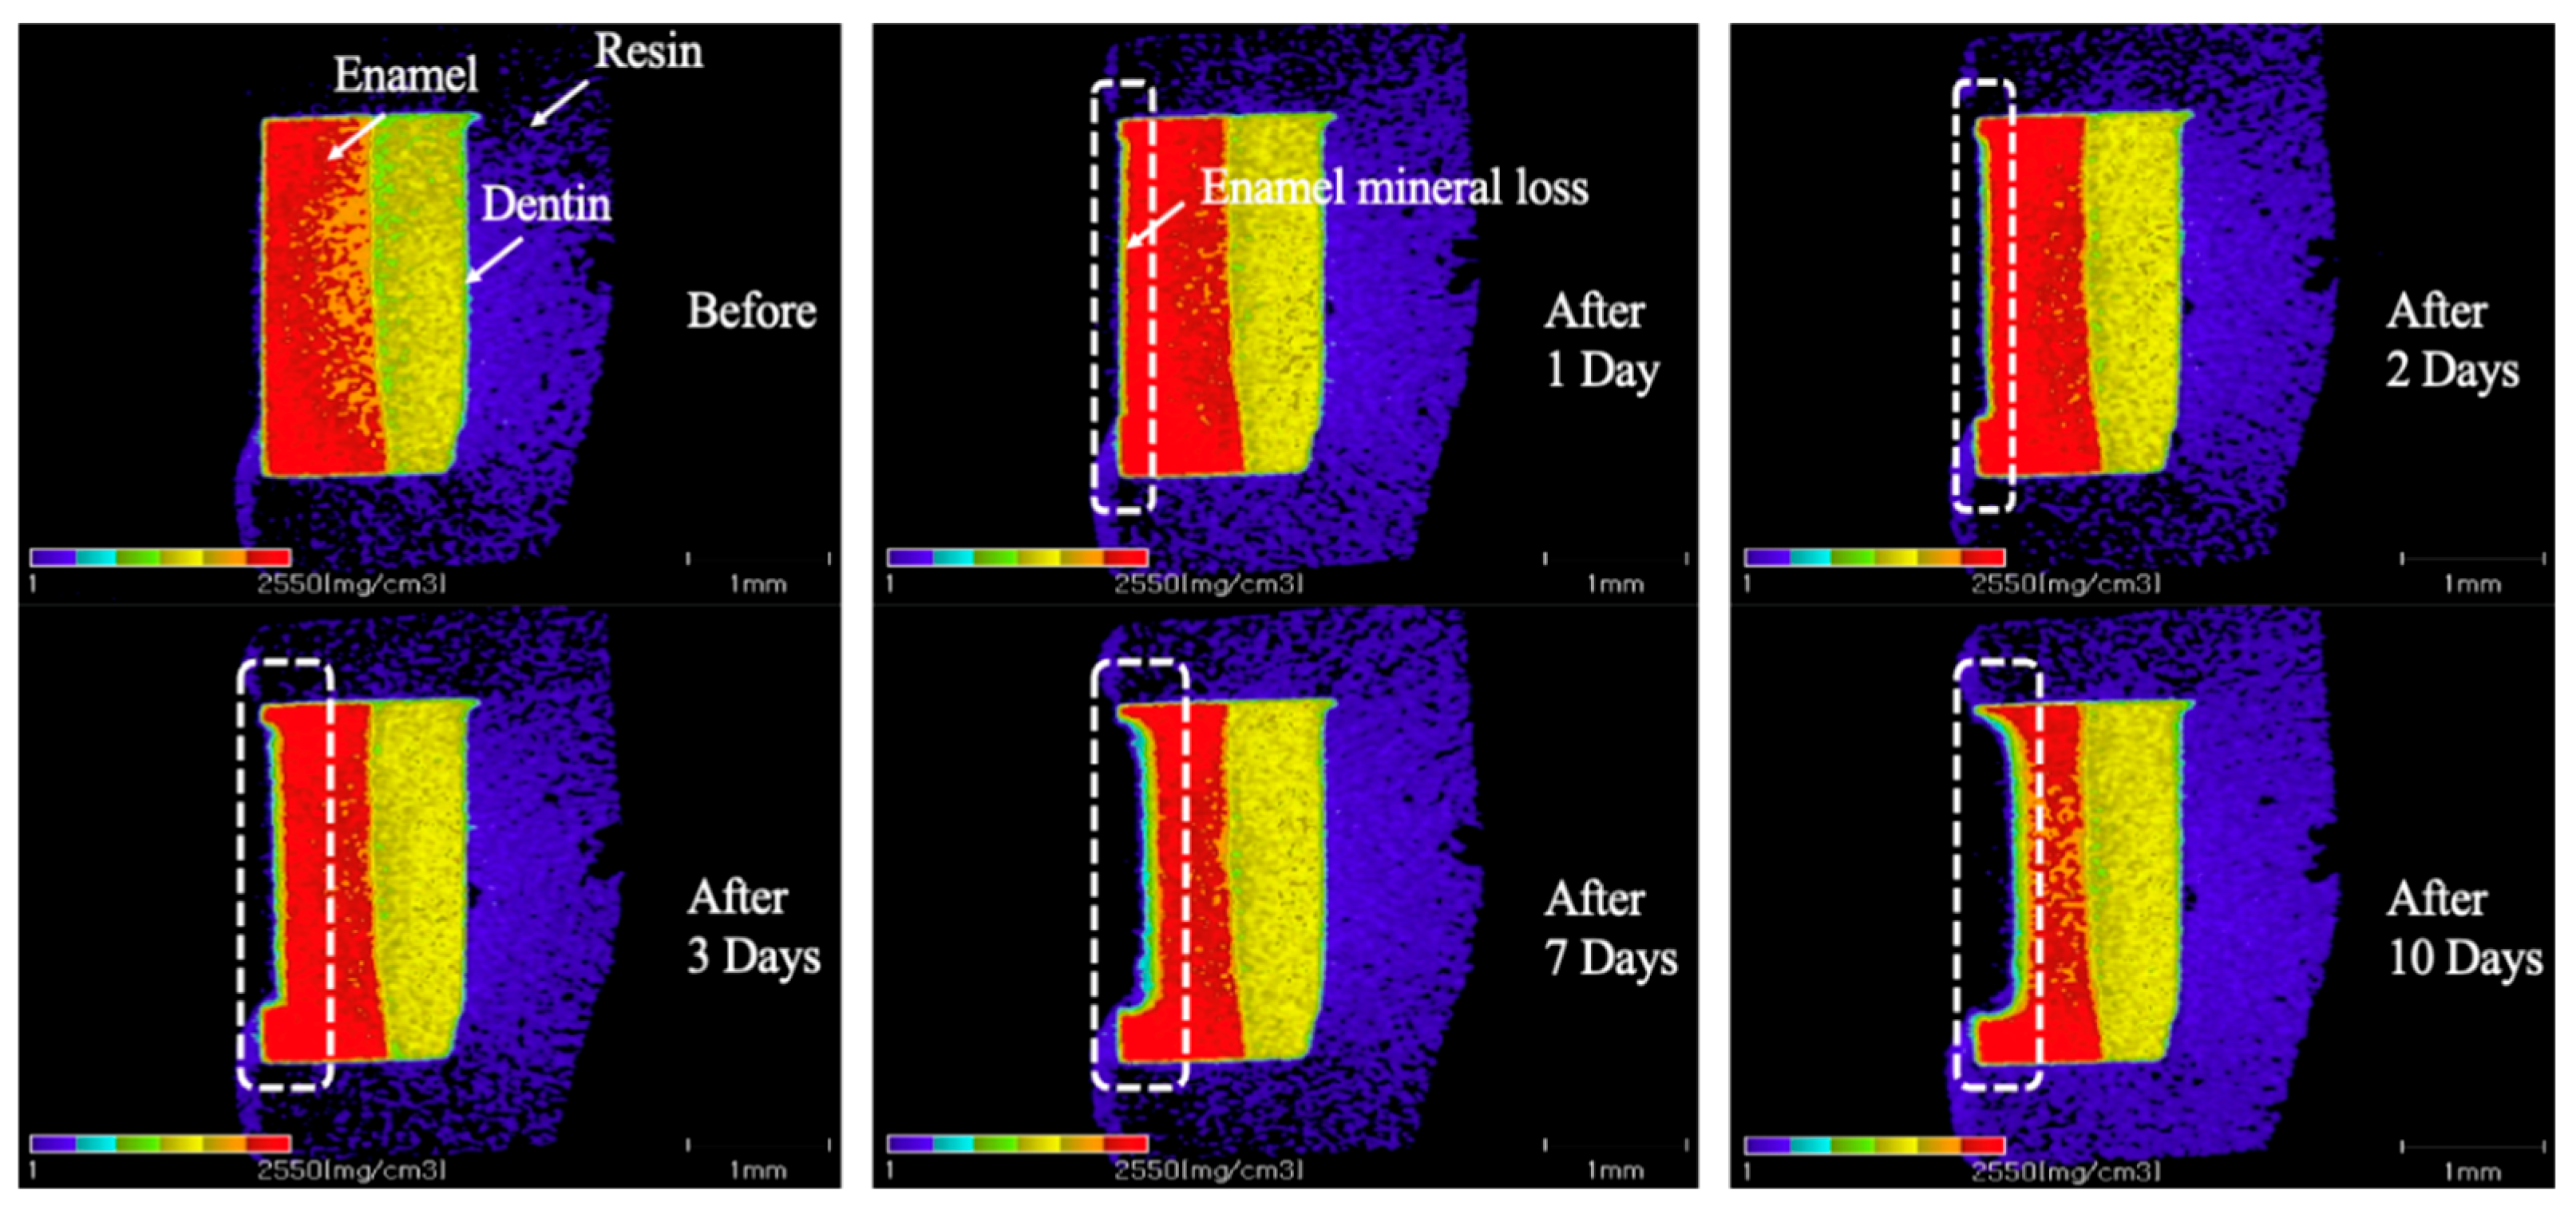
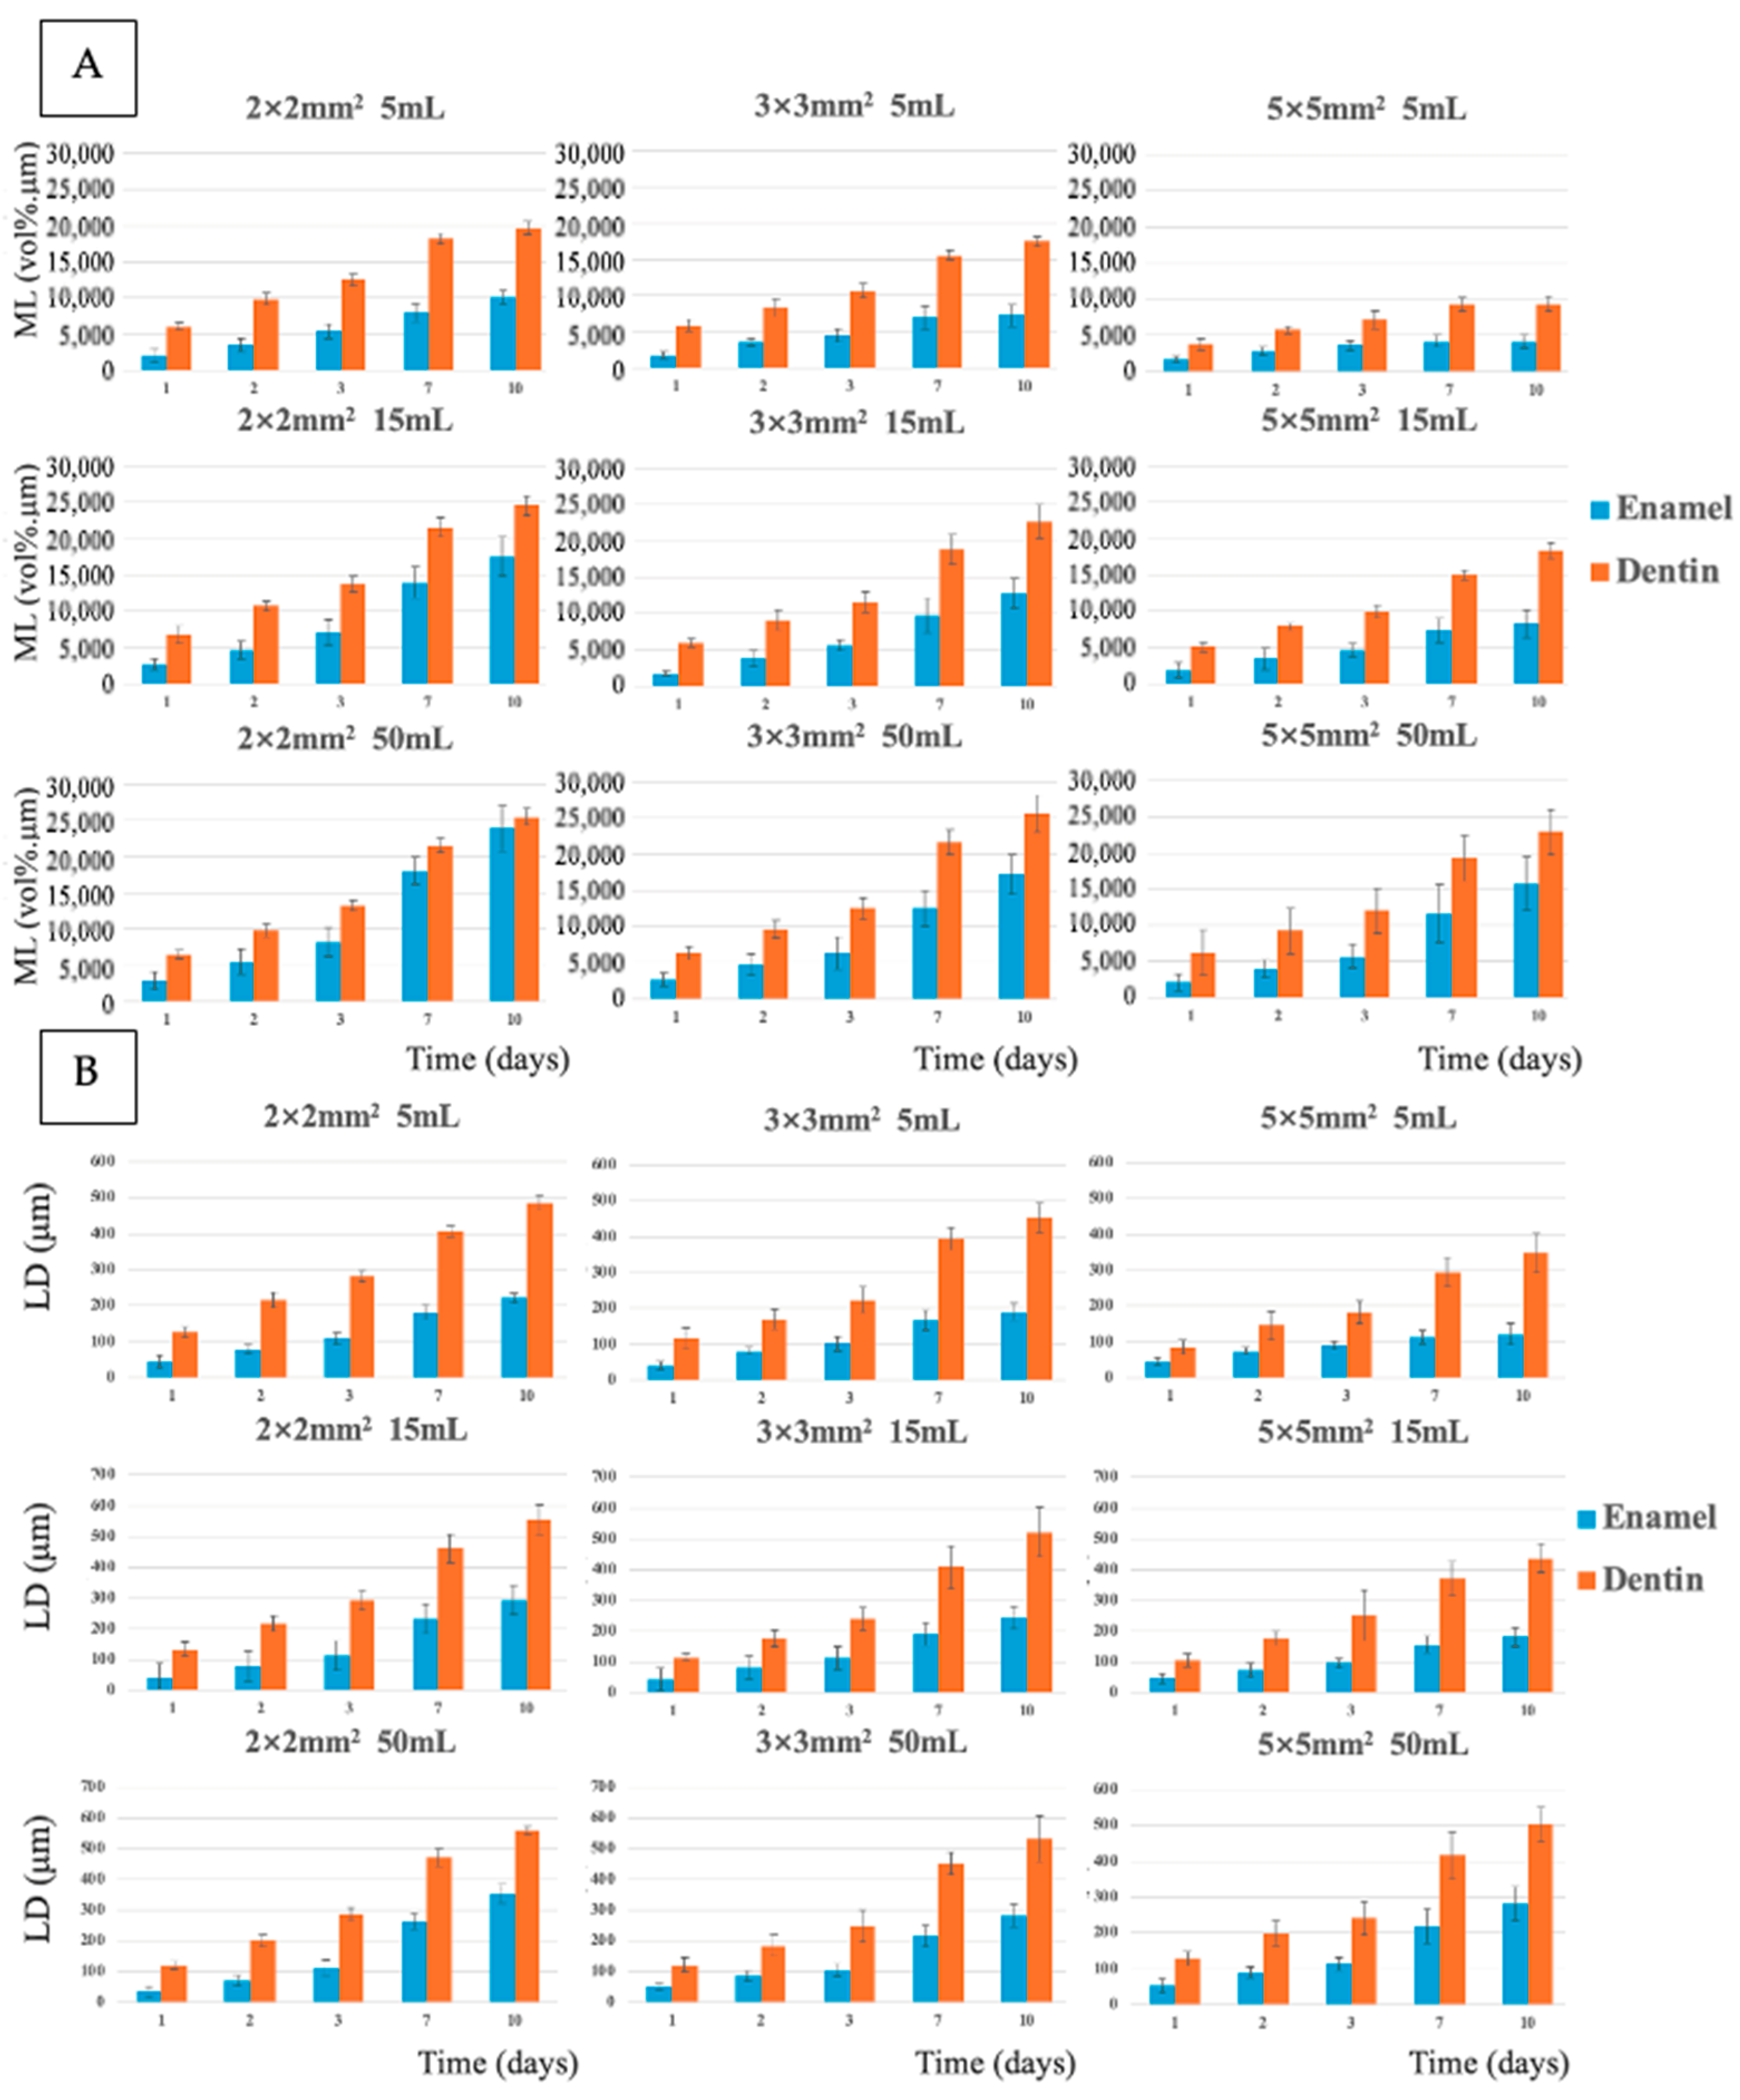
The average ML over time for each group is summarized in Figure 2A, and the LD for each group is shown in Figure 2B. The figures clearly demonstrate that the degree and depth of demineralization increased over time in all groups. Specifically, Groups E-2-15, E-2-50, E-3-15, and E-3-50 exhibited an approximate power function relationship, where mean mineral loss and lesion depth increased at a steady, consistent rate as time progressed. Conversely, the other groups showed a logarithmic relationship, with mean mineral loss and lesion depth increasing more rapidly at the beginning of the demineralization process, but the rate of increase slowed down over time. Representative 2D images of the enamel specimens are shown in Figure 3. These images illustrate the formation and deepening of lesions, with the visual differences becoming more pronounced as the demineralization period extended.
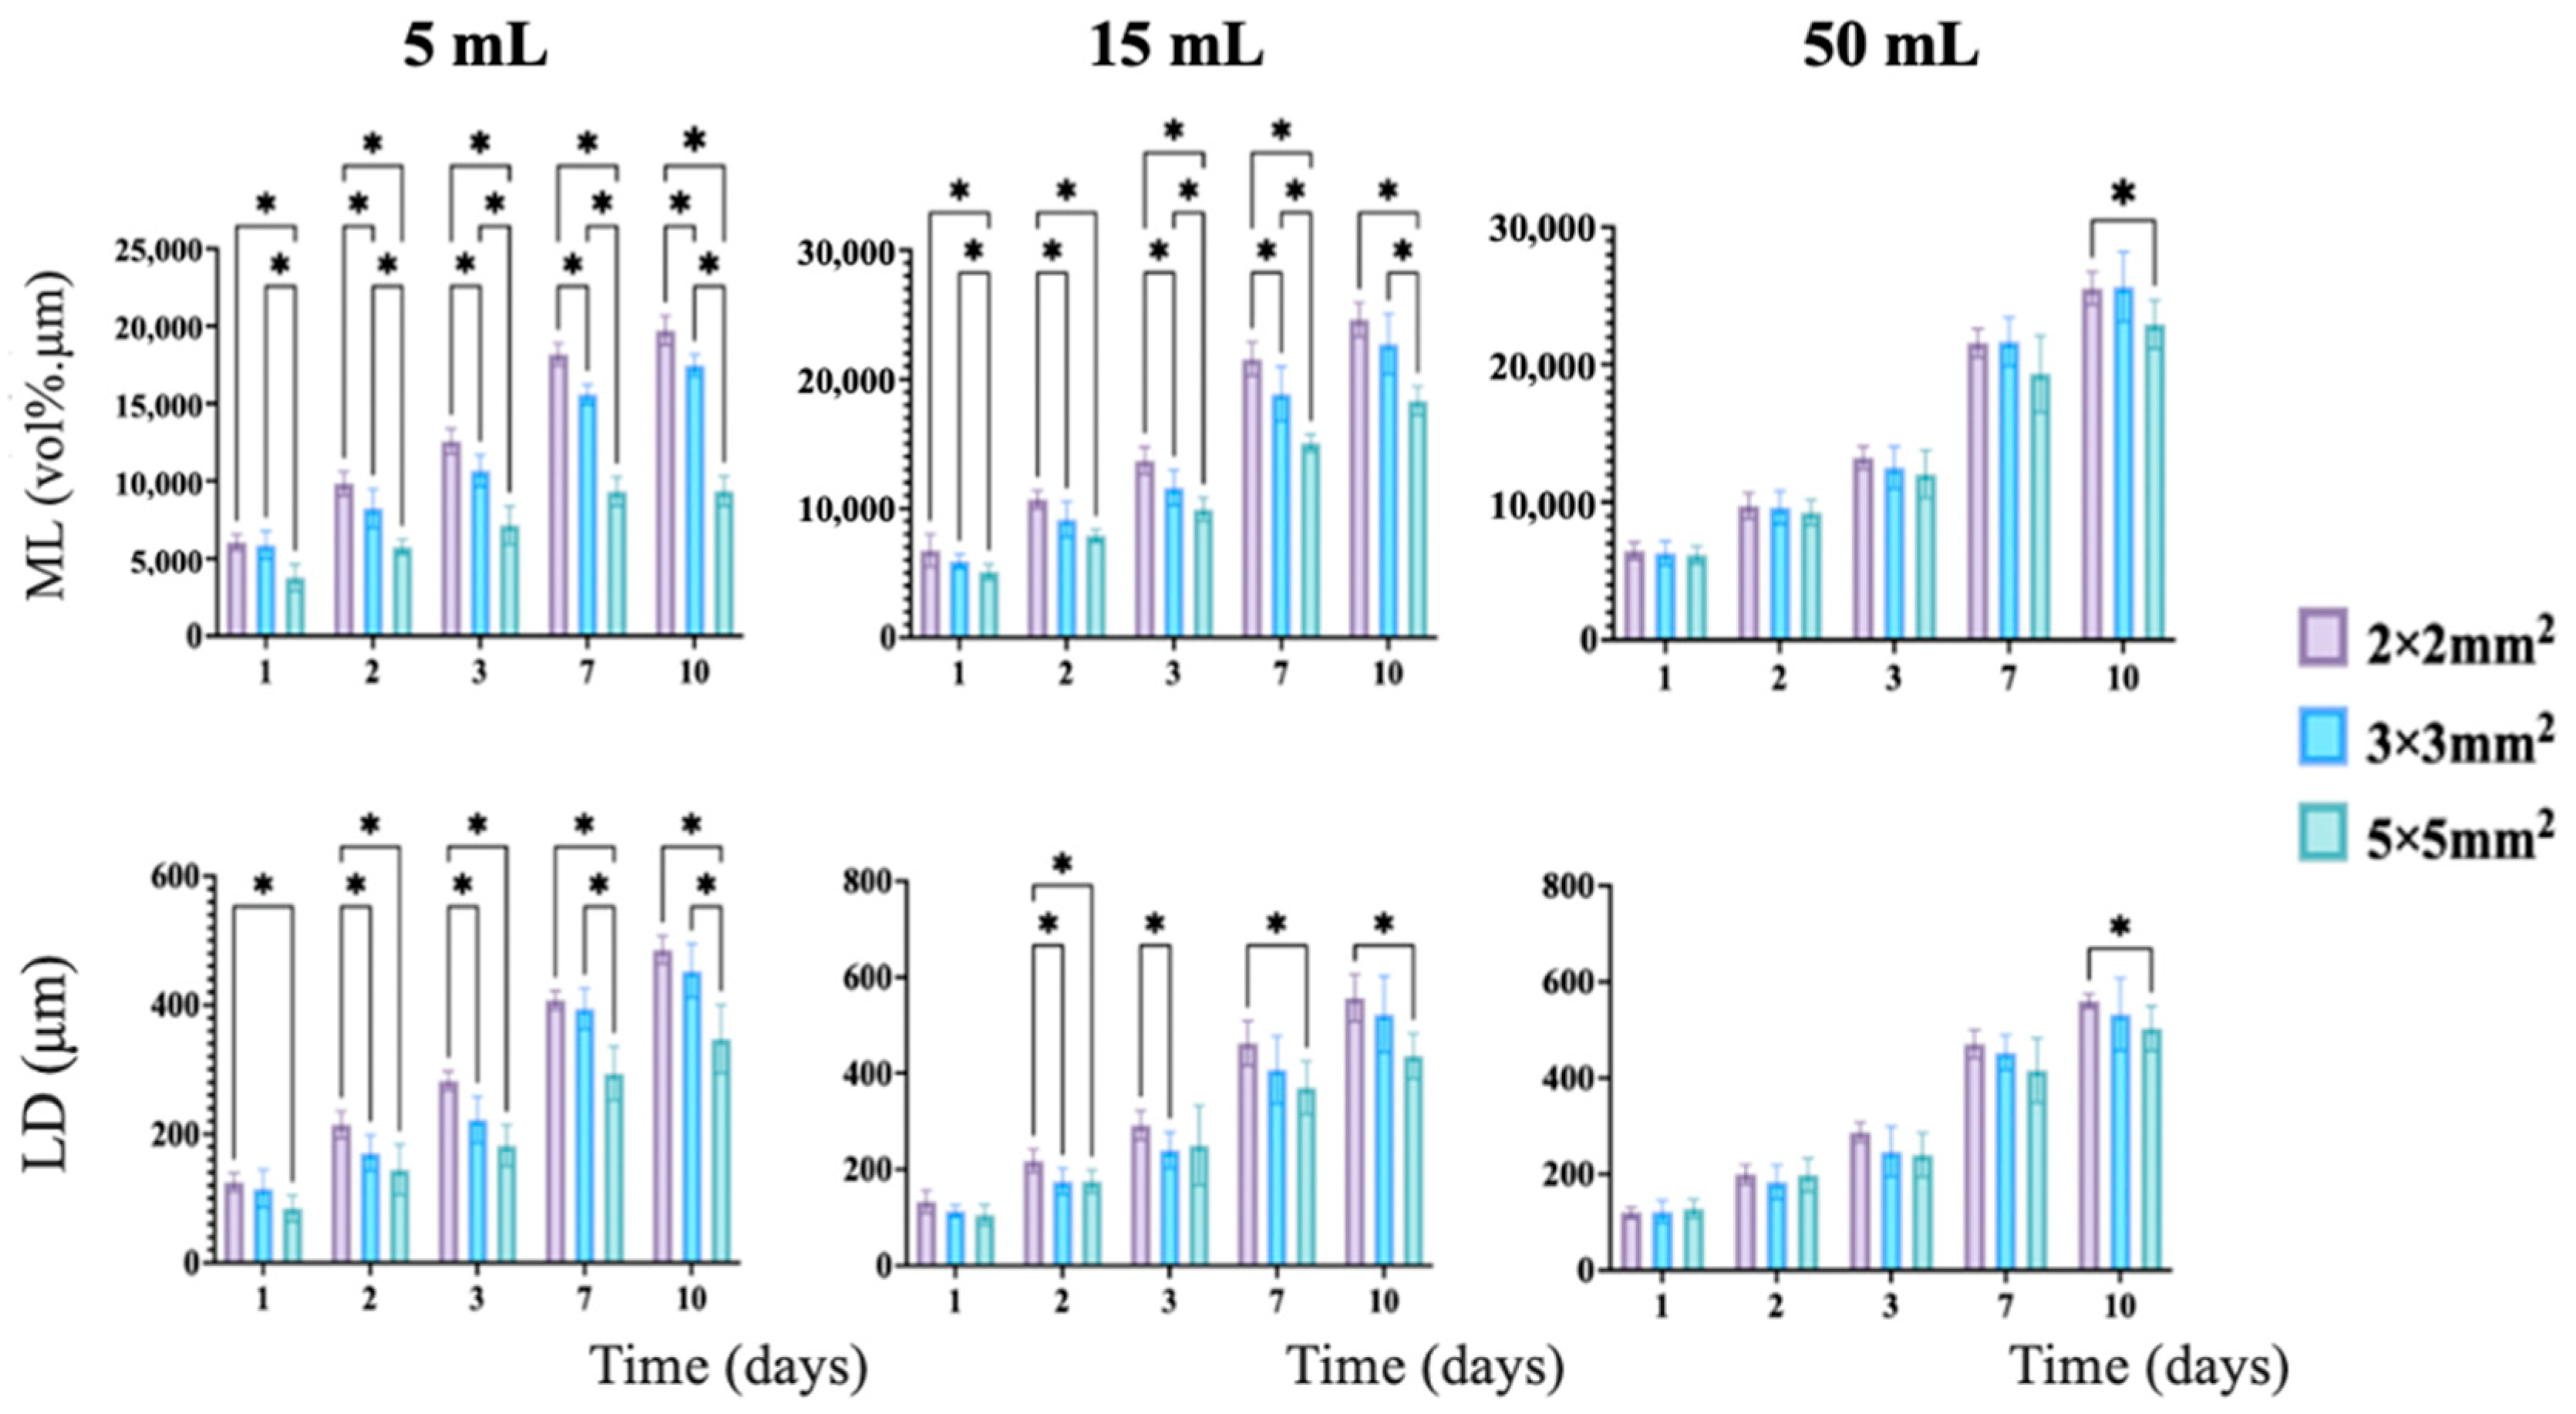
When the effect of exposed area on mineral loss was evaluated while controlling for time and solution volume, the data in Figure 4 were obtained. The results indicate that after 3 days of immersion, a significant difference in mineral loss was observed, regardless of the solution volume. As the demineralization process continued, the differences between the groups became more distinct, with smaller exposed areas leading to greater mineral loss. These findings suggested that when the solution volume was held constant, there was a negative correlation between exposed area and mineral loss, meaning that a smaller exposed area resulted in more mineral loss over time.
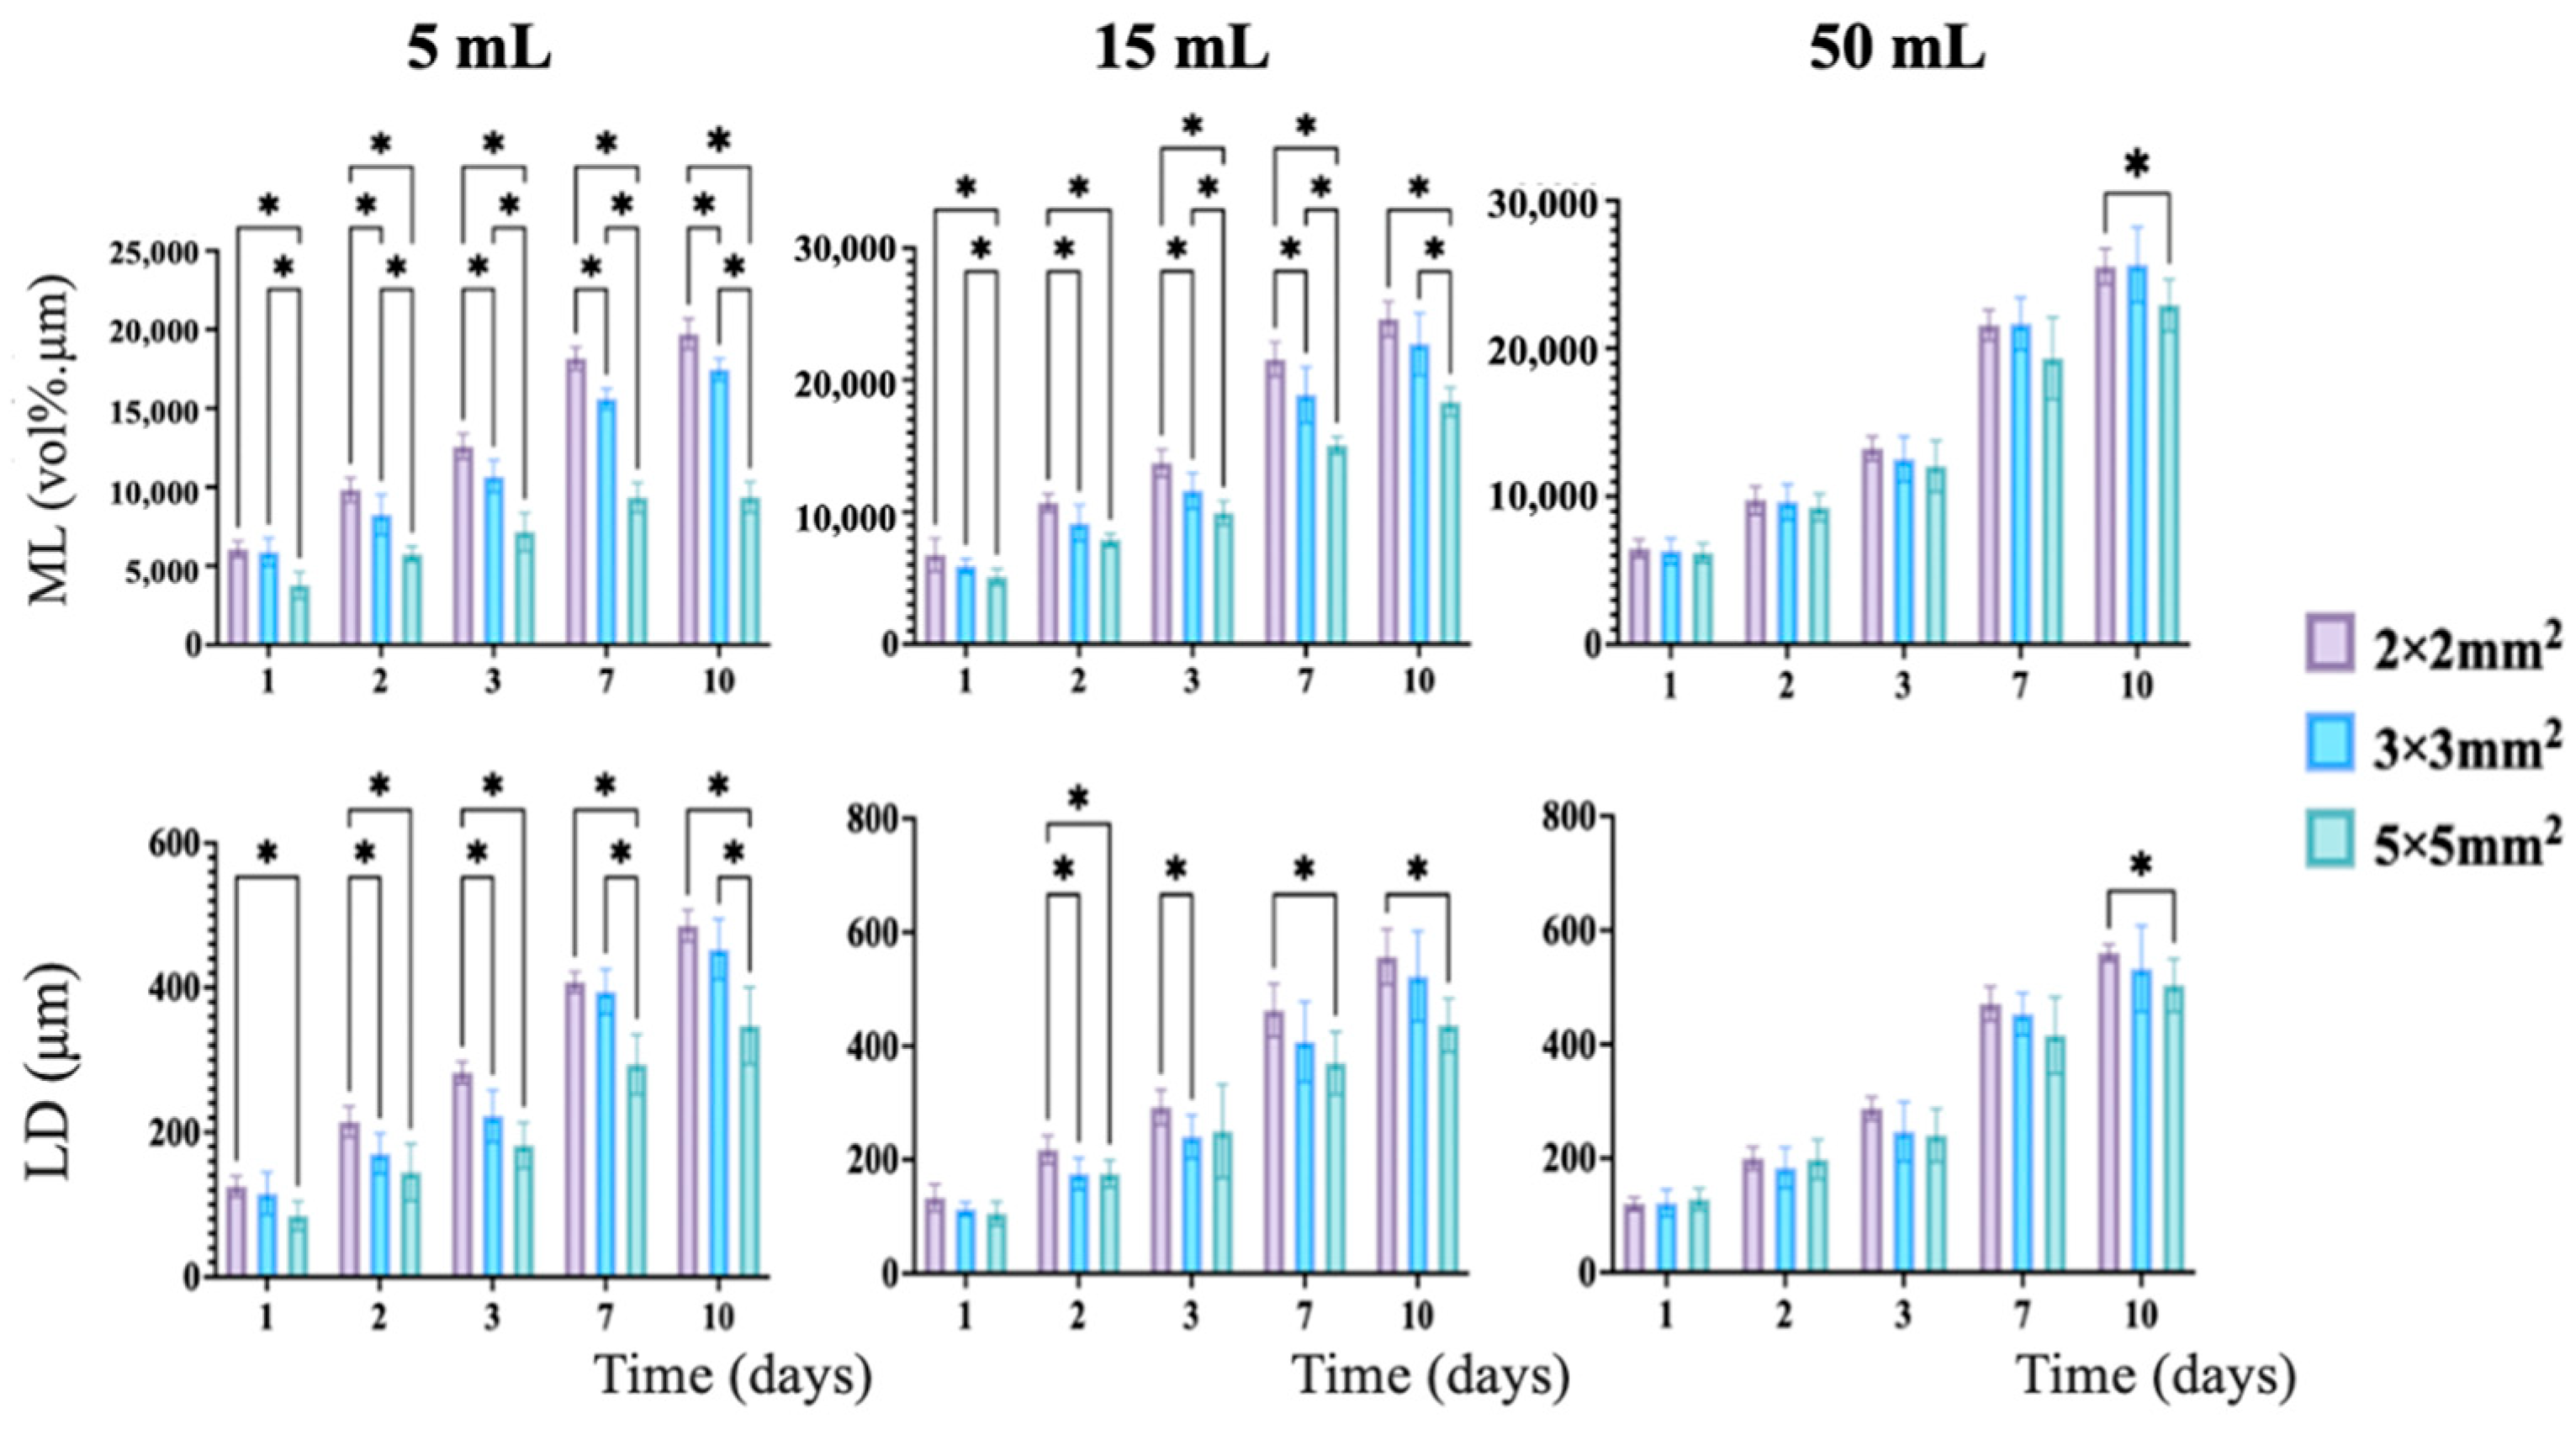
When controlling for time and exposed area, Figure 5 was generated, which highlights the relationship between solution volume and mineral loss. The data showed that after 3 days of immersion, a significant difference in mineral loss was evident between groups with different solution volumes. Furthermore, as time passed, this difference became even more noticeable. After 7 days, the groups with a larger volume of demineralization solution exhibited more substantial mineral loss compared to those with smaller volumes. These results indicated that there is a positive relationship between solution volume and mineral loss, meaning that a higher solution volume leads to more extensive demineralization over time.

3.2. Dentin

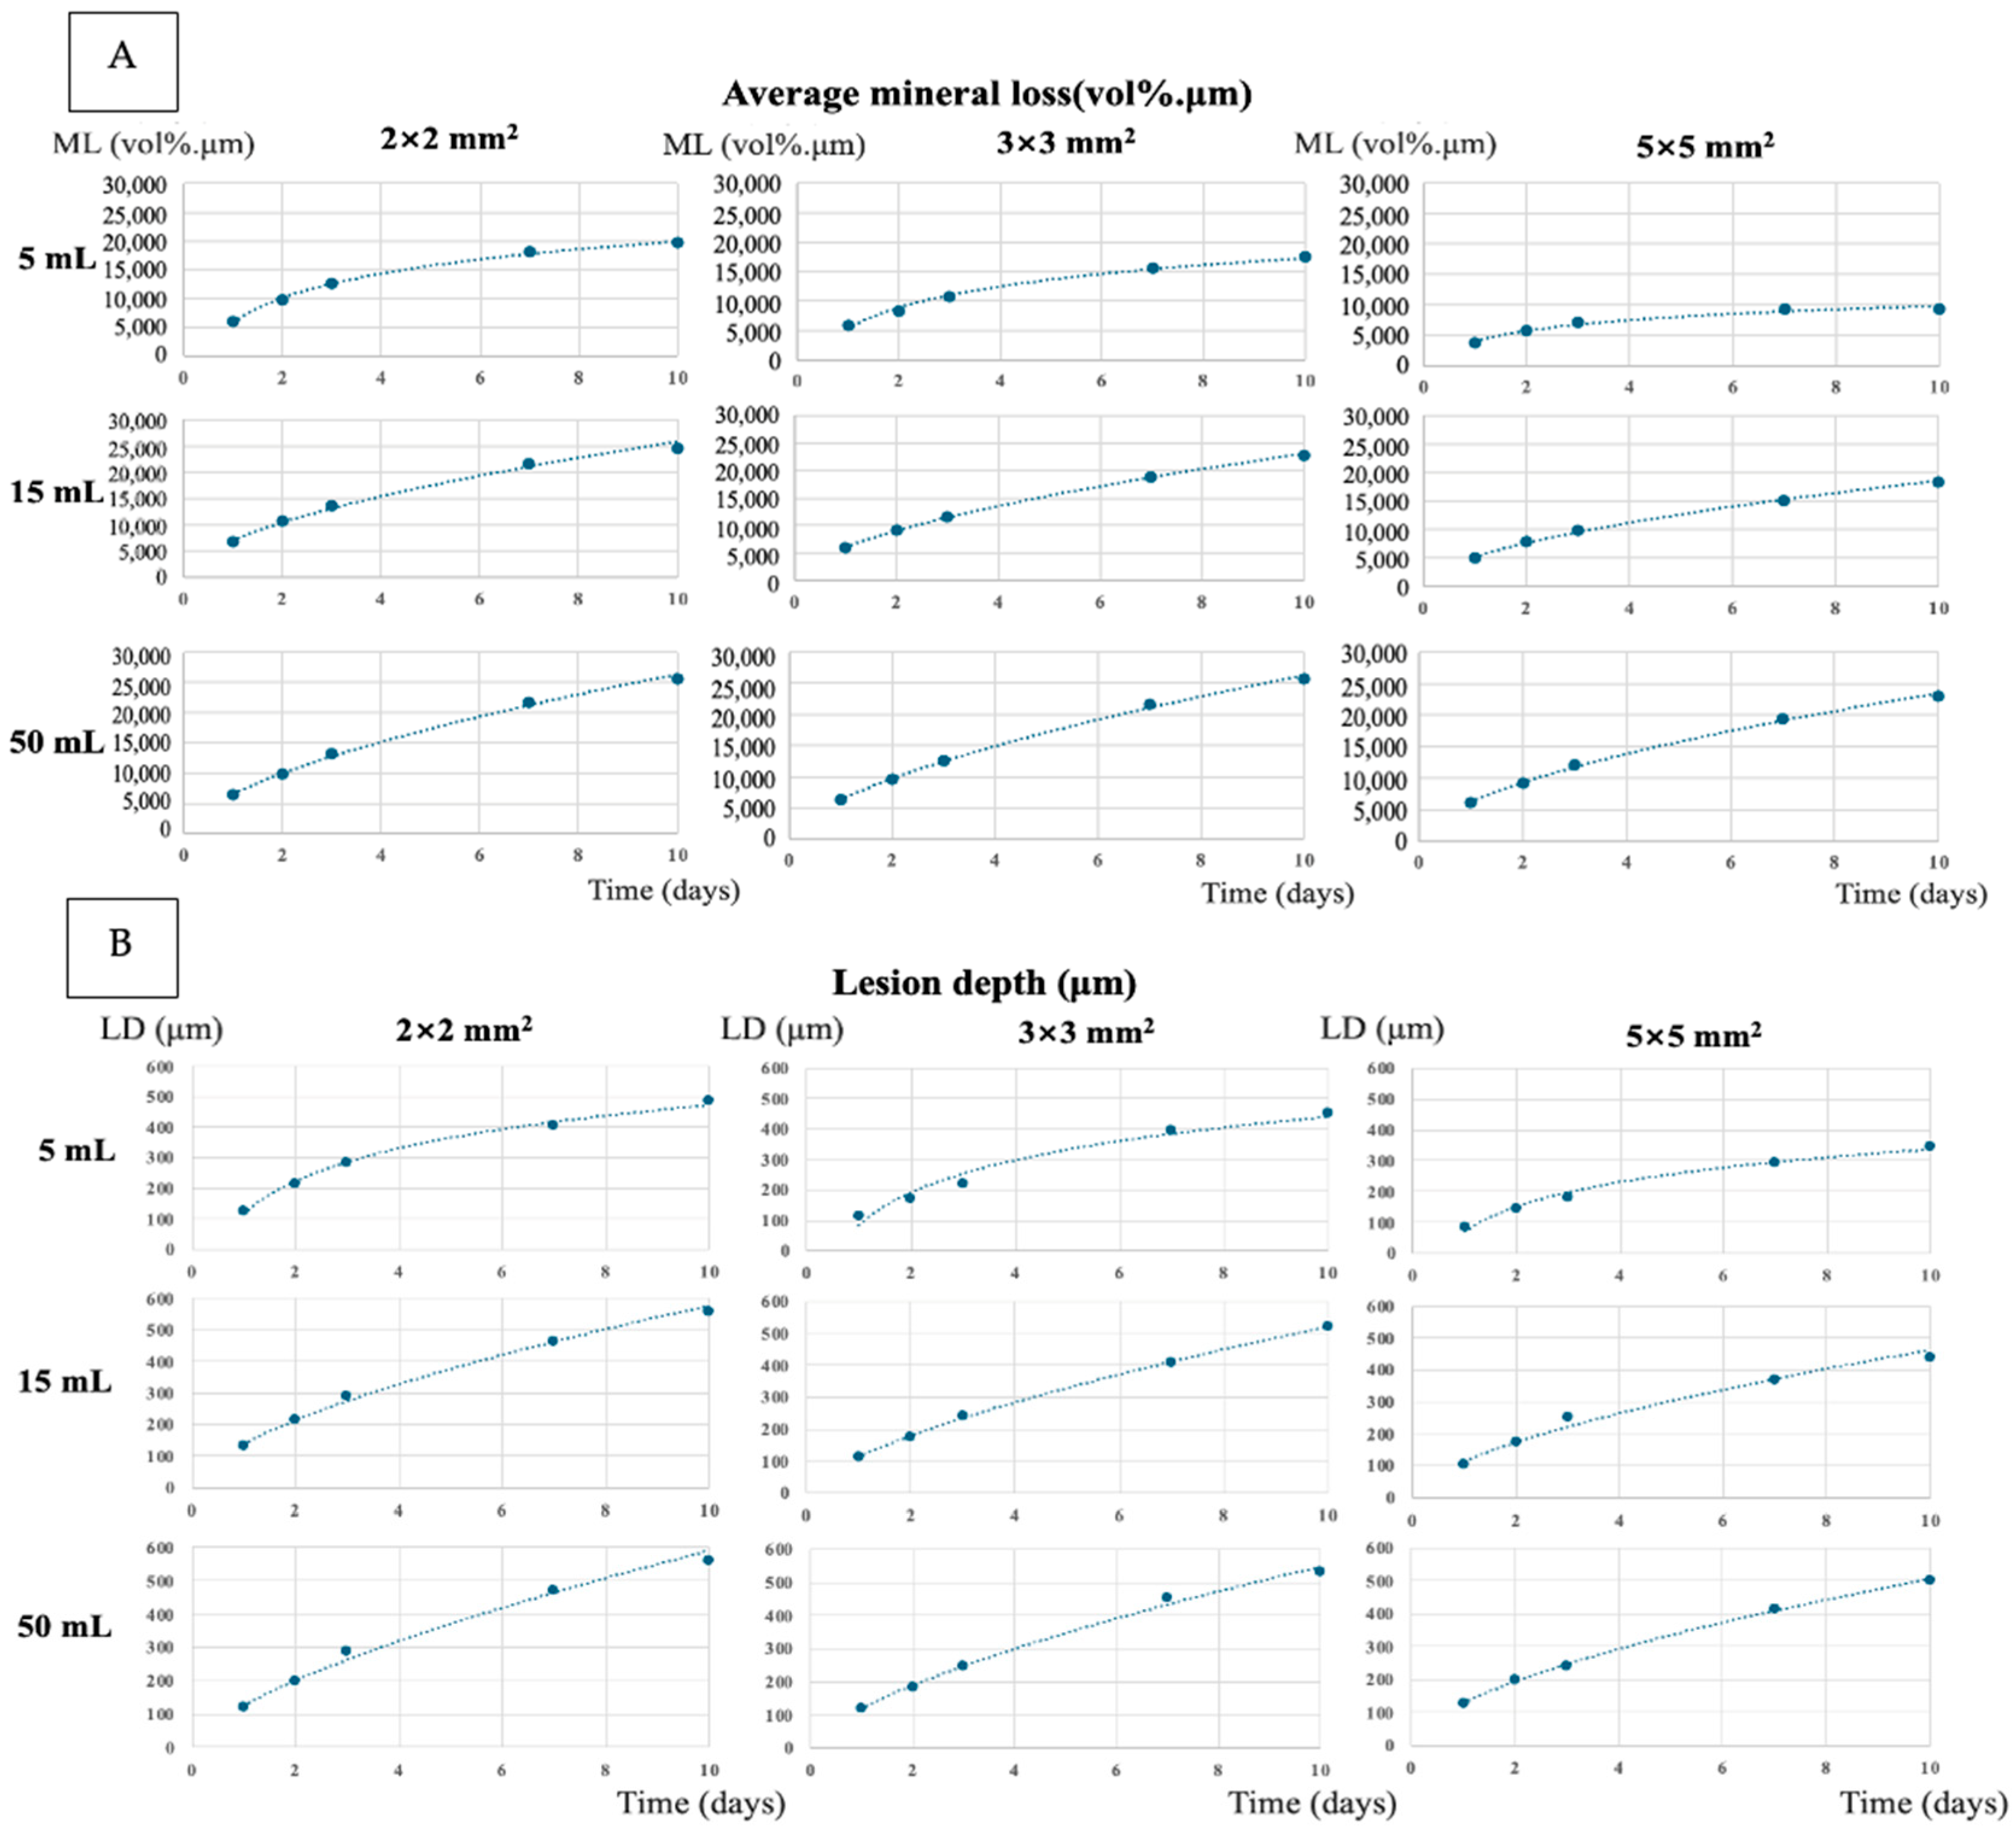
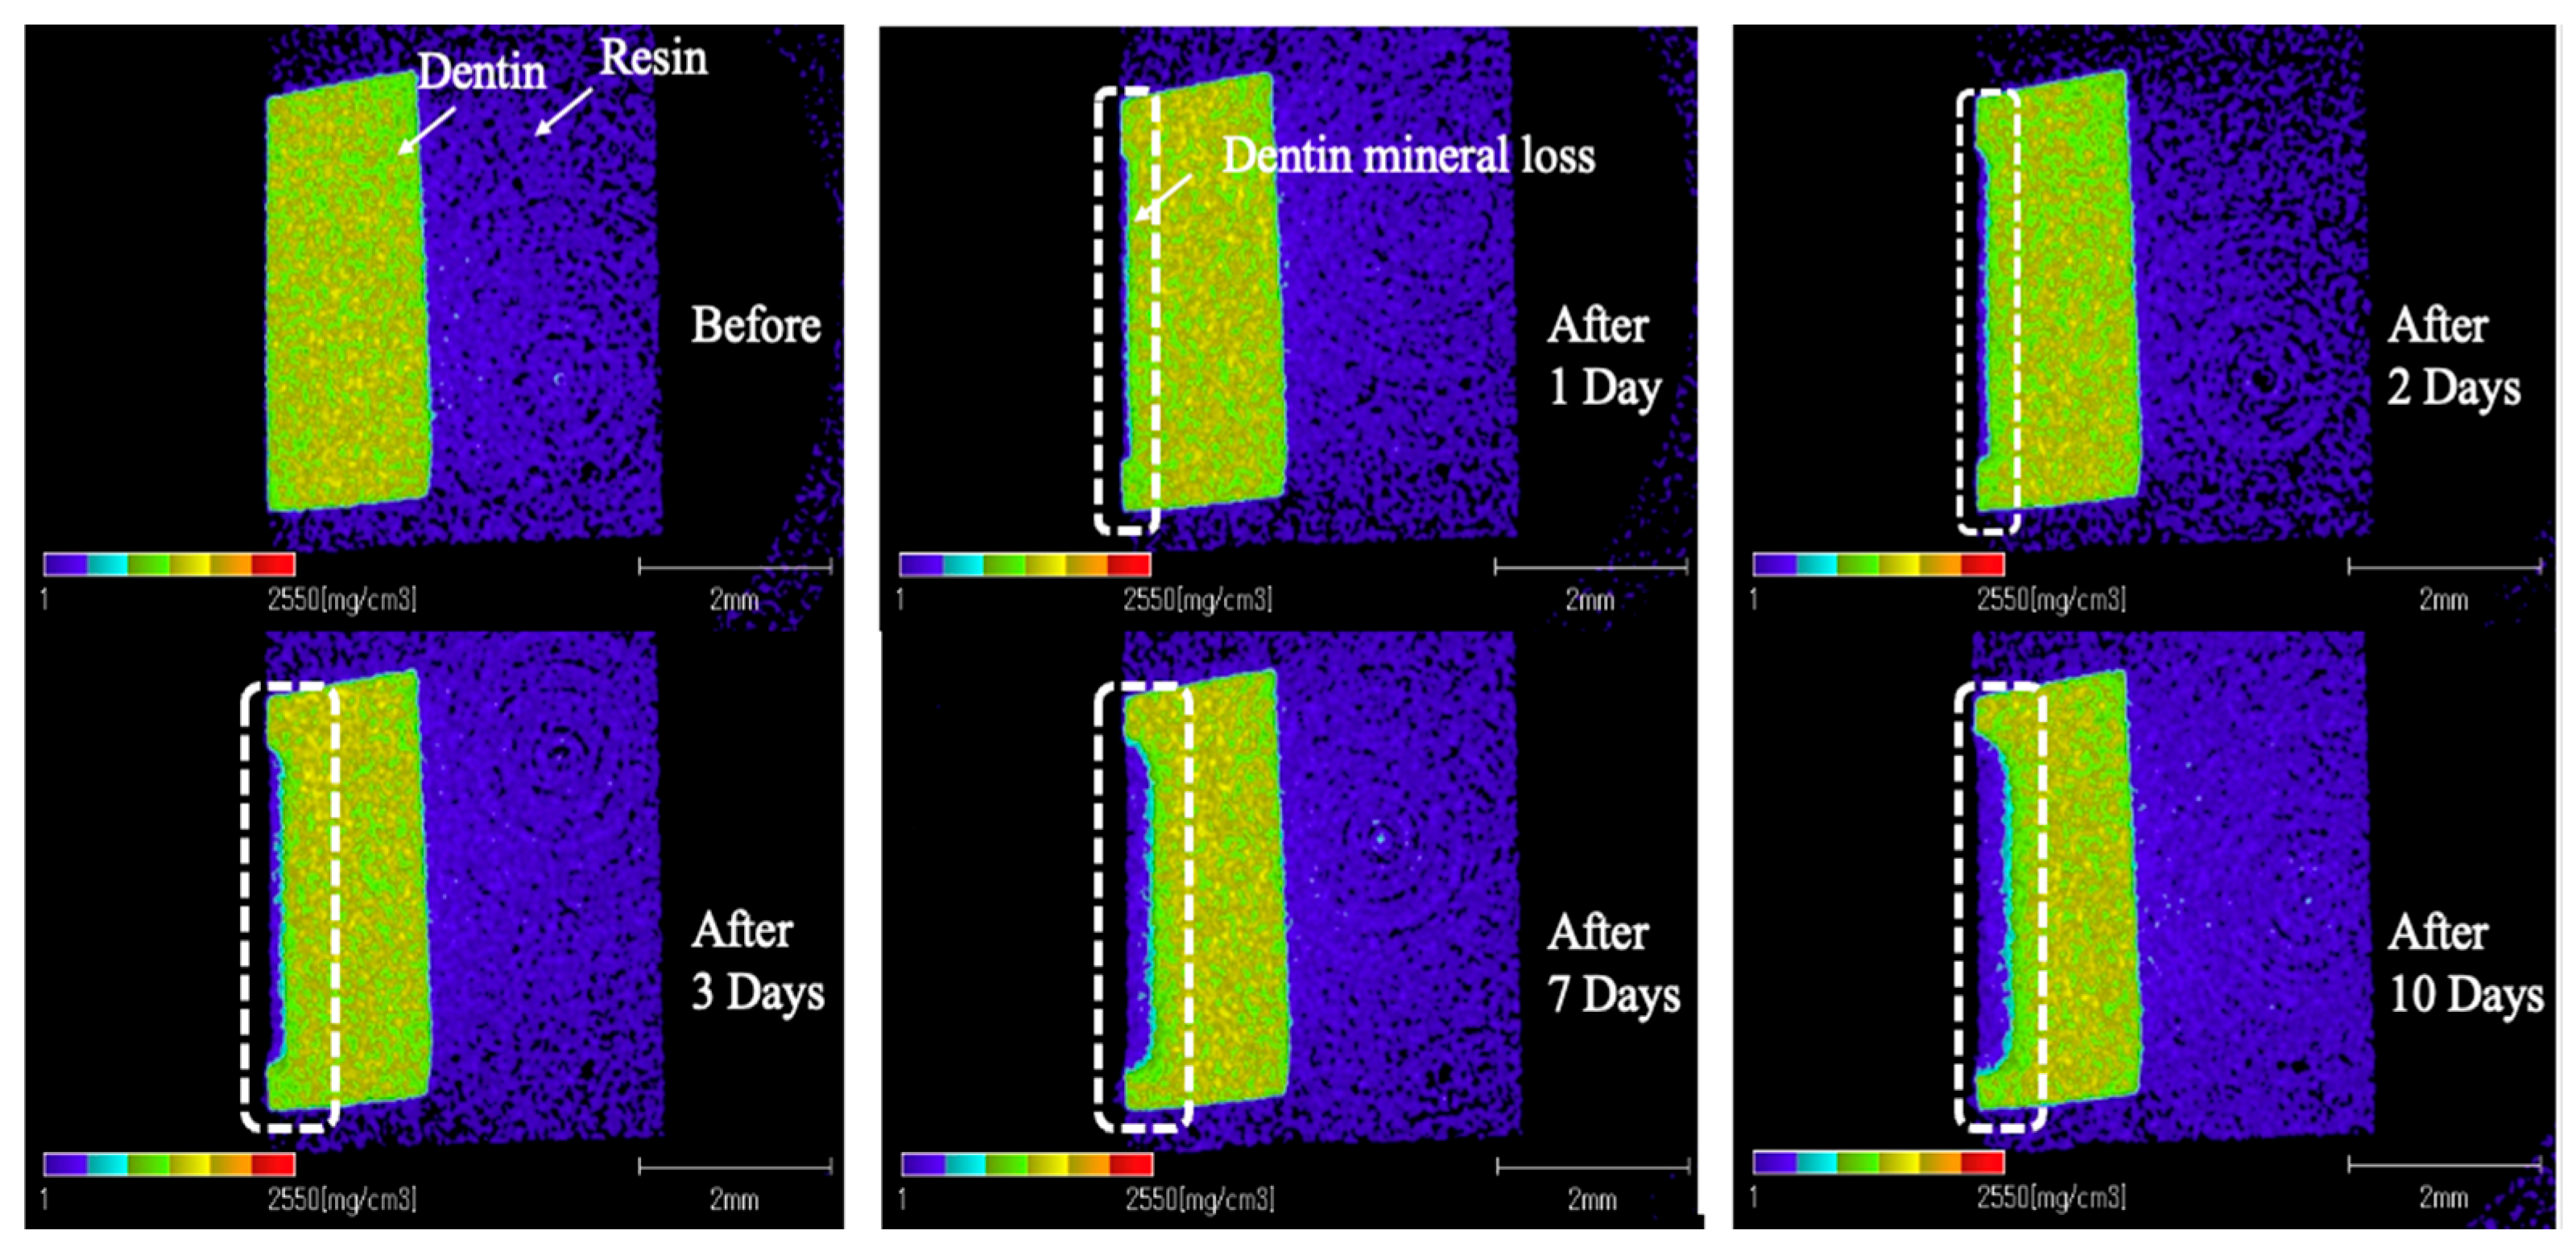
The figures summarizing the mean mineral loss and lesion depth for dentin are presented in Figure 6A and Figure 6B, respectively. The results indicated that both mean mineral loss and lesion depth increased consistently with time across all groups. Similar to the enamel results, groups D-2-5, D-3-5, and D-5-5 demonstrated a logarithmic relationship between time and mineral loss, with the mineral loss accelerating initially and then slowing down as the demineralization process progressed. The other groups exhibited a power function relationship, where the mineral loss continued at a more consistent rate over time. The demineralization process can be observed visually in Figure 7, which shows the progressive deepening of the lesions in the dentin specimens.
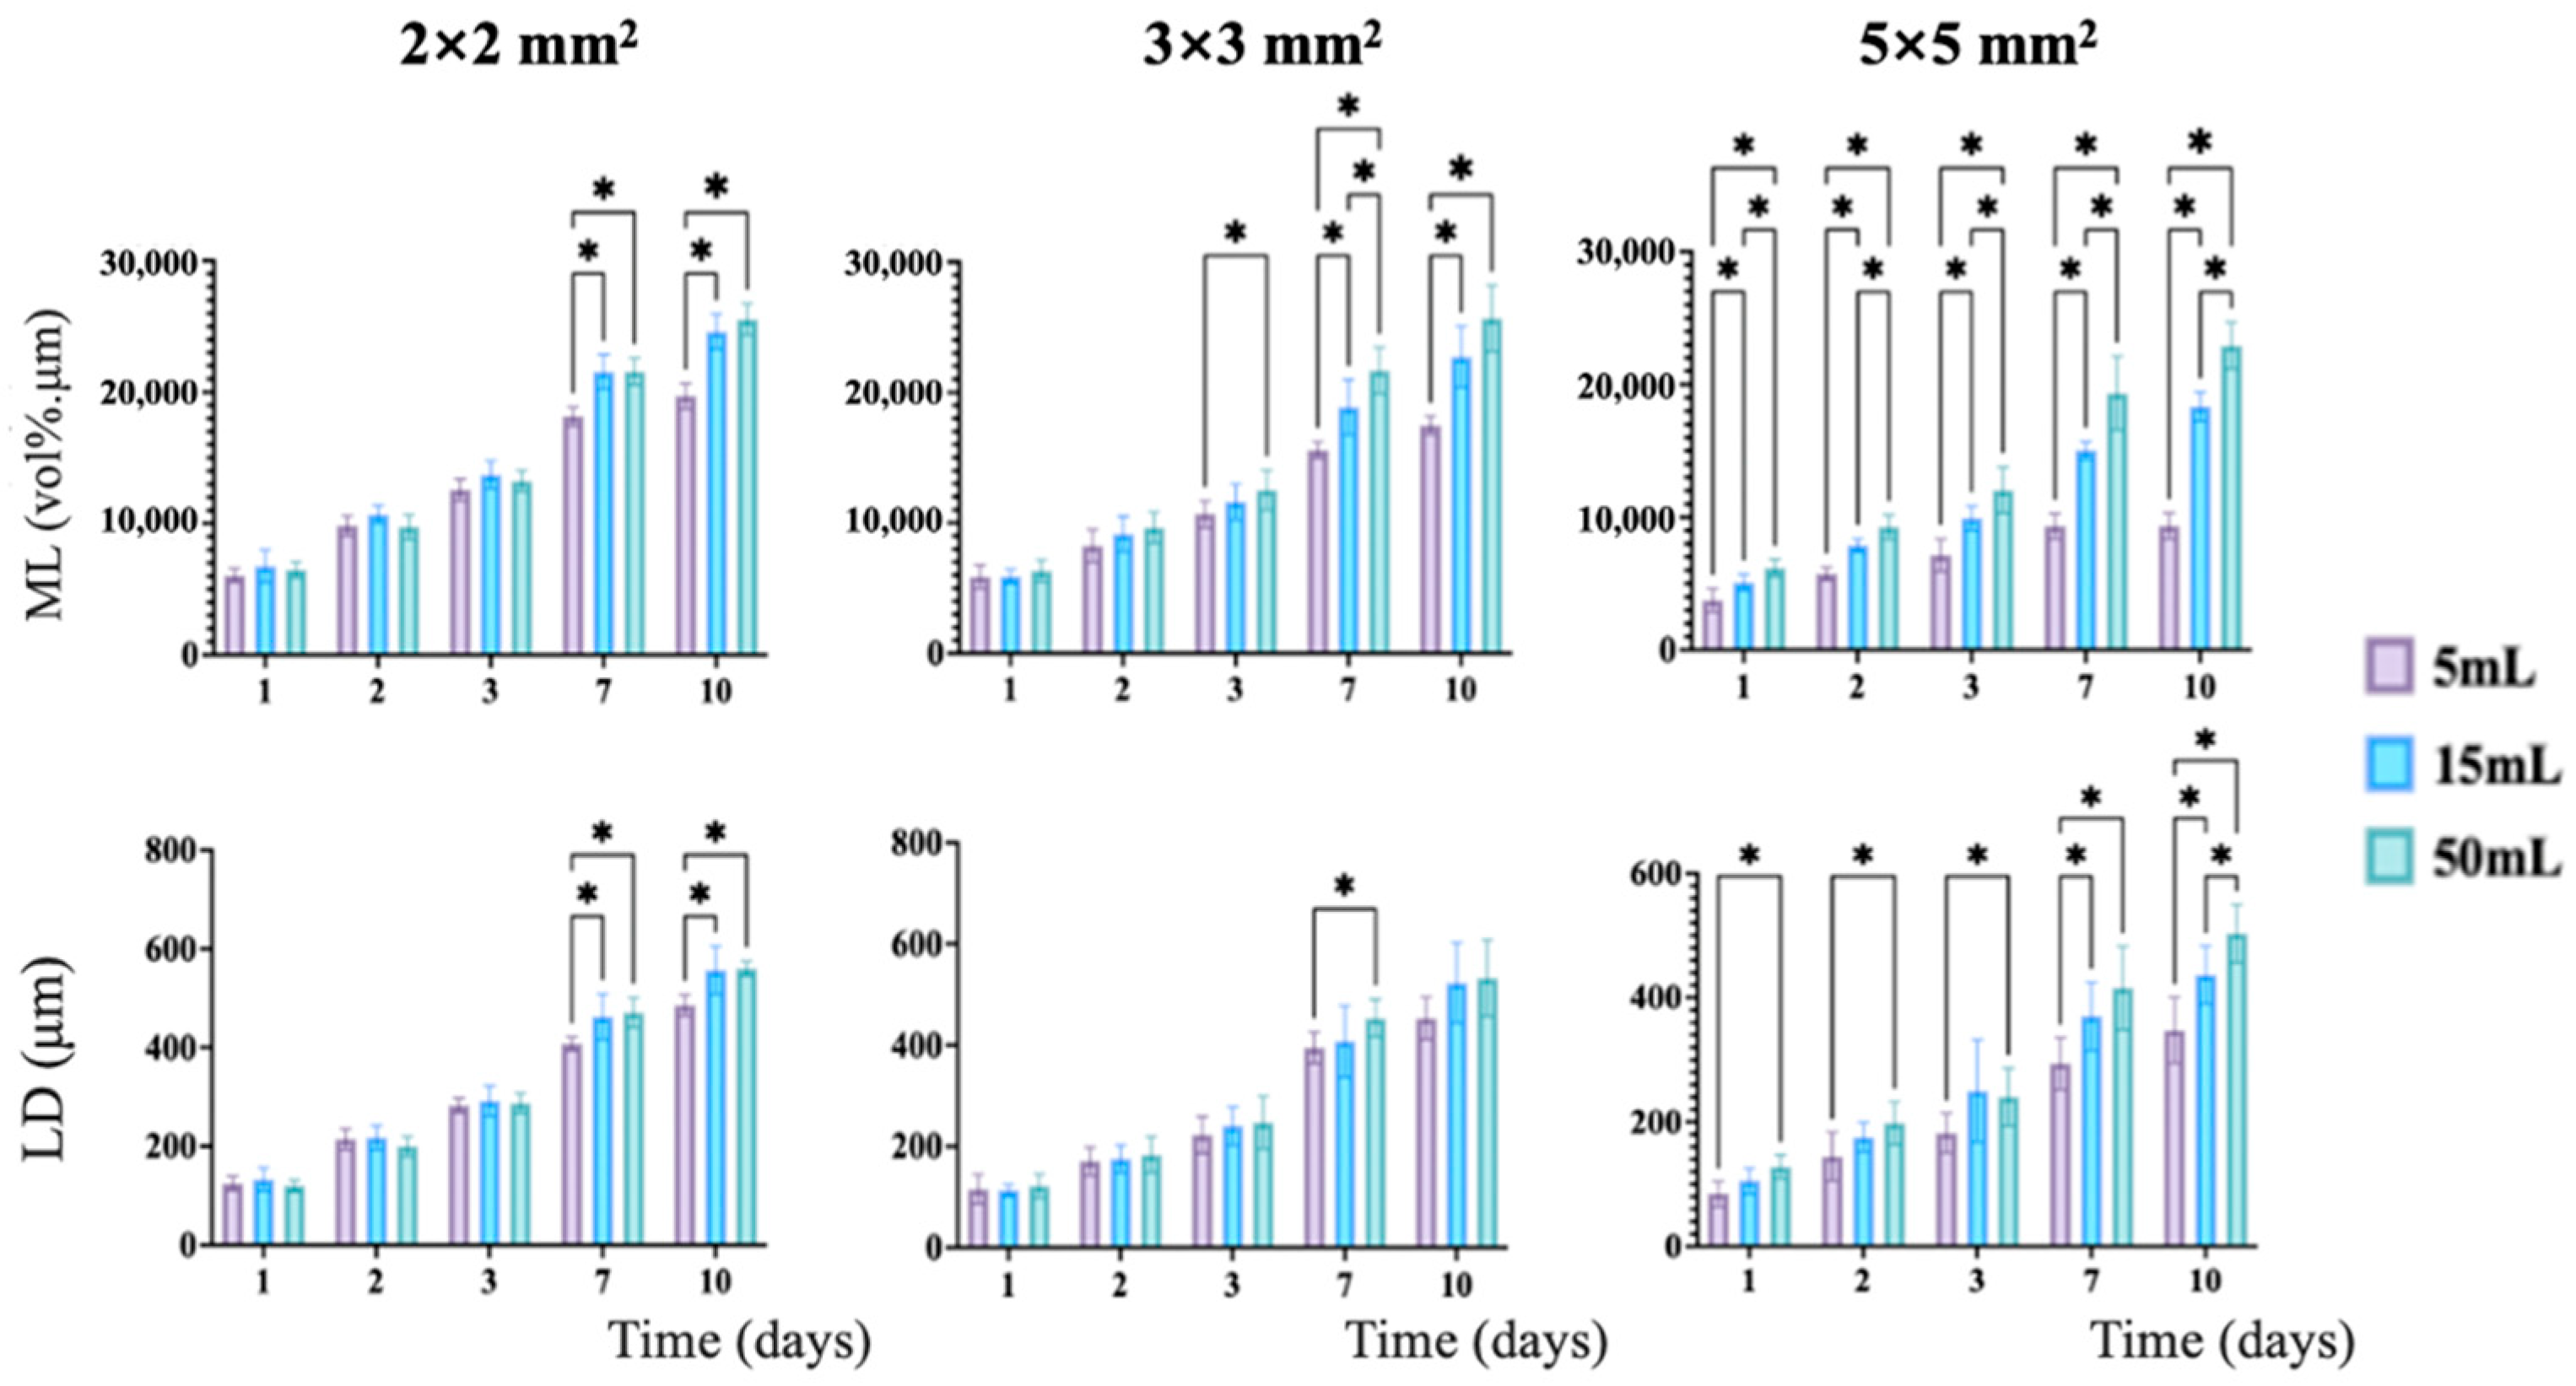
To evaluate the relationship between exposed area and mineral loss in dentin, groups with the same solution volume were grouped together, as shown in Figure 8. A significant difference in mineral loss was observed after 3 days of immersion, with the difference becoming more pronounced as time continued. This finding was consistent with the results obtained for enamel, where a smaller exposed area led to increased mineral loss.
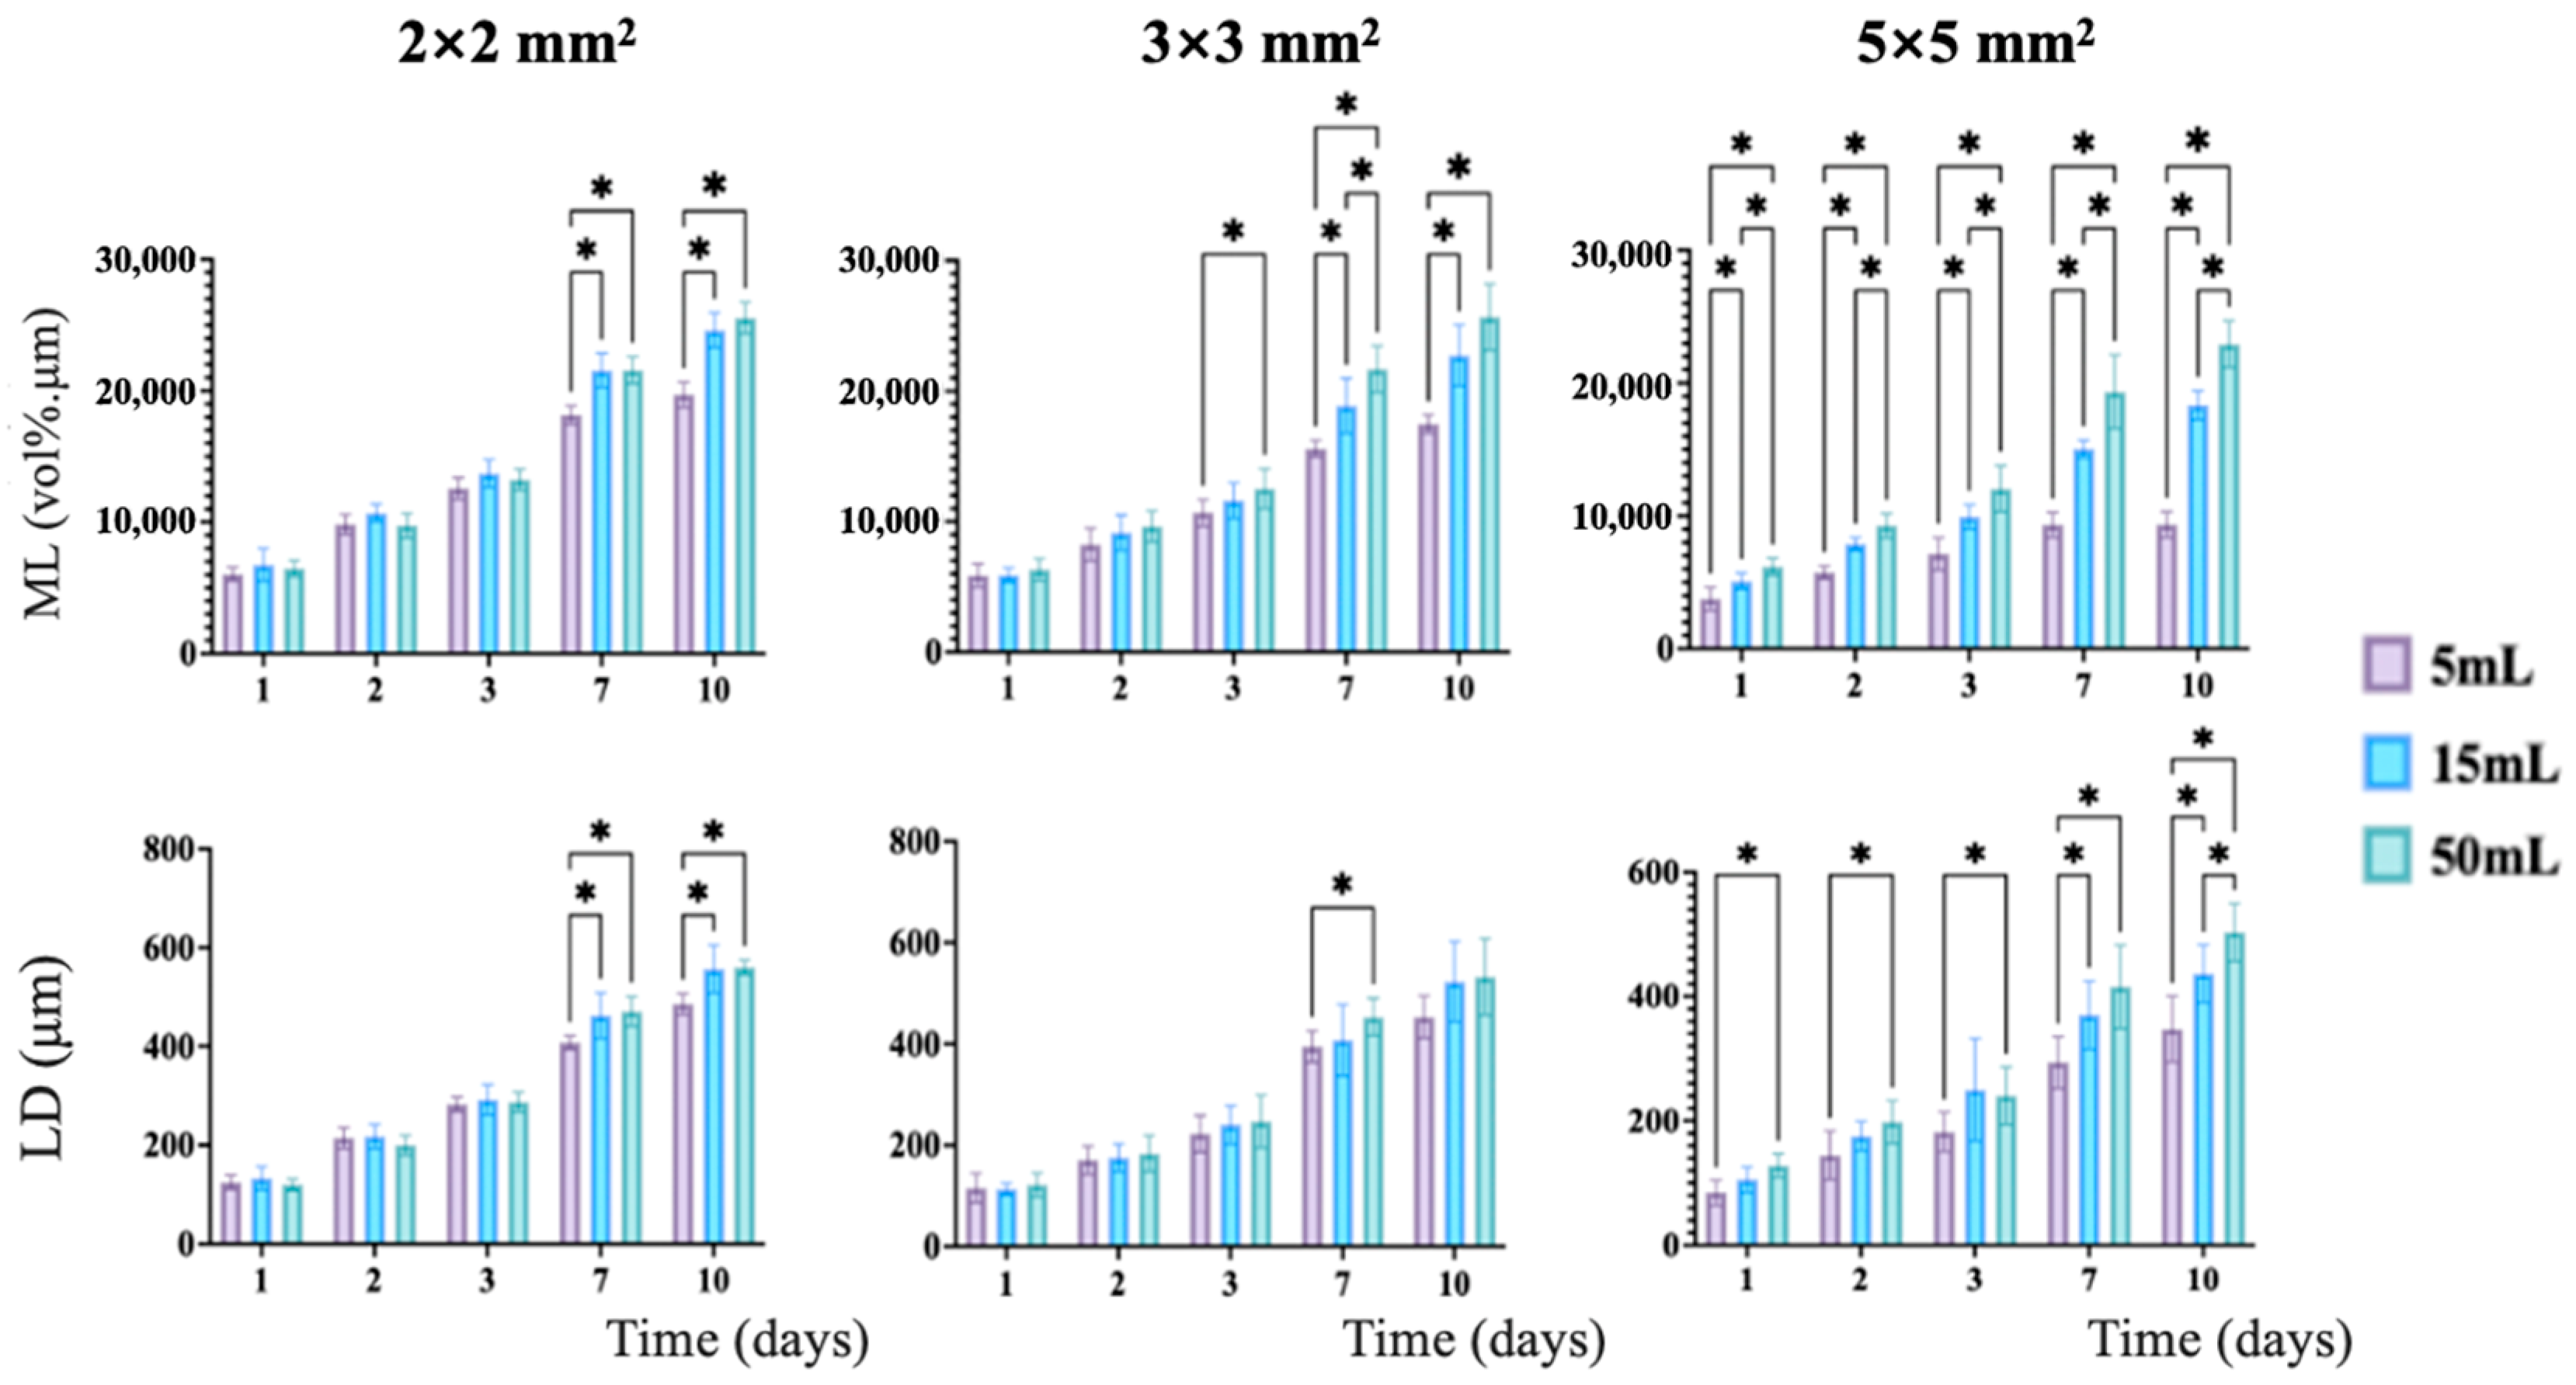
To further assess the relationship between solution volume and mineral loss, groups with the same exposed area were compared, as shown in Figure 9. Significant differences in mineral loss were detected after 3 days, and these differences grew more pronounced as time went on. As with enamel, larger solution volumes led to greater mineral loss in dentin, particularly after 7 days of immersion. This pattern indicated that the solution volume played a significant role in the extent of demineralization.

3.3. Comparison of Enamel and Dentin

A direct comparison of the mean mineral loss and lesion depth results between enamel and dentin under the same conditions was presented in Figure 10A,B. It was clearly observed that when all other conditions were kept the same, the mineral loss in dentin was consistently higher than that in enamel. This finding suggested that dentin was more susceptible to demineralization than enamel under the conditions tested in this study.

4. Discussion

Experiments using bovine teeth to artificially demineralize and serve as a model for non-infectious caries dentin have become a widely used approach. However, in recent years, few experimental systems have been developed as substitutes for true caries dentin due to insufficient demineralization solution volumes or inadequate demineralization durations. As a result, some studies have raised concerns that the obtained results may be influenced by these suboptimal samples. This is often attributed to the lack of properly established demineralization protocols. This study aims to investigate the relationship between the volume of demineralization solution, sample size, and demineralization duration to establish a benchmark for creating more reproducible experimental systems.
Bovine teeth are widely used in laboratory experiments on remineralization due to their availability and more stable composition compared to human teeth [29]. Bovine and human enamel and dentin are known to exhibit close similarities in terms of elemental composition [30]. In contrast, human teeth are not only difficult to obtain but also challenging to process in order to create a sufficiently large caries-free surface. The use of bovine teeth allows researchers to conduct experiments at a relatively low cost and obtain reliable results. Our experiment facilitates the use of bovine teeth by providing specific conditions to achieve the desired degree and depth of demineralization. The data were fitted with a curve, and approximate equations were derived for commonly used exposed surface sizes, such as 2 × 2 mm2, 3 × 3 mm2, and 5 × 5 mm2. An acetic acid-based demineralization solution was used in this study, which has been widely used for its ability to simulate natural demineralization and ease of preparation. During the experiment, the pH was not adjusted over time, as the study was designed to evaluate demineralization behavior under a closed-system condition, allowing natural pH changes associated with mineral dissolution to occur. This approach reduces unnecessary steps for the researchers, saves experimental materials, and is more environmentally friendly.
Non-destructive techniques for evaluating mineral content enable long-term assessment of the effects of demineralization and remineralization on specimens [31]. Compared to destructive two-dimensional (2D) techniques, such as the gold standard method—transversal microradiography (TMR) [28,32]—micro-CT offers significant advantages. Micro-CT is non-destructive and capable of capturing three-dimensional (3D) architectural information from samples. It has been widely used to analyze demineralization and remineralization in both enamel and dentin [33,34,35,36,37]. Additionally, research on comparing micro-CT and TMR has demonstrated that with the combination of Al and Cu filters, micro-CT measurements of mineral loss and demineralization depth correspond well with those derived from TMR [38]. Micro-CT has been proven to be an effective alternative for non-destructive quantitative demineralization and remineralization studies and is widely utilized in laboratories.
The demineralization of enamel and dentin is primarily governed by the reaction between H+ and hydroxyapatite. During this process, H+ ions are progressively consumed, leading to the dissolution of dental hard tissues into PO43− and Ca2+ ions, accompanied by a gradual increase in pH value. As the available H+ is depleted to a certain threshold, the pH value approaches the critical value. At this stage, a dynamic equilibrium is established between further demineralization and the redeposition of PO43− and Ca2+ ions into the mineral phase. This basic mechanism may help explain the findings of the present study.
The analysis of the effects of time on each group revealed two types of relationships when the data were fitted into curves. In enamel, groups E-2-5, E-3-5, E-5-5, and E-5-15 showed a nearly logarithmic relationship between time and demineralization, while the other groups exhibited a power function relationship. The reason for this phenomenon may be because when the demineralization solution is adequate for the exposed area, both the degree and depth of demineralization increase in a positive relationship with time. In contrast, when the solution volume is insufficient, a logarithmic relationship is more likely to emerge. This could be due to the rapid increase in pH when the solution was inadequate, which halted demineralization once it reached the critical pH (5.5 for enamel and 6.8 for dentin) [39]. The resulting increase in pH slowed down demineralization over time. A similar phenomenon was observed in dentin. Groups D-2-5, D-3-5, and D-5-5 exhibited a close logarithmic relationship, while the other groups displayed a power function relationship. However, a key difference between enamel and dentin was observed: 15 mL of solution was relatively insufficient for enamel but adequate for dentin. This may be explained by the higher critical pH of dentin, which requires less demineralization solution. The more linear relationship observed in enamel compared to dentin could be attributed to dentin’s faster demineralization, as it has a lower density than enamel, resulting in a more rapid increase in pH and greater consumption of H+, ultimately slowing the demineralization process.
The comparison of groups soaked in the same solution volume revealed that both in enamel and dentin, the exposed area appeared to be negatively correlated with mineral loss. This could be due to a larger exposed area leading to increased consumption of H+, which slows the demineralization process. In dentin, the results from D-2-50 showed no significant difference from D-3-50. This may be since 50 mL of demineralization solution provided sufficient H+ for 10 days of demineralization in dentin but was insufficient for enamel. As a result, D-2-50 and D-3-50 showed nearly identical demineralization rates during the 10-day period. These findings suggest that 50 mL exceeds the threshold required for 10 days of demineralization in dentin with an exposed area smaller than 3 × 3 mm2.
The comparison of ML and LD between enamel and dentin under the same conditions revealed that all groups exhibited greater mineral loss in dentin than in enamel. This is consistent with the fact that dentin has a much lower density than enamel, as well as the structural and compositional differences between the two. Enamel consists of approximately 96% inorganic material, primarily hydroxyapatite, while dentin contains about 70% inorganic material [40], making dentin more susceptible to acid attack. Additionally, the hydroxyapatite crystals in dentin are smaller and less densely packed than those in enamel [41], allowing acids to penetrate more easily. The presence of numerous dentinal tubules further facilitates acid diffusion into the tissue, accelerating the demineralization process. These characteristics explain the greater mineral loss in dentin compared to enamel under the same conditions.
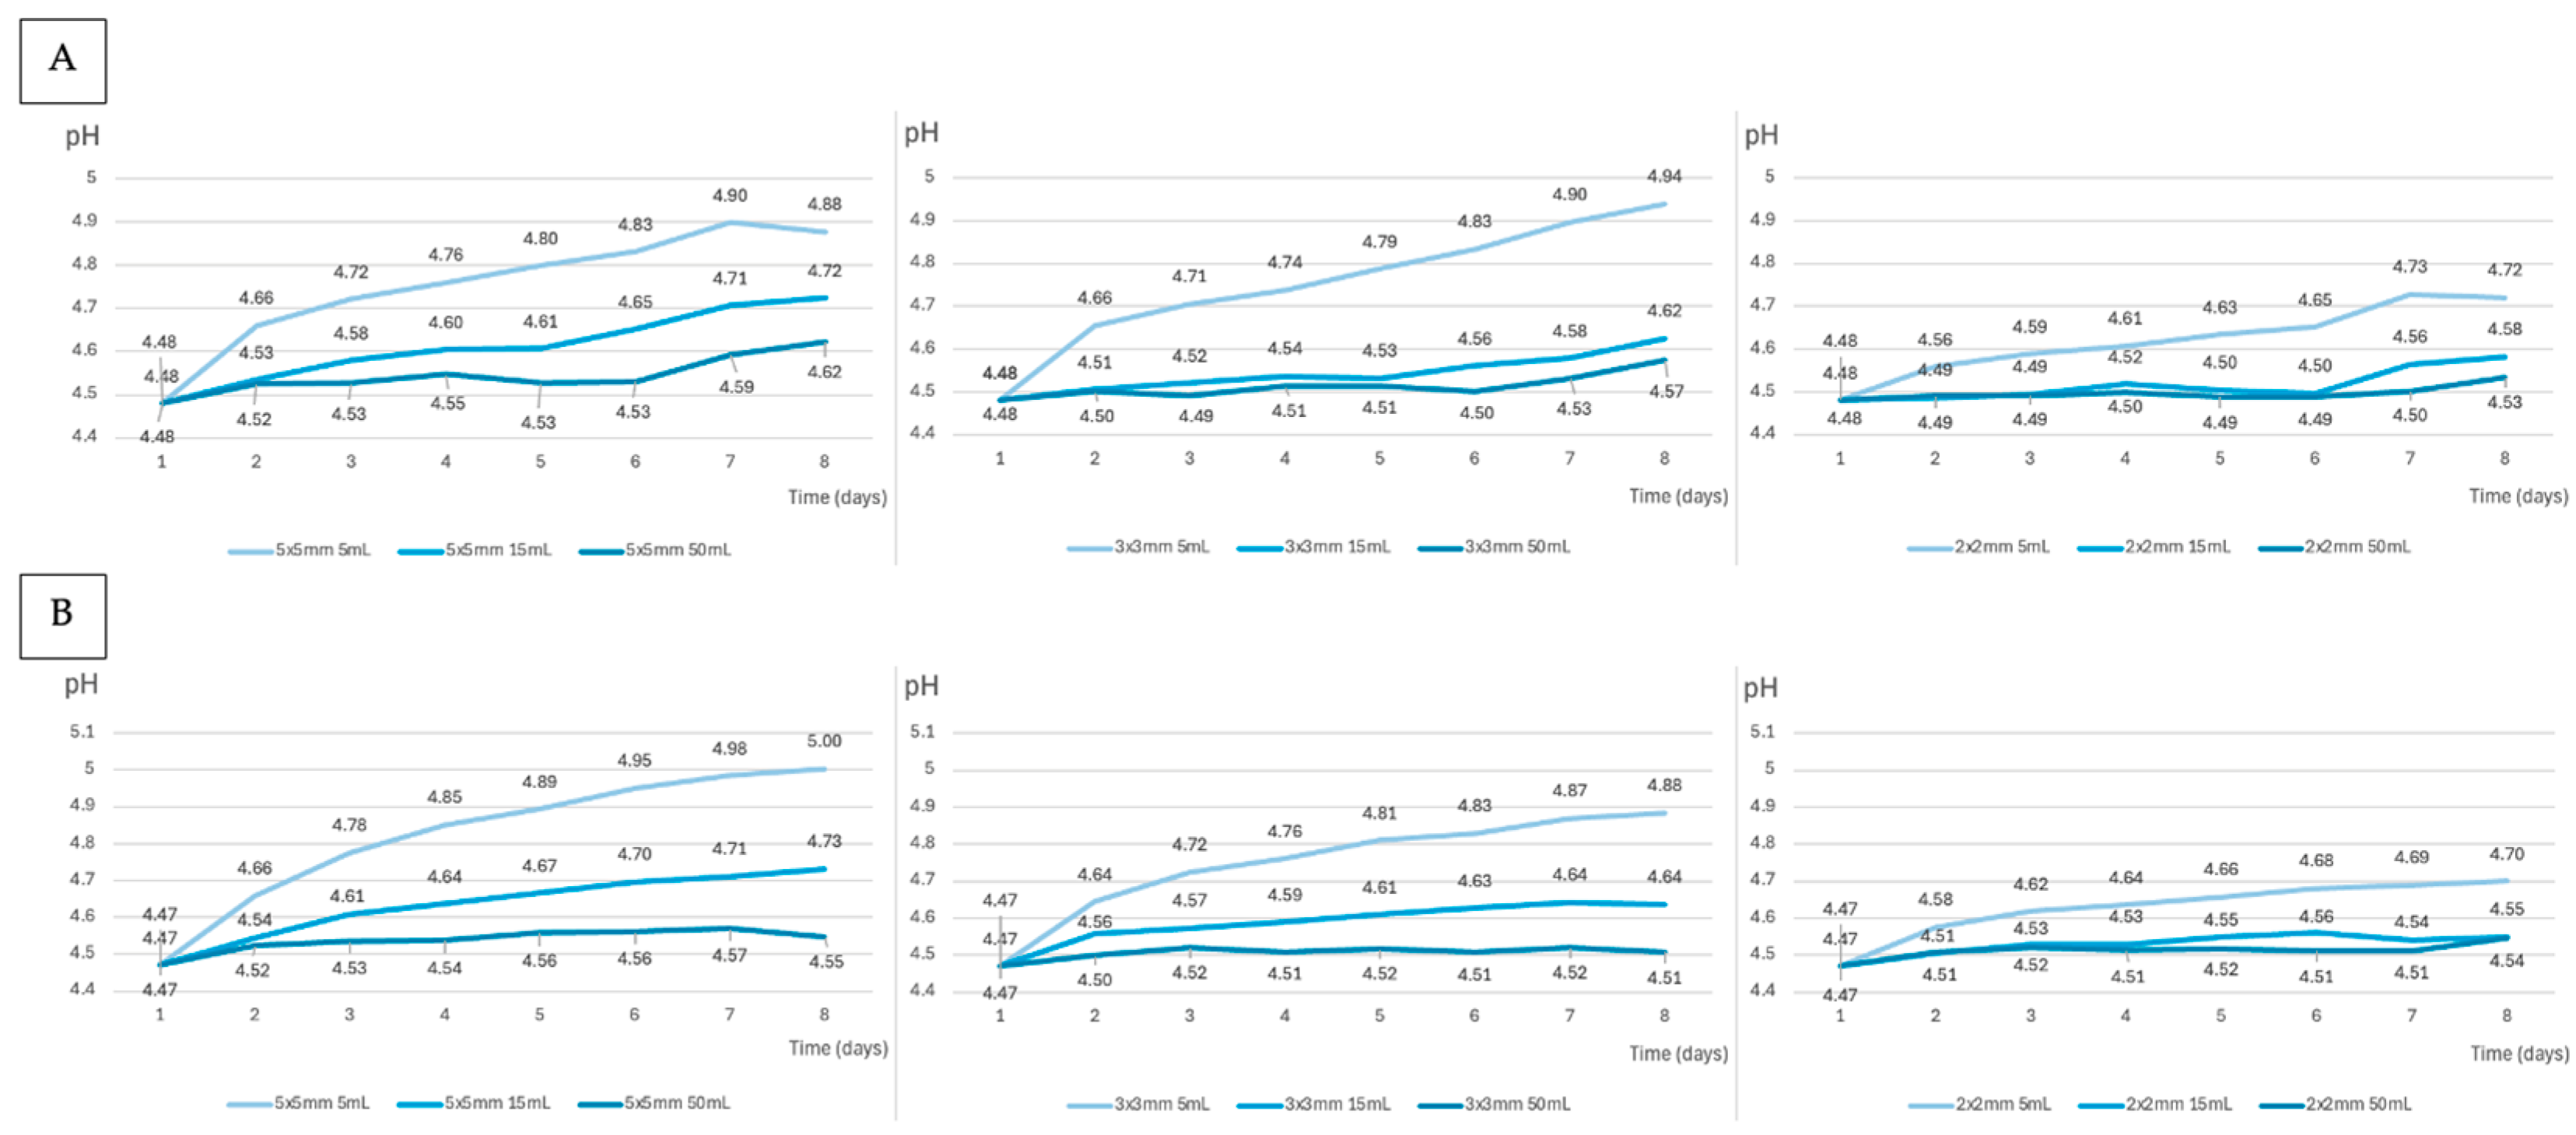
pH value of each group was monitored daily for 8 days to observe changes over time, as shown in Figure 11. It was observed that the pH of dentin increased more rapidly than that of enamel under identical conditions. However, despite this faster increase, the pH in the dentin groups remained further from the critical pH compared to the enamel groups. Additionally, the rate of pH increase was positively correlated with the exposed surface area and negatively correlated with the solution volume. Furthermore, the rate of pH increases gradually decreased over time. These findings are consistent with the results presented above and further support our hypothesis.
When comparing the average of ML and LD within the same group, it was frequently observed that LD showed no significant difference, whereas ML did. This could be attributed to several factors that affect lesion depth, such as individual differences, partially demineralized enamel, and potential data analysis errors. LD is likely more sensitive to these factors than ML. Additionally, 3D-BON, the software used to analyze micro-CT data, relies on human visual assessment and operator experience, making some degree of error inevitable. Moreover, individual variability among specimens is difficult to control adequately, which may lead to noticeable differences in group means, even in the absence of statistically significant differences. Therefore, when evaluating demineralization, ML appears to be a more stable and reliable criterion than LD. This observation is also relevant when assessing remineralization using micro-CT.
Based on the results presented, the desired degree and depth of demineralization in both enamel and dentin can be achieved by selecting appropriate combinations of immersion time, exposed surface area, and solution volume, without the need for time-consuming pilot experiments. In addition, the use of a constant demineralization solution throughout the procedure may help reduce both experimental time and material consumption.
While the study provides valuable insights into the demineralization process using bovine teeth, there are several limitations that should be considered. One limitation is that the sample size, which is 6 in each group in this study, may not be big enough, considering the individual variability among samples. The variability among samples remained relatively high, which may have led to situations where differences in average values were observed, but no statistically significant differences were detected. Therefore, the sample size would be increased during future experiments. Additionally, as micro-CT imaging requires a certain amount of time, minor changes in mineral content may occur during this process, despite our efforts to gently rinse each sample with distilled water to ensure the complete removal of demineralization solution. Furthermore, potential longitudinal as well as transverse alignment errors in serial micro-CT analyses could not be neglected, which is a common and currently unsolvable problem in related experiments. Last but not least, intra-sample variability may have influenced the results, particularly in the enamel groups, due to the relatively non-uniform surface after demineralization, although a relatively large area was used for mineral loss calculation.
The null hypotheses were rejected. These findings highlight the significant impact of soaking time, solution volume, and exposed area on the degree and depth of demineralization. Further studies are needed to refine these relationships and explore the underlying mechanisms in more detail, particularly in the context of human teeth and real-world caries conditions. By addressing the limitations of this study and expanding the scope of future research, demineralization processes and improved strategies for prevention and treatment could be better understood.

5. Conclusions

Soaking time and solution volume appear to be positively correlated with mineral loss, while the exposed area seems to be negatively correlated with mineral loss. When the solution volume is relatively sufficient for the exposed area, mineral loss follows a power function relationship with time. Conversely, when the solution volume is relatively insufficient, mineral loss shows a more logarithmic correlation with time. Given its better stability, mean mineral loss may be a more reliable indicator for assessing enamel demineralization. Based on our results, more controlled and reproducible demineralization conditions can be achieved, which may contribute to improving the reliability of in vitro caries models and facilitating the evaluation of preventive and therapeutic strategies.

Author Contributions

Conceptualization, B.N., X.C. and G.I.; methodology, B.N., X.C. and G.I.; software, B.N., X.C. and L.F.; validation, B.N., X.C. and G.I.; formal analysis, B.N. and X.C.; investigation, B.N., L.Y., H.E. and M.T.; resources, B.N., X.C., G.I. and Y.S.; data curation, B.N.; writing—original draft preparation, B.N.; writing—review and editing, B.N., X.C., G.I. and Y.S.; visualization, B.N.; supervision, X.C., G.I. and Y.S.; project administration, X.C., G.I. and Y.S.; funding acquisition, X.C., G.I. and Y.S. All authors have read and agreed to the published version of the manuscript.

Funding

This research received no external funding.

Data Availability Statement

The original contributions presented in this study are included in the article. Further inquiries can be directed to the corresponding author.

Acknowledgments

No generative AI tools were used in the preparation of this manuscript.

Conflicts of Interest

The authors declare no conflicts of interest.

References

  1. Glick, M.; Williams, D.M.; Kleinman, D.V.; Vujicic, M.; Watt, R.G.; Weyant, R.J. A New Definition for Oral Health Developed by the FDI World Dental Federation Opens the Door to a Universal Definition of Oral Health. Br. Dent. J. 2016, 221, 792–793. [Google Scholar] [CrossRef] [PubMed]
  2. Kisely, S. No Mental Health without Oral Health. Can. J. Psychiatry 2016, 61, 277–282. [Google Scholar] [CrossRef] [PubMed]
  3. Pereira, A.G.; Neves, A.M.; Trindade, A.C. Immunology of Dental Caries. Acta Med. Port. 2010, 23, 663–668. [Google Scholar] [PubMed]
  4. Dye, B.A. The Global Burden of Oral Disease: Research and Public Health Significance. J. Dent. Res. 2017, 96, 361–363. [Google Scholar] [CrossRef]
  5. Ericson, D.; Kidd, E.; McComb, D.; Mjör, I.; Noack, M.J. Minimally Invasive Dentistry—Concepts and Techniques in Cariology. Oral Health Prev. Dent. 2003, 1, 59–72. [Google Scholar]
  6. Frencken, J.E.; Peters, M.C.; Manton, D.J.; Leal, S.C.; Gordan, V.V.; Eden, E. Minimal Intervention Dentistry for Managing Dental Caries—A Review: Report of a FDI Task Group. Int. Dent. J. 2012, 62, 223–243. [Google Scholar] [CrossRef]
  7. Dorri, M.; Dunne, S.M.; Walsh, T.; Schwendicke, F. Micro-Invasive Interventions for Managing Proximal Dental Decay in Primary and Permanent Teeth. Cochrane Database Syst. Rev. 2015, 2015, CD010431. [Google Scholar] [CrossRef]
  8. Schwendicke, F.; Frencken, J.E.; Bjørndal, L.; Maltz, M.; Manton, D.J.; Ricketts, D.; Van Landuyt, K.; Banerjee, A.; Campus, G.; Doméjean, S.; et al. Managing Carious Lesions: Consensus Recommendations on Carious Tissue Removal. Adv. Dent. Res. 2016, 28, 58–67. [Google Scholar] [CrossRef]
  9. Malcangi, G.; Patano, A.; Morolla, R.; De Santis, M.; Piras, F.; Settanni, V.; Mancini, A.; Di Venere, D.; Inchingolo, F.; Inchingolo, A.D.; et al. Analysis of Dental Enamel Remineralization: A Systematic Review of Technique Comparisons. Bioengineering 2023, 10, 472. [Google Scholar] [CrossRef]
  10. Featherstone, J.D.; Glena, R.; Shariati, M.; Shields, C.P. Dependence of in Vitro Demineralization of Apatite and Remineralization of Dental Enamel on Fluoride Concentration. J. Dent. Res. 1990, 69, 620–625. [Google Scholar] [CrossRef]
  11. Featherstone, J.D. Modeling the Caries-Inhibitory Effects of Dental Materials. Dent. Mater. 1996, 12, 194–197. [Google Scholar] [CrossRef] [PubMed]
  12. Featherstone, J.D.; Mellberg, J.R. Relative Rates of Progress of Artificial Carious Lesions in Bovine, Ovine and Human Enamel. Caries Res. 1981, 15, 109–114. [Google Scholar] [CrossRef] [PubMed]
  13. Tian, J.; Wu, Z.; Wang, Y.; Han, C.; Zhou, Z.; Guo, D.; Lin, Y.; Ye, Z.; Fu, J. Multifunctional Dental Resin Composite with Antibacterial and Remineralization Properties Containing nMgO-BAG. J. Mech. Behav. Biomed. Mater. 2023, 141, 105783. [Google Scholar] [CrossRef] [PubMed]
  14. Chaiwat, A.; Chunhacheevachaloke, E.; Kidkhunthod, P.; Pakawanit, P.; Ajcharanukul, O. Enamel Remineralization and Crystallization after Fluoride Iontophoresis. J. Dent. Res. 2023, 102, 402–411. [Google Scholar] [CrossRef]
  15. Pang, Y.; Fu, C.; Zhang, D.; Li, M.; Zhou, X.; Gao, Y.; Lin, K.; Hu, B.; Zhang, K.; Cai, Q.; et al. Biomimetic Remineralization of Dental Hard Tissues via Amyloid-like Protein Matrix Composite with Amorphous Calcium Phosphate. Adv. Funct. Mater. 2024, 34, 2403233. [Google Scholar] [CrossRef]
  16. Crabb, H.S.M.; Mortimer, K.V. Dental Caries and Enamel Structure. Nature 1966, 209, 611–612. [Google Scholar] [CrossRef]
  17. Klont, B.; Ten Cate, J.M. Remineralization of Bovine Incisor Root Lesions in Vitro: The Role of the Collagenous Matrix. Caries Res. 1991, 25, 39–45. [Google Scholar] [CrossRef]
  18. Van Dijk, J.W.E.; Borggreven, J.M.P.M.; Driessens, F.C.M. Chemical and Mathematical Simulation of Caries. Caries Res. 2009, 13, 169–180. [Google Scholar] [CrossRef]
  19. Ten Cate, J.M.; Exterkate, R.A.M.; Buijs, M.J. The Relative Efficacy of Fluoride Toothpastes Assessed with pH Cycling. Caries Res. 2006, 40, 136–141. [Google Scholar] [CrossRef]
  20. Ishizuka, H.; Hamba, H.; Nakamura, K.; Miyayoshi, Y.; Kumura, H.; Muramatsu, T. Effects of Bovine Milk Osteopontin on in Vitro Enamel Remineralization as a Topical Application Prior to Immersion in Remineralizing Solutions with/without Fluoride. Dent. Mater. J. 2023, 42, 140–146. [Google Scholar] [CrossRef]
  21. Tschoppe, P.; Zandim, D.L.; Martus, P.; Kielbassa, A.M. Enamel and Dentine Remineralization by Nano-Hydroxyapatite Toothpastes. J. Dent. 2011, 39, 430–437. [Google Scholar] [CrossRef] [PubMed]
  22. Nakamura, K.; Hamba, H.; Miyayoshi, Y.; Ishizuka, H.; Muramatsu, T. In Vitro Remineralization of Enamel with a Solution Containing Casein and Fluoride. Dent. Mater. J. 2021, 40, 1109–1114. [Google Scholar] [CrossRef] [PubMed]
  23. Chu, J.; Feng, X.; Guo, H.; Zhang, T.; Zhao, H.; Zhang, Q. Remineralization Efficacy of an Amelogenin-Based Synthetic Peptide on Carious Lesions. Front. Physiol. 2018, 9, 842. [Google Scholar] [CrossRef] [PubMed]
  24. Ten Cate, J.M. Remineralization of Deep Enamel Dentine Caries Lesions. Aust. Dent. J. 2008, 53, 281–285. [Google Scholar] [CrossRef]
  25. Miyayoshi, Y.; Hamba, H.; Nakamura, K.; Ishizuka, H.; Muramatsu, T. Remineralization Effects of Enamel Binding Peptide, WGNYAYK, on Enamel Subsurface Demineralization in Vitro. Enamel Binding Peptide, WGNYAYK Effect Remineralization of Enamel. Heliyon 2024, 10, e23176. [Google Scholar] [CrossRef]
  26. Ding, L.; Han, S.; Peng, X.; Wang, K.; Zheng, S.; Li, H.; Niu, Y.; Li, W.; Zhang, L. Tuftelin-Derived Peptide Facilitates Remineralization of Initial Enamel Caries in Vitro. J. Biomed. Mater. Res. B Appl. Biomater. 2020, 108, 3261–3269. [Google Scholar] [CrossRef]
  27. Li, Y.; Li, Y.; Bai, Q.; Wen, M.; Ma, D.; Lin, Y.; Chu, J. Recombinant Amelogenin Peptide TRAP Promoting Remineralization of Early Enamel Caries: An in Vitro Study. Front. Physiol. 2023, 14, 1076265. [Google Scholar] [CrossRef]
  28. Ten Bosch, J.J.; Angmar-Månsson, B. A Review of Quantitative Methods for Studies of Mineral Content of Intra-Oral Caries Lesions. J. Dent. Res. 1991, 70, 2–14. [Google Scholar] [CrossRef]
  29. Nakamichi, I.; Iwaku, M.; Fusayama, T. Bovine Teeth as Possible Substitutes in the Adhesion Test. J. Dent. Res. 1983, 62, 1076–1081. [Google Scholar] [CrossRef]
  30. Möhring, S.; Cieplik, F.; Hiller, K.-A.; Ebensberger, H.; Ferstl, G.; Hermens, J.; Zaparty, M.; Witzgall, R.; Mansfeld, U.; Buchalla, W.; et al. Elemental Compositions of Enamel or Dentin in Human and Bovine Teeth Differ from Murine Teeth. Materials 2023, 16, 1514. [Google Scholar] [CrossRef]
  31. Hamba, H.; Nikaido, T.; Inoue, G.; Sadr, A.; Tagami, J. Effects of CPP-ACP with Sodium Fluoride on Inhibition of Bovine Enamel Demineralization: A Quantitative Assessment Using Micro-Computed Tomography. J. Dent. 2011, 39, 405–413. [Google Scholar] [CrossRef] [PubMed]
  32. Arends, J.; Ten Bosch, J.J. Demineralization and Remineralization Evaluation Techniques. J. Dent. Res. 1992, 71, 924–928. [Google Scholar] [CrossRef]
  33. Kinney, J.H.; Balooch, M.; Haupt, D.L.; Marshall, S.J.; Marshall, G.W. Mineral Distribution and Dimensional Changes in Human Dentin during Demineralization. J. Dent. Res. 1995, 74, 1179–1184. [Google Scholar] [CrossRef] [PubMed]
  34. Anderson, P.; Elliott, J.C.; Bose, U.; Jones, S.J. A Comparison of the Mineral Content of Enamel and Dentine in Human Premolars and Enamel Pearls Measured by X-Ray Microtomography. Arch. Oral Biol. 1996, 41, 281–290. [Google Scholar] [CrossRef] [PubMed]
  35. Davis, G.R.; Wong, F.S. X-Ray Microtomography of Bones and Teeth. Physiol. Meas. 1996, 17, 121–146. [Google Scholar] [CrossRef]
  36. Wong, F.S.; Elliott, J.C.; Davis, G.R.; Anderson, P. X-Ray Microtomographic Study of Mineral Distribution in Enamel of Mandibular Rat Incisors. J. Anat. 2000, 196, 405–413. [Google Scholar] [CrossRef]
  37. Efeoglu, N.; Wood, D.; Efeoglu, C. Microcomputerised Tomography Evaluation of 10% Carbamide Peroxide Applied to Enamel. J. Dent. 2005, 33, 561–567. [Google Scholar] [CrossRef]
  38. Hamba, H.; Nikaido, T.; Sadr, A.; Nakashima, S.; Tagami, J. Enamel Lesion Parameter Correlations between Polychromatic Micro-CT and TMR. J. Dent. Res. 2012, 91, 586–591. [Google Scholar] [CrossRef]
  39. Inchingolo, A.M.; Malcangi, G.; Ferrante, L.; Del Vecchio, G.; Viapiano, F.; Mancini, A.; Inchingolo, F.; Inchingolo, A.D.; Di Venere, D.; Dipalma, G.; et al. Damage from Carbonated Soft Drinks on Enamel: A Systematic Review. Nutrients 2023, 15, 1785. [Google Scholar] [CrossRef]
  40. Antonio, N. Oral Histology: Development, Structure, and Function, 10th ed.; Elsevier: Amsterdam, The Netherlands, 2024; p. 532. [Google Scholar]
  41. Chun, K.; Choi, H.; Lee, J. Comparison of Mechanical Property and Role between Enamel and Dentin in the Human Teeth. J. Dent. Biomech. 2014, 5, 1758736014520809. [Google Scholar] [CrossRef]
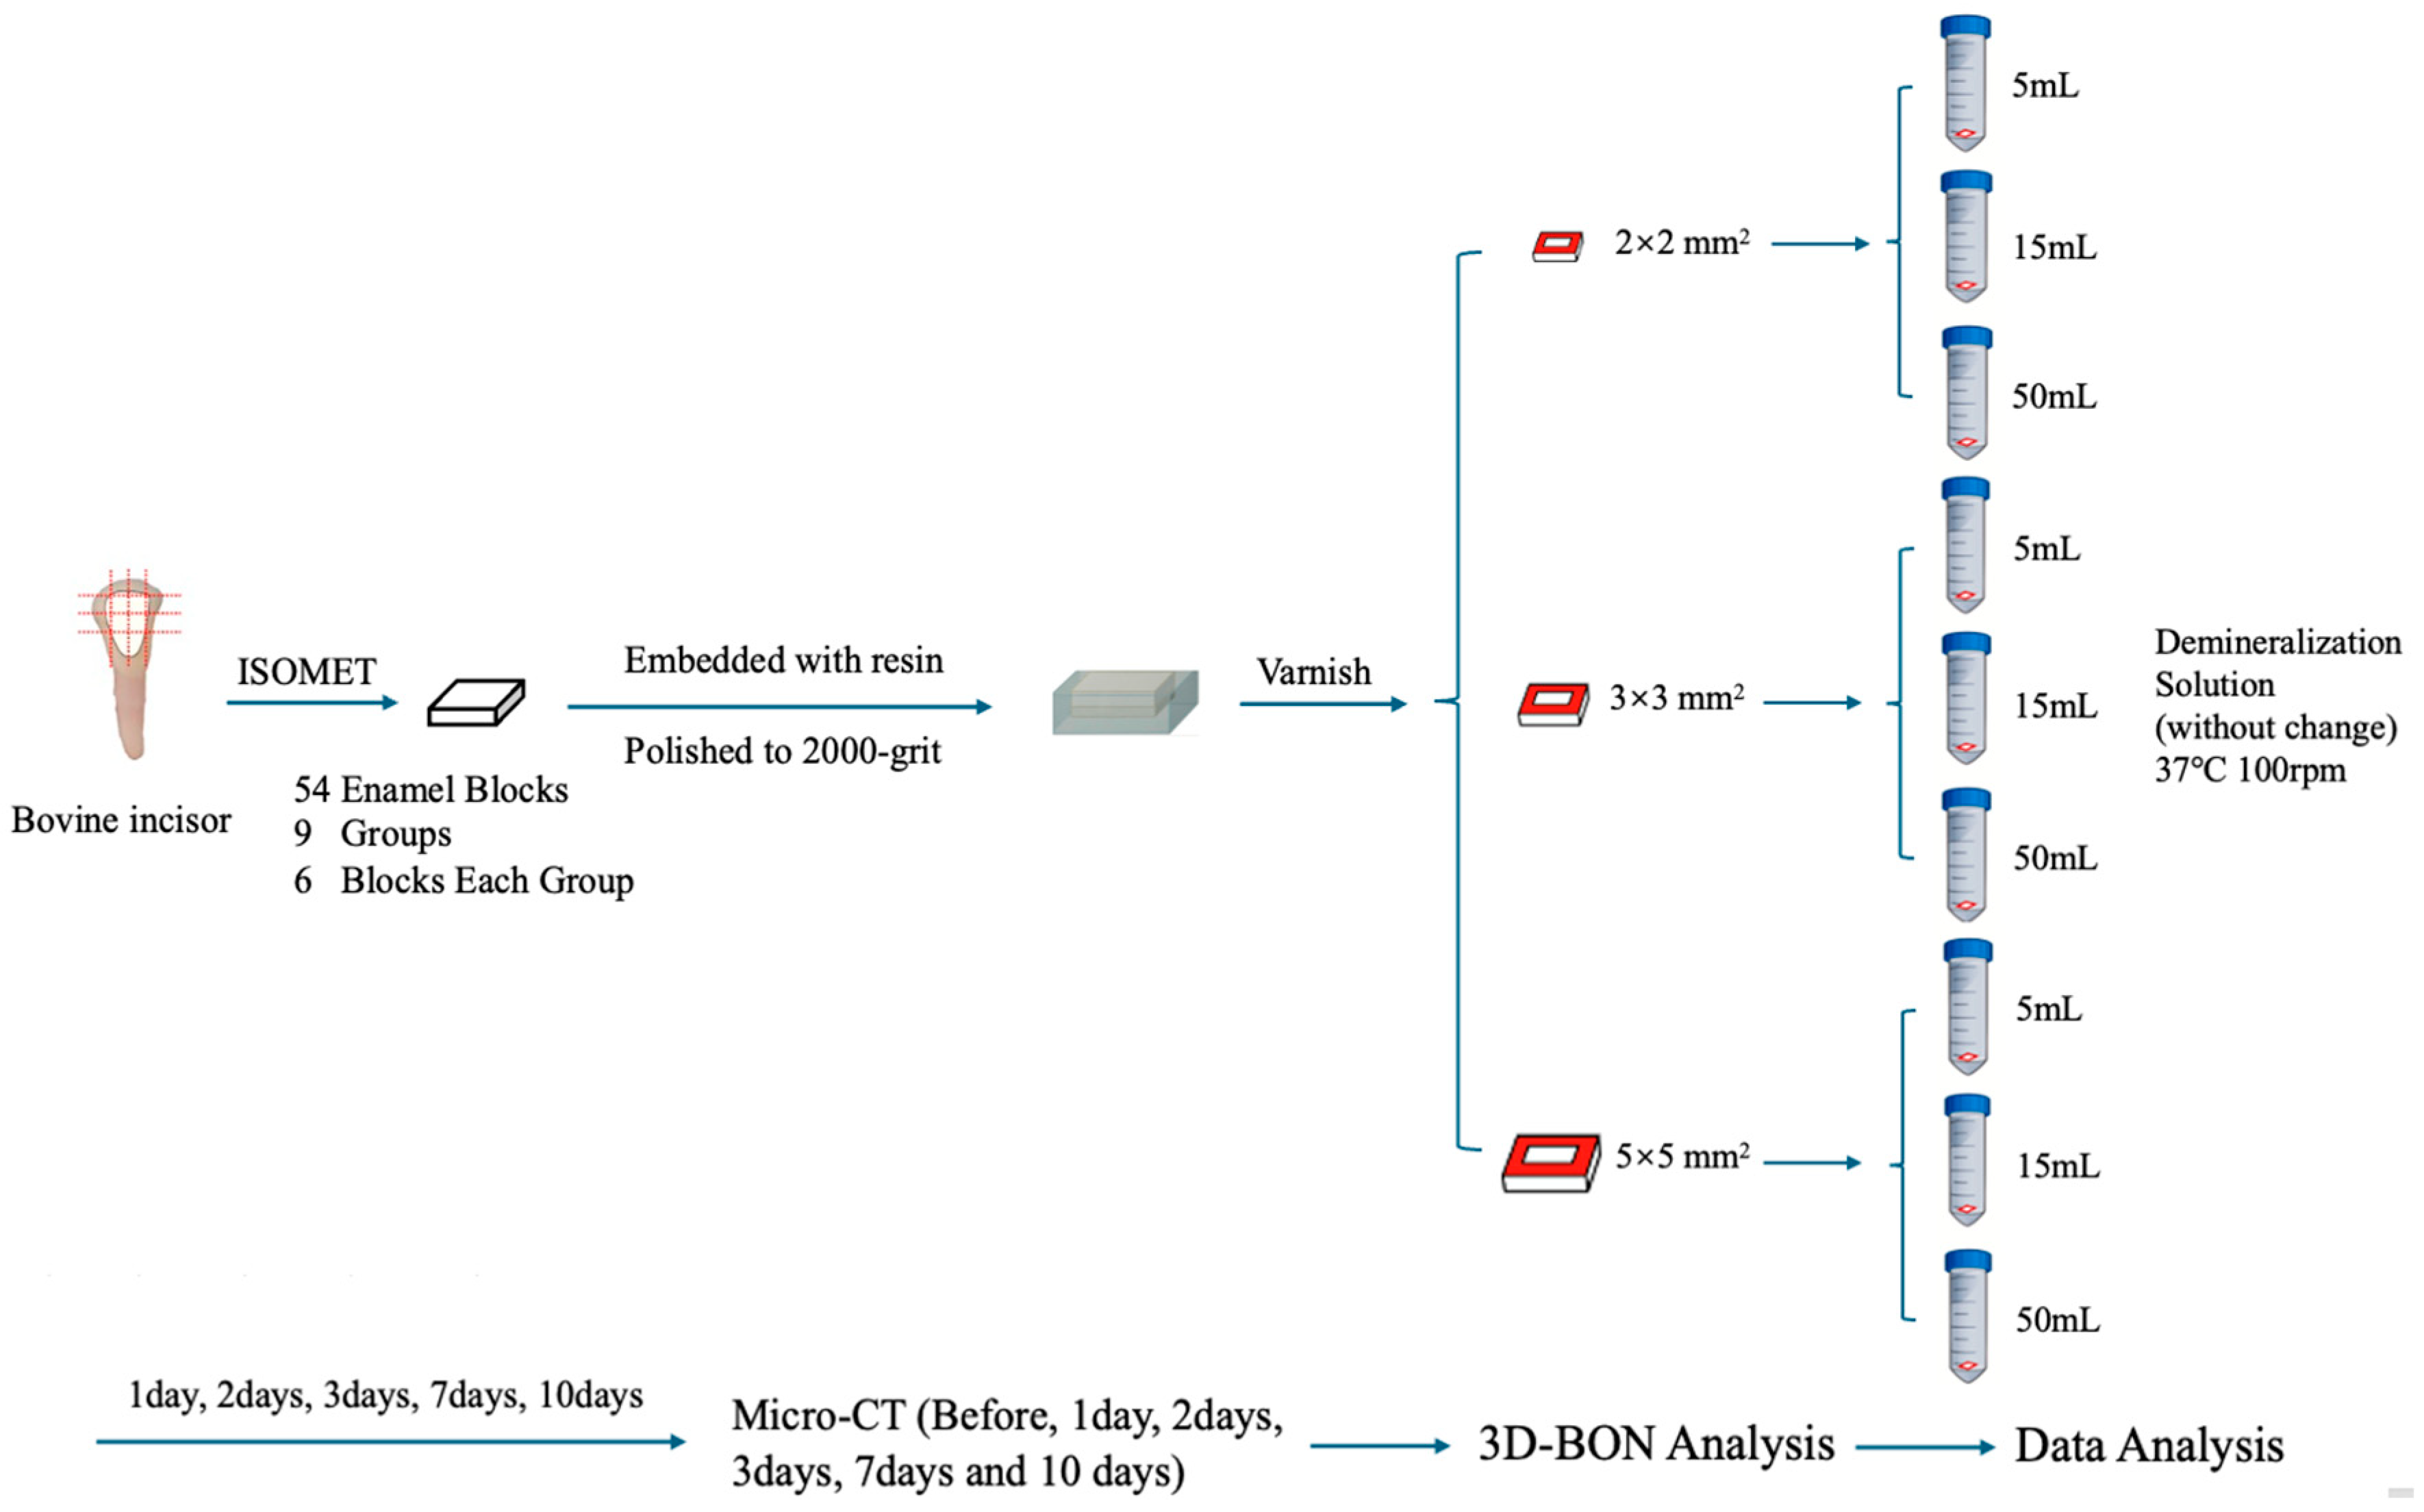
Figure 1. Flow chart of the experiment.
Crystals 16 00238 g001
Figure 2. Result of enamel ML (A) and LD (B) changing with time.
Crystals 16 00238 g002
Figure 3. Two-dimensional images vividly showing the gradual process of mineral loss in enamel. The color bar denotes density values represented by different colors (E-3-50).
Crystals 16 00238 g003
Figure 4. The relationship between exposed surface and ML among enamel groups sharing the same volume of solution (* means significant difference, p < 0.05).
Crystals 16 00238 g004
Figure 5. The relationship between solution volume and ML among enamel groups sharing the same exposed area (* means significant difference, p < 0.05).
Crystals 16 00238 g005
Figure 6. Result of dentin ML (A) and LD (B) changing with time.
Crystals 16 00238 g006
Figure 7. Two-dimensional images vividly showing the gradual process of mineral loss in dentin. The color bar denotes density values represented by different colors (D-3-15).
Crystals 16 00238 g007
Figure 8. The relationship between exposed surface and mineral loss among dentin groups sharing the same volume of solution (* means significant difference, p < 0.05).
Crystals 16 00238 g008
Figure 9. The relationship between solution volume and mineral loss among dentin groups sharing the same exposed area (* means significant difference, p < 0.05).
Crystals 16 00238 g009
Figure 10. The comparison of ML (A) and LD (B) between enamel and dentin.
Crystals 16 00238 g010
Figure 11. The pH value of enamel (A) and dentin (B) changing with time.
Crystals 16 00238 g011
Table 1. The sample sorting of the experiment.
Sample No.Reaction Area
(mm × mm)
Volume of Demineralization Solution (mL)Tooth Type
E-2-52 × 25Enamel
E-3-53 × 35Enamel
E-5-55 × 55Enamel
E-2-152 × 215Enamel
E-3-153 × 315Enamel
E-5-155 × 515Enamel
E-2-502 × 250Enamel
E-3-503 × 350Enamel
E-5-505 × 550Enamel
D-2-52 × 25Dentin
D-3-53 × 35Dentin
D-5-55 × 55Dentin
D-2-152 × 215Dentin
D-3-153 × 315Dentin
D-5-155 × 515Dentin
D-2-502 × 250Dentin
D-3-503 × 350Dentin
D-5-505 × 550Dentin
Disclaimer/Publisher’s Note: The statements, opinions and data contained in all publications are solely those of the individual author(s) and contributor(s) and not of MDPI and/or the editor(s). MDPI and/or the editor(s) disclaim responsibility for any injury to people or property resulting from any ideas, methods, instructions or products referred to in the content.