Article

Study of 2-Benzylidene-1-indanone Derivatives as Electrodes
by
María Elena Sánchez Vergara
1,2,*,
Ricardo Ballinas-Indili
3,
Naomi Itzel Medina Morales
1,
Emilio Iván Sandoval Plata
1,
Ruben A. Toscano
4 and
Cecilio Álvarez Toledano
4
1
Faculty of Engineering, Anáhuac University Mexico, Av. Universidad Anáhuac 46, Col. Lomas Anáhuac, Huixquilucan 52786, Mexico
2
Fidel Velázquez Technological University, Emiliano Zapata S/N, Col. El Trafico, Nicolás Romero 54400, Mexico
3
Department of Chemical Sciences, Faculty of Higher Studies Cuautitlán Campo 1, National Autonomous University of Mexico, Avenida 1o de Mayo s/n, Colonia Santa María las Torres, Cuautitlán Izcalli 54740, Mexico
4
Institute of Chemistry, National Autonomous University of Mexico, Circuito Exterior s/n, Ciudad Universitaria, México City 04510, Mexico
*
Author to whom correspondence should be addressed.
Crystals 2026, 16(2), 136; https://doi.org/10.3390/cryst16020136
Submission received: 15 January 2026 / Revised: 6 February 2026 / Accepted: 10 February 2026 / Published: 13 February 2026
(This article belongs to the Special Issue Advances in Optoelectronic Materials)

Abstract

In this work, indanone derivatives with a triphenylamine core structure (IND-1, IND-2, and IND-3) were studied as prospective electrodes. The indanones were synthesized and characterized for optimal deposition as charge-modulating electrodes. The structural arrangement of compound IND-3 was established, and the structure crystallized in a P21/c monoclinic space group. The electrodes were evaluated for reflectance and band gaps of direct and indirect transitions. Indanones show optical band gap values in the range of 2.46 and 2.86 eV. These values were compared with those obtained theoretically by means of DFT, from which the HOMO and LUMO molecular orbitals were also calculated. To evaluate the indanone response, photoactive devices with indanone-derivative electrodes and copper phthalocyanine as a photoactive electrode were fabricated. Cyclic voltammetry (CV) was conducted using a two-electrode arrangement, within a potential range of −0.1 to 1 V, a step of 10 mV, and a scan rate of 0.1 V/s. The transported current is around 10−1–104 µA, and CV revealed distinct behaviors related to each kind of indanone. Finally, the electrodes were removed from each device and analyzed by IR spectroscopy, demonstrating that they did not undergo degradation during operation and can continue to be used for the manufacture of other devices.

1. Introduction

In the field of energy storage, solid-state battery technologies have advanced to the forefront for their widespread use, ranging from small devices to electric vehicles (EVs) and grid energy storage [1]. The primary difference between conventional and solid-state batteries lies in the use of a solid electrolyte, as opposed to a liquid electrolyte, through which ions flow [2]. This produces a high-energy density and secure energy storage [3]. Solid electrolytes may be composed of ceramic, polymer, glass, or sulfide materials, which facilitate ion transport between the anode and cathode, without the risks associated with liquid electrolytes, such as volatility and combustibility [4]. Additionally, they increase the battery lifespan, as these materials are more durable and chemically stable [4]. On the other side, electrolyte–electrode interphases are crucial for the proper performance of a solid device, which need to satisfy several criteria: displaying appropriate ionic conductivity (>0.1 mScm−1), possessing a broad electrochemical stability window (ESW), showcasing robust mechanical properties to hinder dendrite infiltration, maintaining cost-effectiveness, and offering ease of processing [5]. Other factors, such as non-toxicity and low-cost materials, are also of great importance for electrochemical devices. For instance, sulfide- and oxide-based materials, currently used in electrochemical devices, do not meet these requirements [6].
Organic materials are promising candidates for battery manufacturing due to their chemical diversity, sustainability, affordability, light weight, and low environmental impact. Despite the numerous advantages of organics, there are also many limitations associated with them. For instance, most organics are non-porous solids, therefore inhibiting the use of active centers and slowing down electrolyte ion movement [7]. Furthermore, reported organic cathode materials have shown relatively low operating voltages of 1.9–2.4 V vs. Li+/Li with sulfide solid electrolytes, which are also lower than their counterparts in liquid electrolytes [8]. Recently, covalent organic frameworks (COFs) and metal-organic frameworks (MOFs) have become strong candidates for solid-state device electrolytes. These materials have gained attention due to their unique porous structures, which facilitate ion transport, improve charge flow, and enhance overall battery performance [9,10,11,12]. MOFs are configured from metal ions or clusters coordinated with organic ligands, forming highly porous two- or three-dimensional structures with tunable voids. On the other hand, COFs are composed of lightweight elements, like carbon, hydrogen, oxygen, nitrogen, and boron, which form stable covalent bonds that result in large, ordered frameworks [9]. While these unique properties have attracted interest in the fabrication of organic batteries, the necessity for the development of new organic materials and new organic devices remains, not only for the manufacture of conventional electrochemical devices but also for organic photoactive devices with functional electrodes. For these reasons, this work presents the synthesis and characterization of 2-benzylidene-1-indanone derivatives, studied as a novel proposal for the manufacture of organic photoactive devices. Some authors of this work have previously studied indanones as components of solid-state organic optoelectronic devices [13,14,15], and due to their excellent charge transport properties, the studied indanones are now proposed as functional electrodes of photoactive devices. Furthermore, as a novel approach, this study proposes the synthesis of indanone derivatives with a triphenylamine (TPA) core structure. Organic compounds incorporating TPA have important properties such as low cost, a broad structural versatility, and suitable hole carrier mobility. TPA has, therefore, become a valuable unit for a wide range of organic materials employed in solar cells, capacitors, OLEDs and hole-transport devices [16]. The stability of TPA and its derivatives makes them optimal for optoelectronic applications as active electrode materials [17,18,19].

2. Materials and Methods

All of the following reagents were employed as acquired, o-phthalaldehyde, acetophenone, 4′-iodoacetophenone, 4-(diphenylamino) phenylboronic acid pinacol ester, triphenylamine, acetyl chloride, copper phthalocyanine (CuPc), nylon 11 (polyundecanolactam: [-NH(CH2)10CO-]n), and tetra propylammonium bromide (TPAB: C12H28NBr), and they were obtained from commercial suppliers (Sigma-Aldrich, Carlsbad, CA, USA). Dry dichloromethane, dry tetrahydrofuran, ethyl acetate, n-hexane, ethanol, and silica gel 60 (0.063–0.200 mm), and 70–230 mesh ASTM were acquired from Merck (Merck-Millipore, Steinheim, NW, Germany). Fusion temperatures were obtained using a Melt-Temp II apparatus and are uncorrected. FTIR spectroscopy was obtained using a Bruker Tensor 27 (Bruker, Ettlingen, BW, Germany). The acquisition of 1H and 13C NMR spectra was evaluated in CDCl3 using a Bruker 300 Ascend (Bruker, Ettlingen, BW, Germany) at 300 and 75 MHz, respectively. The mass spectra were measured with a JEOL JMS-T100LC spectrometer (JEOL Ltd., Tokyo, Japan). The DART ionization method employed a polyethylene glycol 600 matrix and a high-resolution mass measurement. Suitable crystals of IND-3 were grown by slow evaporation of CH2Cl2 at room temperature for detailed scrutiny of its molecular structure with an X-ray diffraction study, performed with a Bruker Smart Apex CC diffractometer at a wavelength l(Mo-Ka) = 0.71073 Å (graphite monochromator) and a temperature T = 298 K.

2.1. Synthesis and Characterization of Indanone Derivatives

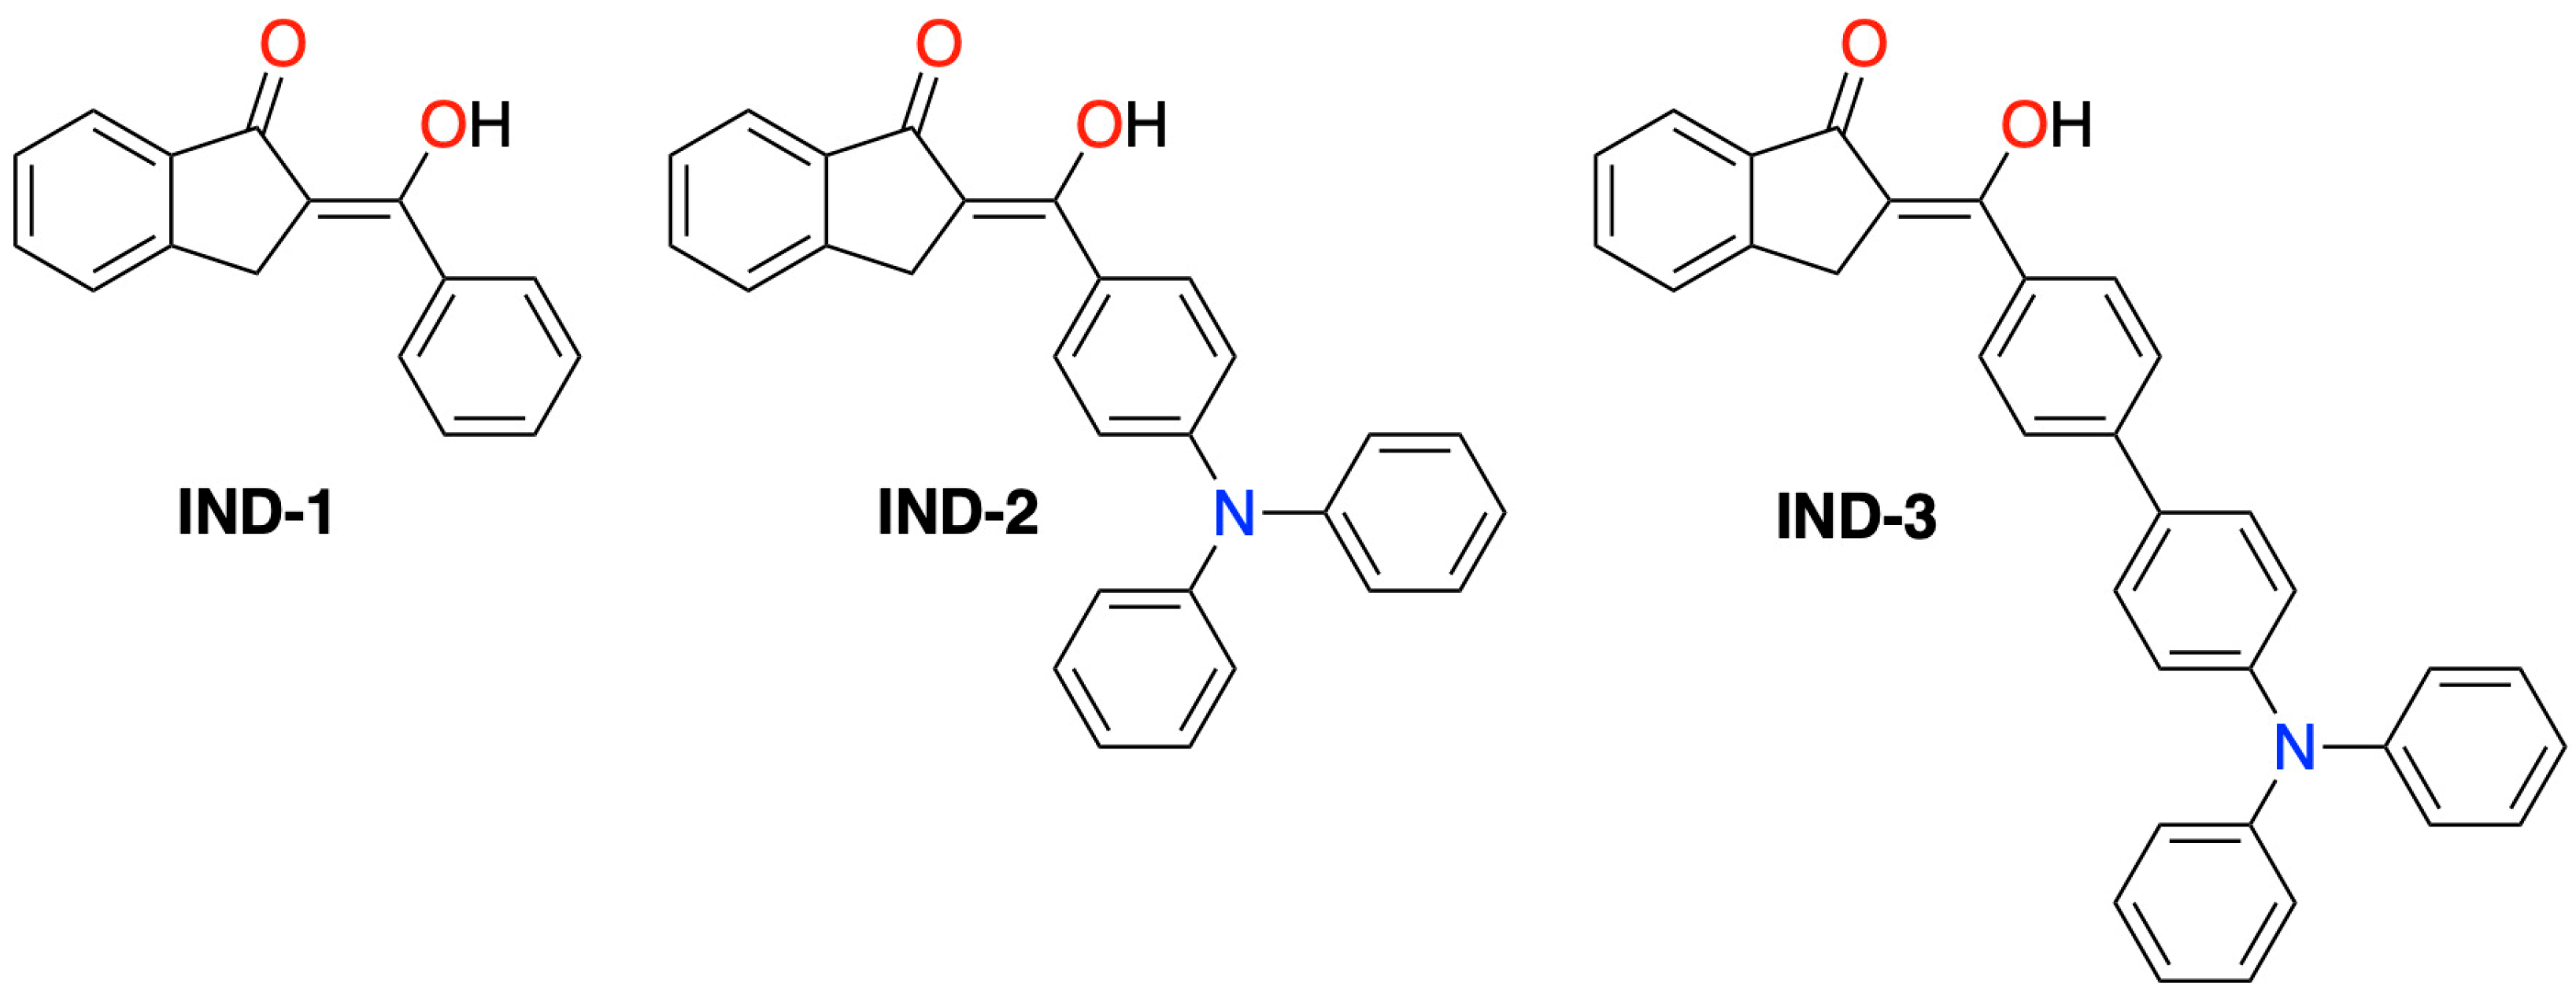
The indanone derivatives (IND-1, IND-2, and IND-3) were synthesized based on a procedure reported by our research group [20]. The corresponding acetophenone (3.0 mmol, 1 equiv) and o-phthaldehyde (3.0 mmol, 1 equiv) were added to an ethanolic solution of sodium hydroxide (2.5 equiv), with ultrasonic irradiation employed as a non-conventional activation method. The mixture was placed in an ice bath and stirred at 0 °C for 30 min, with added hydrochloric acid for a pH of 1–2. The resulting solids were filtered and purified by column chromatography, using ethyl acetate/n-hexane as eluent (97:3). The molecular structures are shown in Figure 1.
It should be emphasized that IND-3 is a novel molecule; therefore, corresponding spectroscopic information is included in this document. IND-1 and IND-2 have been previously reported; hence, their physical and spectroscopic data are correlated with the literature information [20,21].
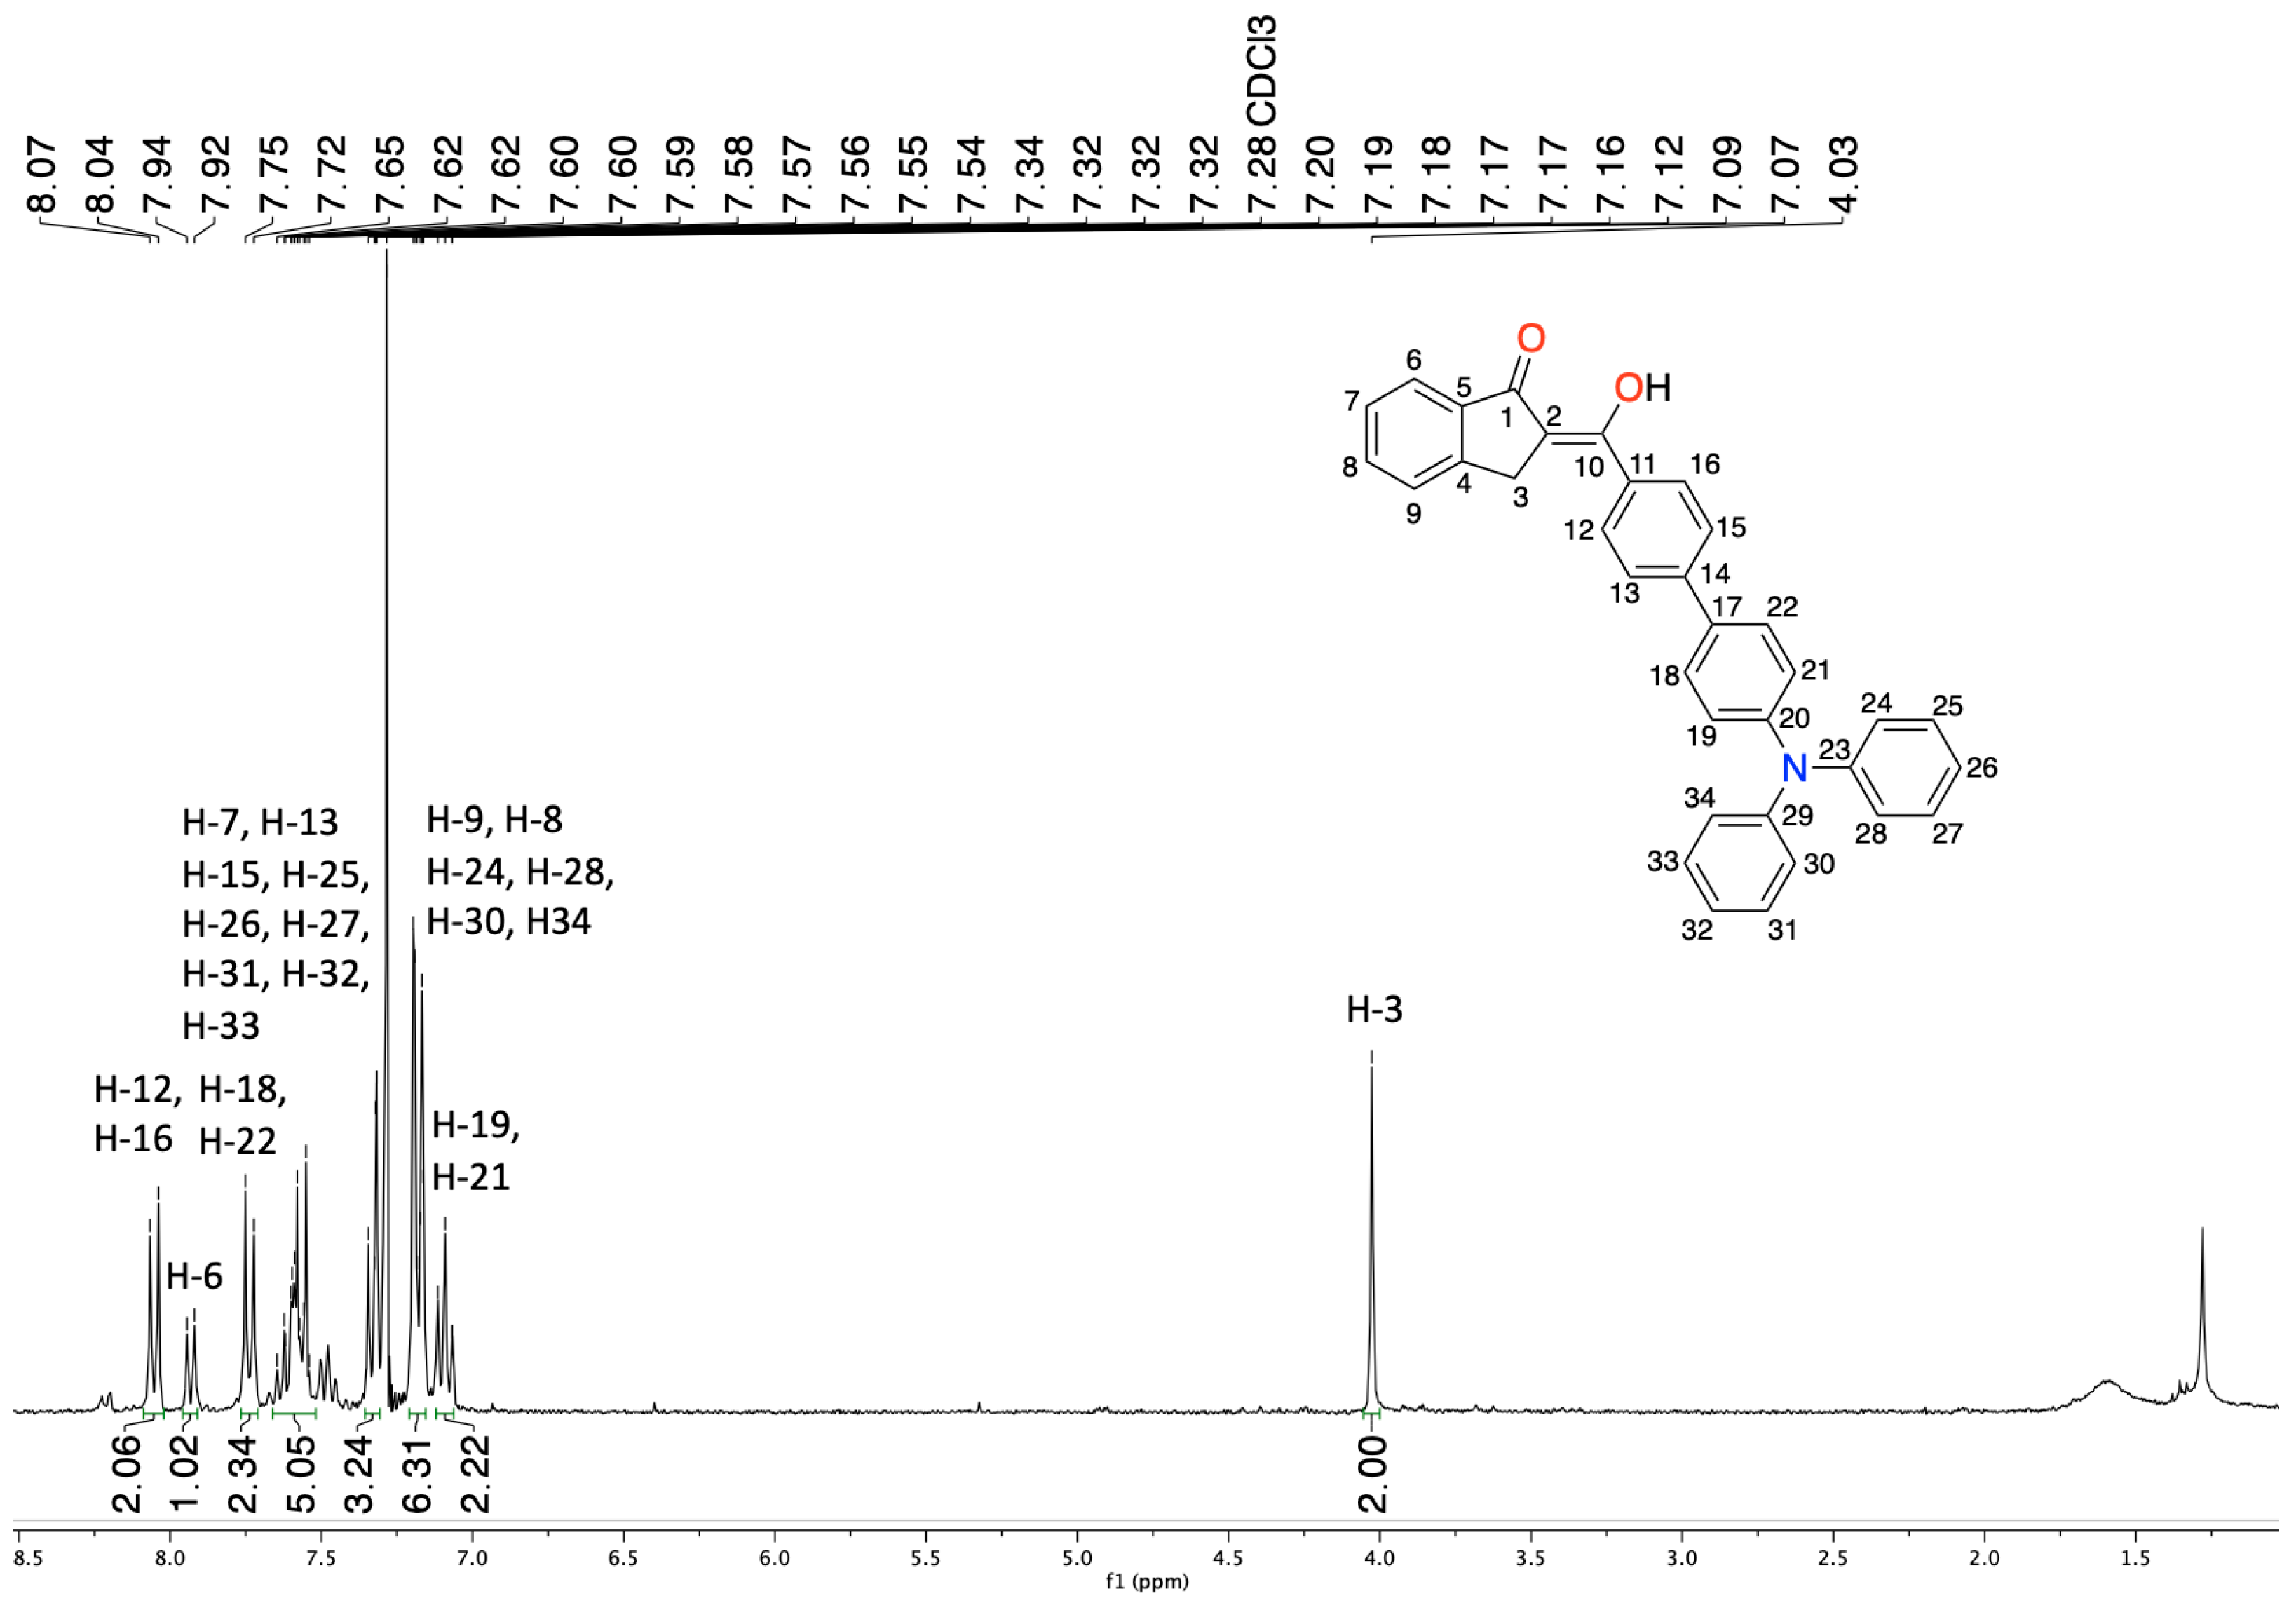
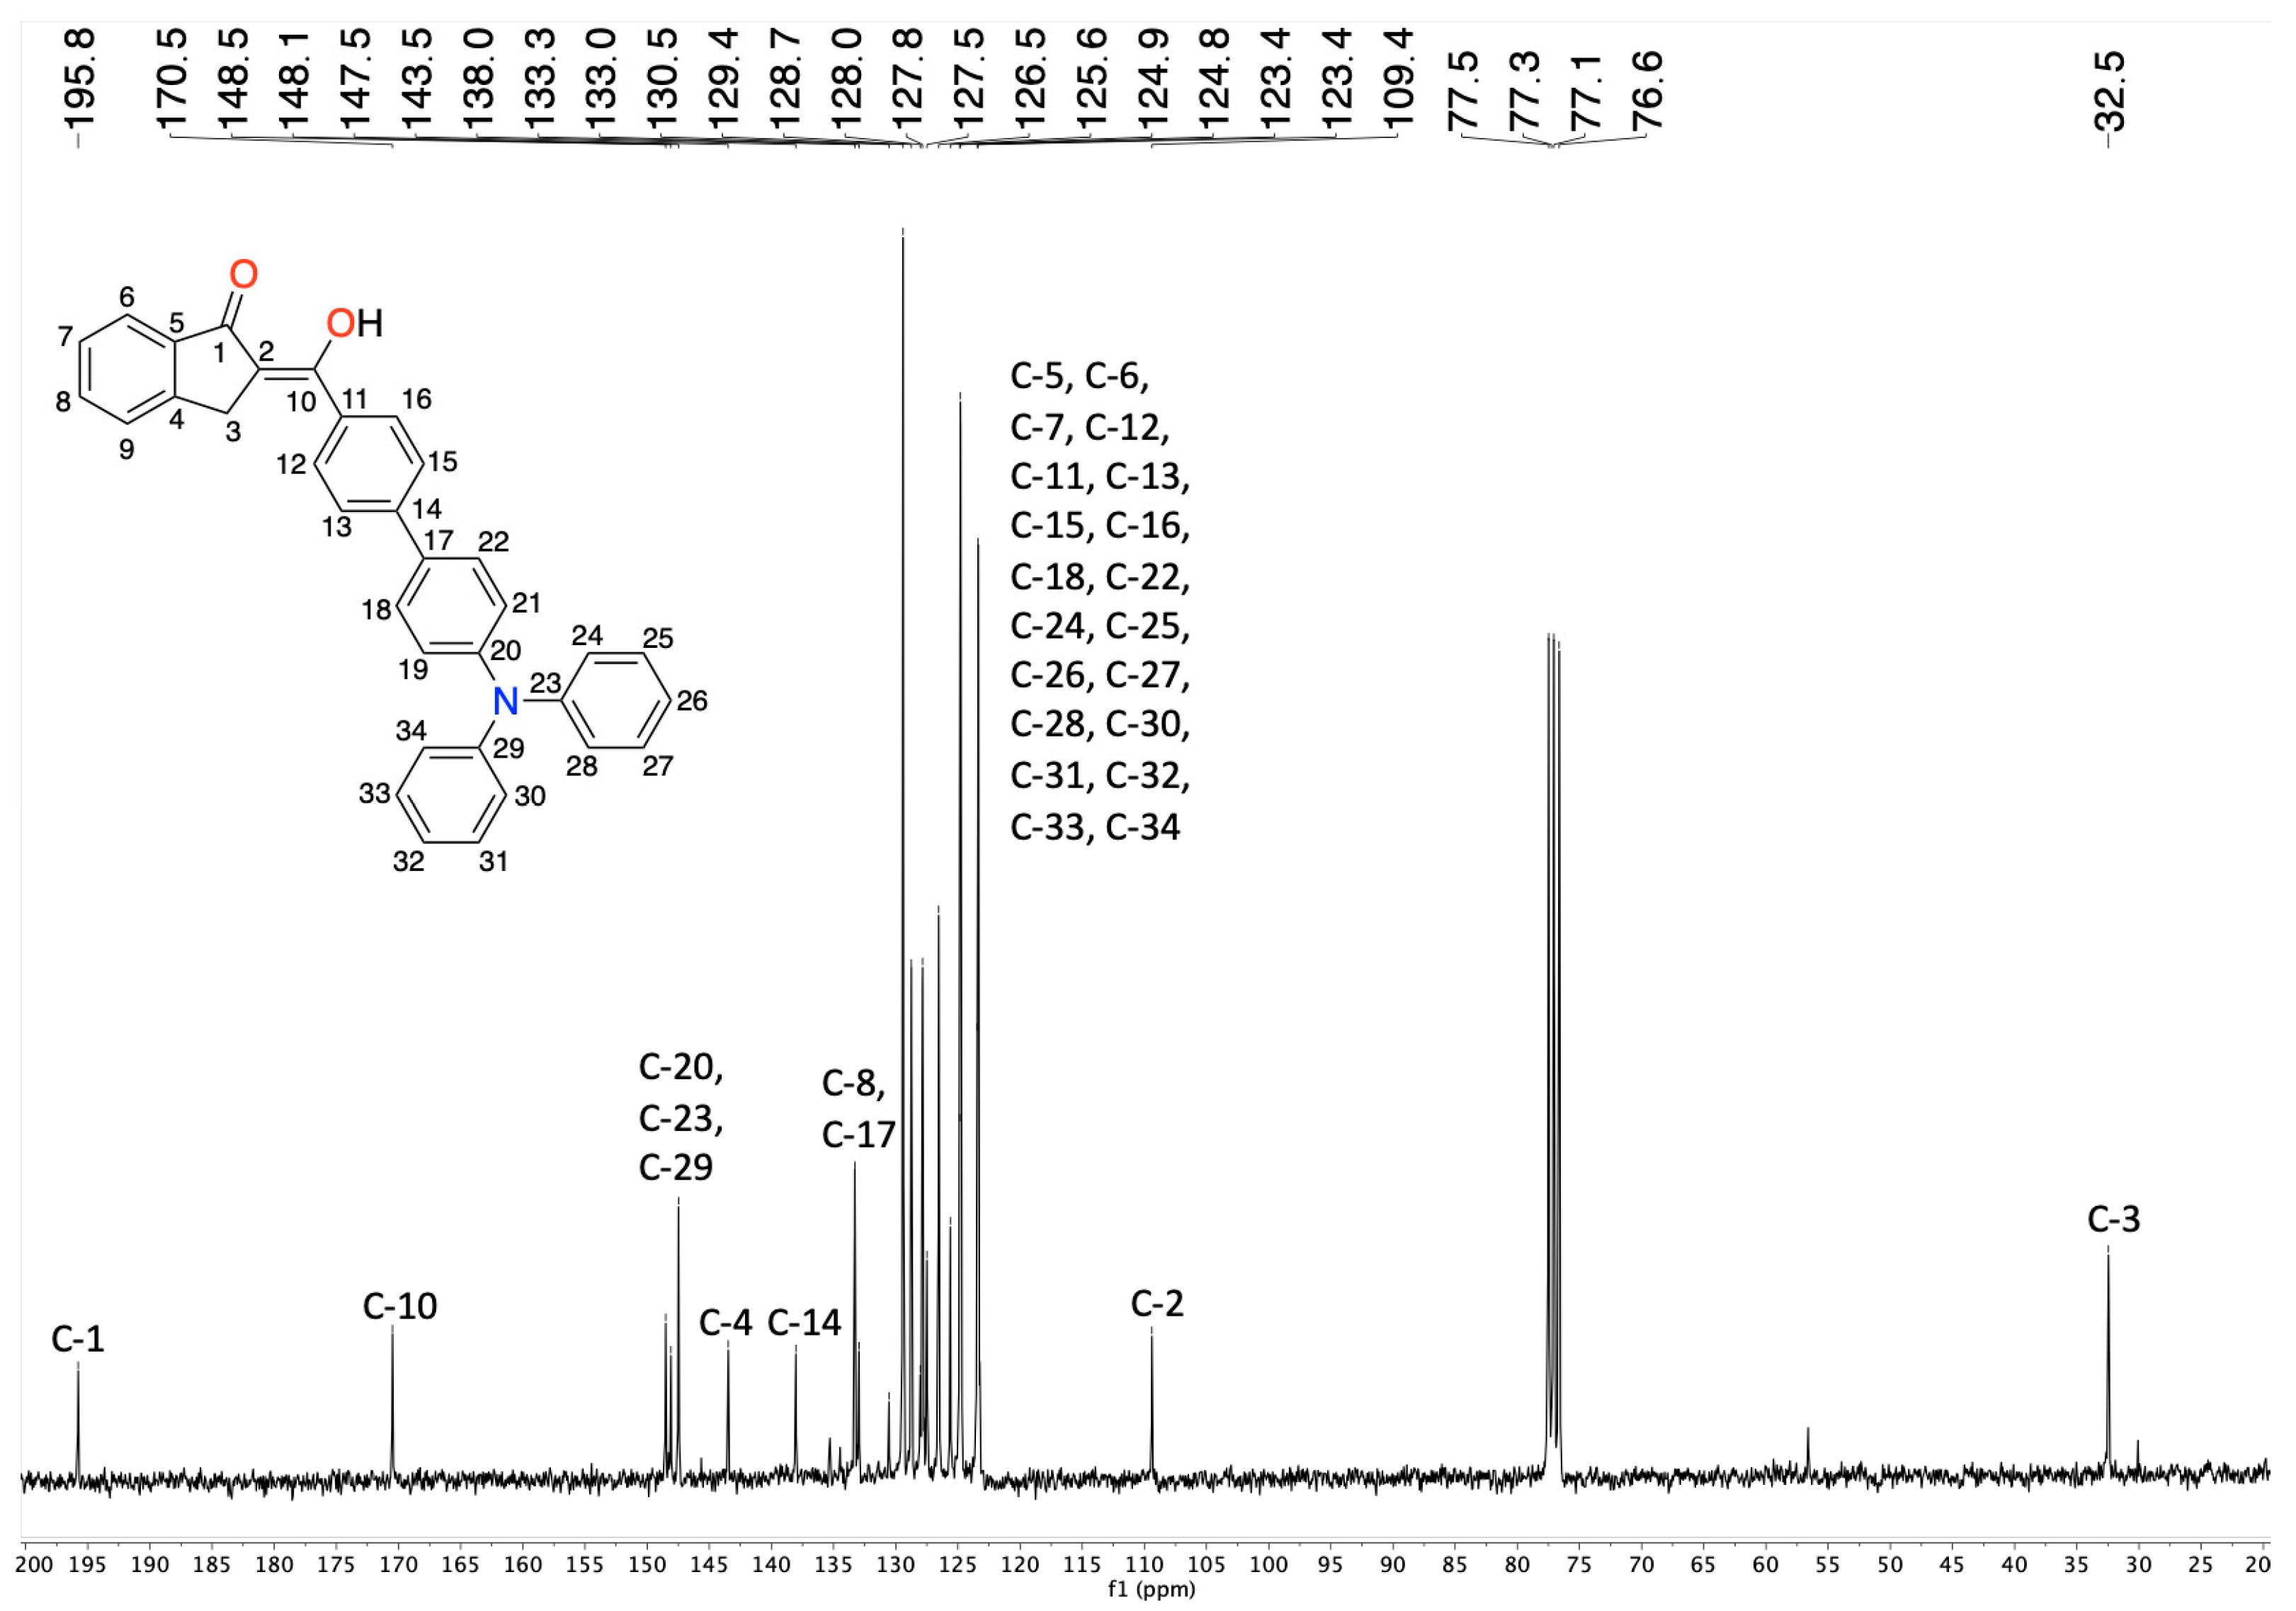
IND-3 (Z)-2-((4′-(diphenylamino)-[1,1′-biphenyl]-4-yl)(hydroxy)methylene)-2,3-dihydro-1H-inden-1-one. Orange solid, mp: 182 °C, 82% yield, FTIR (cm−1): 2957 (C-H), 1679 (C=O), 1587 (C=C). HRMS elemental composition C34H26NO2, [M + 1]+ (error of −3.75 ppm), exact value of 480.1945 Daltons, and precise value of 480.1963 Daltons. 1H-NMR (300 MHz, CDCl3): 8.05 (d, J = 9 Hz, 2H, H-12, H-16), 7.93 (d, J = 6 Hz, 1H, H-16), 7.73 (d, 2H, J = 9 Hz, H-18, H-22), 7.65–7.54 (m, 5H, H-25, H-26, H-27, H-31, H-32, H-33), 7.34–7.32 (m, 3H, H-7, H-13, H-15), 7.20–7.16 (m, 6H, H-8, H-9, H-24, H-28, H-30, H-34), 7.09 (d, J = 9 Hz, 2H, H-19, H-21), 4.03 (s, 2H, H-3). 13C-NMR (75 MHz, CDCl3): 196.0 C-1, 170.5 C-10, 148.5 C-20, 148.1 C-23, 147.5 C-29, 143.5 C-4, 138.0 C-14, 133.3 C-8, 133.0 C-17, 129.4, 128.7, 128.0, 127.8, 127.5, 126.5, 125.6, 124.9, 124.8, 123.4, 109.4 C-2, 32.5 C-3.
Cyclic voltammetry (CV) was performed using a Metrohm µStat 400 bipotentiostat-galvanostat (Metrohm, México City, México) with dedicated DropView 8400 software, version 3.78. The measurements were carried out in an acetonitrile solution with 10−5 M TPAB as the supporting electrolyte, employing Metrohm 110 carbon screen-printed electrodes, with working and auxiliary carbon electrodes, and a silver reference electrode. Scans were recorded within a potential range of −1.5 to 1.5 V at a scan rate of 50 mV/s and a 2 mV step. Additionally, UV-vis analysis in these solutions was conducted on a Thermo Scientific Evolution 220 UV-vis (Thermo Fisher Scientific, Waltham, MA, USA).

2.2. Structure Solution and Refinement

The structure was assessed with direct methods in the SHELXS program. All non-hydrogen atoms were anisotropically refined using a full-matrix, least-squares technique, and all hydrogens were placed in idealized positions using the riding hydrogen model approximation. Structural solutions and refinements were performed using SHELXTL [22]. The crystallographic data and refinement details for IND-3 are summarized in Table 1. CCDC 2526647 contains the supplementary crystallographic data (Supporting Information) for this paper.

2.3. Computational Details

Density functional theory (DFT) computations were carried out using the M06 functional [23], incorporating Grimme’s D3 dispersion correction [24] and employing the ORCA 6.1 program package [25] with the 6-31G(d,p) basis set. Geometry optimizations were performed in acetonitrile using the Solvent Model Density (SMD) continuum approach [26], as well as in vacuo. To confirm that optimized structures corresponded to true energy minima, vibrational frequency analyses were conducted, verifying the absence of imaginary frequencies. Theoretical absorption spectra of the indanone derivatives were obtained by time-dependent DFT (TD-DFT) at the same level of theory at the optimized ground state [27]. Non-covalent interaction (NCI) index calculations were performed for CuPc employing NCIPLOT software version 4.3 [28] from a previously DFT-optimized structure.

2.4. Electrode Manufacturing and Characterization

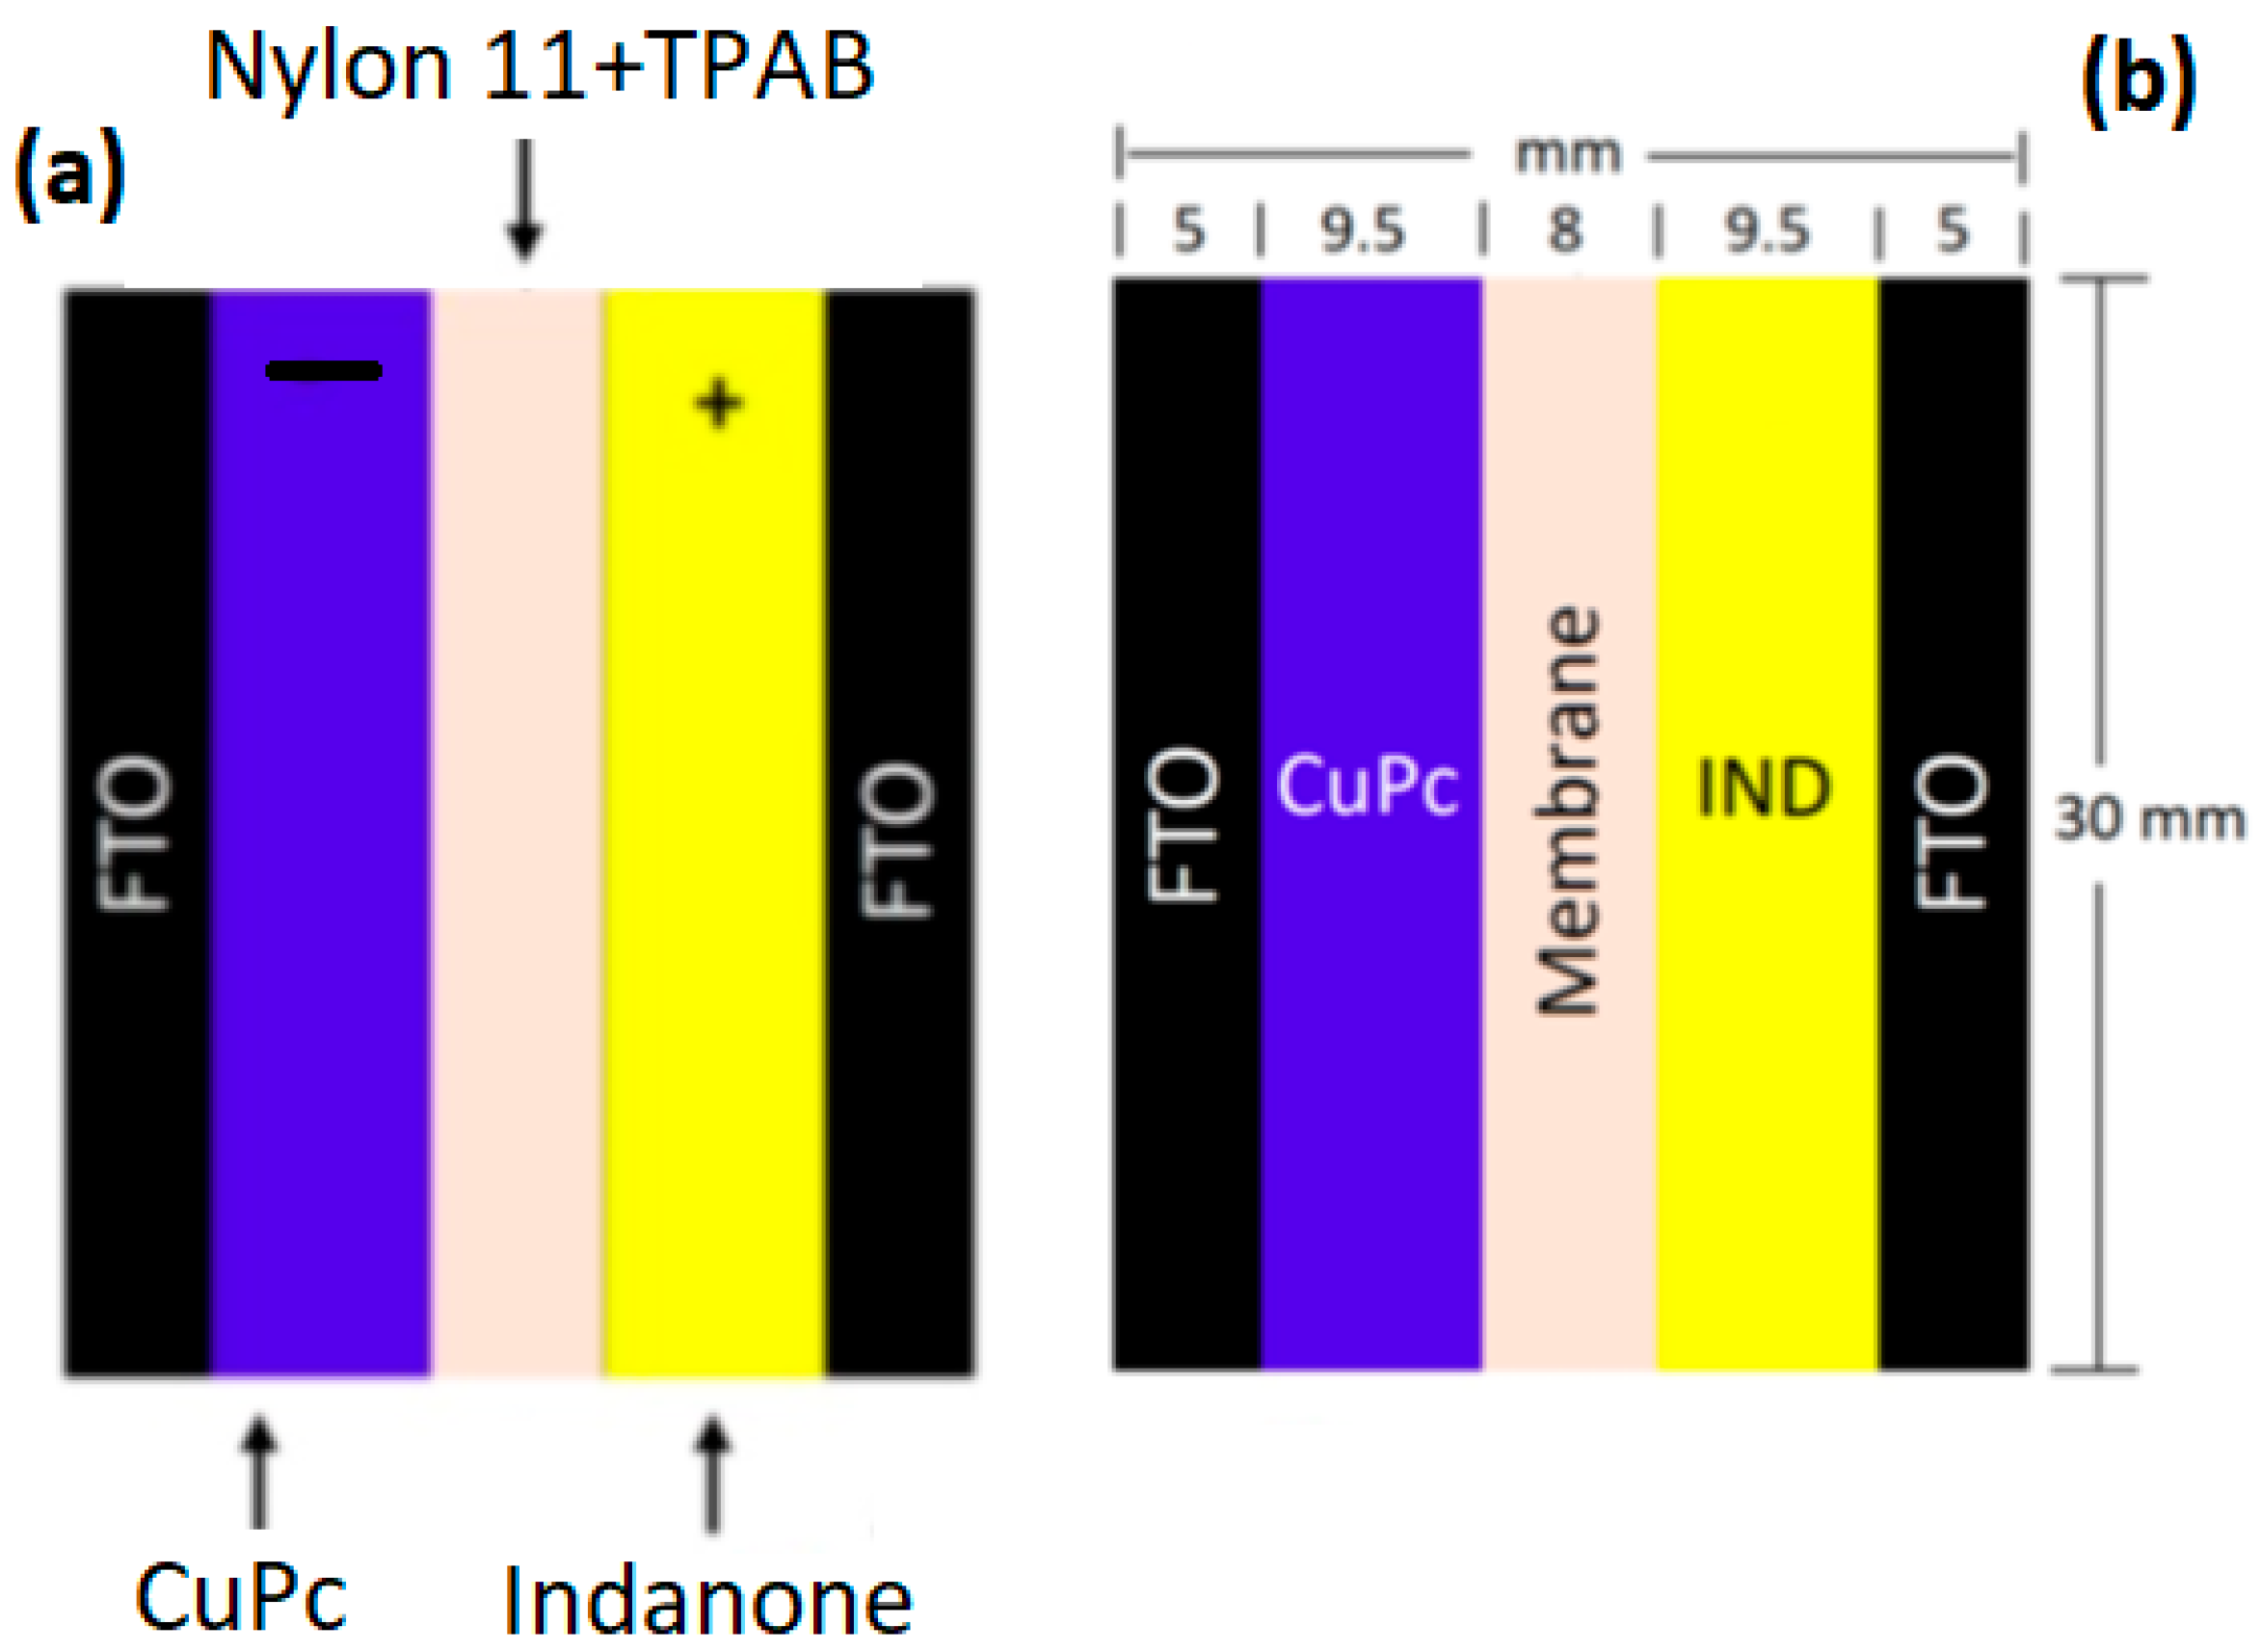
The electrodes were fabricated on fluorine-doped tin oxide (FTO)-coated glass slides, which were previously ultrasonically cleansed with chloroform, methanol, and acetone. Three types of electrodes were manufactured, each with a distinct indanone (see Figure 1) as the first electrode. The fabrication process was carried out using a high-vacuum evaporation system equipped with a mechanical and a turbomolecular pump. IND-1, IND-2, and IND-3 electrodes were evaporated at a vacuum of 10−5 torr, with a deposition rate of 1.3 Å/s, reaching a thickness of 124 Å, 135 Å, and 387 Å, respectively. The variations in thickness are a result of structural changes in each indanone. Optical parameters were measured using a UV–vis 300 Unicam spectrophotometer (Thermo Fisher Scientific, Waltham, MA, USA) in a wavelength range from 200 to 1100 nm. IR spectroscopy was carried out using a Nicolet iS5-FT spectrometer (Thermo Fisher Scientific, Inc., Waltham, MA, USA). For the electrochemical evaluation, three devices were fabricated using FTO as the collector, IND-1, IND-2, or IND-3 as the first electrode, and CuPc as the second electrode (Figure 2a). The devices consisted of a solid polymer electrolyte, which also functioned as a separating membrane within the device, and was composed of nylon 11 and TPAB. Phthalocyanine was used for its suitable optical and electronic properties, while nylon 11 and TPAB were chosen for the combination of properties they impart to the solid polymer electrolyte, which is electronically insulating and has sufficient ionic conductivity. The devices were also manufactured using high vacuum evaporation, and the deposition sequence was as follows: (i) nylon 11 was deposited between the electrodes. The deposition was performed at a vacuum of 5.2 × 10⁻⁶ torr, with a deposition rate of 7.9 Å/s, reaching a thickness of 7.002 kÅ. (ii) The CuPc electrode was deposited next, at a vacuum of 4.7 × 10⁻⁵ torr, with a deposition rate of 18.4 Å/s, reaching a thickness of 1.061 kÅ. (iii) The indanones were deposited according to the vacuum and speed mentioned above. The dimensions of the different device components are shown in Figure 2b. (iv) The devices were annealed for 10 min at 40 °C. Electrical behavior measurements were performed using 0.4 mL of TPAB as a supporting electrolyte over the nylon 11 membrane. Solid-state CV measurements were carried out using a two-electrode arrangement, within a potential range of −0.1 to 1 V, a step of 10 mV, and a scan rate of 0.1 V/s. The CV was performed without illumination, under real operating conditions, to observe the response between the indanones and the CuPc. The phthalocyanine is in a photoexcited state, which allows the evaluation of the functional behavior of the indanone as a charge modulator.

3. Results and Discussion

3.1. Synthesis and Spectroscopic Data of Indanone Derivatives

The indanone derivatives (IND-1, IND-2, and IND-3) were synthesized according to the procedure described by our research group [21]. The compounds IND-1 and IND-2 were characterized by comparing the HRMS and 1H NMR data obtained with those described in the literature, with the results shown in the Supporting Information. The new molecule IND-3 was characterized by FTIR, HRMS, 1H-NMR, and 13C-NMR, in complement with single-crystal X-ray diffraction analysis. FTIR spectroscopic analysis showed an atypical band for carbonyl vibration (C=O) and a band corresponding to the C=C double bond. Mass spectrometry allowed the obtention of the molecular ion using DART as an ionization source, confirming the formation of the compound. Moreover, 1H expected signals and multiplicities were appropriately observed; related to 13C data, the typical shifts were appropriately correlated with those previously observed in other developed indanone derivatives by our research group. A summary of the characterization of the molecule IND-3 is presented; it is observed that the characteristic 1H-NMR shift (Figure 3) for the methylene fragment of the indanone core is 4.03 ppm, assigned to H-3. Moreover, the signals in 8.07–7.07 corresponded to the aromatic ring of the indanone and triphenylamine fragment.
Related to the 13C-RMN shown in Figure 4, the characteristic signals for the carbonyl carbon C-1 and enol carbon C-10 are present at 195.8 and 170.5 ppm, respectively. Furthermore, the vinyl carbon C-2 is shown at 109.4 ppm, corresponding to the b-diketone system. The rest of the carbons in the aromatic systems can be observed in a range from 170.4 to 123.4 ppm. Finally, the signal of methylene from the indanone nucleus appears at 32.5 ppm.
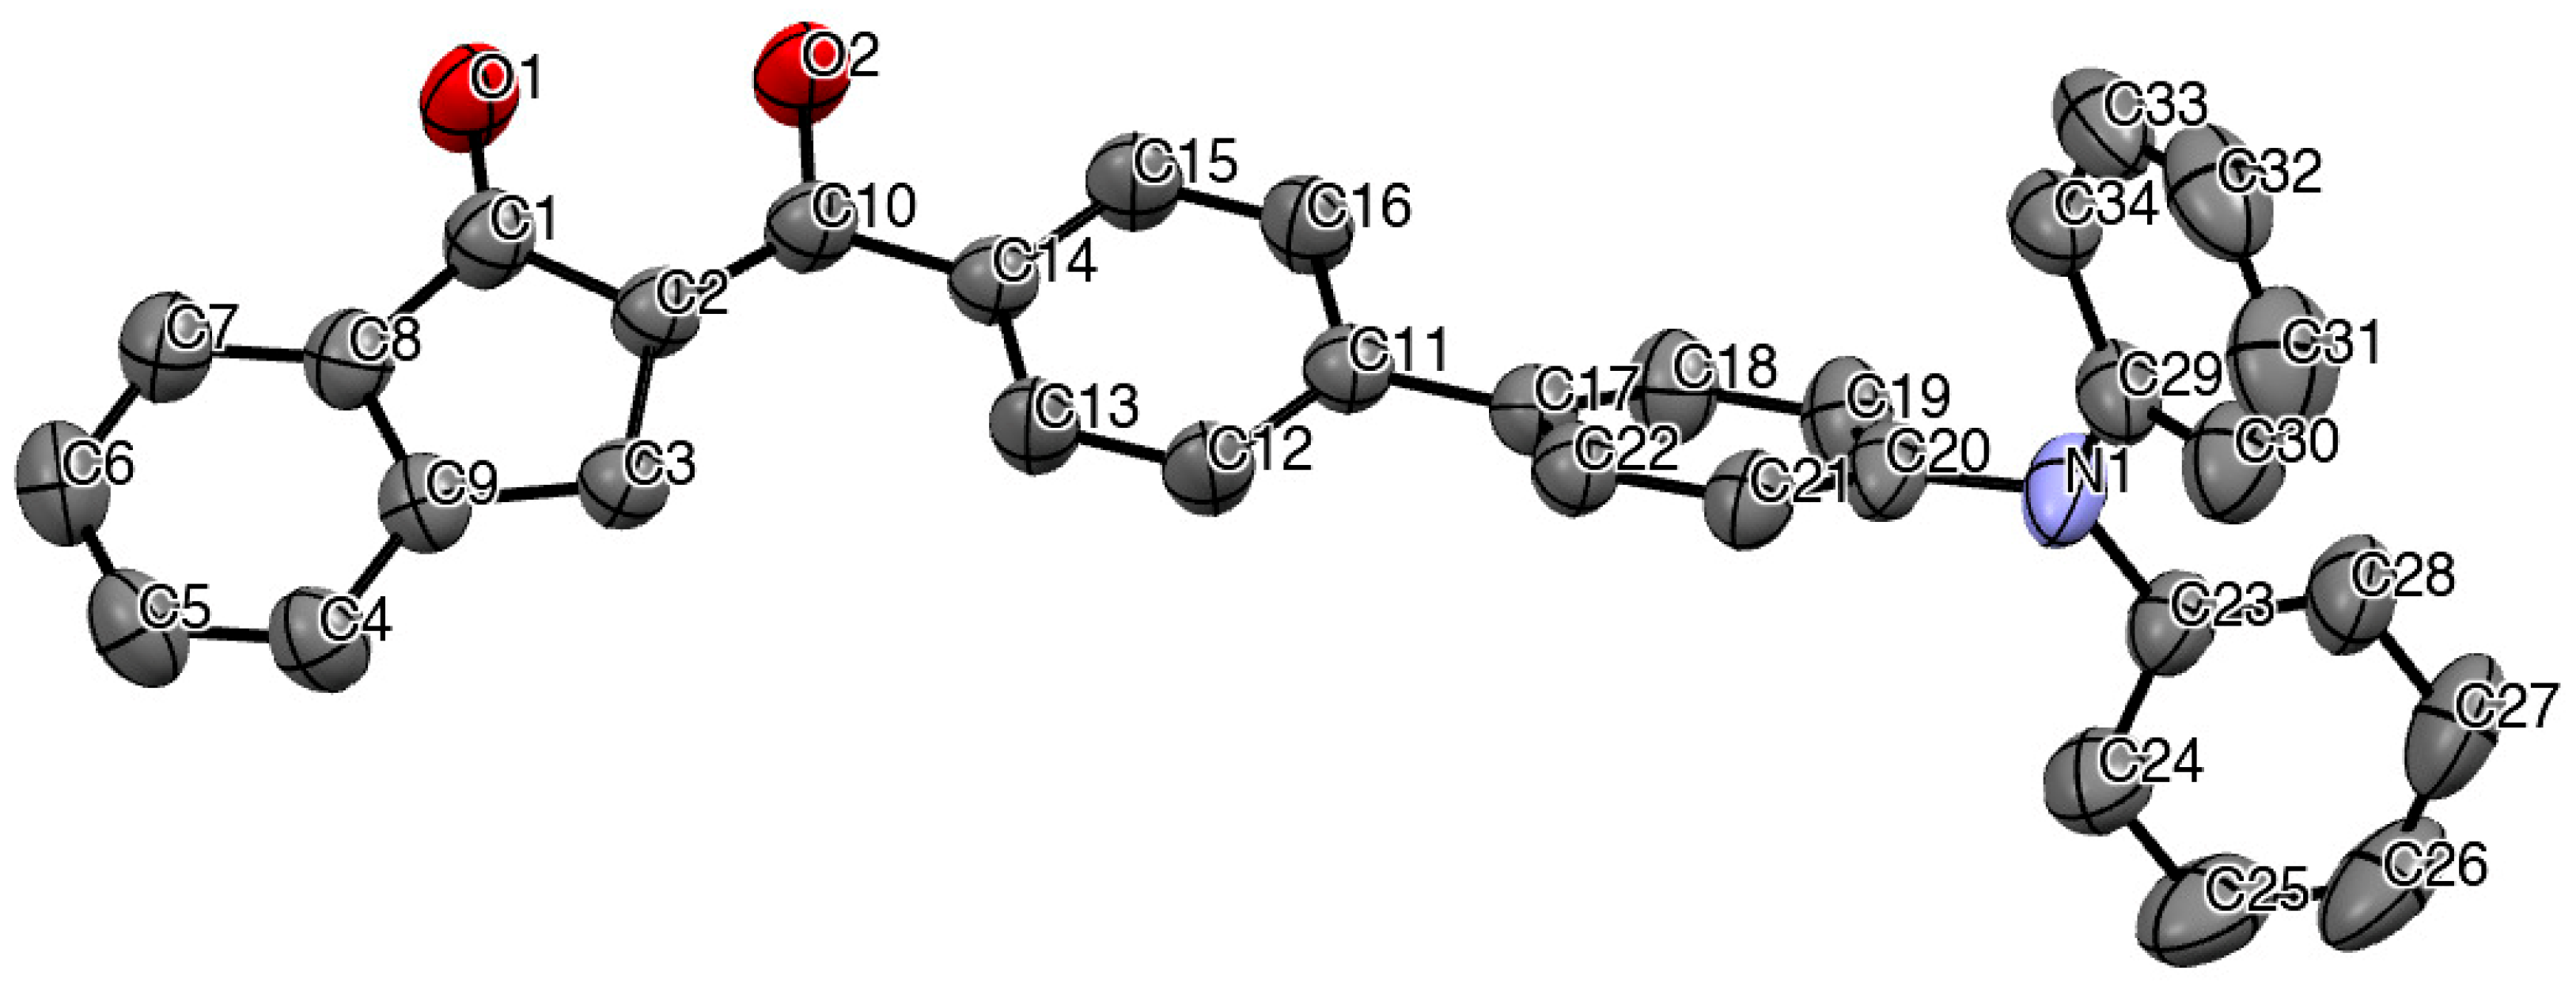
In addition, the structural arrangement of compound IND-3 was explicitly established using a single-crystal X-ray diffractometer, with the crystal structure shown in Figure 5, where only the enol form exists in the crystal due to the strong stability of the enol arrangement. The structure crystallized in a P21/c monoclinic space group, exhibiting bond distances of 1.448(19) Å between C1 and C2 of a double bond, 1.252(18) Å between C1 and O1 of a carbonyl group, and 1.336 Å between C10 and O2 of the hydroxyl group (Table 2). The molecular structure reveals the presence of an intramolecular interaction through an O-H⋯O hydrogen bond = 2.56 Å, following what has been observed previously for this type of molecule (Table 3). In the FTIR (Supplementary Information), the compound IND-3 presents characteristic C=O bands at 1679 and 1587 cm−1. Finally, for the mass spectrometry data acquired by DART+ (Supplementary Information), a low-intensity peak was observed at m/z 480, corresponding to the molecular ion [M + H]+.
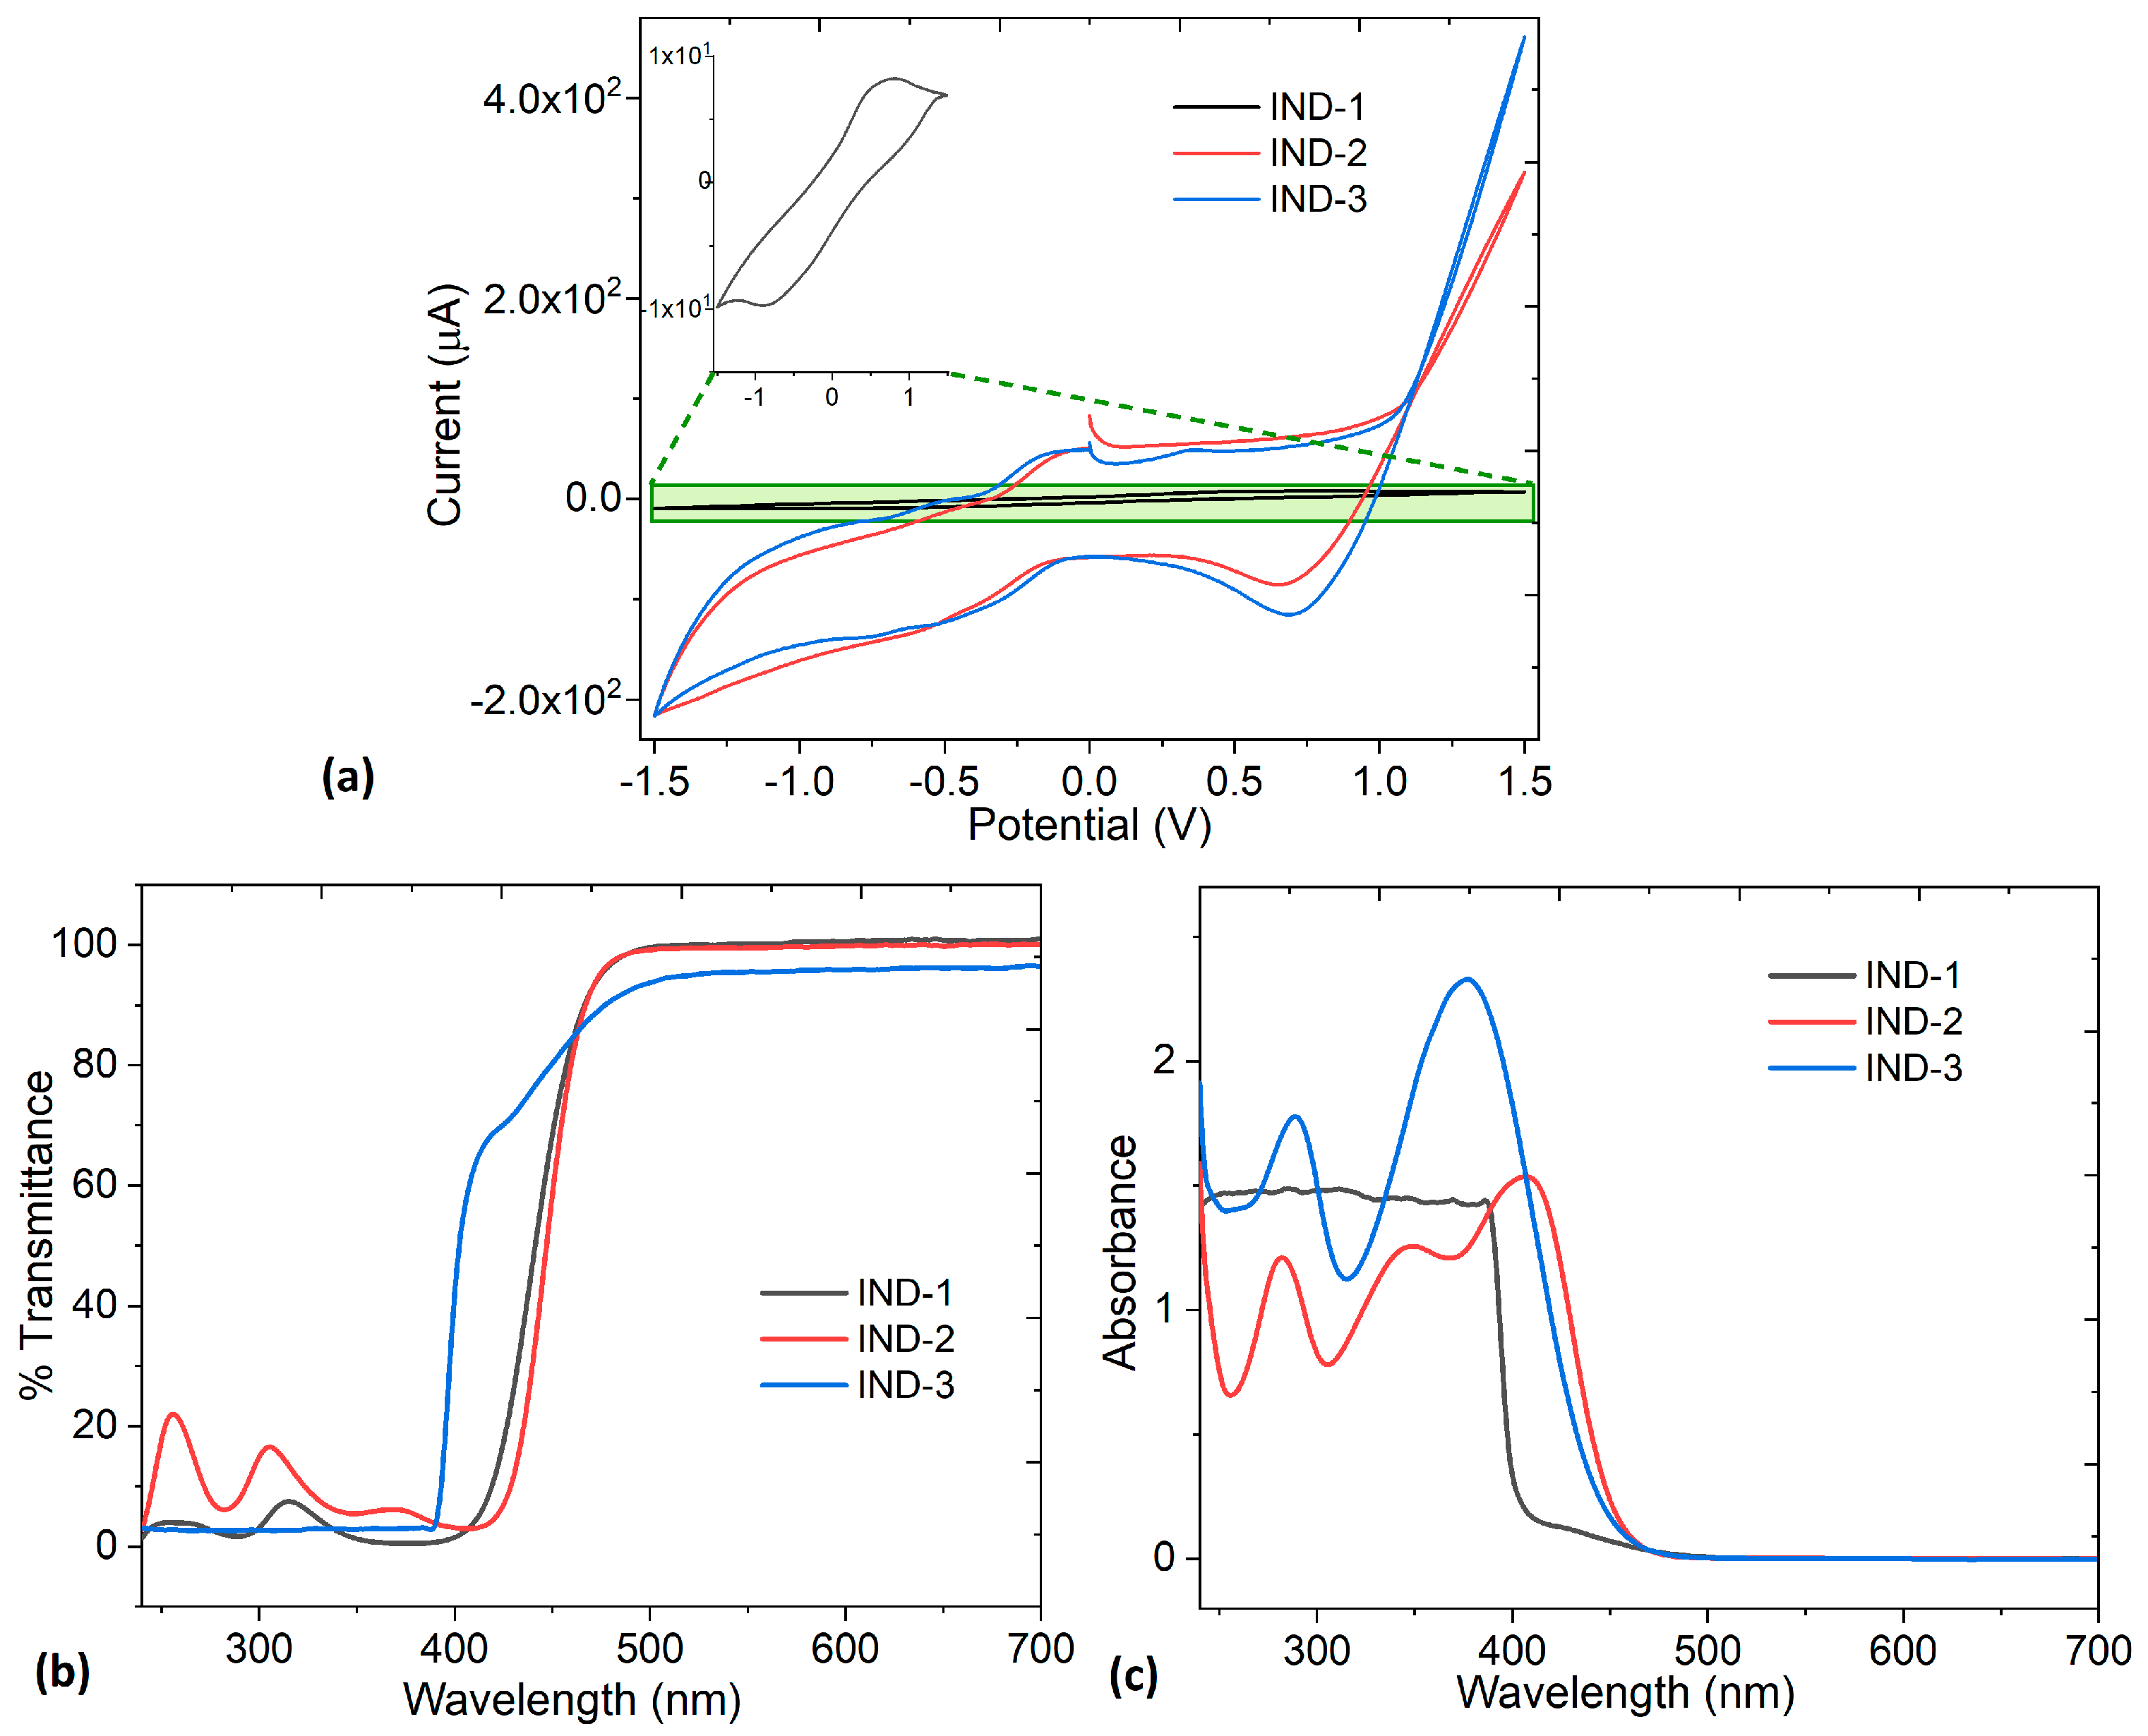
CV was performed on the indanones to determine their oxidation-reduction capacity and the reversibility of this process. Figure 6a presents the voltammograms for each of the indanones IND-2 and IND-3, and their precursor IND-1, in the inset. The difference in electrochemical behavior between the precursor and the indanones is evident. While the former shows a reversible reaction, the indanones exhibit a different behavior. For these species, only the reduction zone is observed to exhibit a reversible potential, indicating that they can act as electrodes in a photoactive device.
With respect to optical properties, the transmittance spectra in Figure 6b exhibit two zones of distinct behavior. The first is formed by the short wavelength range region (λ < 390 nm), and the second is formed in the infrared non-absorbing and longer wavelength visible range regions (λ > 390 nm). Spectral variation of each indanone occurs due to differences in its chemical structure. However, all the indanones become completely transparent at wavelengths greater than 500 nm and could be good candidates for the design of electrodes. Regarding the absorbance spectra of indanones IND-2 and IND-3 (Figure 6c), marked differences are observed with respect to the spectrum of IND-1, the molecule without the triphenylamine fragment. Although the IND-1 spectrum shows weak signals between 230–260, 296, and 360 nm, which may correspond to the π-π* electronic transitions of the aromatic ring and n-π* of the carbonyl group of indanone, these signals are not as evident as in the IND-2 and IND-3 spectra. This may be because the transitions are mixed, generating individual bands that are no longer distinguishable in the spectrum. In the spectra of IND-2 and IND-3, two bands can be observed, between 190 and 270 nm, the band referring to the π-π* electronic transitions within the conjugated indanone system, and the small band between 270 and 320 nm, corresponding to the transition of non-bonding electrons (n) from the oxygen of the carbonyl group to the π* system. Charge transfer interactions from the donor TPA to the acceptor indanone of IND-2 and IND-3 are evidenced by the broadband between 340 and 470 nm. Electronic transitions are indicative of the semiconductor behavior that the indanone TPA systems of IND-2 and IND-3 can exhibit. When these compounds absorb energy as light, their electrons are excited from their occupied orbitals to unoccupied ones, generating charge carriers that move with ease and allow electrical conduction within the molecules. Since the transitions lie within the visible range, it is considered that indanones may be very useful in organic photoactive devices as electrodes. To complement this information, it is necessary to determine the optical band gap of IND-1, IND-2, and IND-3, as it is a key parameter that determines the charge transport capacity of organic semiconductors. The optical band gap is considered the minimum energy required to create an exciton and can be assessed employing different methods. The band gap initially obtained in this work was derived from the absorbance spectrum, as this is the common method when comparing the charge-carrying capacity of materials within the same family, as is the case here with indanones. To determine the optical band gap (Eopt) from the absorbance spectrum, the linear section of the lower-energy band of the spectrum was extrapolated and intersected with the abscissa. With this wavelength value, the Eopt is obtained from Equation (1):
Eopt = 1240/λ
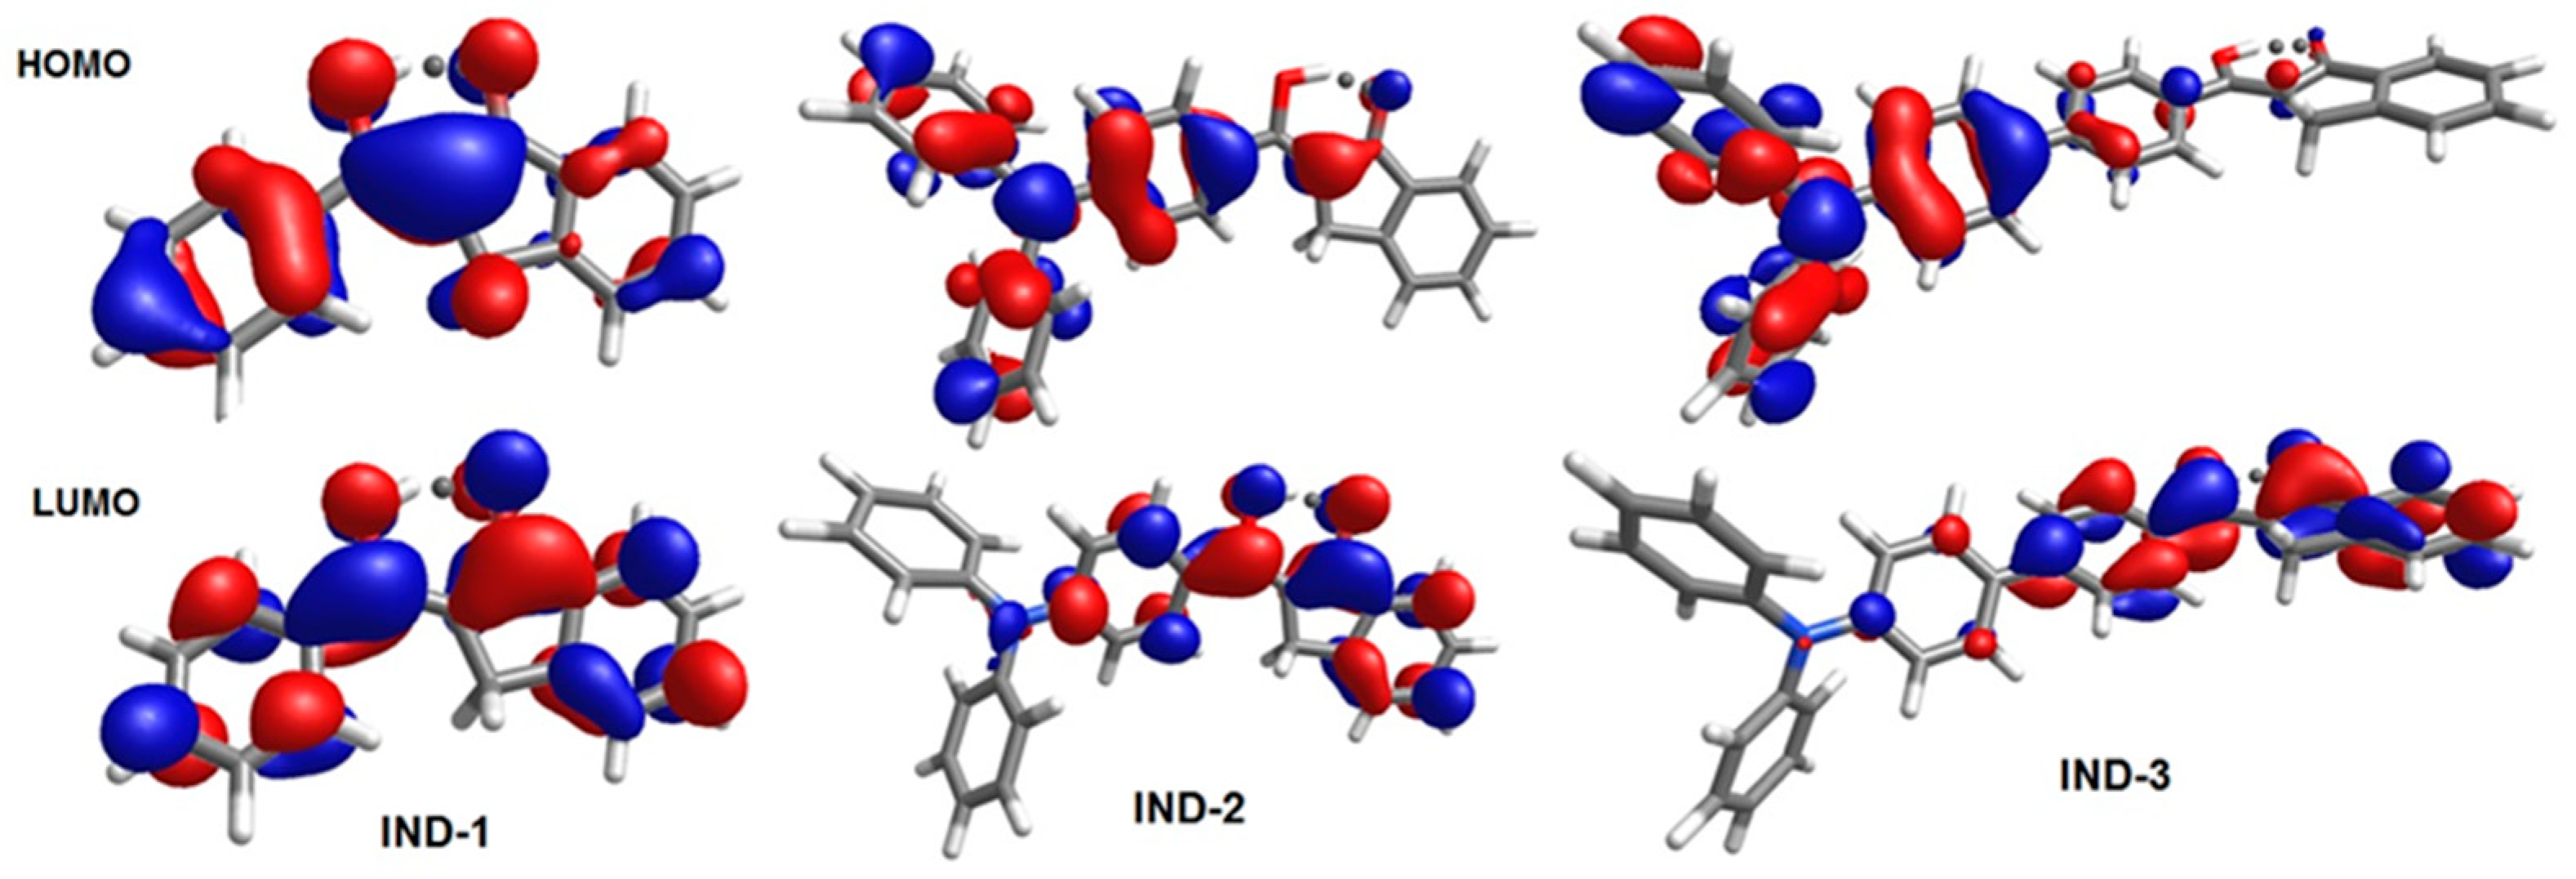
This equation is obtained by substituting the constants in the expression E = hc/λ, where h is Planck’s constant, c is the speed of light in a vacuum, and λ is the wavelength. The optical band gap values Eopt in acetonitrile solution are hence determined and summarized in Table 4, resulting in 3.12, 2.70, and 2.67 eV for IND-1, IND-2, and IND-3, respectively. As expected, the indanones with the most red-shifted transitions have the smallest HOMO-LUMO gaps. While there is no significant variation in the band gaps of IND-2 and IND-3, the highest value, and thus the lowest charge transport capacity, occurs in the precursor IND-1. Based on these results, it is important to assess how charges are transported inside these compounds based on the distribution of their frontier molecular orbitals: HOMO (highest occupied molecular orbital) and LUMO (lowest unoccupied molecular orbital). Frontier molecular orbitals have been indicators of reactivity and regioselectivity in the description of chemical interactions, and particularly in this case, they are employed to analyze the donor-acceptor interactions within charge transfer systems [29]. The theoretical HOMO and LUMO frontier molecular orbitals for the three indanones in acetonitrile solution are presented in Figure 7, and their energies are recorded in Table 4. The hydrogen bonds between hydroxy and carbonyl groups correspond to stabilizing non-covalent interactions. In the precursor IND-1, both molecular orbitals are distributed throughout the structure. In the TPA indanone system of IND-2 and IND-3, the HOMO is fully located in the TPA region, whereas the LUMO is in the indanone region. This indicates the ease of charge transport due to the presence of TPA, which is summarized in the band gap value presented in Table 4 and decreases with the trend IND-1 > IND-2 > IND-3. It should be emphasized that the precise values are strongly dependent on the specific exchange correlation functional employed; consequently, the relevance resides in the overall trend and observed correlations across the indanones. By examining the energy values of these frontier molecular orbitals, it can be observed that the LUMO remains unaltered both energetically and spatially with respect to the precursor. Nonetheless, the presence of the TPA moiety introduces an additional intermediate occupied energy level, which takes the place of the HOMO and functions as a higher energetic baseline from which electrons transition. This effectively reduces the band gap, as observed in the theoretical gap values. According to these results, IND-3 has the highest charge transport capacity, which is verified by the values obtained for the band gap in solution. The larger conjugation in this compound is responsible for its smaller band gap, owing to the π orbitals of each ring overlapping and delocalizing over a wider region.
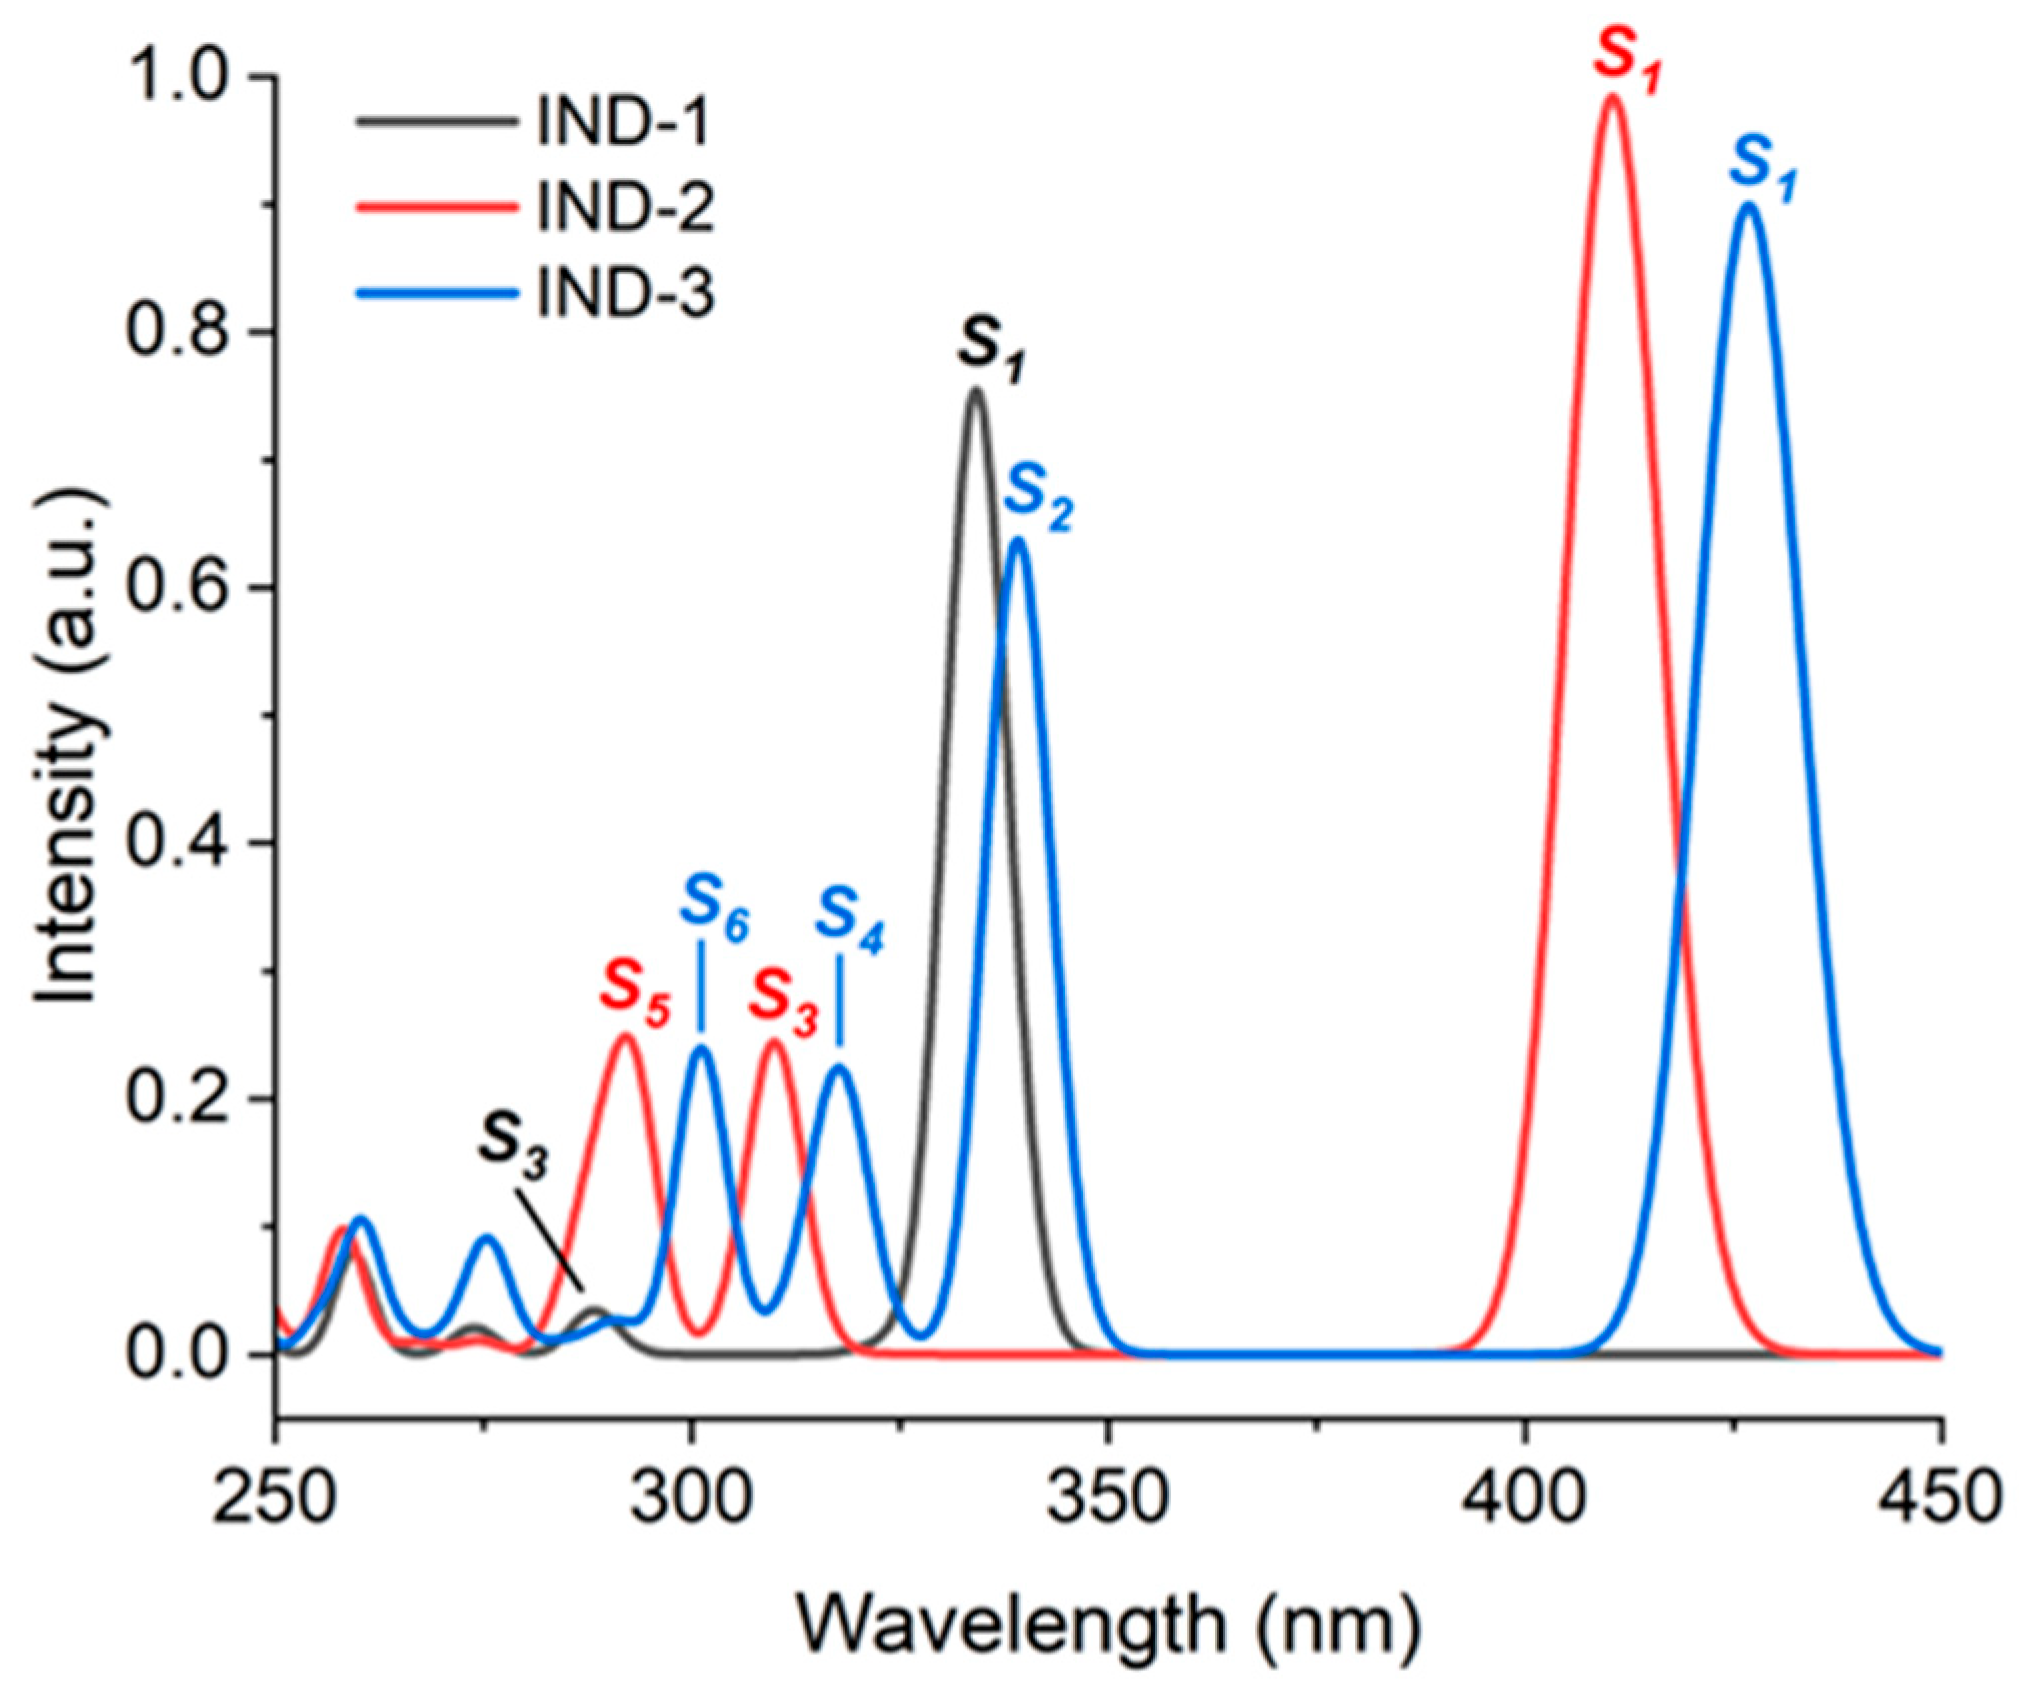
TD-DFT was performed to assess the theoretical transition states of the indanone derivatives. The theoretical absorption spectra in Figure 8 show the associated transition of the most prominent peaks, which are further decomposed in Table 5. It is observed that for the three indanones, the main absorption peak corresponds to the transition to the first excited state S1 at wavelengths of 400~450 nm for IND-2 and IND-3 and a lower wavelength of ~330 nm for IND-1. This trend is comparable to the experimental absorption cutoff wavelengths observed at 350~450 nm, considering the expected time-dependent computation uncertainty. Furthermore, the experimental absorption bands at ~300 nm are attributed to the secondary excited states S3 and S5 for IND-2 and S2, S4, and S6 for IND-3. As observed in Table 5, most of these excited states are attributable to single canonical-orbital excitations, with contributions over 90%, with the exception of IND-3 S4, thereby making the NTO orbital distribution closely resemble their associated canonical orbitals.
Natural transition orbital analysis was carried out to theoretically assess the charge transfer properties of these compounds, and their orbital distributions are shown in Table 6. In all cases, the principal S1 excited state is mainly attributed to a HOMO → LUMO frontier orbital transition, which confirms that the experimental band gap corresponds to this single transition. These results suggest that indanones can be used as charge-modulating electrodes. The charge transfer distribution of this HOMO → LUMO transition is analyzed above. For IND-1, the only other relevant state is S3, excited from an indanone benzene-centered electron, which is still negligible due to its low intensity. For IND-2, the S3 state is mainly centered in the indanone, with the electron orbital slightly distributed over the peripheral TPA, whereas the S5 transition takes place entirely within the TPA, with the hole orbital strongly centered in the peripheral phenyl units. The secondary S2 transition in IND-3 is observed to be energetically similar to that of IND-1 S1. Both NTOs appear to have an identical distribution over the indanone precursor structure, except for the peripheral TPA of the IND-3 electron, as the moiety is not present in IND-1. This can also be observed for S6, which energetically resembles IND-2 S5 with a very similar distribution, fully centered in TPA. This is, however, not the case for S4, whose charge transfer distribution takes place along the whole molecular structure.

3.2. Electrode Deposition and Characterization

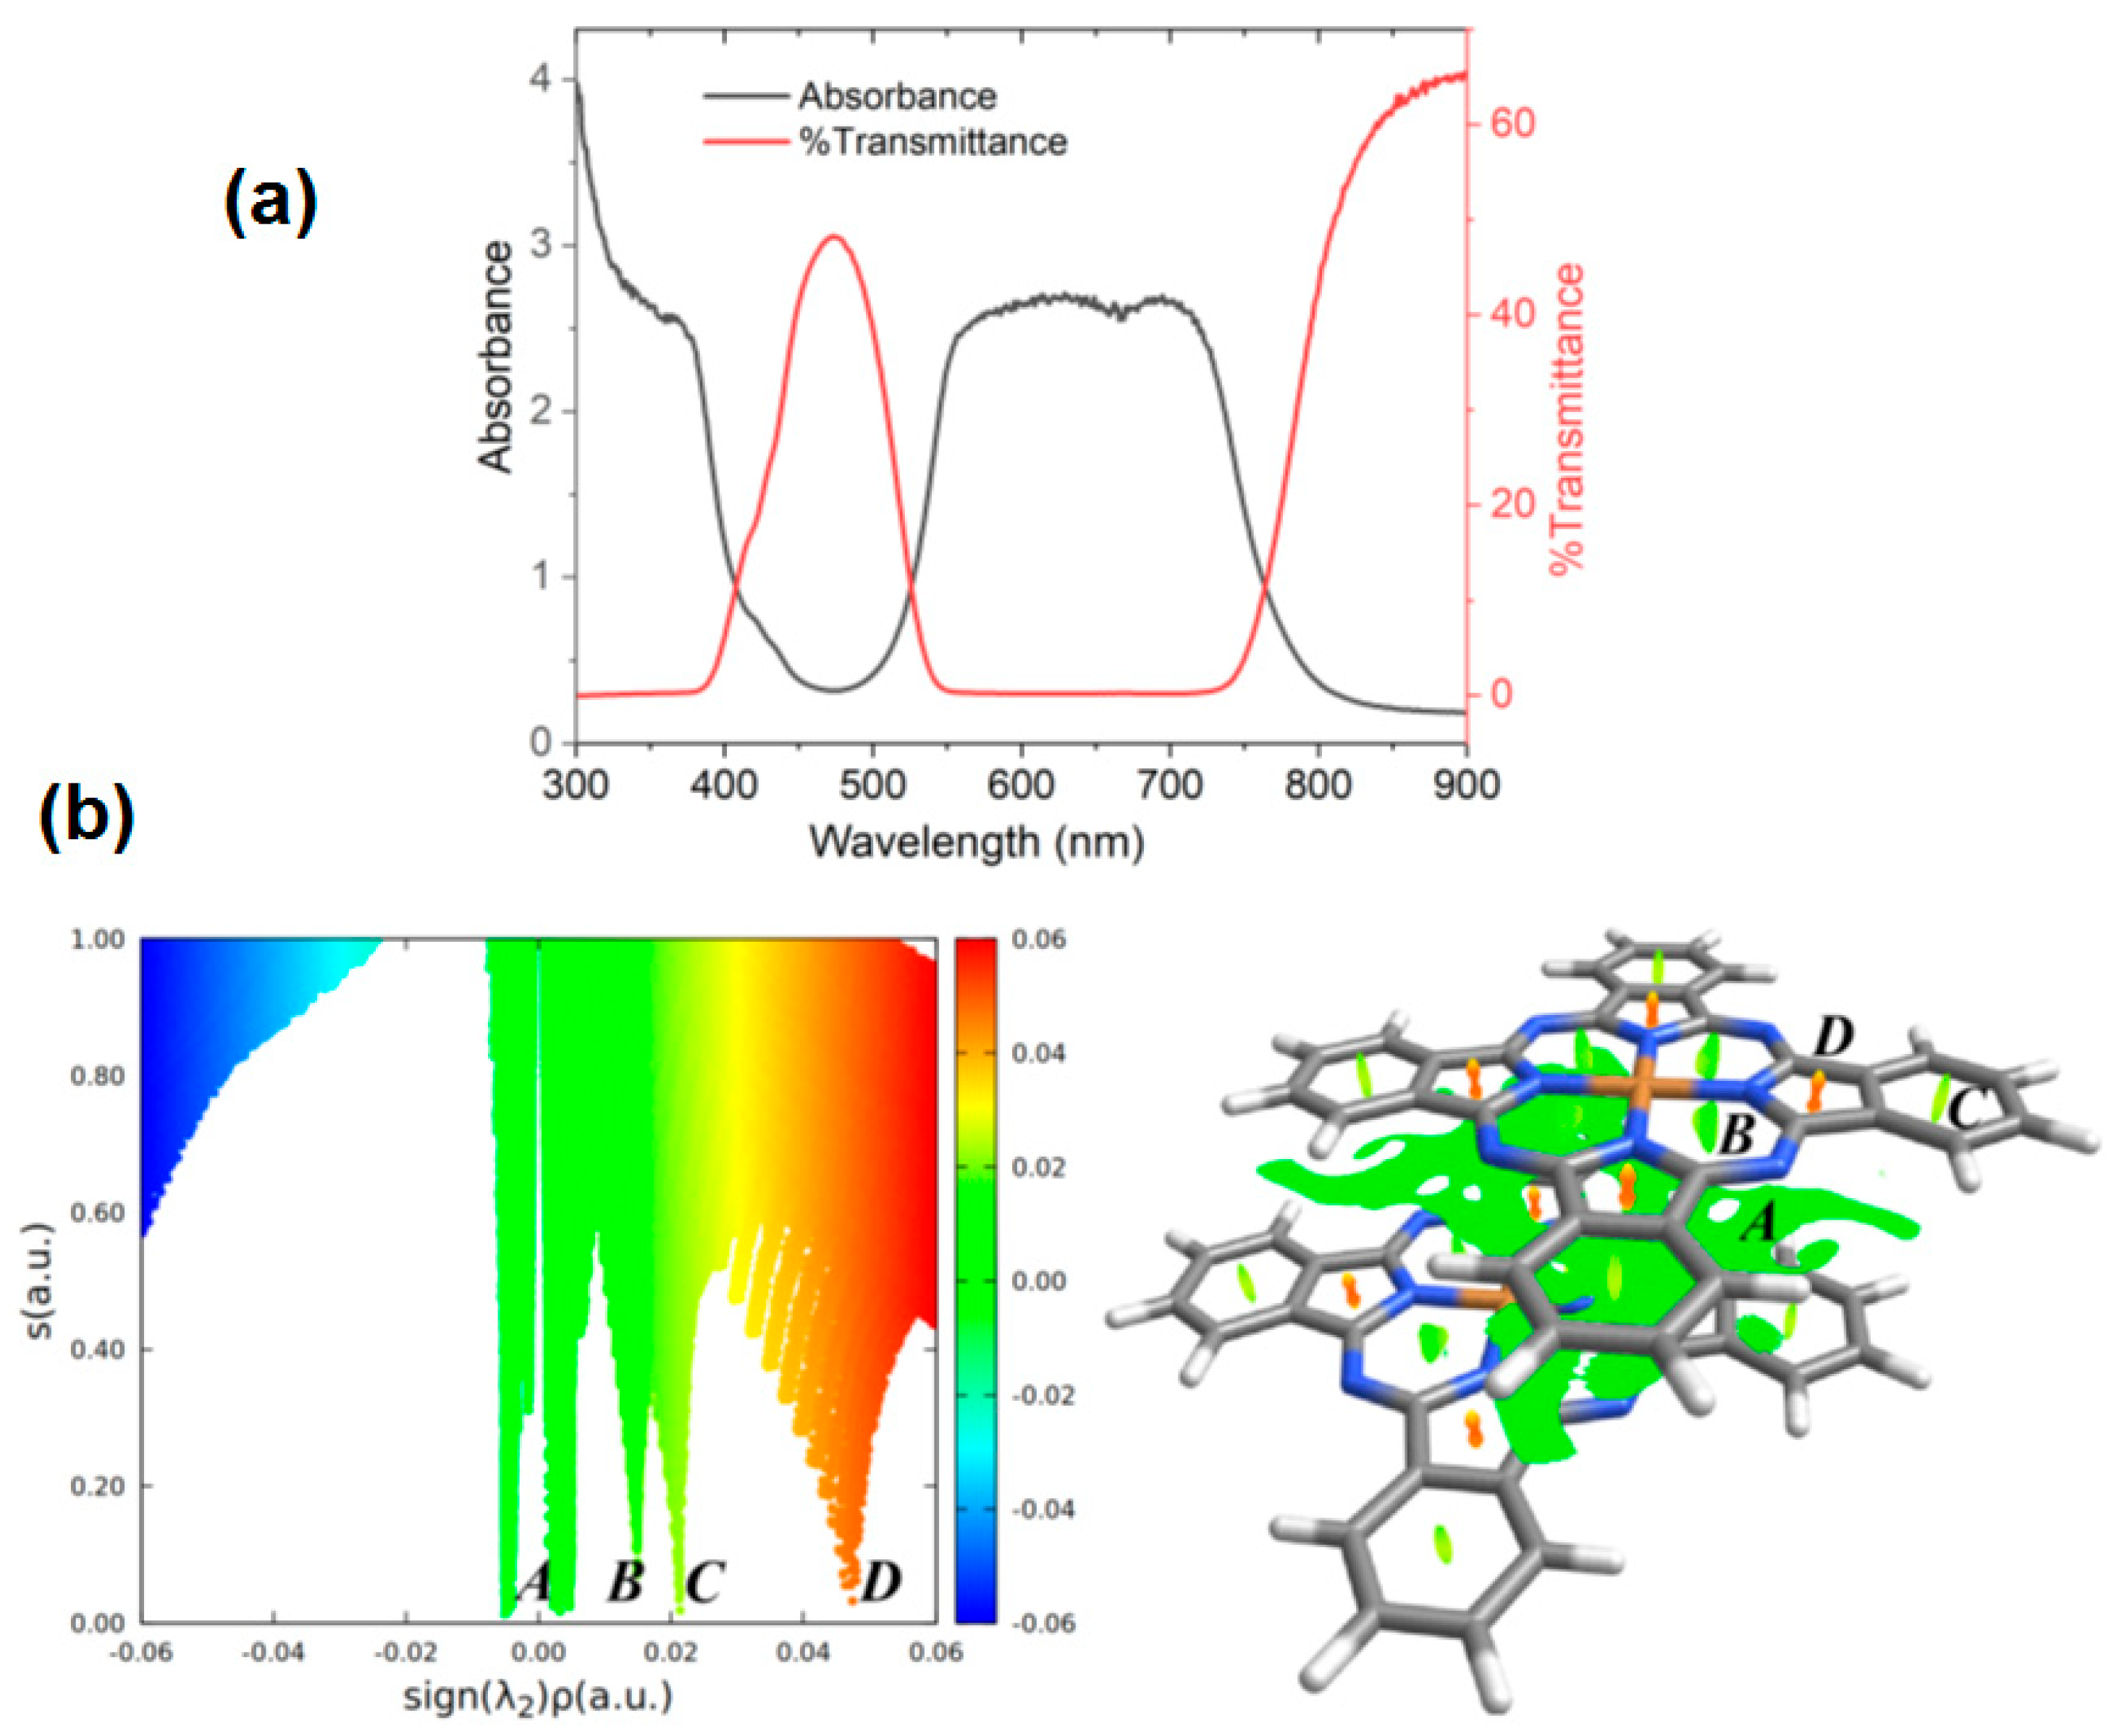
As stated earlier, this work aims to analyze the behavior of indanones as electrodes with CuPc used as a photoactive electrode. Due to the strong absorption of CuPc in the visible spectrum being sufficient to induce basal photogeneration of charge carriers, the optical behavior of indanones may favor their performance in a device, since, paired with the CuPc, they can act as charge-modulating electrodes. Indanones, with their conjugated structure that favors electron transport and their thin-film electrode architecture, could exhibit suitable electron mobility [13,14,15]. Therefore, for the devices proposed in this work, the goal is that by applying the potential, (i) in the CuPc electrode, some excitons are separated, thus favoring the injection/extraction of charge carriers, and (ii) the indanone electrode begins to accept charge through the electrolyte, adjusts the interfacial barrier, and responds to the photoexcited state of the CuPc. (iii) CuPc acts as a source of photoassisted carriers, while the indanone stores or releases charge, depending on the bias direction, and the electrolyte compensates with ionic migration. The use of CuPc as an electrode is proposed because this phthalocyanine has a reversible redox behavior, useful for charging and discharging processes. It can both lose and gain electrons and has been successfully employed in the manufacture of electrodes for different types of devices [30]. As this work aims to manufacture electrodes for devices, it would be expected that one of them acts as a photosensitive material, absorbing light and generating charge carriers. CuPc, as a photoactive electrode in a device, can absorb visible light because of its Q-band [31], exciting the electrons and enhancing electrochemical charge. Figure 9a shows the Q-band of CuPc, with two slight peaks, the first centered around 630 nm and the second around 693 nm. These signals correspond to the first π-π* transition of the CuPc macrocycle [31]. The broadening of the Q-band may be related to the aggregation structures of phthalocyanine in the film [31]. Additionally, in the absorbance spectrum, the phthalocyanine B-band can be observed around 360 nm, which provides the fundamental absorption edge and is due to the a2u(π) → eg(π*) and b2u(π) → eg(π*) transitions [31,32,33]. The Q and B bands are related to the molecular orbitals of the aromatic system with 18 π electrons and to the overlapped orbital on the copper atom of the phthalocyanine [31]. From the above results, it is determined that CuPc can be used as a photoactive or photosensitive electrode. Furthermore, the phthalocyanine also acts as a p-type semiconductor, allowing it to inject holes into nylon 11 with the TPAB solid electrolyte and the indanone counter-electrode.
CuPc, among other phthalocyanines, is known to aggregate in polymorphic crystalline packing configurations, owing to the multiple π–π stacking interactions from the numerous aromatic rings in its planar structure. This property, responsible for its poor solubility, also gives phthalocyanines most of their solid-state properties. Two forms of crystalline aggregation are exhibited in CuPc: the metastable α-form and the stable β-form. While upon solid-state deposition both forms can coexist, thermal annealing ensures a complete α → β form transformation, as performed in the solid-state devices [34]. Therefore, the non-covalent interactions of CuPc were characterized in a β-form disposition, where a slanted stacking takes place with a perpendicular distance of 3.34 Å and a 45.8° angle between the stacking direction and the normal to the molecular plane [35]. As observed in Figure 9b, the predominant interaction (A) corresponds to a large surface of π–π stacking van der Waals force that produces aggregation in the species. While this is a relatively weak interaction, the broad footprint area spread between both macrocycles produces several points of electronic overlap, thereby providing additional stability in the system. Additionally, stronger steric repulsion interactions (B–D) are observed within the aromatic rings of the CuPc. The weakest (B) arises in the chelate rings, followed by the mild repulsion within the peripheral benzene units (C). Finally, the strongest steric repulsion is observed at the pyrrole rings (D), attributable to the tighter ring structure. The presence of this intermolecular stacking confirms the important role of non-covalent interactions in the solid-state arrangement of the CuPc, which evidences the role of its conjugated structure in electron acceptance and charge mobility, making it suitable for its use as a counter-electrode.
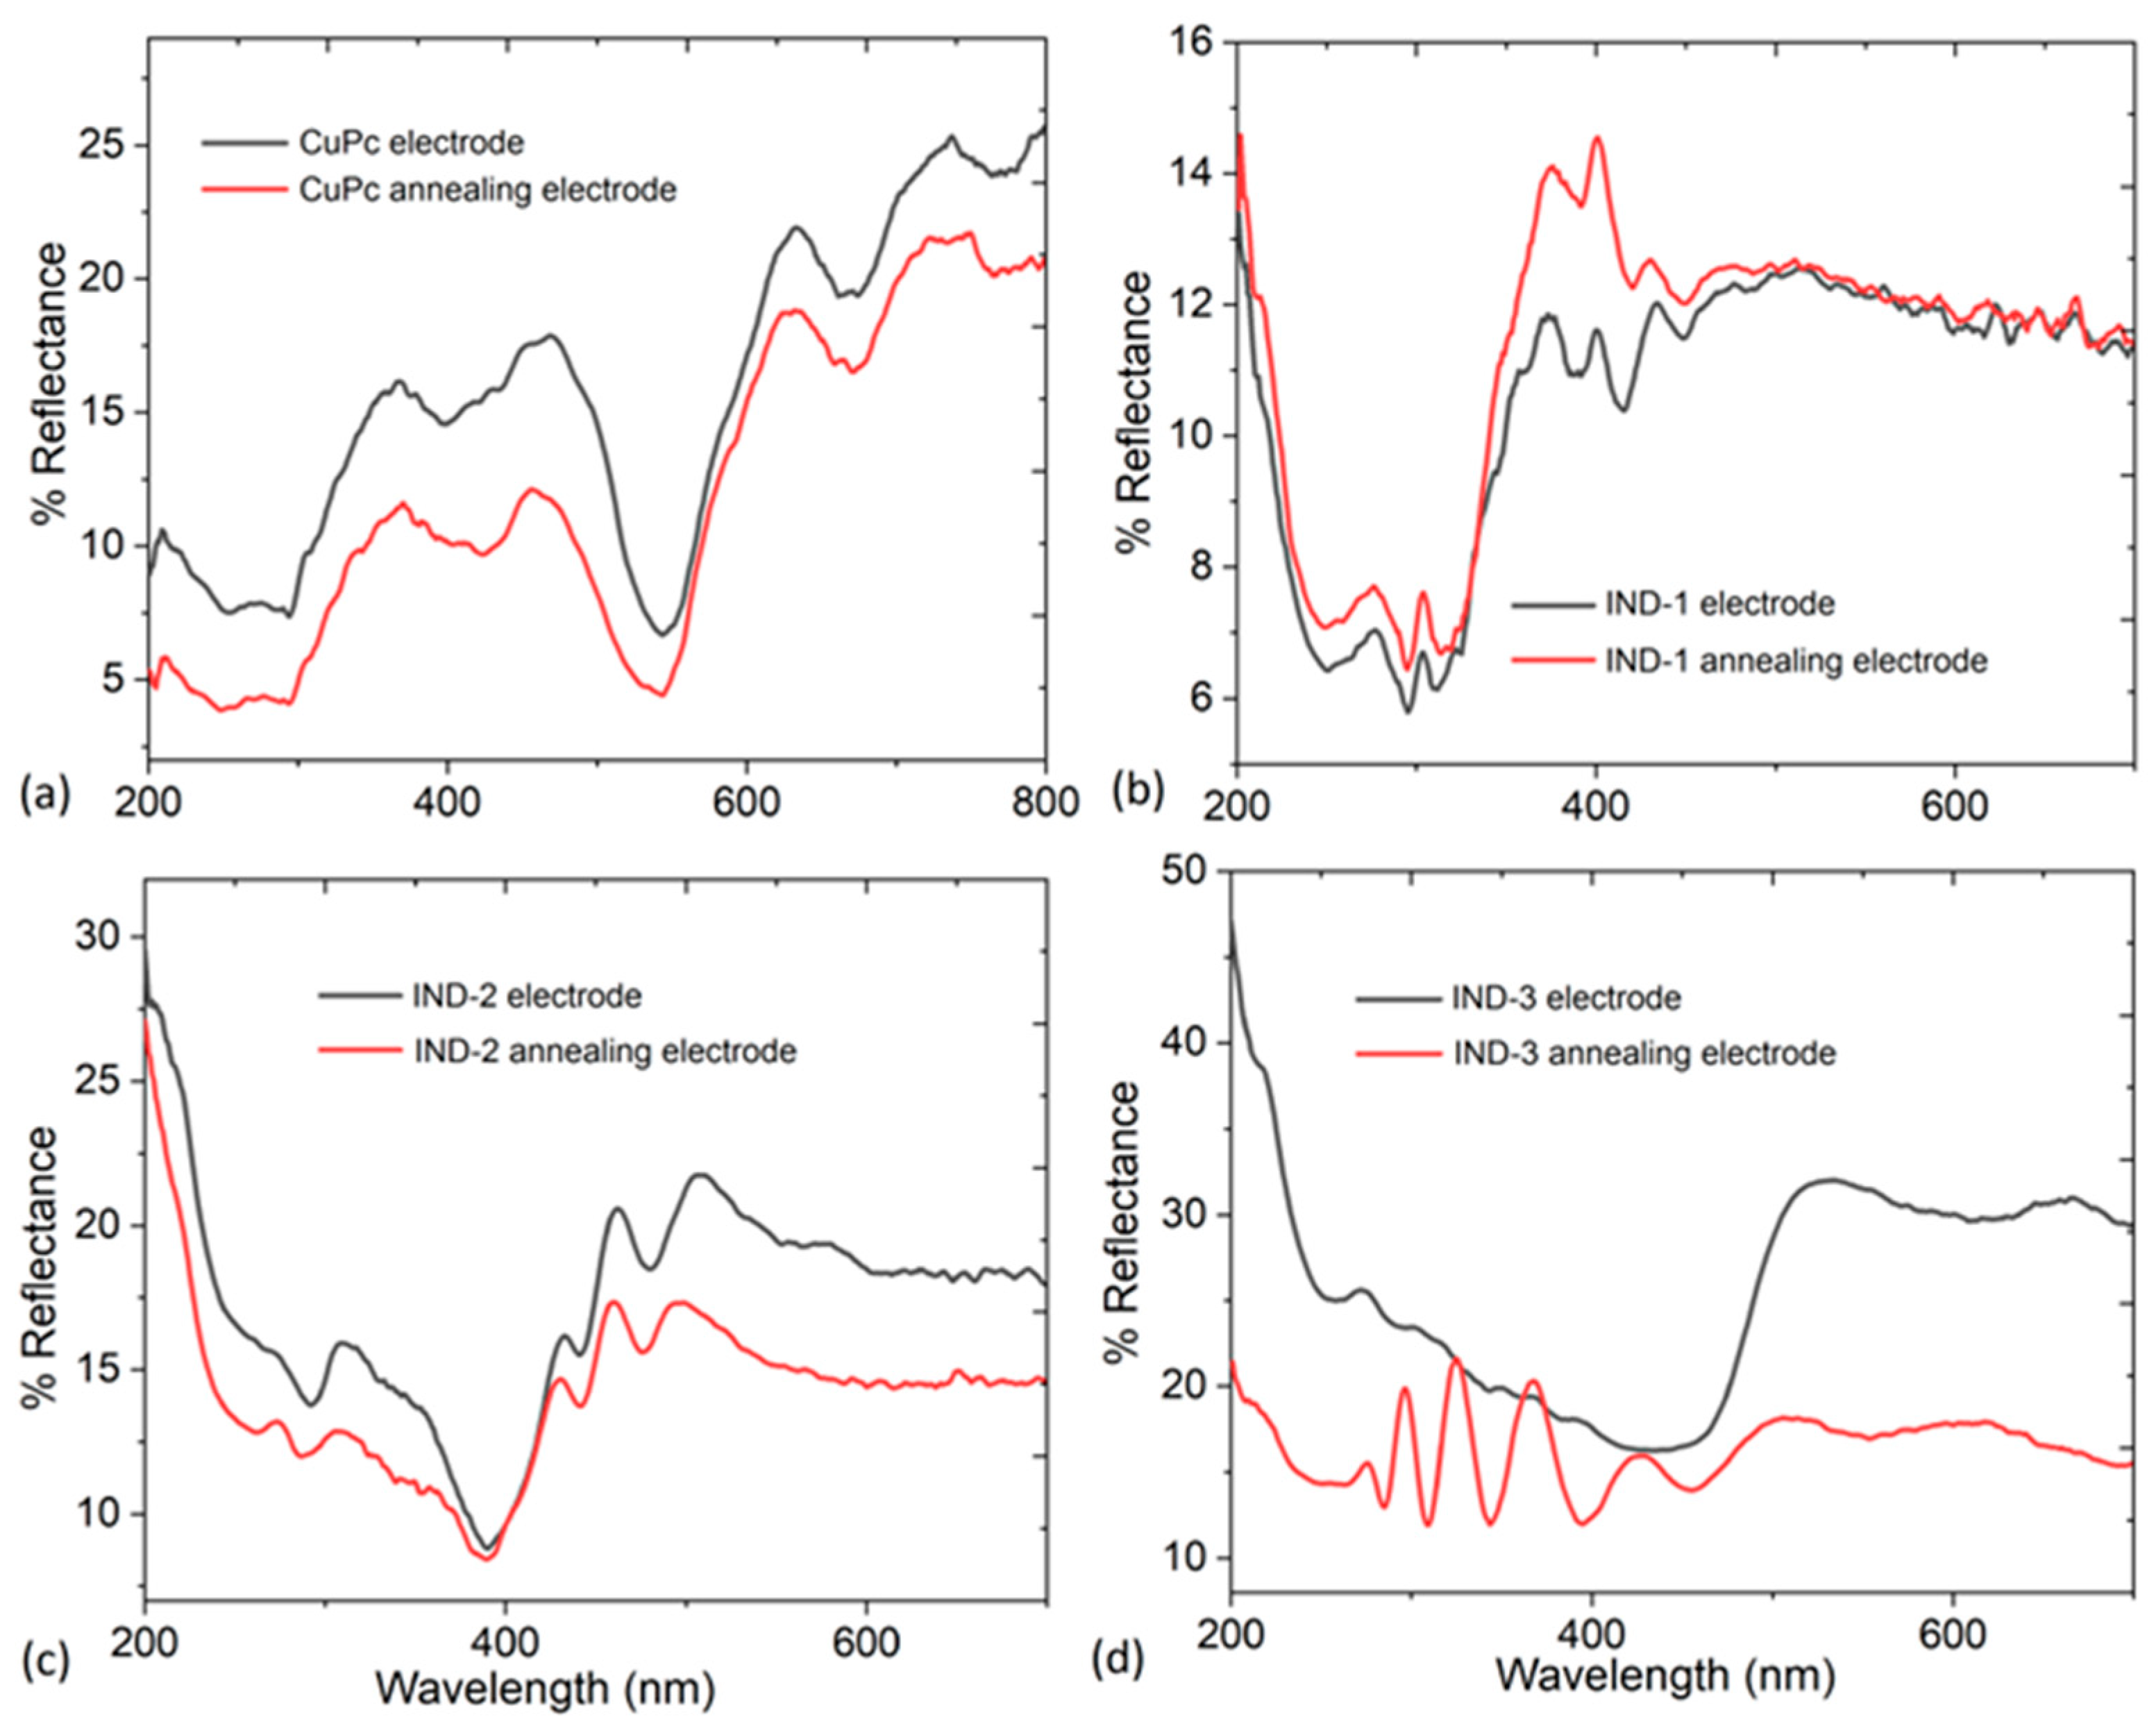
After the deposition of the CuPc and the indanones IND-2, IND-3, and IND-1, annealing was carried out to arrange the structure of the thin films that make up these electrodes. Before and after annealing, reflectance was evaluated at each electrode, as this optical parameter can cause optical losses in an organic photoactive device if functional light is reflected outward rather than absorbed. The reflectance spectra are presented in Figure 10, and upon evaluation, it is evident that for all cases, it is under 35%. For the CuPc electrode, a maximum of 25% occurs at λ > 650 nm, while the spectrum of the indanones similarly presents maxima of 23 and 33% for IND-2 and IND-3, respectively, at λ > 420 nm. Finally, for its precursor IND-1, a maximum reflectance of 15% is reached at λ between 350 and 500 nm. These results support the proposal that both the phthalocyanine and indanones can be used in an organic photoactive device with functional electrodes, since less light is reflected and more is absorbed by these electrodes. In the CuPc electrode, charge carrier generation depends on the amount of absorbed light. More light absorption leads to greater electronic excitation, greater photoinduced current generation, and overall increased device performance. Furthermore, the low reflectance helps to adjust the spectral response of the devices, so that the CuPc electrode absorbs in the specific regions of its Q and B bands. It is noteworthy that after annealing, the CuPc and indanone electrodes showed a decrease in reflectance, while in the indanone precursor, it slightly increased. However, its maximum value remains low at around 15%.
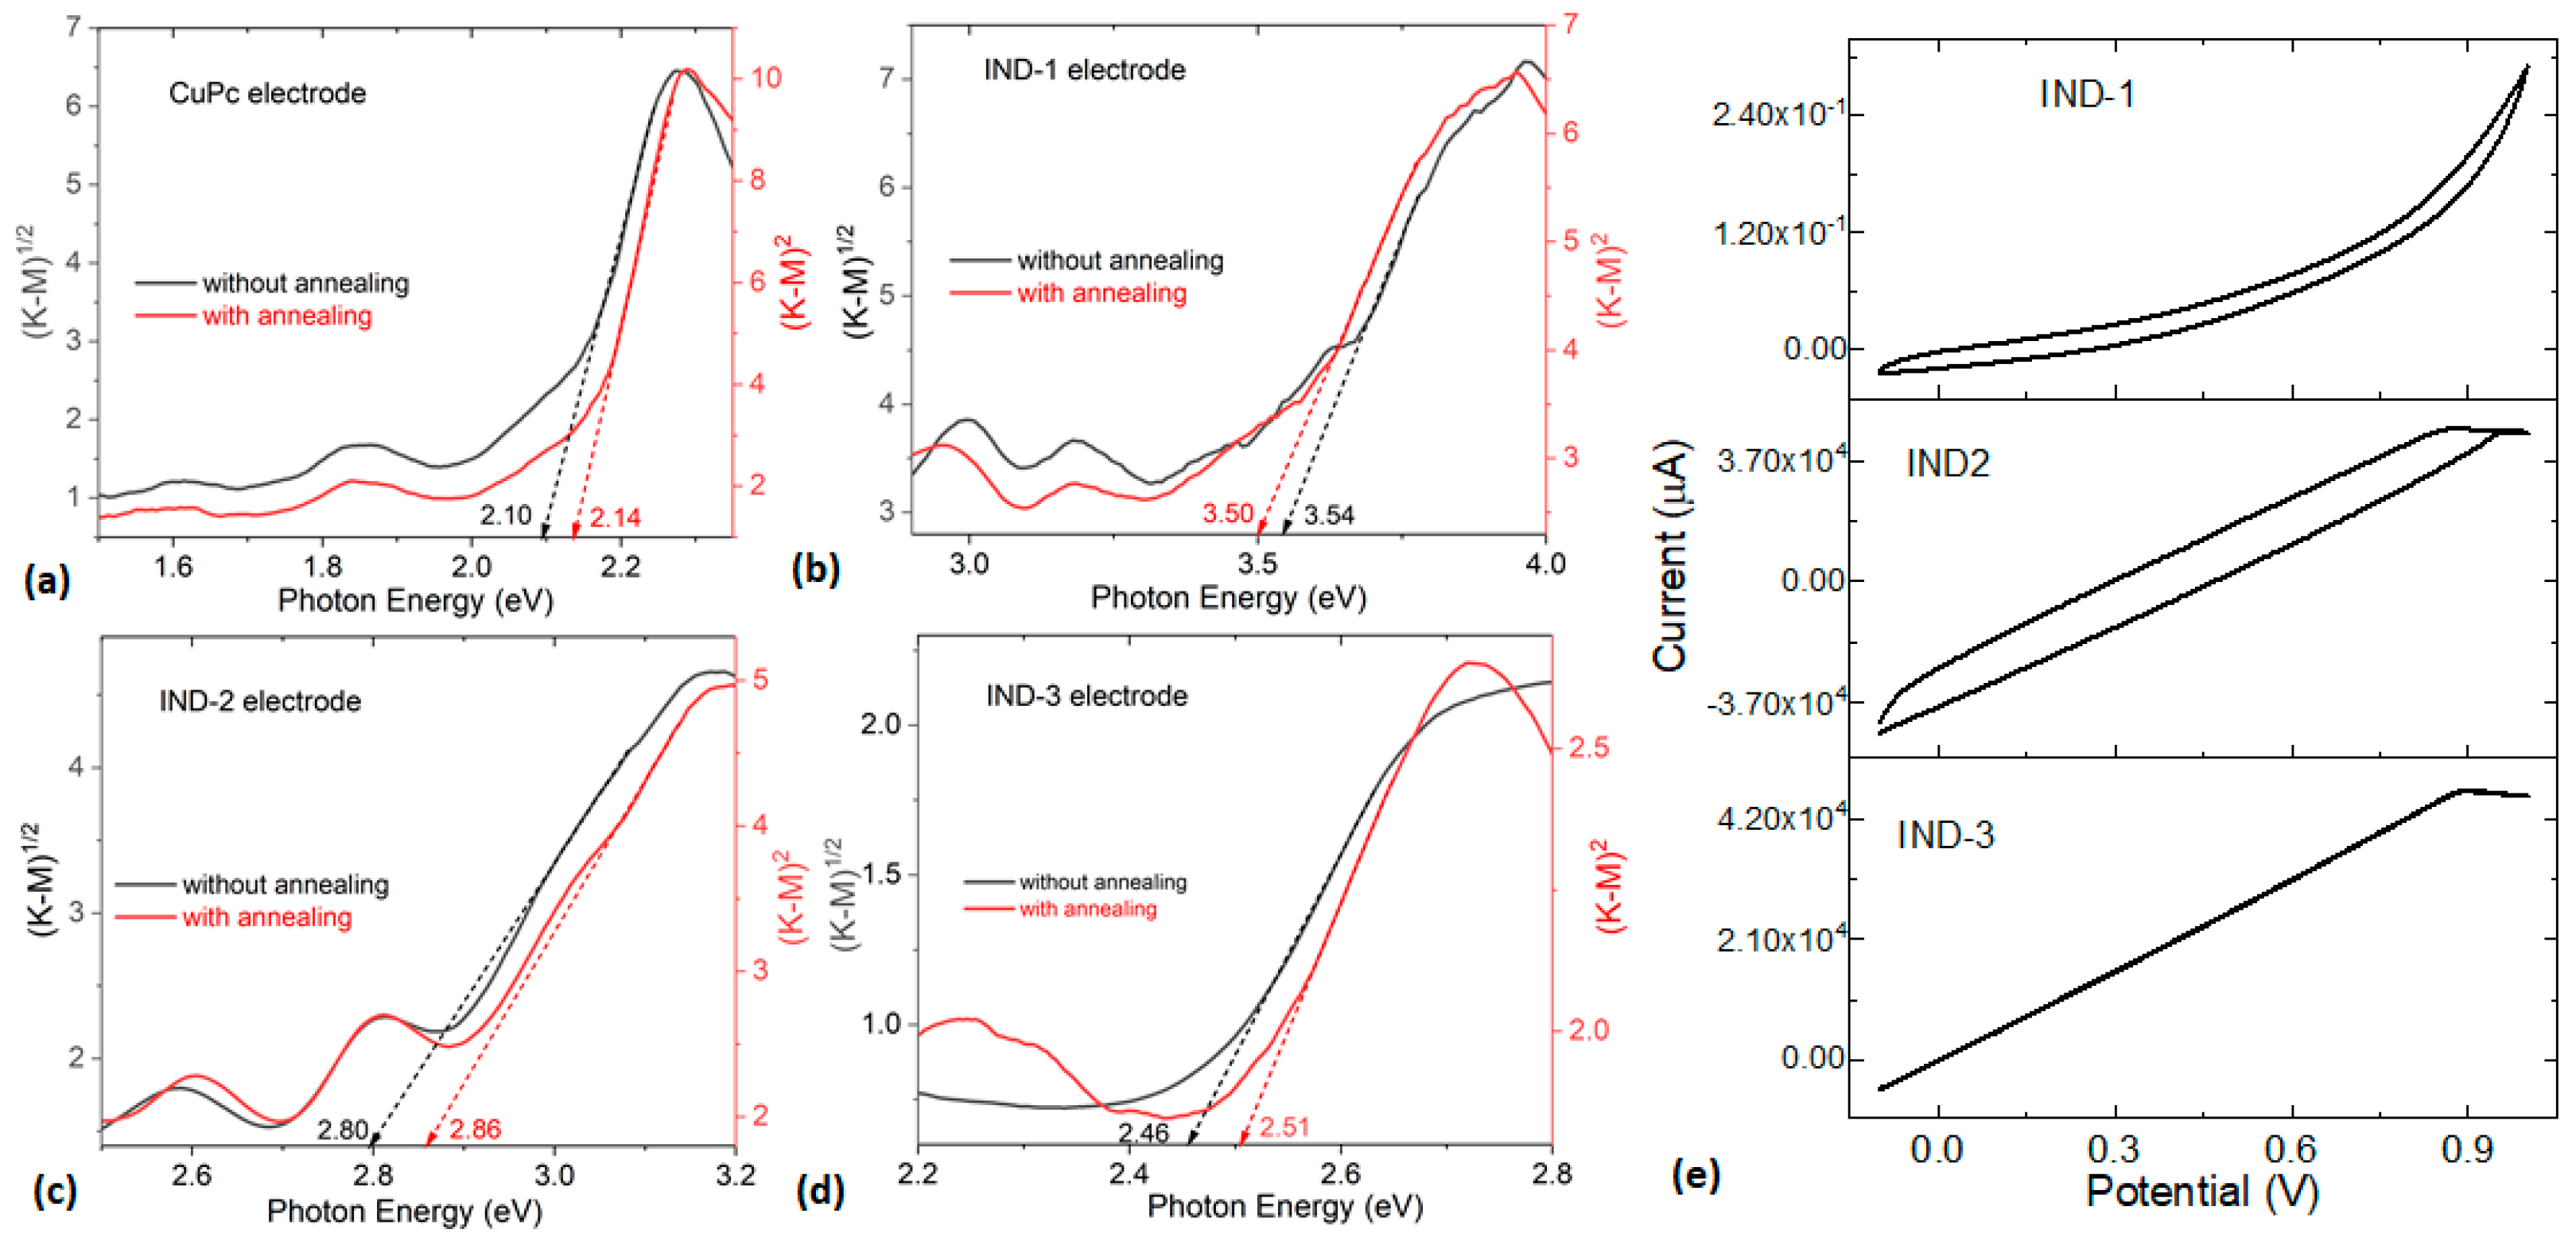
Indanone and CuPc electrodes are opaque, rough, and highly dispersive, making reflectance the key optical parameter for evaluating their optical band gaps. The Kubelka-Munk function F(K-M) describes light propagation in dispersive media, so the band gap can be estimated initially using the F(K-M) and, subsequently, the Tauc method. F(K-M) converts diffuse reflectance into a quantity proportional to the absorption coefficient (α), which is the term required by the Tauc method. This approach is well-suited for estimating the optical band gap because it describes the behavior of α at the absorption edge, dominated by π-π* electronic transitions and exciton formation, which define the optical threshold for the indanones and CuPc. From the reflectance results, the optical band gap was obtained according to the F(K-M) model [36] and the Tauc model using Equation (2) [36,37]:
hνα = A (hν − Eg)P
where hν is the photon energy (h = Planck’s constant and ν = 1/λ); A is a proportionality constant; Eg is the optical gap energy; and the exponent P depends on the band structure of the semiconductor, where phonon participation is required [37]. α is directly proportional to F(K-M). Therefore, in Tauc’s equation, α can be replaced by the function in Equation (3):
(hν × F(K-M)) = A (hν − Eg)P,
The procedure consists of plotting (F(K-M))1/2 as a function of hν, fitting and extrapolating the linear portion of the plot, where the intersection with the abscissa provides the value of the gap. The exponent P = 1/2, or 2, is due to the indirect or direct electronic transitions, respectively, which take place between the charges that jump from the HOMO to the LUMO of the molecule that integrates each electrode. Figure 11a–d show F(K-M) for both direct and indirect transitions of each electrode. The band gap values for both types of transition are summarized in Table 4, alongside their unsolvated theoretical values. According to the reported values, there are no significant differences between the two transitions, which indicates the indanones’ potential as organic semiconductors. This is because in these semiconductor molecules, their electronic bands are very flat, and, therefore, the energy dispersion with respect to momentum is minimal, and optical absorption is dominated by vertical transitions. Regarding these, the lowest band gap and greatest semiconducting capacity are found in IND-3, followed by IND-2 and finally the precursor IND-1; the same trend is observed in solutions and in unsolvated computations. On the other hand, when comparing the band gap values obtained in solution using Equation (1) with those obtained in film using the hybrid F(K-M) and Tauc method in Table 4, the same trend is observed, with the band gap being smaller for IND-3, followed by IND-2, and finally, IND-1. It should be considered that these are complementary values, because in the first case, isolated molecules are evaluated, without significant intermolecular interaction or dispersion effects, whereas in the second case, there is molecular π-π stacking and solid-state structural disorder.
When performing CV on the photoactive devices, different behaviors are observed (see Figure 11e) depending on the indanone present as the electrode. In the battery with IND-1, a very narrow cycle is observed between the forward and reverse sweeps. This is a result of the low charge accumulation, low electrochemical response, low faradic activity, and very low capacitance in IND-1, which does not store much energy. The indanone IND-2 stores more energy; nevertheless, its capacitance is also low with no redox processes present. The current carried is on the order of 10−1 µA for IND-1 and 104 µA for IND-2. In the case of the device with IND-3, fully resistive behavior is observed without redox processes, which is evidence that this indanone is an organic semiconductor. In general, faradaic processes are not present in the CV curves, since these devices operate optoelectronically, not chemically. The absence of redox peaks in the studied potential range indicates that the device response is dominated by non-faradaic processes, where the current is primarily attributed to the capacitive charging and discharging of the electrode–electrolyte interfaces and to the charge redistribution in the indanone and CuPc electrodes. Indanones participate in the device’s electrical response, not chemically, but electronically; they modulate the capacitive response and influence charge transport. Changes in the indanone structure affect the device’s behavior because they act as charge transport modulators, even in the absence of detectable faradaic processes. It is important to mention that the potential range studied in this work is typical for the operation of these organic devices, as it promotes the injection and accumulation of charge without generating degradation of the electrodes. These results complement the applications of already studied indanones, such as components of optoelectronic devices [14,15]. They also open the door for new studies on the capacity of indanones as charge modulators in more complex photoactive devices, which can be studied with wider voltage ranges and further variations in the photoactive molecules. The study of indanones is still in its early stages compared to the research on COFs and MOFs mentioned in the introduction, which, owing to their porous structures, facilitate ion transport and enhance charge flow [9,10,11,12]. Furthermore, to mention some examples, MOFs exhibit photoconductivity based on organic and inorganic molecules [38] and metal-centered or guest-induced photoluminescence MOF ligands [38], which could be tested with indanones in the future. Meanwhile, COFs exhibit electroactive behavior that has favored their application in various types of devices, such as photodetectors [39,40], and even photocommutable molecules have been encapsulated in the pores of COFs operating as photostimulus-responsive devices [41]. The synthesis and study of new functionalized indanones could favor the fabrication of similar structures by creating molecular architectures with photoactive molecules or chromophores [42], as carried out by Chen et al. [43], who have studied COFs with copper porphyrin, a macrocycle of the same family as the CuPc studied in this work. Due to their ease of synthesis and ease of integration with different substituents, indanones have the potential to be integrated into photoactive devices.

3.3. Degradation of the Electrodes

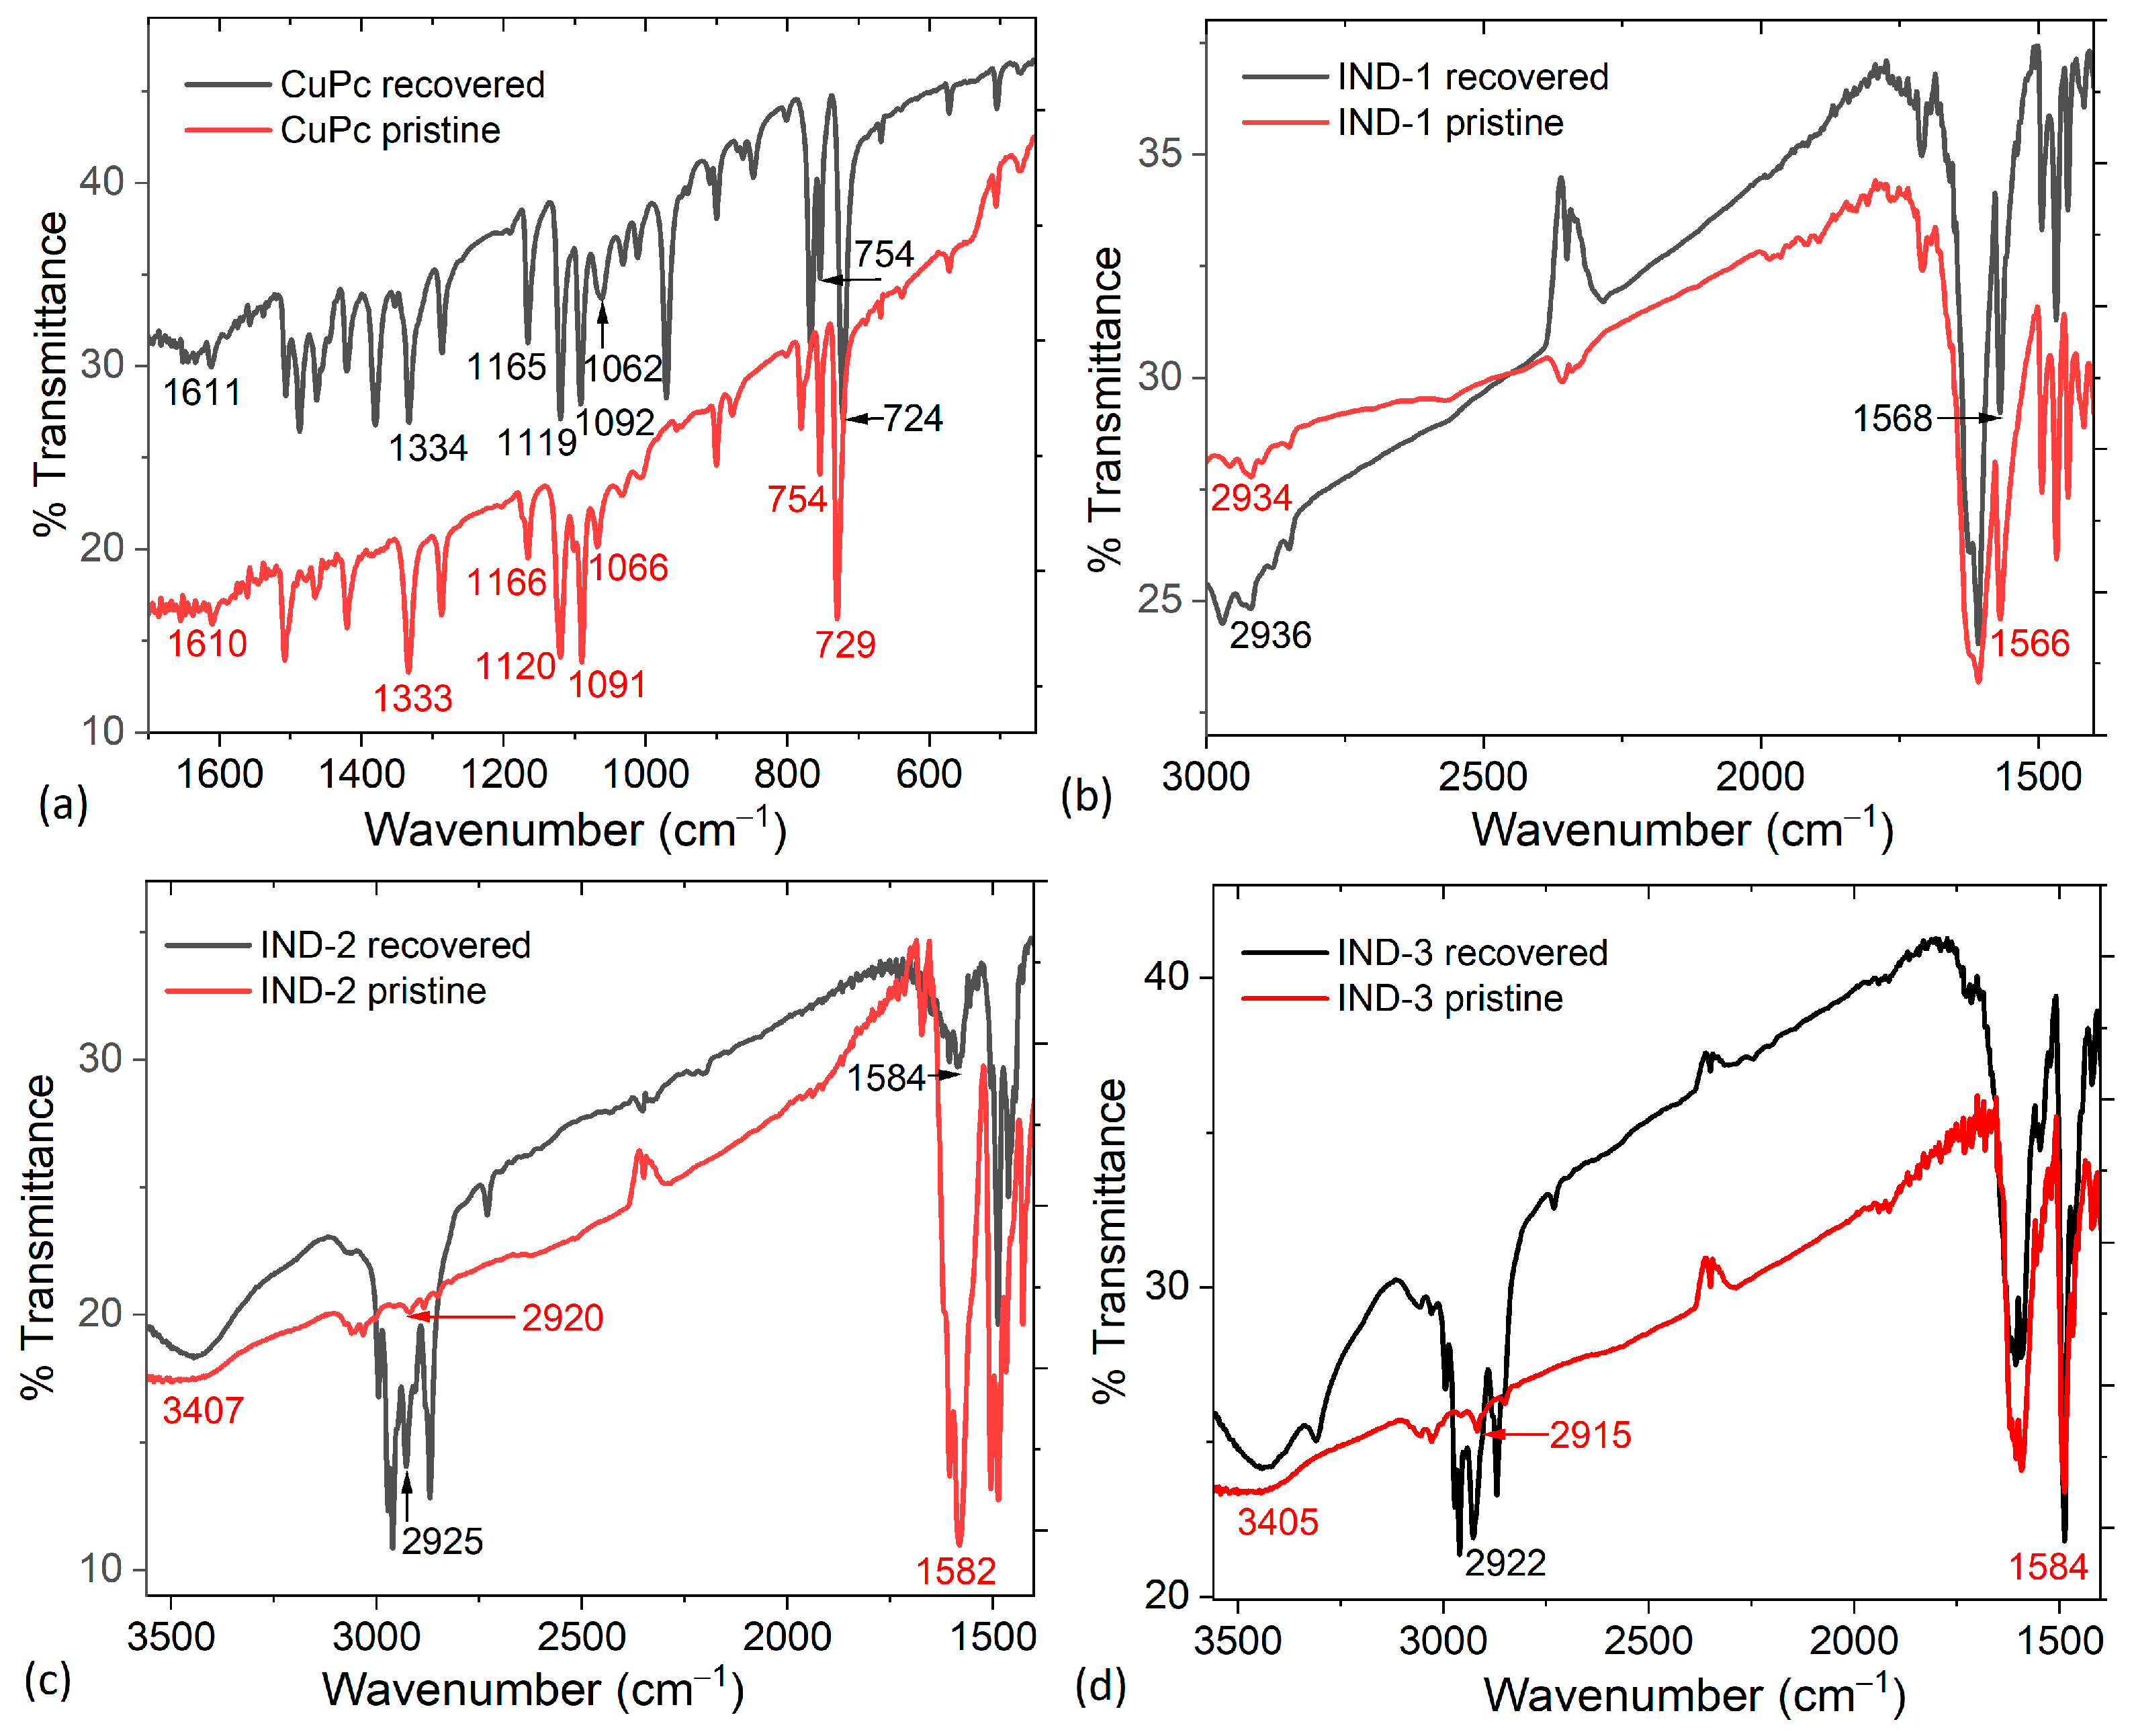
To verify the reusability of CuPc, IND-1, IND-2, and IND-3 as electrodes after the devices have reached the end of their functional lifespan, these compounds were recovered by spatula scraping and subsequently analyzed by IR spectroscopy. The obtained spectra for the recovered compounds were compared with those of pristine CuPc and indanones. The spectrum for pristine and recovered CuPc is shown in Figure 12a, where the signal observed at 1333 ± 1 cm−1 corresponds to C=N vibration, and the signals located at 1166 ± 1 cm−1, 1120 ± 1 cm−1, and 754 cm−1 result from C-H interactions [31,32]. The signals at 1066 ± 4 cm−1 are from in-plane C-H deformation, and the bands at 1610 ± 1 and 1091 ± 1 cm−1, which are from C=C stretching within the macrocyclic ring, are also exhibited [33]. The β-phase in CuPc can also be identified by a band at 729 ± 5 cm−1 [31,32,33] for pristine and recovered CuPc. The shifts in molecular vibrations result from the contact between the CuPc and the supporting electrolyte, which is indicative of a slight alteration to the CuPc structure. The pristine CuPc spectrum displays well-defined peaks corresponding to various vibrational modes, whereas in the recovered CuPc, the slight shifts of some peaks suggest alterations in the chemical environment and bonding interactions within the CuPc molecule. These changes are minimal, typically within a 1 cm−1 shift; yet, they systematically suggest a slight reorientation of molecular bonds and the possible introduction of intermolecular forces or stress in the CuPc lattice [31,32,33]. Overall, the post-recovered FTIR analysis reflects the resilience of the CuPc structure. Regarding Figure 12b–d, there are no significant changes between the recovered and pristine indanone spectra. The most representative signals [20,21] associated with the carbonyl vibration (C=O) are presented at 1566 ± 2 cm−1 for the precursor IND-1, at 1582 ± 2 cm−1 for IND-2, and at 1584 cm−1 for IND-3. Another signal of importance corresponds to the C=H bond at 2934 ± 2 cm−1 for the precursor IND-1, at 2920 ± 5 cm−1 for IND-2, and at 2915 ± 7 cm−1 for IND-3 [20,21]. Finally, the C-N bond signals of IND-2 and IND-3 are also observed between 3405 and 3407 cm−1 for pristine and recovered indanones [44]. These results show that indanones IND-2 and IND-3, and their precursor IND-1, do not undergo chemical degradation under the voltage conditions studied or after their expected useful life as electrodes in the device manufactured for this study. This makes them excellent candidates for charge-modulating electrode fabrication in organic photoactive devices, not only due to their chemical stability but also due to their performance under service conditions.

4. Conclusions

A novel 2-benzylidene-1-indanone derivative (IND-3) was obtained using ultrasonic conditions, which was employed together with other previously reported indanones to obtain a yield of pure products of about 82–95%. This indanone, as well as IND-2 and its precursor IND-1, were evaluated as electrodes in photoactive devices, using CuPc as the counter-electrode. The indanone electrodes IND-2 and IND-3 show optical band gap values for both direct and indirect transitions in the range of 2.46 and 2.86 eV, which makes them suitable semiconductors for use as electrodes. Furthermore, their electrical behavior with the CuPc counter-electrode and the polymeric solid electrolyte indicates charge transport in the devices, and faradaic processes are absent in the CV curves since these devices operate optoelectronically, not chemically. The current is attributed to the capacitive charging and discharging of the electrode–electrolyte interfaces and to charge redistribution on the indanone and CuPc electrodes. Changes in the indanone structure affect the device’s behavior because they act as charge transport modulators. According to IR spectroscopy, after use and under the studied voltage conditions, indanones remain structurally stable.

Supplementary Materials

The following supporting information can be downloaded at: https://www.mdpi.com/article/10.3390/cryst16020136/s1, Figure S1: Synthesis of 2-benzylidene-1-indanone derivatives; Figure S2: HRMS of IND-1; Figure S3: HRMS of IND-2; Figure S4: HRMS of IND-3; Figure S5: FTIR spectrum of pure IND-1; Figure S6: FTIR spectrum of pure IND-2; Figure S7: FTIR spectrum of pure IND-3; Table S1: Single-crystal X-ray Diffraction data of IND-3.

Author Contributions

Conceptualization, R.B.-I., M.E.S.V., and C.Á.T.; data curation, R.B.-I., N.I.M.M., R.A.T., M.E.S.V., and C.Á.T.; formal analysis, R.B.-I., M.E.S.V., N.I.M.M., C.Á.T., E.I.S.P., and R.A.T.; funding acquisition, M.E.S.V. and C.Á.T.; investigation, N.I.M.M., M.E.S.V., E.I.S.P., and C.Á.T.; methodology, M.E.S.V., N.I.M.M., C.Á.T., R.B.-I., E.I.S.P., and R.A.T.; project administration, M.E.S.V.; resources, M.E.S.V. and C.Á.T.; software, E.I.S.P. and M.E.S.V.; supervision, M.E.S.V.; validation, R.B.-I., M.E.S.V., and C.Á.T.; visualization, M.E.S.V., C.Á.T., and N.I.M.M.; writing—original draft, R.B.-I., M.E.S.V., N.I.M.M., E.I.S.P., and C.Á.T.; writing—review and editing, R.B.-I., M.E.S.V., E.I.S.P., and C.Á.T. All authors have read and agreed to the published version of the manuscript.

Funding

M.E.S.V. acknowledges financial support from Anahuac México University, project number PI0000331.

Data Availability Statement

The original contributions presented in this study are included in the article. Further inquiries can be directed to the corresponding author.

Conflicts of Interest

The authors declare no conflicts of interest.

References

  1. Bates, A.M.; Preger, Y.; Torres-Castro, L.; Harrison, K.L.; Harris, S.J.; Hewson, J. Are solid-state batteries safer than lithium-ion batteries? Joule 2022, 6, 742–755. [Google Scholar] [CrossRef]
  2. Zaman, W.; Hatzell, K.B. Processing and manufacturing of next generation lithium-based all solid-state batteries. Curr. Opin. Solid State Mater. Sci. 2022, 26, 101003. [Google Scholar] [CrossRef]
  3. Chai, J.; Song, L.; Li, Z.; Peng, Z.; Yao, X. Lithium spreading layer consisting of nickel particles enables stable cycling of aluminum anode in all-solid-state battery. Battery Energy 2024, 3, 40004. [Google Scholar] [CrossRef]
  4. Machín, A.; Morant, C.; Márquez, F. Advancements and challenges in solid-state battery technology: An in-depth review of solid electrolytes and anode innovations. Batteries 2024, 10, 29. [Google Scholar] [CrossRef]
  5. Jia, L.; Zhu, J.; Zhang, X.; Guo, B.; Du, Y.; Zhuang, X. Li–solid electrolyte interfaces/interphases in all-solid-state Li batteries. Electrochem. Energy Rev. 2024, 7, 12. [Google Scholar] [CrossRef]
  6. Polczyk, T.; Nagai, A. Covalent organic framework-based electrolytes for lithium solid-state batteries—Recent progress. Batteries 2023, 9, 469. [Google Scholar] [CrossRef]
  7. AlHazaimeh, T.; Raheem, M.; Al-Othman, A. Organic frameworks (COFs): Characteristics and applications for lithium-ion batteries (LIBs) and sodium-ion batteries (SIBs). Int. J. Thermofluids 2024, 21, 100531. [Google Scholar] [CrossRef]
  8. Gao, Y.; Fu, J.; Hu, Y.; Zhao, F.; Li, W.; Deng, S.; Sun, Y.; Hao, X.; Ma, J.; Lin, X.; et al. Reviving Cost-Effective Organic Cathodes in Halide-Based All-Solid-State Lithium Batteries. Angew. Chem. 2024, 136, e202403331. [Google Scholar] [CrossRef]
  9. Jiang, W.; Chen, Y.; Bi, W. Synthesis of porous organic framework materials based on deep eutectic solvents and their application in solid-phase extraction. Chin. J. Chromatogr. 2023, 41, 901–910. [Google Scholar] [CrossRef]
  10. Li, C.; Zhang, X.; Zhang, Q.; Xiao, Y.; Fu, Y.; Tan, H.H.; Liu, J.; Wu, Y. Theoretical understanding for anchoring effect of MOFs for lithium-sulfur batteries. Comput. Theor. Chem. 2021, 1196, 113110. [Google Scholar] [CrossRef]
  11. Xu, H.; Geng, P.; Feng, W.; Du, M.; Kang, D.J.; Pang, H. Recent advances in metal-organic frameworks for electrochemical performance of batteries. Nano Res. 2024, 17, 3472–3492. [Google Scholar] [CrossRef]
  12. Xu, Y.; Zhou, Y.; Li, T.; Jiang, S.; Qian, X.; Yue, Q.; Kang, Y. Multifunctional covalent organic frameworks for high capacity and dendrite-free lithium metal batteries. Energy Storage Mater. 2020, 25, 334–341. [Google Scholar] [CrossRef]
  13. Lozano González, M.; Sánchez-Vergara, M.E.; Álvarez, J.R.; Chávez-Uribe, M.I.; Toscano, R.A.; Álvarez-Toledano, C. Synthesis and optical properties of iron(III) complexes of 2-benzylidene-1-indanone derivative thin films. J. Mater. Chem. C 2014, 2, 5607–5614. [Google Scholar] [CrossRef]
  14. Monzón-González, C.R.; Corona-Sánchez, R.; Narváez, W.E.V.; Rocha-Rinza, T.; Sánchez-Vergara, M.E.; Toscano, R.A.; Álvarez-Toledano, C. Synthesis and photophysical properties of conformationally restricted difluoroboron β-diketonate complexes of 1-indanone derivatives. Tetrahedron 2020, 76, 131457. [Google Scholar] [CrossRef]
  15. Vergara, M.E.S.; Monzón-González, C.R.; Gómez, M.G.; Salcedo, R.; Corona-Sánchez, R.; Toscano, R.A.; Toledano, C.Á. Indanone-based copper(II) molecular materials as potential semiconductors for optoelectronic devices. Eur. J. Inorg. Chem. 2022, e202200125. [Google Scholar] [CrossRef]
  16. Topal, S.; Isci, R.; Sezer, E.; Ozturk, T.; Ustamehmetoglu, B. Synthesis and electropolymerization of 3-arylthieno [3,2-b]thiophenes and triphenylamine-based conomers. Electrochim. Acta 2021, 389, 138688. [Google Scholar] [CrossRef]
  17. Topal, S.; Savlug, O.S.; Sezer, E.; Ozturk, T. Electrochromic-hybrid energy storage material consisting of triphenylamine and dithienothiophene. Chem. Eng. J. 2022, 434, 133868. [Google Scholar] [CrossRef]
  18. Feng, J.K.; Cao, Y.L.; Ai, X.P.; Yang, H.Y. Polytriphenylamine: A high power and high-capacity cathode material for rechargeable lithium batteries. J. Power Sources 2008, 177, 199–204. [Google Scholar] [CrossRef]
  19. Deng, W.; Liang, X.; Wu, X.; Qian, J.; Cao, Y.; Ai, X.; Feng, J.; Yang, H. A low cost, all-organic Na-ion battery based on polymeric cathode and anode. Sci. Rep. 2013, 3, 2671. [Google Scholar] [CrossRef]
  20. Ballinas-Indili, R.; Roncagliolo-Barrera, P.; Salcedo, R.; Rodríguez-Gómez, F.J.; Álvarez-Toledano, C. Ultrasound-assisted synthesis of 2-benzyliden-1-indanona derivatives and evaluation as a corrosion inhibitor for mild steel in 1 M HCl. ACS Omega 2025, 10, 21147–21161. [Google Scholar] [CrossRef] [PubMed]
  21. Zhao, J.; Zhao, J.; He, X.; Tan, Z.; Cheng, X.; Han, Q.; Zhou, C. Emission behavior, enol-keto tautomerism and bioactivity of hydroxy-substituted cyclic chalcone derivatives. J. Mater. Chem. C 2021, 9, 1000–1007. [Google Scholar] [CrossRef]
  22. Sheldrick, G.M. Crystal structure refinement with SHELXL Acta Crystallogr. Sect. C Struct. Chem. 2015, 71, 3–8. [Google Scholar] [CrossRef]
  23. Zhao, Y.; Truhlar, D.G. A new local density functional for main-group thermochemistry, transition metal bonding, thermochemical kinetics, and noncovalent interactions. J. Chem. Phys. 2006, 125, 194101. [Google Scholar] [CrossRef] [PubMed]
  24. Grimme, S.; Antony, J.; Ehrlich, S.; Krieg, H. A consistent and accurate ab initio parametrization of density functional dispersion correction (DFT-D) for the 94 elements H-Pu. J. Chem. Phys. 2010, 132, 154104. [Google Scholar] [CrossRef]
  25. Neese, F. The ORCA program system. Wiley Interdiscip. Rev. Comput. Mol. Sci. 2011, 2, 73–78. [Google Scholar] [CrossRef]
  26. Marenich, A.V.; Cramer, C.J.; Truhlar, D.G. Universal Solvation Model Based on Solute Electron Density and on a Continuum Model of the Solvent Defined by the Bulk Dielectric Constant and Atomic Surface Tensions. J. Phys. Chem. B 2009, 113, 6378–6396. [Google Scholar] [CrossRef]
  27. Casida, M.E. Time-Dependent Density Functional Response Theory of Molecular Systems: Theory, Computational Methods, and Functionals. Theor. Comput. Chem. 1996, 4, 391–439. [Google Scholar] [CrossRef]
  28. Contreras-García, J.; Johnson, E.R.; Keinan, S.; Chaudret, R.; Piquemal, J.-P.; Beratan, D.N.; Yang, W. NCIPLOT: A program for plotting non-covalent interaction regions. J. Chem. Theory Comput. 2011, 7, 625–632. [Google Scholar] [CrossRef]
  29. Yu, J.; Su, N.Q.; Yang, W. Describing Chemical Reactivity with Frontier Molecular Orbitalets. JACS Au 2022, 2, 383–1394. [Google Scholar] [CrossRef] [PubMed]
  30. Ngokpho, B.; Janphuang, P.; Nijpanich, S.; Chanlek, N.; Wannapaiboon, S.; Siritanon, T.; Ngamchuea, K. Halide-mediated electrochemical modification of copper phthalocyanine for humidity sensing applications. Mater. Adv. 2025, 6, 658–669. [Google Scholar] [CrossRef]
  31. Socol, M.; Preda, N.; Rasoga, O.; Breazu, C.; Stavarache, I.; Stanculescu, F.; Socol, G.; Gherendi, F.; Grumezescu, V.; Popescu-Pelin, G.; et al. Flexible heterostructures based on metal phthalocyanines thin films obtained by MAPLE. Appl. Surf. Sci. 2016, 374, 403–410. [Google Scholar] [CrossRef]
  32. Regimol, C.C.; Menon, C.S. Effect of annealing and γ irradiation on tin phthalocyanine thin films. Mater. Sci. 2007, 25, 649–655. [Google Scholar]
  33. Novotny, M.; Bulir, J.; Bensalah-Ledoux, A.; Guy, S.; Fitl, P.; Vrnata, M.; Lancok, J.; Moine, B. Optical properties of zinc phthalocyanine thin films prepared by pulsed laser deposition. Appl. Phys. A 2014, 117, 377–381. [Google Scholar] [CrossRef]
  34. Djurišić, A.B.; Kwong, C.Y.; Lau, T.W.; Liu, Z.T.; Kwok, H.S.; Lam, L.S.M.; Chan, W.K. Spectroscopic ellipsometry of metal phthalocyanine thin films. Appl. Opt. 2003, 42, 6382–6387. [Google Scholar] [CrossRef]
  35. Brown, C.J. Crystal structure of β-copper phthalocyanine. J. Chem. Soc. A Inorg. Phys. Theor. 1968, 2488–2493. [Google Scholar] [CrossRef]
  36. Ajayi, D.I.; Chahrour, K.M.; Chahul, H.F.; Danladi, E.; Igbawua, T.; Jubu, P.R.; Landi, S.; Muhammad, A.; Obaseki, O.S.; Yam, F.K. Considerations about the determination of optical bandgap from diffuse reflectance spectroscopy using the Tauc plot. J. Opt. 2024, 53, 5054–5064. [Google Scholar] [CrossRef]
  37. Jain, A.; Saxena, S.; Sharma, A. The structure–activity relationship of some hexacoordinated dimethyltin(IV) complexes of fluorinated β-diketone/β-diketones and sterically congested heterocyclic β-diketones. Appl. Organomet. Chem. 2015, 29, 499–508. [Google Scholar] [CrossRef]
  38. Zhuang, Z.; Liu, D. Conductive MOFs with Photophysical Properties: Applications and Thin-Film Fabrication. Nano-Micro Lett. 2020, 12, 132. [Google Scholar] [CrossRef] [PubMed]
  39. Bessinger, D.; Ascherl, L.; Auras, F.; Bein, T. Spectrally Switchable Photodetection with Near-Infrared-Absorbing Covalent Organic Frameworks. J. Am. Chem. Soc. 2017, 139, 12035−12042. [Google Scholar] [CrossRef]
  40. Xiong, Y.; Liao, Q.; Huang, Z.; Huang, X.; Ke, C.; Zhu, H.; Dong, C.; Wang, H.; Xi, K.; Zhan, P.; et al. Ultrahigh Responsivity Photodetectors of 2D Covalent Organic Frameworks Integrated on Graphene. Adv. Mater. 2020, 32, 1907242. [Google Scholar] [CrossRef] [PubMed]
  41. Yang, Y.; Sandra, A.P.; Idström, A.; Schäfer, C.; Andersson, M.; Evenäs, L.; Börjesson, K. Electroactive Covalent Organic Framework Enabling Photostimulus-Responsive Devices. J. Am. Chem. Soc. 2022, 144, 16093−16100. [Google Scholar] [CrossRef] [PubMed]
  42. Keller, N.; Bein, T. Optoelectronic processes in covalent organic frameworks. Chem. Soc. Rev. 2021, 50, 1813. [Google Scholar] [CrossRef] [PubMed]
  43. Chen, X.; Addicoat, M.; Irle, S.; Nagai, A.; Jiang, D. Control of Crystallinity and Porosity of Covalent Organic Frameworks by Managing Interlayer Interactions Based on Self-Complementary π-Electronic Force. J. Am. Chem. Soc. 2013, 135, 546–549. [Google Scholar] [CrossRef]
  44. Lan, L.; Liu, F.; Dan, Y.; Jiang, L. Facile fabrication of triphenylamine-based conjugated porous polymers and their application in organic degradation under visible light. New J. Chem. 2020, 44, 2986. [Google Scholar] [CrossRef]
Figure 1. Molecular structure of indanone derivatives.
Crystals 16 00136 g001
Figure 2. Photoactive device (a) diagram and (b) dimensions.
Crystals 16 00136 g002
Figure 3. 1H NMR spectra of IND-3.
Crystals 16 00136 g003
Figure 4. 13C NMR spectra of IND-3.
Crystals 16 00136 g004
Figure 5. ORTEP plot of compound IND-3 was drawn at the 50% probability level.
Crystals 16 00136 g005
Figure 6. (a) Cyclic voltammetry, (b) % transmittance, and (c) absorbance of indanones IND-2 and IND-3 and their precursor IND-1 in acetonitrile.
Crystals 16 00136 g006
Figure 7. HOMO and LUMO molecular orbitals for indanones IND-1, IND-2, and IND-3.
Crystals 16 00136 g007
Figure 8. Theoretical absorbance spectra of the indanone derivatives.
Crystals 16 00136 g008
Figure 9. (a) Absorbance and % transmittance of the CuPc solid electrode. (b) Non-covalent interactions of β-form CuPc dimer in a π–π stacking arrangement (gradient isovalue s = 0.5, colored according to sign(λ2) ρ), where A denotes a π–π stacking van der Waals interaction, while B (chelate ring), C (benzene ring), and D (pyrrole unit) represent intramolecular steric repulsions.
Crystals 16 00136 g009
Figure 10. % Reflectance of (a) CuPc, (b) IND-1, (c) IND-2, and (d) IND-3 electrodes.
Crystals 16 00136 g010
Figure 11. Kubelka–Munk function for indirect and direct transitions of (a) CuPc, (b) IND-1, (c) IND-2, and (d) IND-3 electrodes. (e) Cyclic voltammetry of indanone electrodes.
Crystals 16 00136 g011
Figure 12. Comparison between IR spectra of pristine and recovered (a) CuPc, (b) IND-1 precursor, (c) IND-2, and (d) IND-3 indanones.
Crystals 16 00136 g012
Table 1. Crystal data and refinement details for IND-3.
Empirical formulaC34H25NO2
Mr479.55
T (K)298 K
λ (Å)0.71073
Crystal systemmonoclinic
Space groupP21/c
a (Å)8.9595 (7)
b (Å)6.8275 (5)
c (Å)41.728 (3)
α (°)90
β (°)93.617 (3)
γ (°)90
V (Å3)2547.4 (3)
Z4
pcalc (mg m−3)1.250
μ (mm−1)0.08
F (000)1008
Crystal size (mm)0.37 × 0.30 × 0.29
θ range for data collection (°)2.4–30.5
Reflections collected/unique50,084/7718
Rint0.063
Observed reflections [I > 2σ(I)]5840
Data/restraint/parameters7718/0/337
Goodness of fit on F21.03
R1 [I > 2σ(I)]0.059
wR2 (all data)0.191
Δpmax, Δpmax (e Å−3)0.25, −0.25
Table 2. Selected distances (Å) and angles (°) in the structure of IND-3.
DistanceAngles
O1-C11.2527 (18)C10-O2-H2102.5 (14)
O2-C101.3363 (17)C29-N1-C23122.15 (13)
O2-H21.06 (3)C29-N1-C20117.63 (11)
N1-C291.4134 (19)C23-N1-C20119.47 (12)
N1-C231.4160 (18)O1-C1-C2125.62 (14)
N1-C201.4261 (18)O1-C1-C8126.22 (14)
C1-C21.4484 (19)O2-C10-C2118.90 (13)
C2-C101.3751 (19)O2-C10-C14113.08 (12)
Table 3. Selected hydrogen bond distances (Å) less than 3.5 Å and angles (°) of IND-3.
InteractionO-HH⋯OO⋯OAngles
O2-H2⋯O11.06 (3) 151 (3)2.5289 (17)158 (2)
Table 4. Band gap and frontier molecular orbital energies for IND-1, IND-2, and IND-3.
IND-1IND-2IND-3
Eopt solvated3.12 eV2.70 eV2.67 eV
HOMO solvated−6.33 eV−5.35 eV−5.32 eV
LUMO solvated−1.79 eV−1.74 eV−1.87 eV
Etheo solvated4.53 eV3.71 eV3.45 eV
Eopt dir. film3.50 eV2.80 eV2.51 eV
Eopt ind. film3.54 eV2.86 eV2.46 eV
HOMO unsolvated−6.36 eV−5.50 eV−5.38 eV
LUMO unsolvated−1.79 eV−1.65 eV−1.81 eV
Etheo unsolvated4.57 eV3.85 eV3.57 eV
Table 5. Main calculated orbital transitions for the indanone derivatives.
IND-1
TransitionExcitation EnergyOscillator Strength (f)CompositionContribution
S0 → S13.711 eV0.7545HOMO → LUMO97.13%
S0 → S34.300 eV0.0345HOMO-1 → LUMO92.16%
IND-2
TransitionExcitation EnergyOscillator Strength (f)CompositionContribution
S0 → S13.020 eV0.9838HOMO → LUMO96.06%
S0 → S33.997 eV0.2289HOMO-1 → LUMO94.90%
S0 → S54.230 eV0.2053HOMO → LUMO+392.94%
IND-3
TransitionExcitation EnergyOscillator Strength (f)CompositionContribution
S0 → S12.095 eV0.8990HOMO → LUMO93.29%
S0 → S23.656 eV0.6371HOMO-1 → LUMO92.60%
S0 → S43.900 eV0.2137HOMO → LUMO+186.68%
HOMO → LUMO+65.89%
S0 → S64.117 eV0.2393HOMO → LUMO+395.64%
Table 6. Natural transition orbitals for the main excited states of the indanone derivatives.
IND-1S1 (w = 0.9993)S3 (w = 0.9521)
ElectronCrystals 16 00136 i001Crystals 16 00136 i002
HoleCrystals 16 00136 i003Crystals 16 00136 i004
IND-2S1 (w = 0.9903)S3 (w = 0.9801)S5 (w = 0.9659)
ElectronCrystals 16 00136 i005Crystals 16 00136 i006Crystals 16 00136 i007
HoleCrystals 16 00136 i008Crystals 16 00136 i009Crystals 16 00136 i010
IND-3S1 (w = 0.9911)S2 (w = 0.9825)S4 (w = 0.9669)S6 (w = 0.9860)
ElectronCrystals 16 00136 i011Crystals 16 00136 i012Crystals 16 00136 i013Crystals 16 00136 i014
HoleCrystals 16 00136 i015Crystals 16 00136 i016Crystals 16 00136 i017Crystals 16 00136 i018
Disclaimer/Publisher’s Note: The statements, opinions and data contained in all publications are solely those of the individual author(s) and contributor(s) and not of MDPI and/or the editor(s). MDPI and/or the editor(s) disclaim responsibility for any injury to people or property resulting from any ideas, methods, instructions or products referred to in the content.