Abstract
The wear failure mode of a paver spiral blade was simulated by EDEM software. High-manganese steel, medium chromium alloy steel, and high chromium alloy steel were selected as matrix materials; SiC particles and WC particles were selected as surface particle reinforcement materials; and the spiral blade was prepared by the EPC process. The performance and wear mechanism of the spiral blade prepared by EPC were analyzed by microstructure, hardness, impact, pin disk, erosion wear test, and wear morphology. Modeling with EDEM software and applying the discrete element analysis method of particle system could simulate the actual working situation of the spiral blade of the paver well. Through the simulation, it was found that the wear amount of the spiral blade of the paver from the spiral shaft to the outside of the spiral blade was increasing. SiC and WC particle-reinforced wear-resistant coatings were prepared on the surfaces of high-manganese steel, medium chromium alloy steel, and high chromium alloy steel by the EPC method. The wear-resistant coating of high-manganese steel was 5.05 mm, the coating of medium chromium alloy steel was 5.98 mm, and the coating of high chromium alloy steel was 7.02 mm. The higher the chromium content, the better the diffusion with SiC and WC particles. In the process of the wear test, the soft phase in the coating was first worn away and concaved, and the hard phase protruded to bear the wear. After wear, it was found that the sample with high chromium alloy steel as matrix and SiC and WC particles as wear-resistant coating had the best wear resistance.
1. Introduction
Asphalt mixture paver is a special construction machine for paving asphalt pavement. Its function is to evenly pave the mixed asphalt mixture on the bottom layer of the pavement, mainly including a walking system, hydraulic system, spiral material distribution system, etc. When the spiral powder system is working, the blade rotates and pushes the mixture to roll. With the increasing extrusion pressure, the mixture is extruded from the distributor to achieve the purpose of material separation. In this process, 2/3 spiral blades are always deeply buried in the mixture. Sand, stone, and other substances with high hardness in the mixture squeeze and rub with the spiral blade surface in the rolling state, resulting in wear. In the process of use, the blade is gradually worn from the outer edge to the inside, resulting in the gradual reduction of the blade size, and ultimately becoming unusable.
As an advanced casting forming method, lost-foam casting technology has the advantages of high casting precision, low manufacturing cost, and green and environmental protection [1,2], and has developed rapidly in the world. Based on hydrodynamics, heat transfer, and metal crystallography, the researchers established a numerical model for the pouring process to simulate the process of pyrolysis, die speed and time, gas pressure change, and so on [3,4,5], which provided a theoretical basis for effectively controlling the casting quality and was of great significance to the optimal design of the pouring system. Some scholars used various sensors to observe the filling process of lost-foam mold and obtained the relevant parameters of foam cracking process and metal solidification process, providing accurate experimental data support for computer simulation [6]. Barone Mr. and Caulk Da. [7] proposed a model of heat transfer between molten metal and foam mold, polymer decomposition, and gas diffusion in lost-foam casting of aluminum alloy. The model was in good agreement with the experimental data. At the same time, it could be used to analyze the filling process of molten metal, and it was pointed out that the decomposition of foam mold had an important impact on the generation of defects. Shin Sr. and Lee Zh. [8] studied the generation mechanism of hydrogen pores in aluminum alloy lost-foam casting. It was found that the original concentration of hydrogen in the melt and the reaction time between liquid metal and polystyrene had an important influence on the generation of hydrogen pores. At the same time, it was found that the entry of hydrogen into the liquid metal during low-temperature pouring mainly came from liquid polystyrene, while the entry of hydrogen during high-temperature pouring mainly came from gas and liquid products. In this paper, the spiral blade was prepared by vacuum EPC technology, and its solidification mechanism and wear-resistant mechanism were studied so as to provide guidance for improving the wear-resistant performance of spiral blade.
2. Materials and Methods
High-manganese steel, medium chromium alloy steel, and high chromium alloy steel were selected as the matrix materials of EPC. The composition is shown in Table 1. SiC particles and WC particles were selected as surface particle reinforcement materials. The preparation process of the spiral blade is shown in Figure 1. Metal powder was prepared by adding 2% of the cosolvent (anhydrous borax powder) into particle-reinforced WC and SiC. The role of the cosolvent was to remove the oxide film in the powder, clean the coating surface, and improve the wettability of molten steel. Meanwhile, the surface-coating part was reserved according to the EPS model. The prepared EPS model is shown in Figure 2. Then, the metal powder was coated on the surface of the EPS model and dried for 1 day. The surface of the EPS model coated with metal powder was evenly dipped with antisticking sand paint, which was left to dry, and then repeatedly dipped twice for 2 days to form a hard shell on the surface of the model. The EPS model was placed in the sand box, filled with quartz sand with uniform particles, and the gate and vacuum were reserved. Vacuum degree was 0.03–0.05 MPa by vacuum pump. High-manganese steel, medium chromium alloy steel, and high chromium alloy steel were fully melted and poured separately. After two hours pouring, the box was discharged for air cooling, as shown in Figure 3.

Table 1.
Matrix composition.
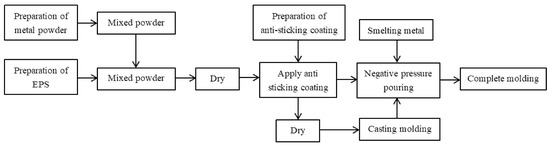
Figure 1.
Process flow chart of surface coating cemented carbide coating.
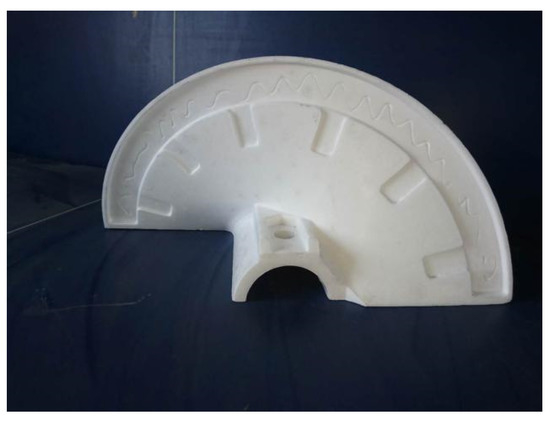
Figure 2.
EPS model.
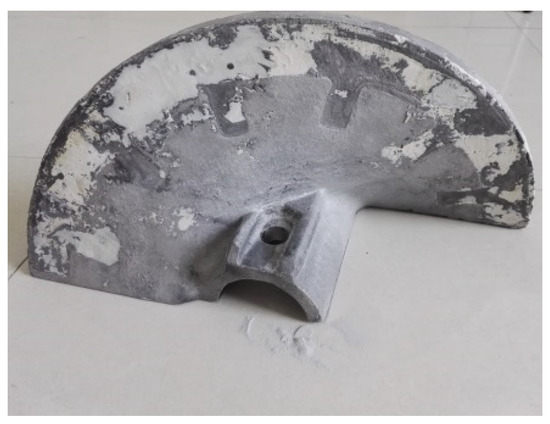
Figure 3.
Cast spiral blade.
After casting, the metallographic samples were taken by wire cutting, polished, and etched with 4% nitric acid alcohol solution. A MNT919220 Vernier caliper was used to measure the coating thickness. The microstructure was observed with a Leica DMI5000M metallographic microscope, and the composition of the coating was tested with Oxford X-act. A ThRP-150D digital display Rockwell hardness tester was used for the hardness test, the scale was HRC, and the final hardness was the average value of 6 points. A Vickers microhardness tester model KB-30S was used to measure the hardness of different structures on metallographic samples. The suitable parameters for the test were 1 kg load and 18 s loading time. The average of three readings for each hardness value was calculated. The impact energy was tested on the PTM2200 low-temperature pendulum impact tester. The sample was a non-notched sample with a size of 55 × 10 × 10 mm. The pin disc friction and wear test load were 150 N, the speed 180 r/min, and the time 60 min. The pin was prepared from the spiral blade 9.8 × 9.8 × 20 mm samples. The disc adopted 7 Mohs hardness quartz with a diameter of 70 mm. In total, 12 kg quartz sand 12 kg and 7 L water were used as the wear medium for erosion wear, and the rotating speed was 1000 r/min. The pregrinding was 10 min before the test, and then the wear time was 60 min. The wear amount was the average value of three test results. The wear form shown in Figure 4 was adopted, respectively. After the wear test, it was cleaned and dried with alcohol solution in the ultrasonic cleaning instrument, and its mass was weighed with an analytical balance of one ten-thousandth. Finally, the wear morphology was observed by Inspect S50 scanning electron microscope.
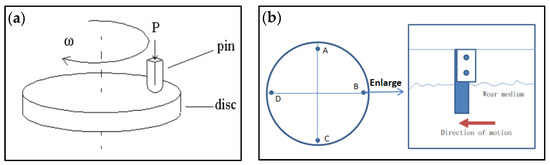
Figure 4.
Wear form, (a) pin disc wear, (b) erosion wear.
3. Results
3.1. Working Condition Simulation of Helical Blade
As shown in Figure 5, EDEM software was used for modeling, and the discrete element analysis simulation method of the particle system was used to simulate the actual working condition of the spiral distributor. The wear condition of the spiral blade during material distribution and distribution during the construction of the paver was simulated. The selected abrasive particle size, physical parameters, and interaction coefficient are shown in Table 2, Table 3 and Table 4.
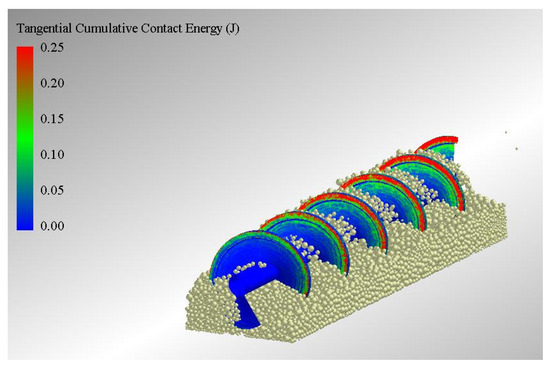
Figure 5.
Working condition simulation of helical blade.
Table 2.
Particle size distribution of crushed stone aggregate.
Table 3.
Physical parameters of crushed stone aggregate and spiral.
Table 4.
Interaction coefficient between gravel and spiral.
The method of dynamically generating particles was adopted, and the spiral speed was 90 r/min. The mass flow of crushed stone aggregate was calculated according to the actual paving thickness. The spiral wear of the paver was mainly from the contact wear between gravel aggregate and spiral blade. The wear amount of the spiral was characterized by the accumulation of tangential energy loss at the contact point between aggregate and spiral blade with simulation time. The spiral was composed of unstructured grid with the maximum size not exceeding 1.5 mm, and its size is only 0.3 times that of the minimum material size (5 mm), which could well capture the wear information of the spiral surface.
As can be seen from Figure 5 and Figure 6, the wear of the spiral from the spiral shaft to the outside of the spiral blade was increasing. At the same screw speed, the farther away from the screw shaft, the greater the relative speed of the crushed stone aggregate in contact with the screw blade, and the more wear would be produced, accordingly. The spiral near the starting end had a small amount of wear, which was due to the relatively fast falling speed of crushed stone aggregate at the discharge end, the material was relatively loose in this area, and the extrusion between the material and the spiral blade was relatively light. From the second helix to the fourth helix, the helix was heavily worn, which was due to the large amount of crushed stone aggregate gathering there and increasing the contact with the helix. Near the end of the dividing spiral, the spiral also had a small amount of spiral wear because of the reduction of aggregate at the end of the dividing spiral and less contact with the spiral.
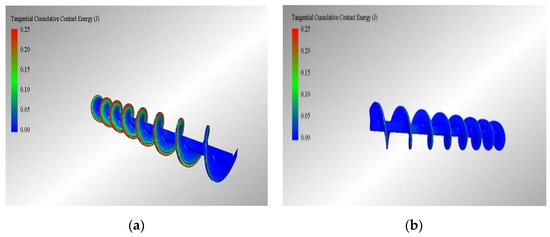
Figure 6.
Distribution of working 20 s wear of helical blade, (a) Wear of blade working surface, (b) Wear of blade non-working surface.
3.2. Microstructure
The thickness of the sample coating was measured as shown in the Figure 7. The coating thickness of the first, second, and third was 5.05 mm, 5.98 mm, and 7.02 mm respectively. Figure 8 and Figure 9 showed the metallographic structure of the sample. The core structure of the first sample was austenitic structure, hardened particles were embedded at the grain boundary, and the carbide hardness was 1153HV1. The core of the second sample was acicular martensite, with fine hard particles evenly distributed on the surface, and the hardness of the surface coating could reach 1182HV1. The core of the third sample was coarse acicular martensite, with fine hard particles evenly distributed on the surface [9,10,11], and the hardness of the surface coating reached 1170HV1.
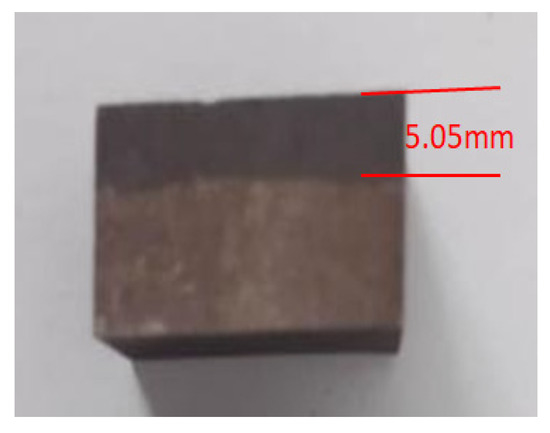
Figure 7.
Coating thickness test.
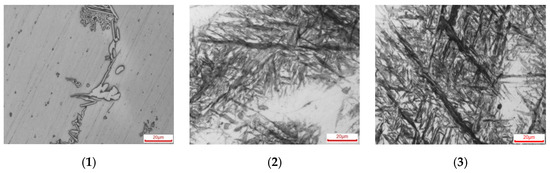
Figure 8.
Matrix microstructure, (1) High manganese steel, (2) Medium chromium alloy steel, (3) High chromium alloy steel.
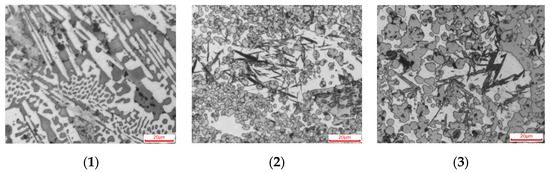
Figure 9.
Surface layer microstructure, (1) High manganese steel, (2) Medium chromium alloy steel, (3) High chromium alloy steel.
Figure 9 shows the microstructure of the sample surface, and Figure 10 shows the EDAX analysis results of the second sample surface. The coating structure was SiC, WC particles, and carbides. In the lost-foam casting process, the alloy elements in the matrix would diffuse to the coating. Through EDAX analysis at the red square of Figure 10, it was found that some Cr elements had diffused into the coating, indicating that the migration of alloy elements would occur in the process of EPC.
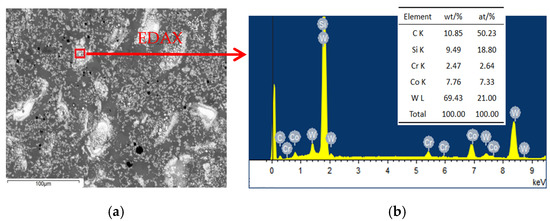
Figure 10.
EDAX results of surface layer, (a) Coating scanning, (b) Particle enhanced EDAX results.
3.3. Hardness Test Results
The hardness of the sample was tested by a Rockwell hardness tester and micro-Vickers hardness tester, respectively. The results are shown in Table 5 and Figure 11. It could be seen that the hardness value of the matrix was different due to different matrix materials. The average hardness of the matrix was 28.6HRC, 48.0HRC, and 51.5HRC, respectively. The surface hardness was basically the same due to the use of the same material [12,13]. From the micro-Vickers hardness curve, the hardness value was very high at first, and the highest point could reach more than 1200HV1. There was an obvious downward trend. The microstructure of the sample surface was composed of SiC, WC, and carbide, which were all high, hard phases with high hardness, so the surface hardness was high. The first matrix structure was mainly austenite, resulting in low hardness. The matrix structure of the second and third samples was acicular martensite with high hardness.
Table 5.
Rockwell hardness test results of samples.
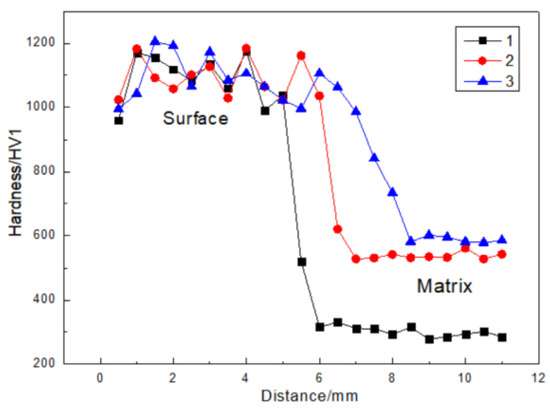
Figure 11.
Vickers hardness curve of sample.
3.4. Impact Test Results
The three samples were prepared according to the requirements and subjected to a notchless impact test [14]. The results are shown in Table 6. It can be seen from the test results that due to the difference of matrix materials, the impact toughness of the sample matrix was 43.5 J/cm2, 12.4 J/cm2, and 8.4 J/cm2, respectively. The first sample was high-manganese steel with an austenitic structure, which had good toughness and could prevent crack propagation. The matrix structure of the second and third samples was acicular martensite, which had less of a slip system and made it easy to produce microcracks, so the impact toughness was poor.
Table 6.
Impact test results.
3.5. Wear Test Results
The pin disc wear results of the three samples are shown in Table 7 and Figure 12. The average wear weight loss of the samples was 0.236 g, 0.194 g, and 0.099 g, respectively. The wear performance of the third sample was much better than that of the first and second samples. It can be seen from Figure 12 that the friction coefficient of the first sample was larger, and the friction coefficient of the third sample was the smallest, which corresponded to its wear resistance. After EPC, Cr and Mn elements in the sample would diffuse into the coating, resulting in changes in the hardness of the coating. Mn in the sample diffused into the coating, resulting in relatively low hardness of the coating part and uneven hardness distribution. Therefore, it had a large loss in the wear with the disk, and adhesive wear occurred with the disk. However, when Cr in the sample diffused into the coating, its hardness was high, the hardness in the coating was uniform, and the wear process with the disc was stable, so its friction coefficient was small.
Table 7.
Pin disc wear results.
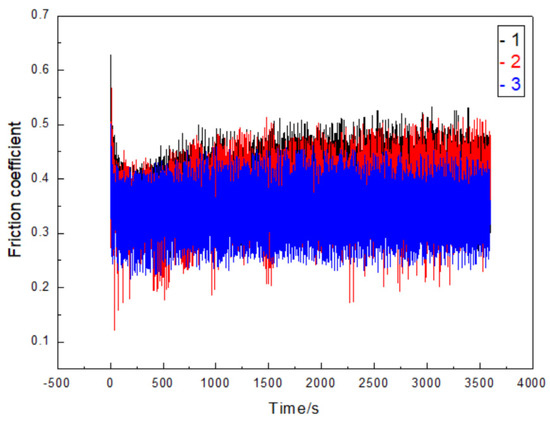
Figure 12.
Diagram of friction coefficients.
The erosion wear results of the three samples are shown in Table 8. The average wear weight loss of the sample was 0.3761 g, 0.3412 g, and 0.2180 g, respectively. The wear performance of the third sample was much better than that of the first and second samples.
Table 8.
Erosion wear test results.
3.6. Wear Morphology Analysis
As can be seen from Figure 13, the wear morphology of the pin and disc of the three samples showed a furrow phenomenon. Pin disc friction and wear tester was a kind of dry wear test. The samples could move back and forth in the circumferential direction by pressing the samples tightly on the rotating disc with load. The sample was directly worn with the disc, and there was no medium between them. The furrow of the first sample was deep, with ridges on both sides and a little peeling. The scratch of the second sample was fine and there was no carbide peeling. The third sample had the smallest scratch and no carbide peeling [15,16].
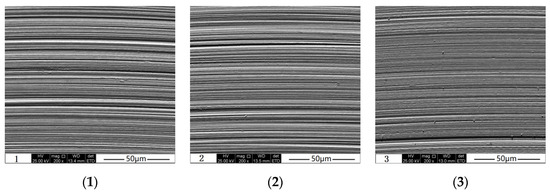
Figure 13.
Wear morphology of pin and disc, (1) High manganese steel, (2) Medium chromium alloy steel, (3) High chromium alloy steel.
As can be seen from Figure 14, the erosion wear morphology of the three samples showed pits. The samples in erosion wear were in the state of wet friction by colliding with the abrasive material that was freely suspended in the mortar during rotation. Obvious pits could be seen from the first and second samples, and the level drop was large. The third sample block showed a smaller level drop and better erosion wear resistance after erosion.
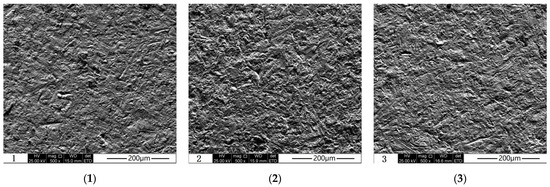
Figure 14.
Erosion wear morphology, (1) High manganese steel, (2) Medium chromium alloy steel, (3) High chromium alloy steel.
4. Discussion
When the high-temperature metal liquid was filled, the expandable polystyrene foam pattern and the binder in the alloying coating were decomposed and gasified at a high temperature. It could produce a large amount of gas and escape under the suction of negative pressure. As a result, a large number of gaps were generated between the surface coating and the alloy particles, and the liquid metal was in direct contact with the alloying coating. Under the action of capillary force, negative pressure suction, and static pressure of metal liquid, high-temperature metal liquid infiltrated into the gap of the alloy powder and penetrated from inside to outside. When the infiltrated metal liquid finally contacted with the antisticking sand coating layer, the surface alloying process of the sample ended.
At the interface between liquid metal and alloy particles, alloy elements continued to diffuse into liquid metal, resulting in a series of metallurgical chemical reactions. After the liquid metal solidifies, this process would also proceed slowly. Due to full contact with high-temperature molten metal, the alloy particles completely melt under the action of high-temperature heat and free the alloy elements. Under the driving action of high temperature, the atoms in the reinforced particles obtained higher energy, overcame the potential barrier transition, and produced the diffusion phenomenon with the atoms in the liquid matrix. With the physical, chemical, and mechanical reaction, it finally fused with the liquid metal to form some new phase substances, which were dispersed on the matrix. Until the liquid steel solidifies, these elements still slowly diffused to the base metal, and finally formed the new phase enhancement zone [17,18]. The alloy particles close to the outer surface were far away from the mother liquid, so the penetration of the metal liquid here was insufficient, the infiltrated metal liquid remained liquid for a short time, and the diffusion of the alloy elements was very insufficient. The coating hardness of the first, second, and third samples was almost the same. In the transition zone, the coating thickness and hardness of the transition zone were different due to the different diffusion ability and carbide forming ability of Mn and Cr elements. The matrix hardness was also different due to the different matrix material microstructure. The matrix of the first sample was austenitic high-manganese steel with low hardness, and austenite had good toughness. When subjected to impact, phase transformation strengthening could occur, so its impact toughness was high. The second and third samples were medium and high chromium alloy steel, respectively, which had high hardness and poor impact toughness.
The objects in contact slid on the surface, and the adhesion process between the microconvex bodies made the microconvex bodies subject to tensile stress and compressive stress at the same time. The microconvex body with relatively low hardness was seriously stressed, which would not only have the process of elastic deformation, but also have the effect of plastic deformation, and even be directly torn off. In the wear test, the load acting on the sample would first act on the microconvex body, and the soft microconvex body would undergo plastic deformation under the load. Under the reciprocating action of stress, the metal with plastic deformation would peel off and leave pits on the surface of the worn sample. In the process of wear, the transferred material separates from the material surface and becomes wear debris. In this process, cracks were generated at inclusions or holes. When these cracks extended to the surface of the material, the cracks would aggregate and peel the metal out of the material surface [19].
For the coating wear-resistant materials, due to the high hardness of the coating and the mutual diffusion of alloy elements between the coating and the substrate in the process of EPC preparation, it could effectively resist the wear of abrasives. With the extension of wear time, the soft phase in the coating was first ground away and concaved, and the hard phase protruded to bear the wear so as to effectively protect the sample and reduce the wear of the sample [20]. The matrix of the first sample was austenitic high-manganese steel, and the carbide hardness formed when the Mn element in the high-manganese steel diffused to the coating was relatively low. The second and third samples had higher carbide hardness formed by chromium in the coating, so their wear resistance was better than the first sample. The matrix of the third sample was high chromium alloy steel, and the second sample was medium chromium alloy steel. Therefore, at the same high temperature, the third sample had higher potential energy, more carbides were formed in the coating, and its wear resistance was better.
5. Conclusions
- (1)
- Modeling with EDEM software and applying the discrete element analysis method of particle system could well simulate the actual working situation of the spiral blade of paver. Through the simulation, it was found that the wear amount of the spiral blade of paver from the spiral shaft to the outside of the spiral blade was increasing.
- (2)
- SiC and WC particle-reinforced wear-resistant coatings were prepared on the surfaces of high-manganese steel, medium chromium alloy steel, and high chromium alloy steel by the EPC method. The wear-resistant coating of high-manganese steel was 5.05 mm, the coating of medium chromium alloy steel was 5.98 mm, and the coating of high chromium alloy steel was 7.02 mm. The higher the chromium content, the better the diffusion with SiC and WC particles.
- (3)
- In the process of the wear test, the soft phase in the coating was first worn away and concaved, and the hard phase protruded to bear the wear. After wear, it was found that the sample with high chromium alloy steel as matrix and SiC and WC particles as wear-resistant coating had the best wear resistance.
Author Contributions
Conceptualization, Y.L.; methodology, Y.L. and P.Z.; software, Y.L.; validation, Y.L. and P.Z.; writing—original draft preparation, P.Z. and C.T.; writing-review and editing, Z.S. All authors have read and agreed to the published version of the manuscript.
Funding
This research received no external funding.
Institutional Review Board Statement
Not applicable.
Informed Consent Statement
Not applicable.
Data Availability Statement
The data presented in this study are available within the article.
Conflicts of Interest
The authors declare no conflict of interest.
References
- Liang, G. Situation and Prospact of FM(EPC) Process in China. Specical-Cast Non-Ferr. Alloy. 1999, 1, 48–50. [Google Scholar]
- Lessiter, M.J. A look back at the 20th century. X. Lost foam casting. Mod. Cast. 2000, 90, 54–55. [Google Scholar]
- Cermak, K. An appraisal of the lost foam process. Indian Foundry J. 1991, 5, 19–22. [Google Scholar]
- Clegg, A. Expanded-Polystyrene Moulding—A Status Report. Foundry Trade J. 1985, 159, 177–180. [Google Scholar]
- Caulk, D. A foam engulfment model for lost foam casting of aluminum. Int. J. Heat Mass Transf. 2006, 49, 3831–3845. [Google Scholar] [CrossRef]
- Khodai, M.; Parvin, N. Pressure measurement and some observation in lost foam casting. J. Mater. Processing Technol. 2008, 206, 1–6. [Google Scholar] [CrossRef]
- Barone, M.; Caulk, D. A foam ablation model for lost foam casting of aluminum. Int. J. Heat Mass Transf. 2005, 48, 4132–4149. [Google Scholar] [CrossRef]
- Shin, S.; Lee, Z.; Cho, G.; Lee, K. Hydrogen gas pick-up mechanism of Al-alloy melt during Lost Foam Casting. J. Mater. Sci. 2004, 39, 1563–1569. [Google Scholar] [CrossRef]
- Zhang, Z.; Yang, C.; Zhang, P. Microstructure and wear resistance of high chromium cast iron containing niobium. China Foundry 2014, 11, 179–184. [Google Scholar]
- Alptekin, K. Influence of solution treatment on microstructure, corrosion resistance, and oxidation behavior of cast G-NiCr28W alloy. China Foundry 2019, 16, 63–70. [Google Scholar]
- Xiong, G.; Zheng, M.; Zhao, L. Research state on technology of metal matrix composites prepared by casting process. Cast. Technol. 2006, 4, 563–565. (In Chinese) [Google Scholar]
- Xiao, X.; Ye, S.; Yin, W.; Zhou, X. High Cr white cast iron/carbon steel bimetal liner by lost foam casting with liquid-liquid composite process. China Foundry 2012, 2, 136–142. [Google Scholar]
- Javaheri, V.; Rastegari, H.; Seftejani, M.N. Fabrication of plain carbon steel/high chromium white cast iron bimetal by a liquid-solid composite casting process. Int. J. Miner. Metall. Mater. 2015, 22, 950–955. [Google Scholar] [CrossRef]
- Ma, Y.; Li, X.; Liu, Y.; Zhou, S.; Dang, X. Effect of Ti-V-Nb-Mo addition on the microstructure of high chromium cast iron. China Foundry 2012, 9, 148–153. [Google Scholar]
- Sun, W.; Qin, X.Z.; Guo, J.; Lou, L.; Zhou, L. Thermal stability of primary MC carbide and its influence on the performance of cast Ni-base super-alloys. Mater. Des. 2015, 69, 81–88. [Google Scholar] [CrossRef]
- Zhu, Y.; Wei, Z.; Rong, S.; Wang, H.; Zou, C. Formation mechanism of bimetal composite layer between LCS and HCCI. China Foundry 2016, 13, 396–401. [Google Scholar] [CrossRef][Green Version]
- Zou, W.; Zhang, Z.; Yang, H.; Wei, L. Effect of vibration frequency on microstructure and performance of high chromium cast iron prepared by lost foam casting. China Foundry 2016, 13, 248–255. [Google Scholar] [CrossRef]
- Llewellyn, R.J.; Yick, S.K.; Dolman, K.F. Scouring erosion resistance of metallic materials used in slurry pump service. Wear 2004, 256, 592–599. [Google Scholar] [CrossRef]
- Filipovic, M.; Kamberovic, Z.; Korac, M.; Gavrilovski, M. Microstructure and mechanical properties of Fe-Cr-C-Nb white cast irons. Mater. Des. 2013, 47, 41–48. [Google Scholar] [CrossRef]
- Coelho, G.H.; Golczewski, J.A.; Fischmeister, H.F. Thermodynamic calculations for Nb-containing high-speed steels and white cast iron alloys. Metal. Mater. Trans. A 2003, 34, 1749–1758. [Google Scholar] [CrossRef]
Publisher’s Note: MDPI stays neutral with regard to jurisdictional claims in published maps and institutional affiliations. |
© 2022 by the authors. Licensee MDPI, Basel, Switzerland. This article is an open access article distributed under the terms and conditions of the Creative Commons Attribution (CC BY) license (https://creativecommons.org/licenses/by/4.0/).