Article

A Comparative Analysis of the Tribological Behavior of Hard Layers Obtained by Three Different Hardened-Surface Processes on the Surface of AISI 4140 Steel

by
Pablo Alfredo Ruiz-Trabolsi
1,
Alexis Chino-Ulloa
1,
José Guadalupe Miranda-Hernández
2,
Raúl Tadeo-Rosas
3,
Rafael Carrera-Espinoza
4,
Julio César Velázquez
5,* and
Enrique Hernández-Sánchez
1,*
1
Instituto Politécnico Nacional, Unidad Profesional Interdisciplinaria de Biotecnología, Departamento de Bioingeniería, Avenida Acueducto s/n Barrio la Laguna Ticomán, México City 07340, Mexico
2
Centro Universitario UAEM Valle de México, Laboratorio de Investigación y Desarrollo de Materiales Industriales, Universidad Autónoma del Estado de México, Atizapán de Zaragoza 54500, Mexico
3
Facultad de Ingeniería Mecánica y Eléctrica, Universidad Autónoma de Coahuila, Unidad Torreón, Carretera Torreón-Matamoros, km 7.5, Ciudad Universitaria, Ejido el Águila, Torreón Coahuila 27276, Mexico
4
Departamento de Ingeniería Industrial y Mecánica, Universidad de las Américas Puebla, Ex hacienda Santa Catarina Mártir, San Andrés Cholula Puebla 72810, Mexico
5
Instituto Politécnico Nacional, ESIQIE, Departamento de Ingeniería Química Industrial, UPALM Edificio 7, Zacatenco, México City 07738, Mexico
*
Authors to whom correspondence should be addressed.
Crystals 2022, 12(2), 298; https://doi.org/10.3390/cryst12020298
Submission received: 12 January 2022 / Revised: 17 February 2022 / Accepted: 18 February 2022 / Published: 20 February 2022
(This article belongs to the Special Issue Microstructure Characterization and Design of Alloys)

Abstract

:
This work compares the tribological behavior of surface layers obtained by three different hardening processes. The layers were formed on the surface of AISI 4140 steel by applying three different thermochemical treatments. Wear resistance was evaluated using a standardized tribological machine for abrasive wear, according to the limits established by the ASTM G65 “Standard Test Method for Measuring Abrasion Using Dry Sand/Rubber Wheel Apparatus”. According to the results, the boride layers exhibited the highest wear resistance, as compared to nitrided and carburized layers. In contrast, the carburized layers presented the highest loss of volume. Scanning electron microscopy (SEM) was used to analyze the worn surfaces to examine the wear mechanisms. Abrasive wear was identified in all the samples, as the main abrasive wear mechanism. The mean values of the coefficient of friction (CoF) of the hardened surfaces were 0.39, 0.55, and 0.65 for carburizing, nitriding, and boriding samples, respectively, indicating that the wear process may not always be related to a low CoF. The results suggest that the highest hardness is normally associated with high wear resistance, but the coefficient of friction could be not directly related to the hardness of the materials. Finally, a statistical study demonstrates the random nature of the layers obtained by three different hardening processes.

1. Introduction

AISI 4140 steel is frequently used in industrial applications, such as automotive crankshafts, cams, and spindles. In many cases, the elements manufactured with AISI 4140 steel are exposed to friction due to the relative movement of individual bodies in contact with each other [1]. The study and understanding of this phenomenon are essential due to the fact that friction between mechanical elements can lead to economic losses of approximately 0.5% of the gross domestic product (GDP) in developed countries [2]. On the other hand, there exist different conditions leading to wear, such as surface–surface contact (friction wear), surface contact with a strange substance (abrasive wear), and erosion by corrosive materials (corrosive wear). Thus, the study and control of wear is not a simple task, and it depends on the system in question. The problem of wear is present in all kinds of industries, even in orthopedic surgery, where one of the main problems encountered with hip and knee prostheses is aseptic loosening. This problem has been associated with the tissue reaction to wear particles of the implant material produced by friction between the contacting surfaces [3]. In that sense, different methods to prevent wear have been developed. The use of lubricants between two sliding solids can reduce friction and, therefore, the wear on the materials.
To reduce wear, several researchers have focused on enhancing the surface mechanical properties of the materials by applying different surface-hardening methods. Processes, such as carburizing, nitriding, and boriding, have been widely used to improve the materials’ surface properties. Generally, these processes are cheaper than substituting the machinery elements with others of more expensive materials [4]. Carburizing, nitriding, and boriding are thermochemical processes, so they involve increasing the temperature to activate the element to diffuse in each case [5]. In carburizing, the activation temperature of the carbon ranges between 815 °C and 1070 °C. The carbon is typically supplied by solid, liquid, or gaseous media. The resulting layers range from 0.05 to 1.5 mm with hardness values in the range of 540–885 HV [5].
Comparatively, nitriding consists of diffusing nitrogen from gases rich in nitrogen (N), such as ammonia (NH3), or the dissociative adsorption of N2 into a steel matrix to form nitriding compounds, such as FeN and FeN2 [6]. The activation temperature of nitrogen ranges from 480 °C to 800 °C. The obtained layer’s thickness varies between 0.0025 to 0.75 mm with hardness values from 510 to 1020 HV [6]. Finally, the activation temperature for the boriding process ranges from 800 °C to 1100 °C. The process takes place in solid, liquid, or gaseous media, and the resulting layers can be in a single-phase layer consisting of Fe2B or a double-phase layer of FeB/Fe2B. The thickness of the resulting layers ranges from 10 to 250 µm, depending on the chemical composition of the substrate, the boron potential supplied during the process, and the treatment conditions (e.g., temperature and time) [7]. The tribological behavior of the resulting surfaces will depend on the applied surface-hardening process.
This research studies surface hardening on AISI 4140 steel. The subject steel is considered low-alloy steel; that is, it is steel alloyed with various elements to improve its mechanical characteristics and corrosion resistance. One feature of this steel is that it contains less chromium than stainless steel. The AISI 4140 steel has many applications in the following industries: aerospace, oil and gas, manufacturing, and automotive [8,9,10]. Table 1 describes specific applications of AISI 4140 steel for different industries. Nearly all these pieces or mechanical parts undergo wear when working. For this reason, it is necessary to improve their wear resistance to increase their working lifetime.
AISI 4140 steel has an excellent capability to be quenched to enhance its mechanical properties in order to mitigate wear and corrosion [11,12]. However, sometimes quenching is not enough for the wear conditions.
Different researchers have reported the effect of diverse hardening processes on the mechanical and tribological properties of AISI 4140 steel [11,12]. Nevertheless, there is still much to investigate about the tribological behavior of hardened AISI 4140 steel. Additionally, there are other hardening methods to enhance the surface properties of the materials. This paper details and compares the tribological behavior of the surface layers obtained by three different hardening processes. The processes involve solid diffusion (e.g., boriding, nitriding, and carburizing) applied to AISI 4140. Finally, the study involves two different methods to evaluate wear resistance and coefficient of friction (CoF).

2. Materials and Methods

2.1. Thermochemical Treatments

Cylindrical samples of AISI 4140 steel of 50.8 mm in diameter and 10 mm in length were prepared under a traditional metallographic technique using 600 mesh SiC paper. The chemical composition of AISI 4140 steel samples is described in Table 2. After the metallographic process, samples were cleaned in an ultrasonic bath for 5 min in ethanol to eliminate impurities.
Three different thermochemical surface-hardening processes were applied to the samples (i.e., nitriding, carburizing, and boriding). Nitriding was completed by melting salt by the Tenifer technique at 580 °C for 2 h (TERMITEC, Mexico City, Mexico). Carburizing was performed using the powder-pack process at 800 °C for 4 h in a powder mixture of sodium carbonate and barium carbonate [12]. Finally, boriding was conducted at 950 °C for 4 h by the powder-pack method [13]. The treatment conditions were established considering the data reported in the literature to have comparative results [12,13]. Three samples were treated for each thermochemical process according to the ASTM G-65 standard to ensure the reproducibility of the results [14].

2.2. Surface Characterization

After the thermochemical processes, the samples were cleaned with Scotch fiber and water. Then, the samples were cleaned by sonication for five minutes in ethanol and deionized water (50/50) and dried with hot air. The morphology and the thickness of the formed layers were analyzed by optical microscopy (OM), with the aid of a GX-51 optical microscope (Olympus, Center Valley, PA, USA), and by scanning electron microscopy (SEM) (JSM-6360LV, JEOL, JEOL Ltd., Akishima, Japan). The nature of the different phases formed after the hardening processes was evidenced by X-ray diffraction (XRD), with the aid of a D8 FOCUS diffractometer using Cu–Kα radiation at a wavelength of 1.5418 Å (Bruker, Billerica, MA, USA).
The hardness of hardened surfaces was evaluated by the Vickers micro-indentation technique, using a CMS microhardness tester (CMS Metrology, Tlalnepantla de Baz, Mexico). The elastic modulus was evaluated by the nanoindentation technique with the aid of a nanohardness tester (csm, Needham, MA, USA). At least ten indentations were made in the middle of the hardened layers. The applied load and the distance from the surface for the hardness tests were established as a function of the thickness of the hardened layer, as shown in Table 3.

2.3. Tribological Tests

The tribological behavior of the hardened surfaces was established by two different techniques (i.e., abrasive wear test and pin-on-disk test).

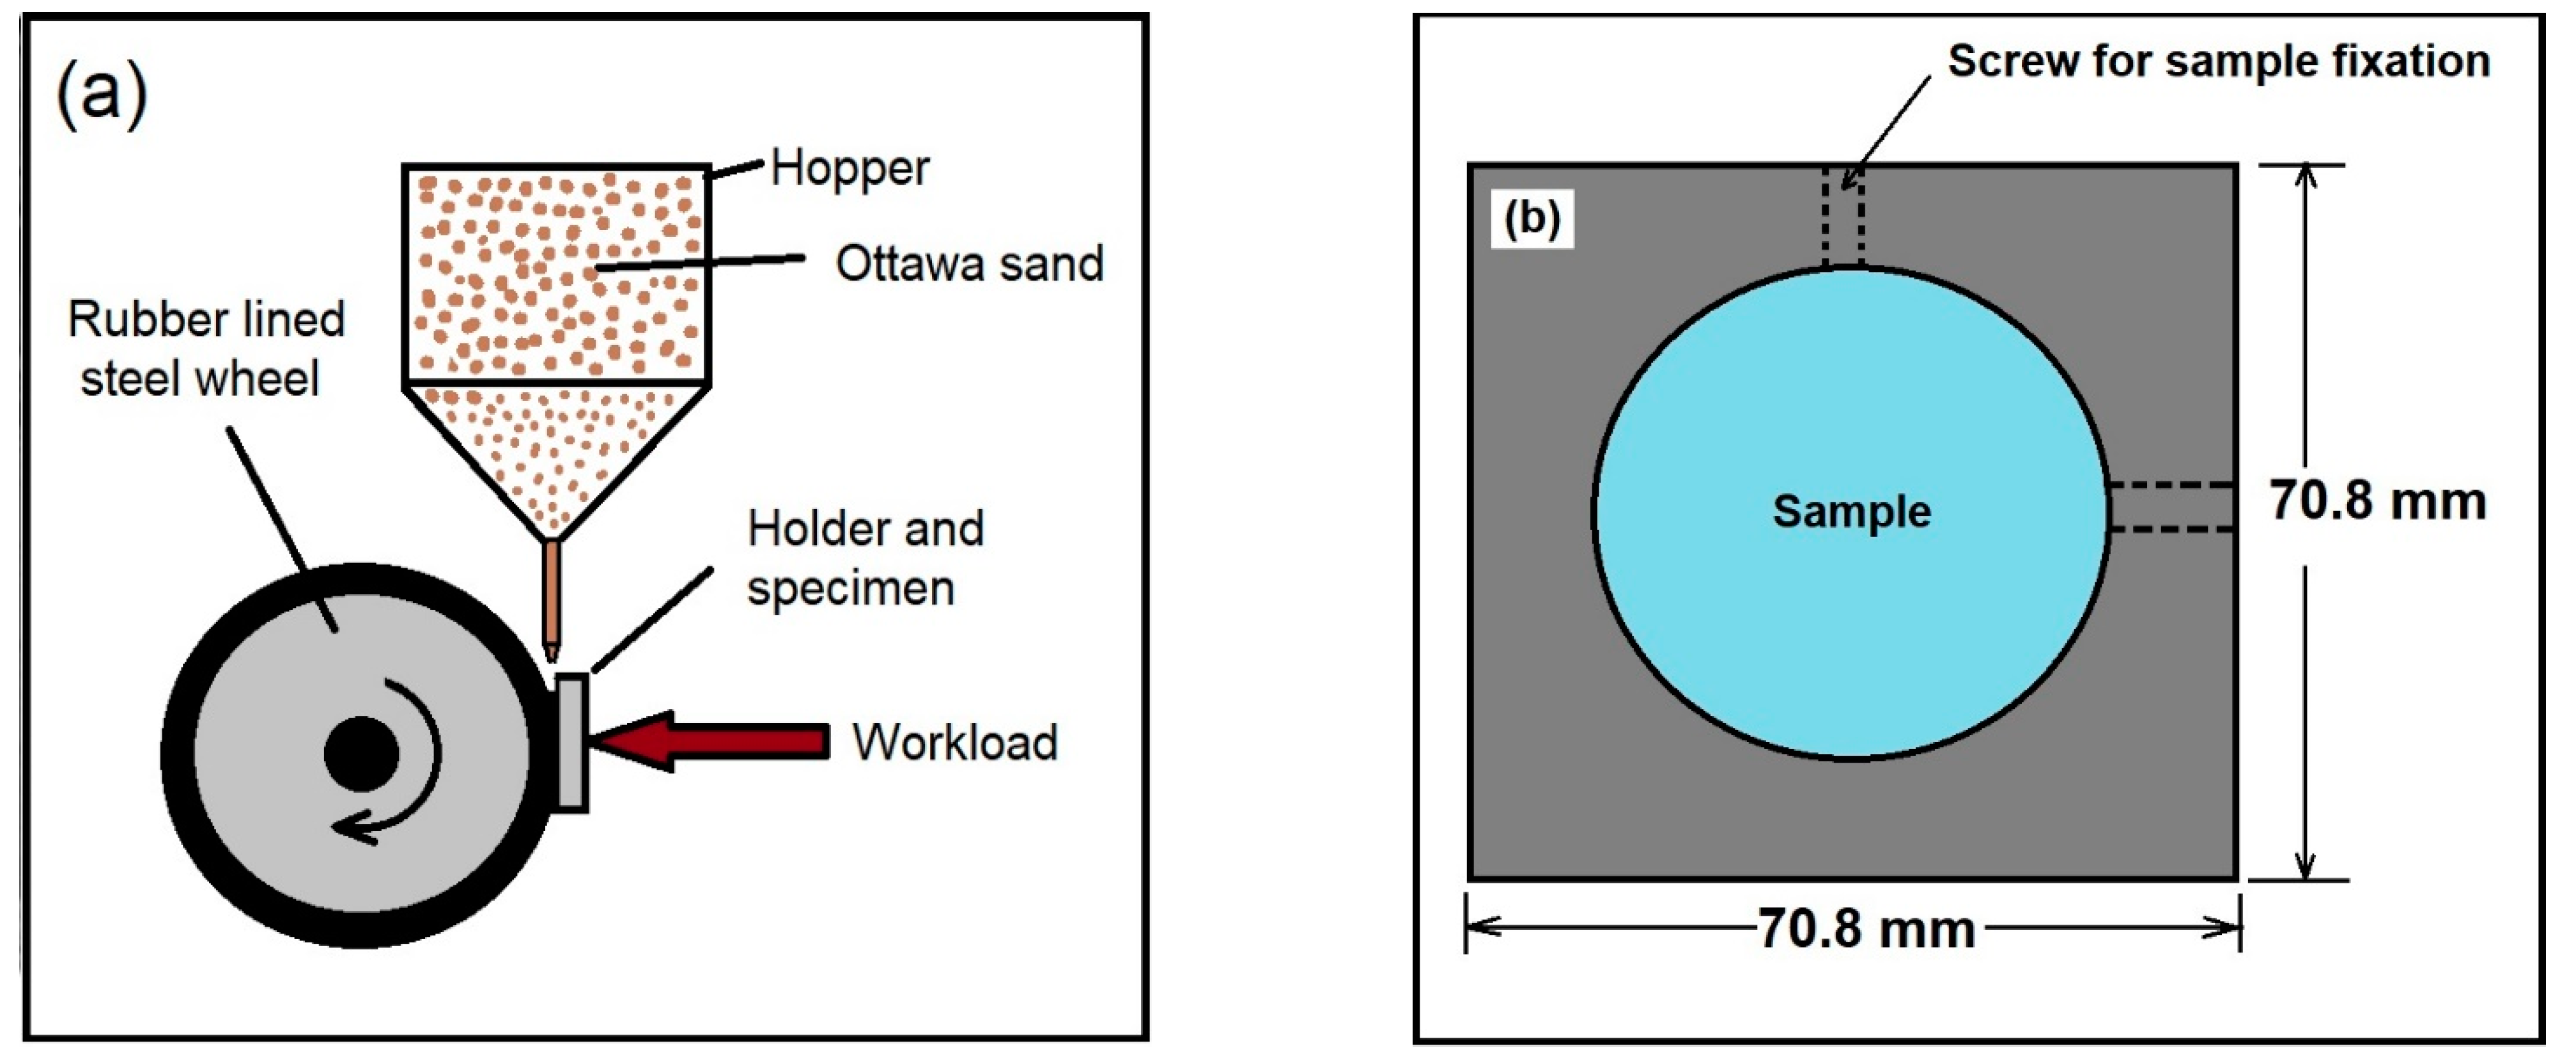
2.3.1. Abrasive Wear Tests

The hardened samples were exposed to the abrasive wear test with the aid of a sand/rubber apparatus by following the methodology established by the ASTM G-65 standard [14]. Figure 1a shows a schematic representation of the sand/rubber apparatus employed during the wear tests. The sample holder was modified to allow the application in cylindrical samples, as shown in Figure 1b.
The weights of the hardened samples were measured before and after the wear tests with the aid of an analytical balance (0.0001 g accuracy). The test conditions were established according to the ASTM G-65 standard for hard coatings and thin films (Procedure C) and are summarized in Table 4.
The morphology of the wear tracks was analyzed by SEM. The wear resistance of the treated samples was evaluated using loss of volume, following the procedure established by the ASTMG-65 [14]:
V l = ( m l / ρ ) × 1000
The wear rate of the borided samples during wear tests was evaluated by Archard’s equation [15]:
W = V l / P d
where Vl is the volume loss during the test (mm3), ml is the mass lost (g), ρ is the density of the test material (g cm−3), W is the wear rate (mm3 N−1 m−1), P is the applied load (N), and d is the sliding distance (m).
The density of the involved materials (r) was calculated according to the equation proposed by Gloker, as follows [16]:
ρ = N A m H / V c
where ρ is the density of corresponding surface (non-treated AISI 4140 steel, carburized samples, nitrided samples, and borided samples, respectively) (g cm−3), N is the coordination number for each crystalline cell, A is the average of the atomic weight of the corresponding elements in each surface treatment, mH is the absolute unit of mass of atomic weight (1.66 × 10⁻²⁴ g), and Vc is the volume of the elementary cell (cm−3). The density values of the corresponding surfaces are depicted in Table 5.
The depth of the wear scars was estimated with the aid of a profilometer Hommel Werke C-8000 with ±0.066 µm accuracy (Técnicas de Medida y Metalografía, S.A., Madrid, Spain).

2.3.2. Pin-on-Disk Tests

The coefficient of friction (CoF) was evaluated by the pin-on-disk technique using a CSM ball-on-disk tribometer (CSM Instruments, Needham, MA, USA). A tungsten carbide (WC) ball 5 mm in diameter was secured to a stationary holder. The samples were attached to a horizontal chuck driven by a variable-speed electric motor. All tests were carried out at a controlled temperature of 20 °C and 50% relative humidity using a constant sliding speed of 0.15 m s−1, a sliding distance of 200 m, and a 5 N perpendicular load applied to the WC ball.

2.4. Importance of the Statistical Analysis

In 2019, Velázquez et al. [17] proposed studying the boride layer growth as a random and stochastic process, achieving model layer growth using Markov chains. Modeling the boride layer growth is helpful as it could optimize the industrial manufacturing processes where different devices and pieces, such as those described in Table 1, are used together as well as the quantity of raw material and energy to create the layer according to the size of the piece. Within this context, the statistical analysis of the thickness and hardness of the carbide, nitride, and boride layers were obtained.

3. Results and Discussion

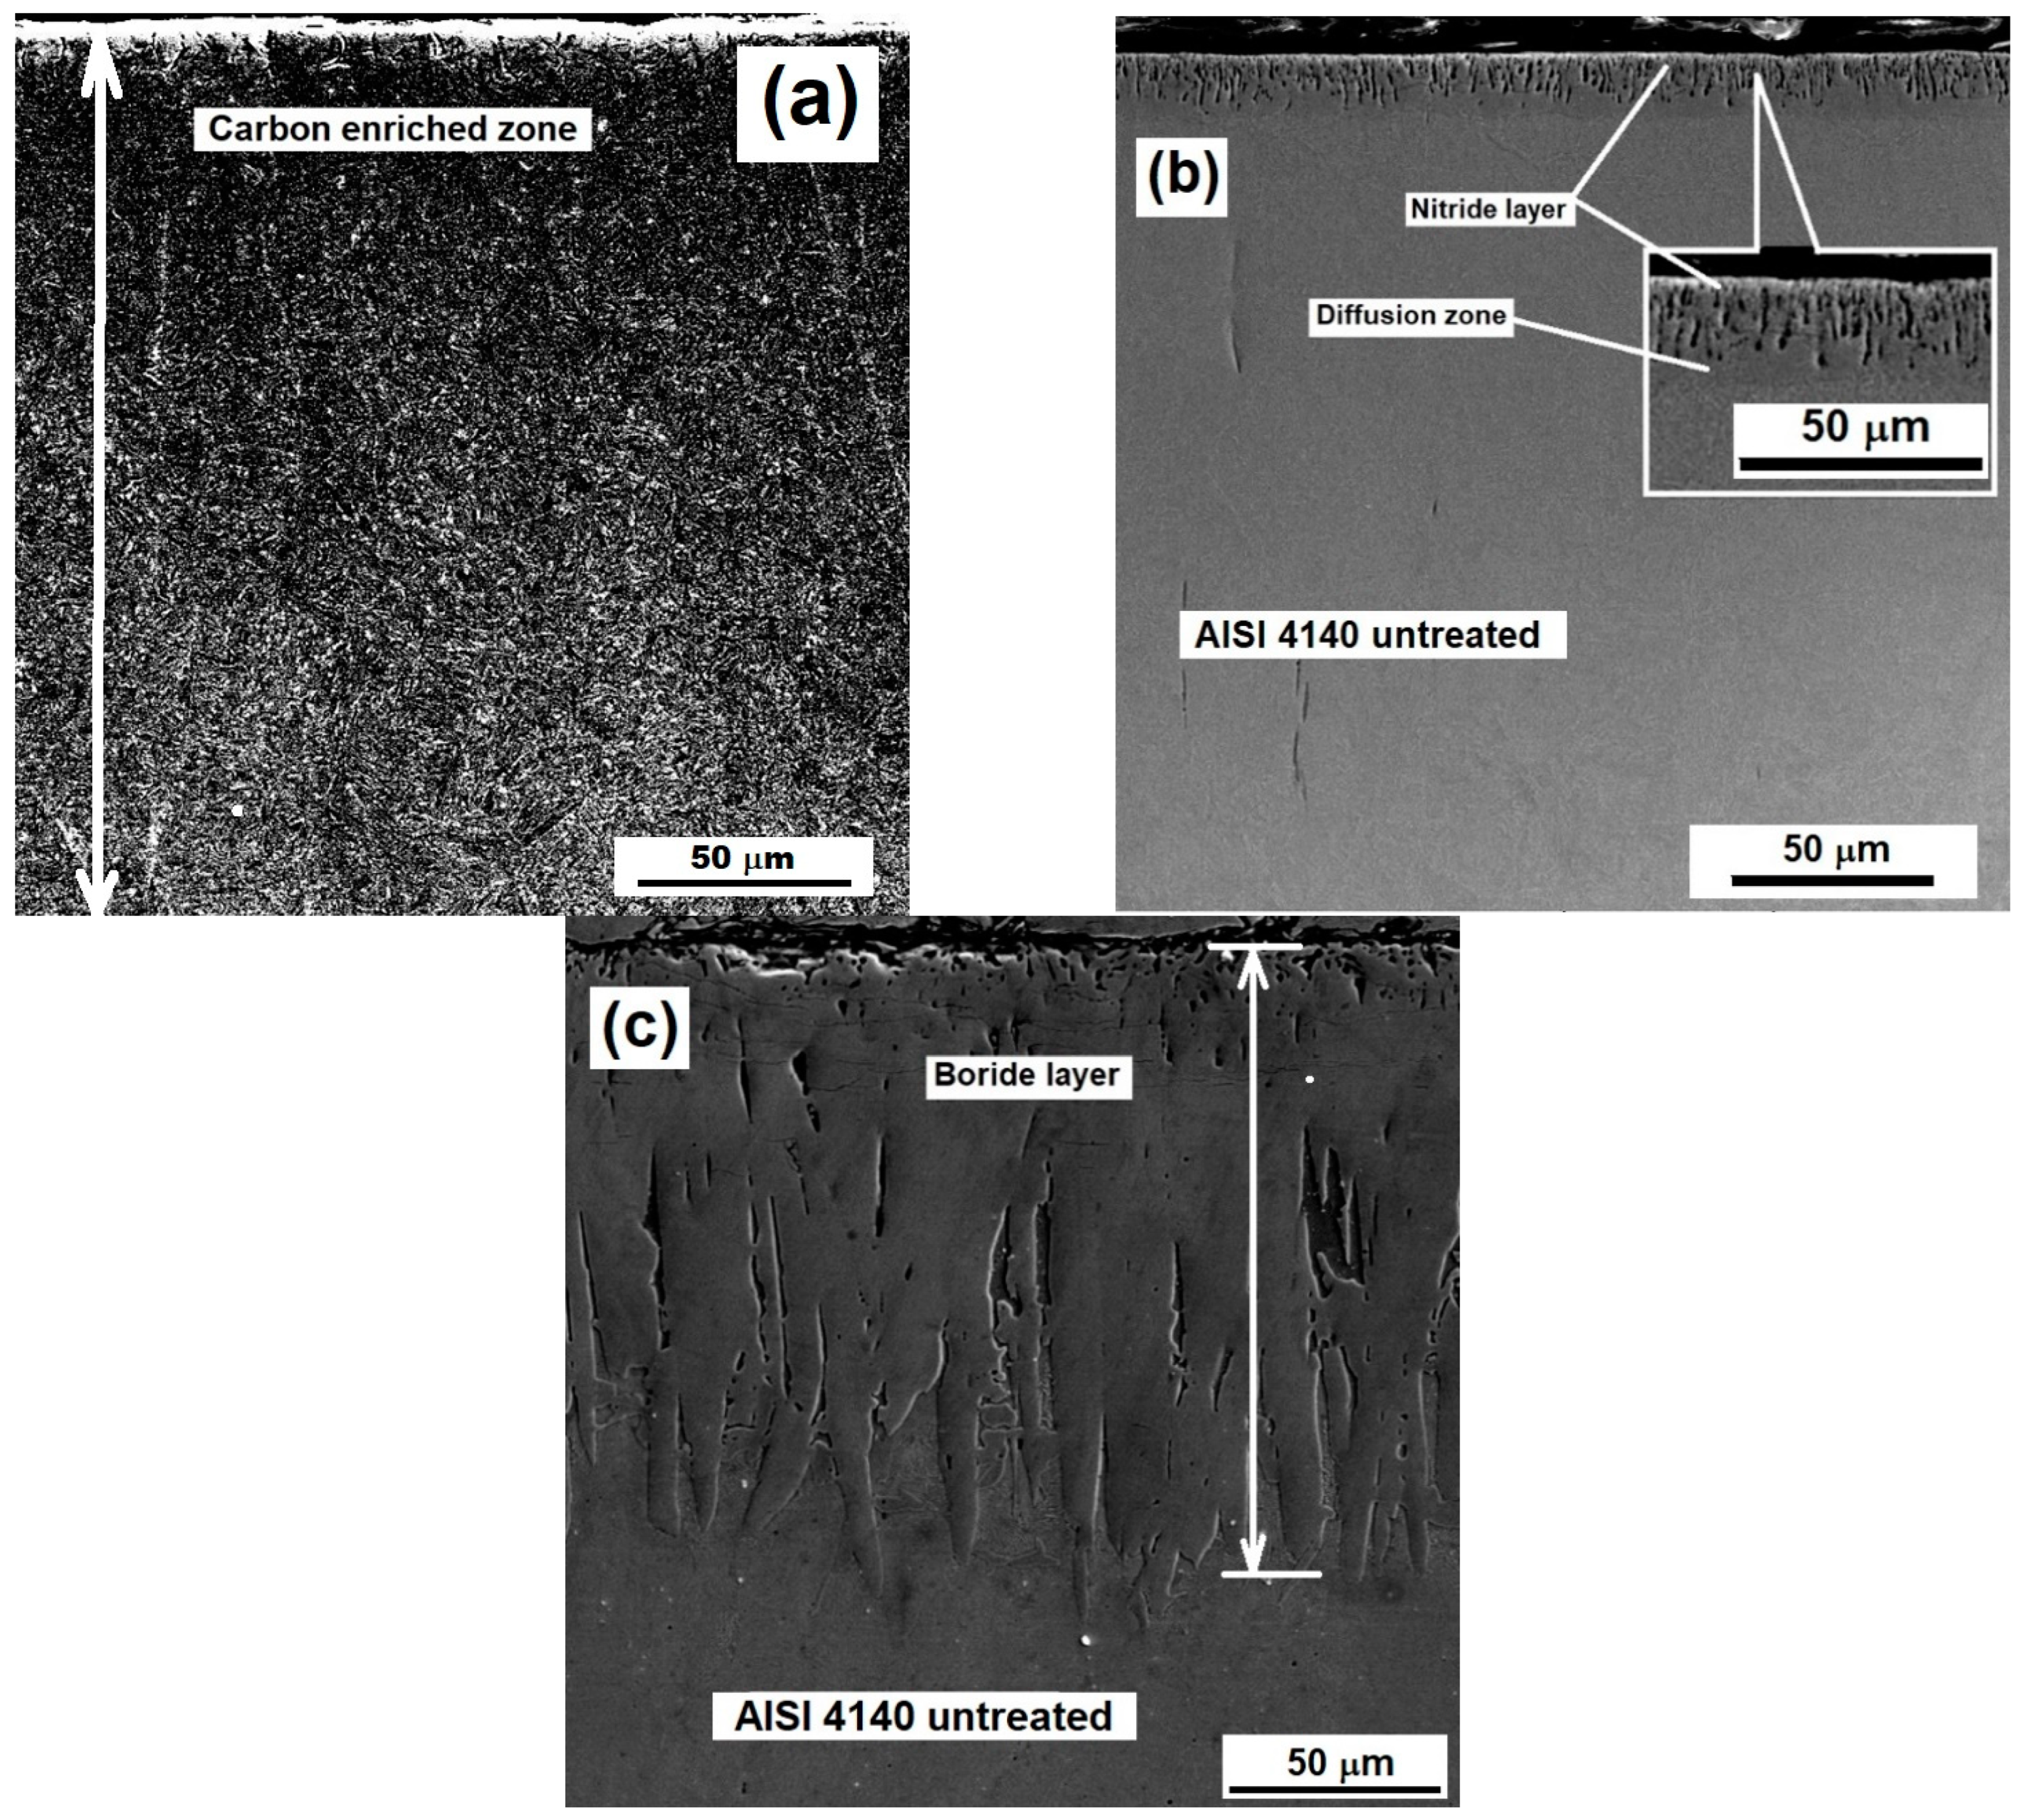
3.1. Surface Characterization

Figure 2 shows SEM images of the cross-section of the surface-hardened samples.
As Compared to the samples exposed to nitriding and boriding (Figure 2b,c, respectively), samples exposed to carburizing (Figure 2a) exhibited a hardened layer much higher than the others (365.6 ± 7.93 µm). The values of the layer’s thicknesses are in agreement with those reported in the literature for each hardening treatment, which means that the processes were applied correctly. The mean values of the thicknesses of the hardened layers are depicted in Table 6.
The differences in thicknesses of the different treatments were attributed to the affinity of iron to the diffused elements. For example, the solubility of carbon in iron was about 6.5% w., while the boron and nitrogen solubility in iron was about 1.0% w. and 0.2% w., respectively [18]. The low solubility of boron and nitrogen in iron, as compared to that of carbon, resulted in lower layer thicknesses (see Table 6).

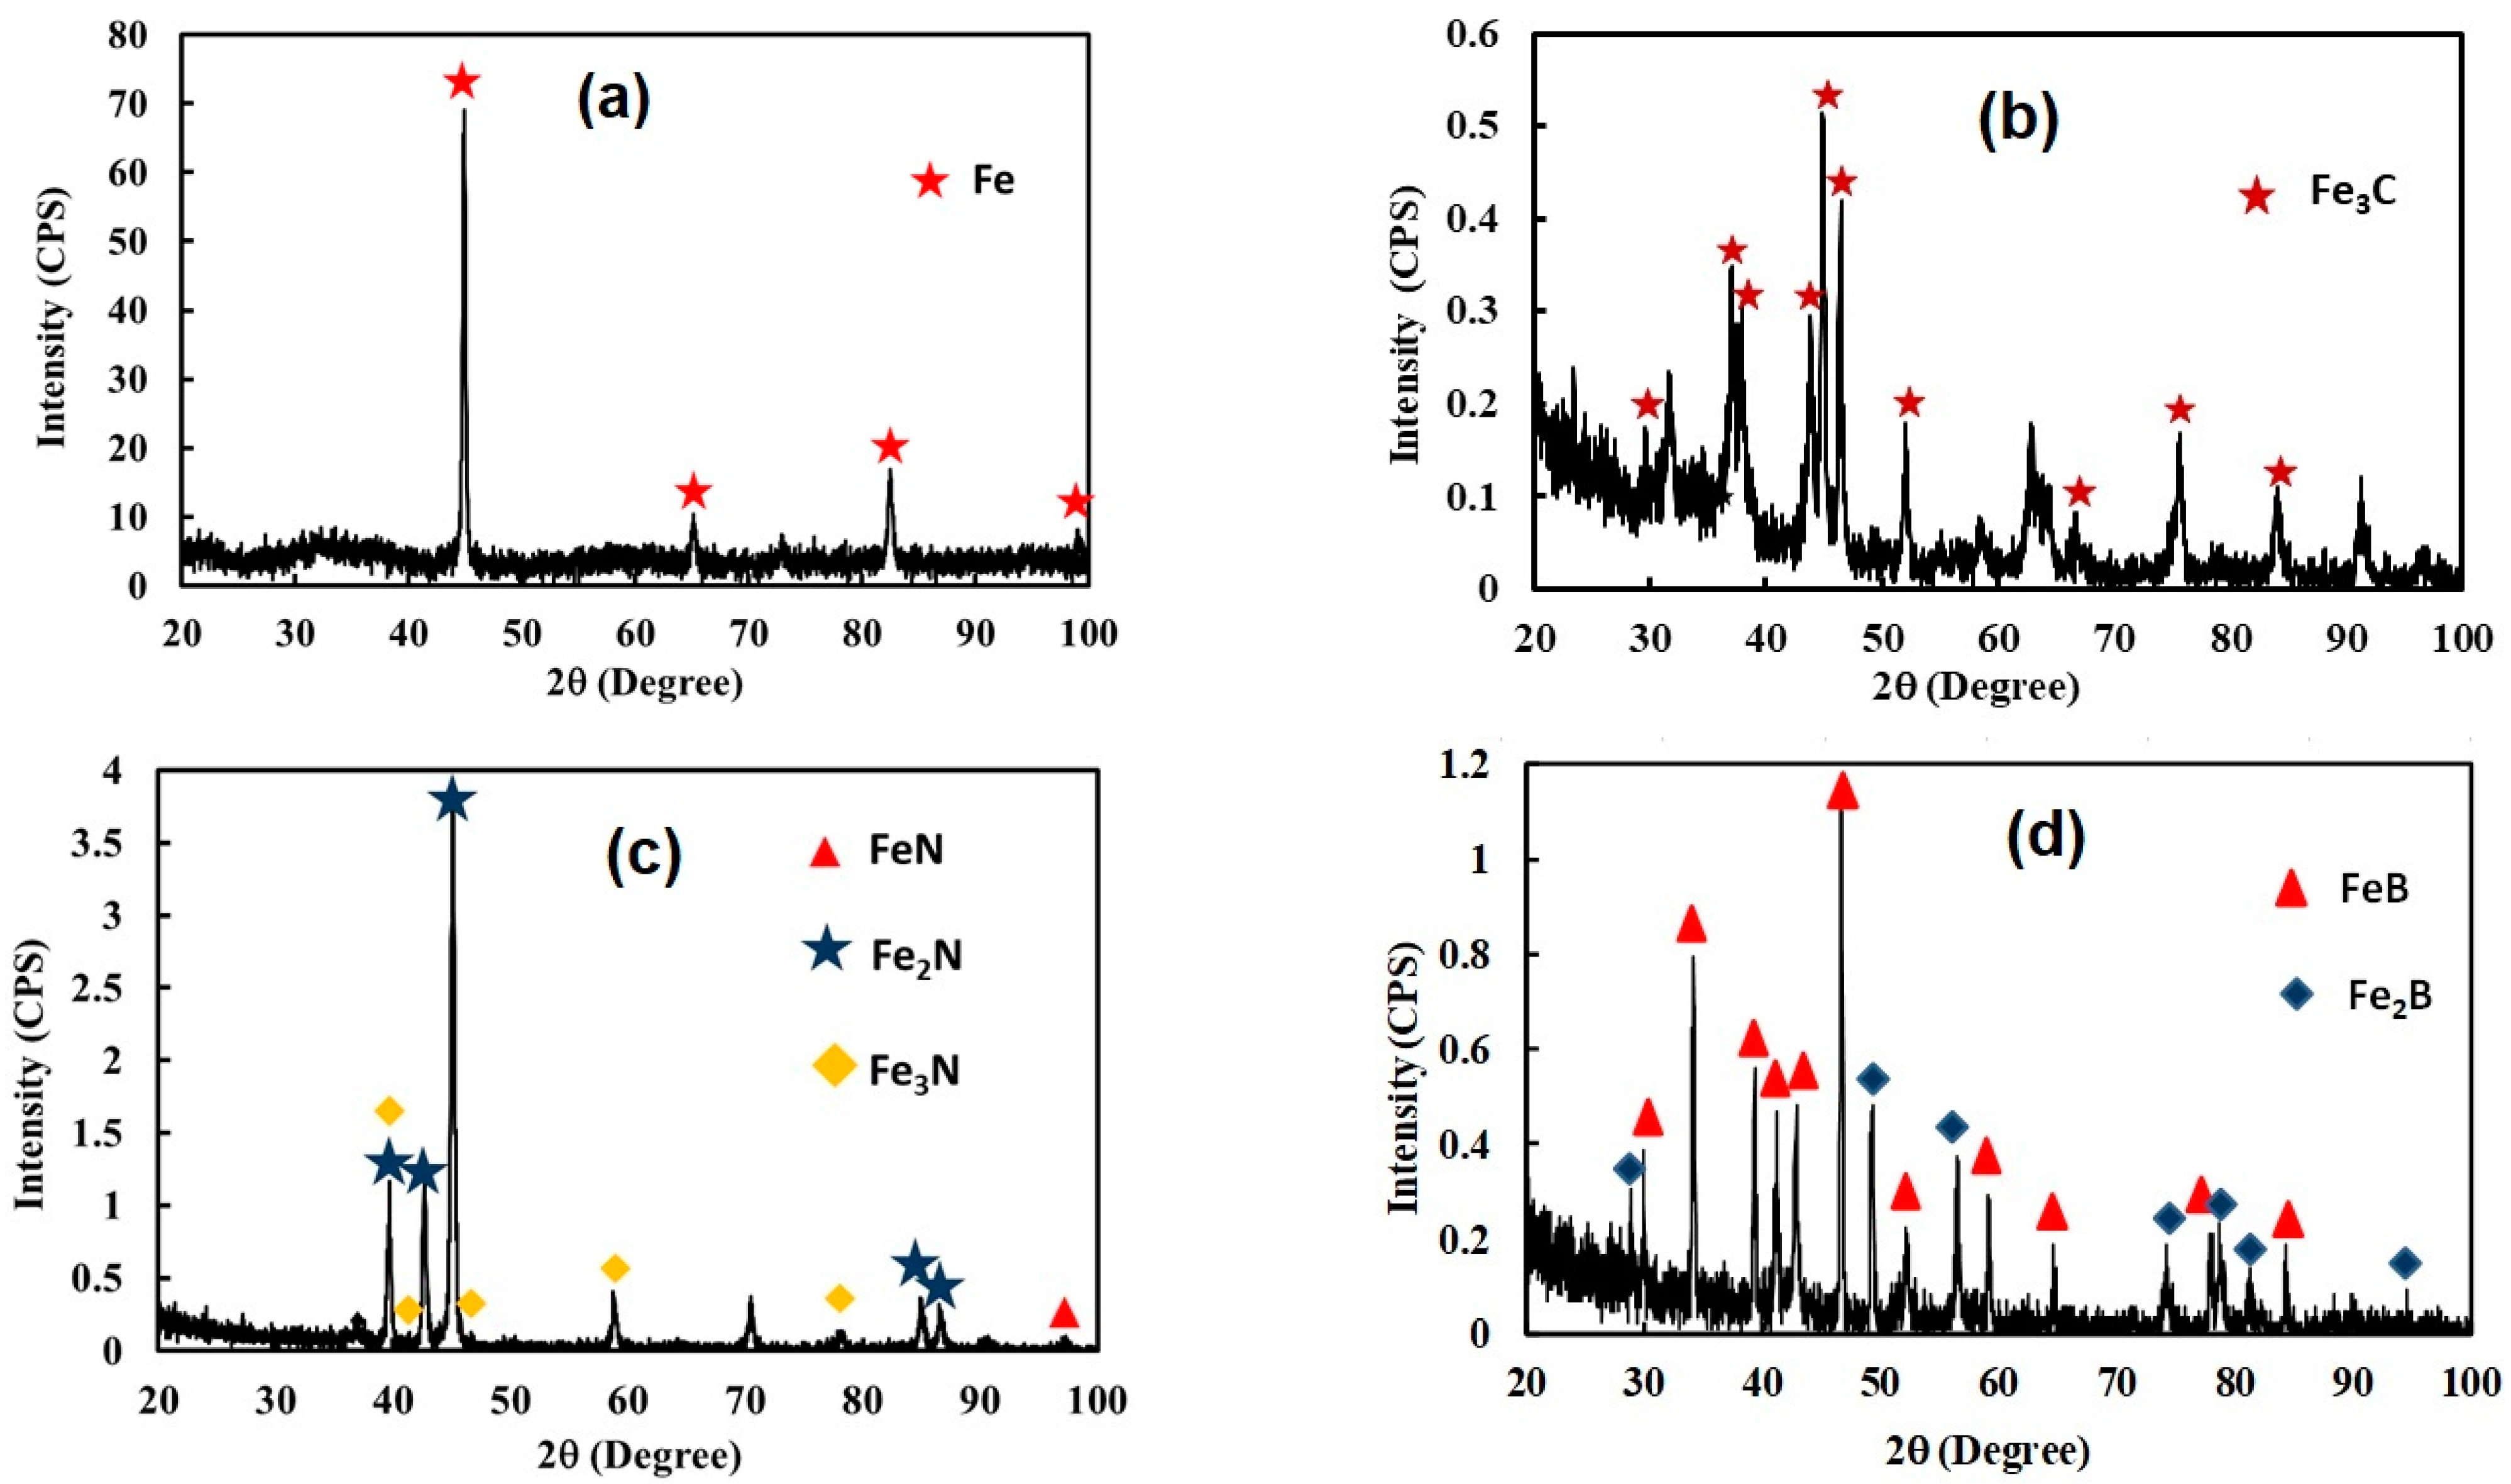
3.2. X-ray Diffraction Analysis

Figure 3 shows the diffraction patterns of the samples exposed to the different hardening processes.
By the optical and SEM analysis, it was possible to observe that, after the different surface-hardened treatments, the samples were totally covered by hard layers (see Figure 2). The XRD analysis shows Fe3C with the orthorhombic crystalline structure for carburizing; FeN, Fe2N, and Fe3N (cubic and hexagonal) in the case of nitriding; and a biphasic layer of FeB/Fe2B with orthorhombic and tetragonal crystalline structures in the case of samples exposed to boriding [16].
The XRD patterns were compared with data cards 98-002-9341 for Fe3C (carburized samples), 98-004-1258, 98-002-0390, and 98-002-4650 for FeN, Fe2N, and Fe3N, respectively (nitrided samples), and 00-036-1332 and 00-032-0463, which represent the XRD patterns of Fe2B, FeB, respectively (borided samples). In the XRD pattern of the carburized samples (Figure 3b), strong picks indicated the presence of Fe3C (i.e., cementite), which was the hardest phase of the carbon–iron alloy. The presence of that phase at the surface of the AISI 4140 steel indicated the apparent effect of the carburizing process on the chemical composition of the treated steel. Likewise, the XRD pattern of the nitrided sample (Figure 3c) showed strong picks along the 2θ scale, indicating the presence of FeN, Fe2N, and Fe3N. The presence of these compounds at the surface of the AISI 4140 indicated the apparent influence of the nitriding process on the chemical composition of the steel. Finally, in the XRD pattern of the sample exposed to boriding (Figure 3d), we observed strong picks that indicated not only the presence of the Fe2B phase, but also the presence of FeB at the surface of the AISI 4140 steel. As was expected, the untreated sample only shows the presence of iron, which is the element with the main content in the AISI 4140 steel (Figure 3a).
The results achieved from the XRD analysis corroborated the results obtained from the mechanical characterization since the surface hardness of the treated samples had increased significantly (see Table 7), as compared to the substrate hardness.

3.3. Mechanical Characterization

The hardness values achieved by the different hardening processes are depicted in Table 7.
The hardness values of the layers resulting from the different surface-hardening processes were concordant with those reported in the literature [12,19,20,21,22,23]. As observed (Table 7), boriding resulted in the highest hardness value compared to the other surface-hardening processes. However, these results should not be interpreted to mean that boriding is universally the best option. The best choice will depend on the requirements for a specific application. For example, the best option could be the boride layers in those applications where a hard coating is required to avoid wear between two surfaces in contact and relative movement. Nevertheless, in those applications where a hard surface is required but will be exposed to impact, boride layers would not be recommended due to their brittleness and their high gradient of hardness from the surface to the substrate; in that case, a surface with a progressive ramp of hardness, such as nitrided or carburized, would be recommended [24]. On the other hand, the elastic modulus showed the same behavior as hardness, except in the case of the nitrided sample, where the elastic modulus value was lower than that achieved for the untreated sample (129.86 ± 13.95 and 198.25 ± 2.31, respectively). An explanation for this apparent contradictory behavior is given by C. Thomas et al. [25], where the elastic modulus depends on the distance from the surface. They founded that, for intrude layers, the lowest values of the elastic modulus are achieved near the surface (≈5 µm). Then, the values increase and finally, the highest values are achieved when the untreated material is evaluated. Probably the behavior of the elastic modulus obeys to the anisotropic nature of the nitride layer [25].

3.4. Tribological Tests
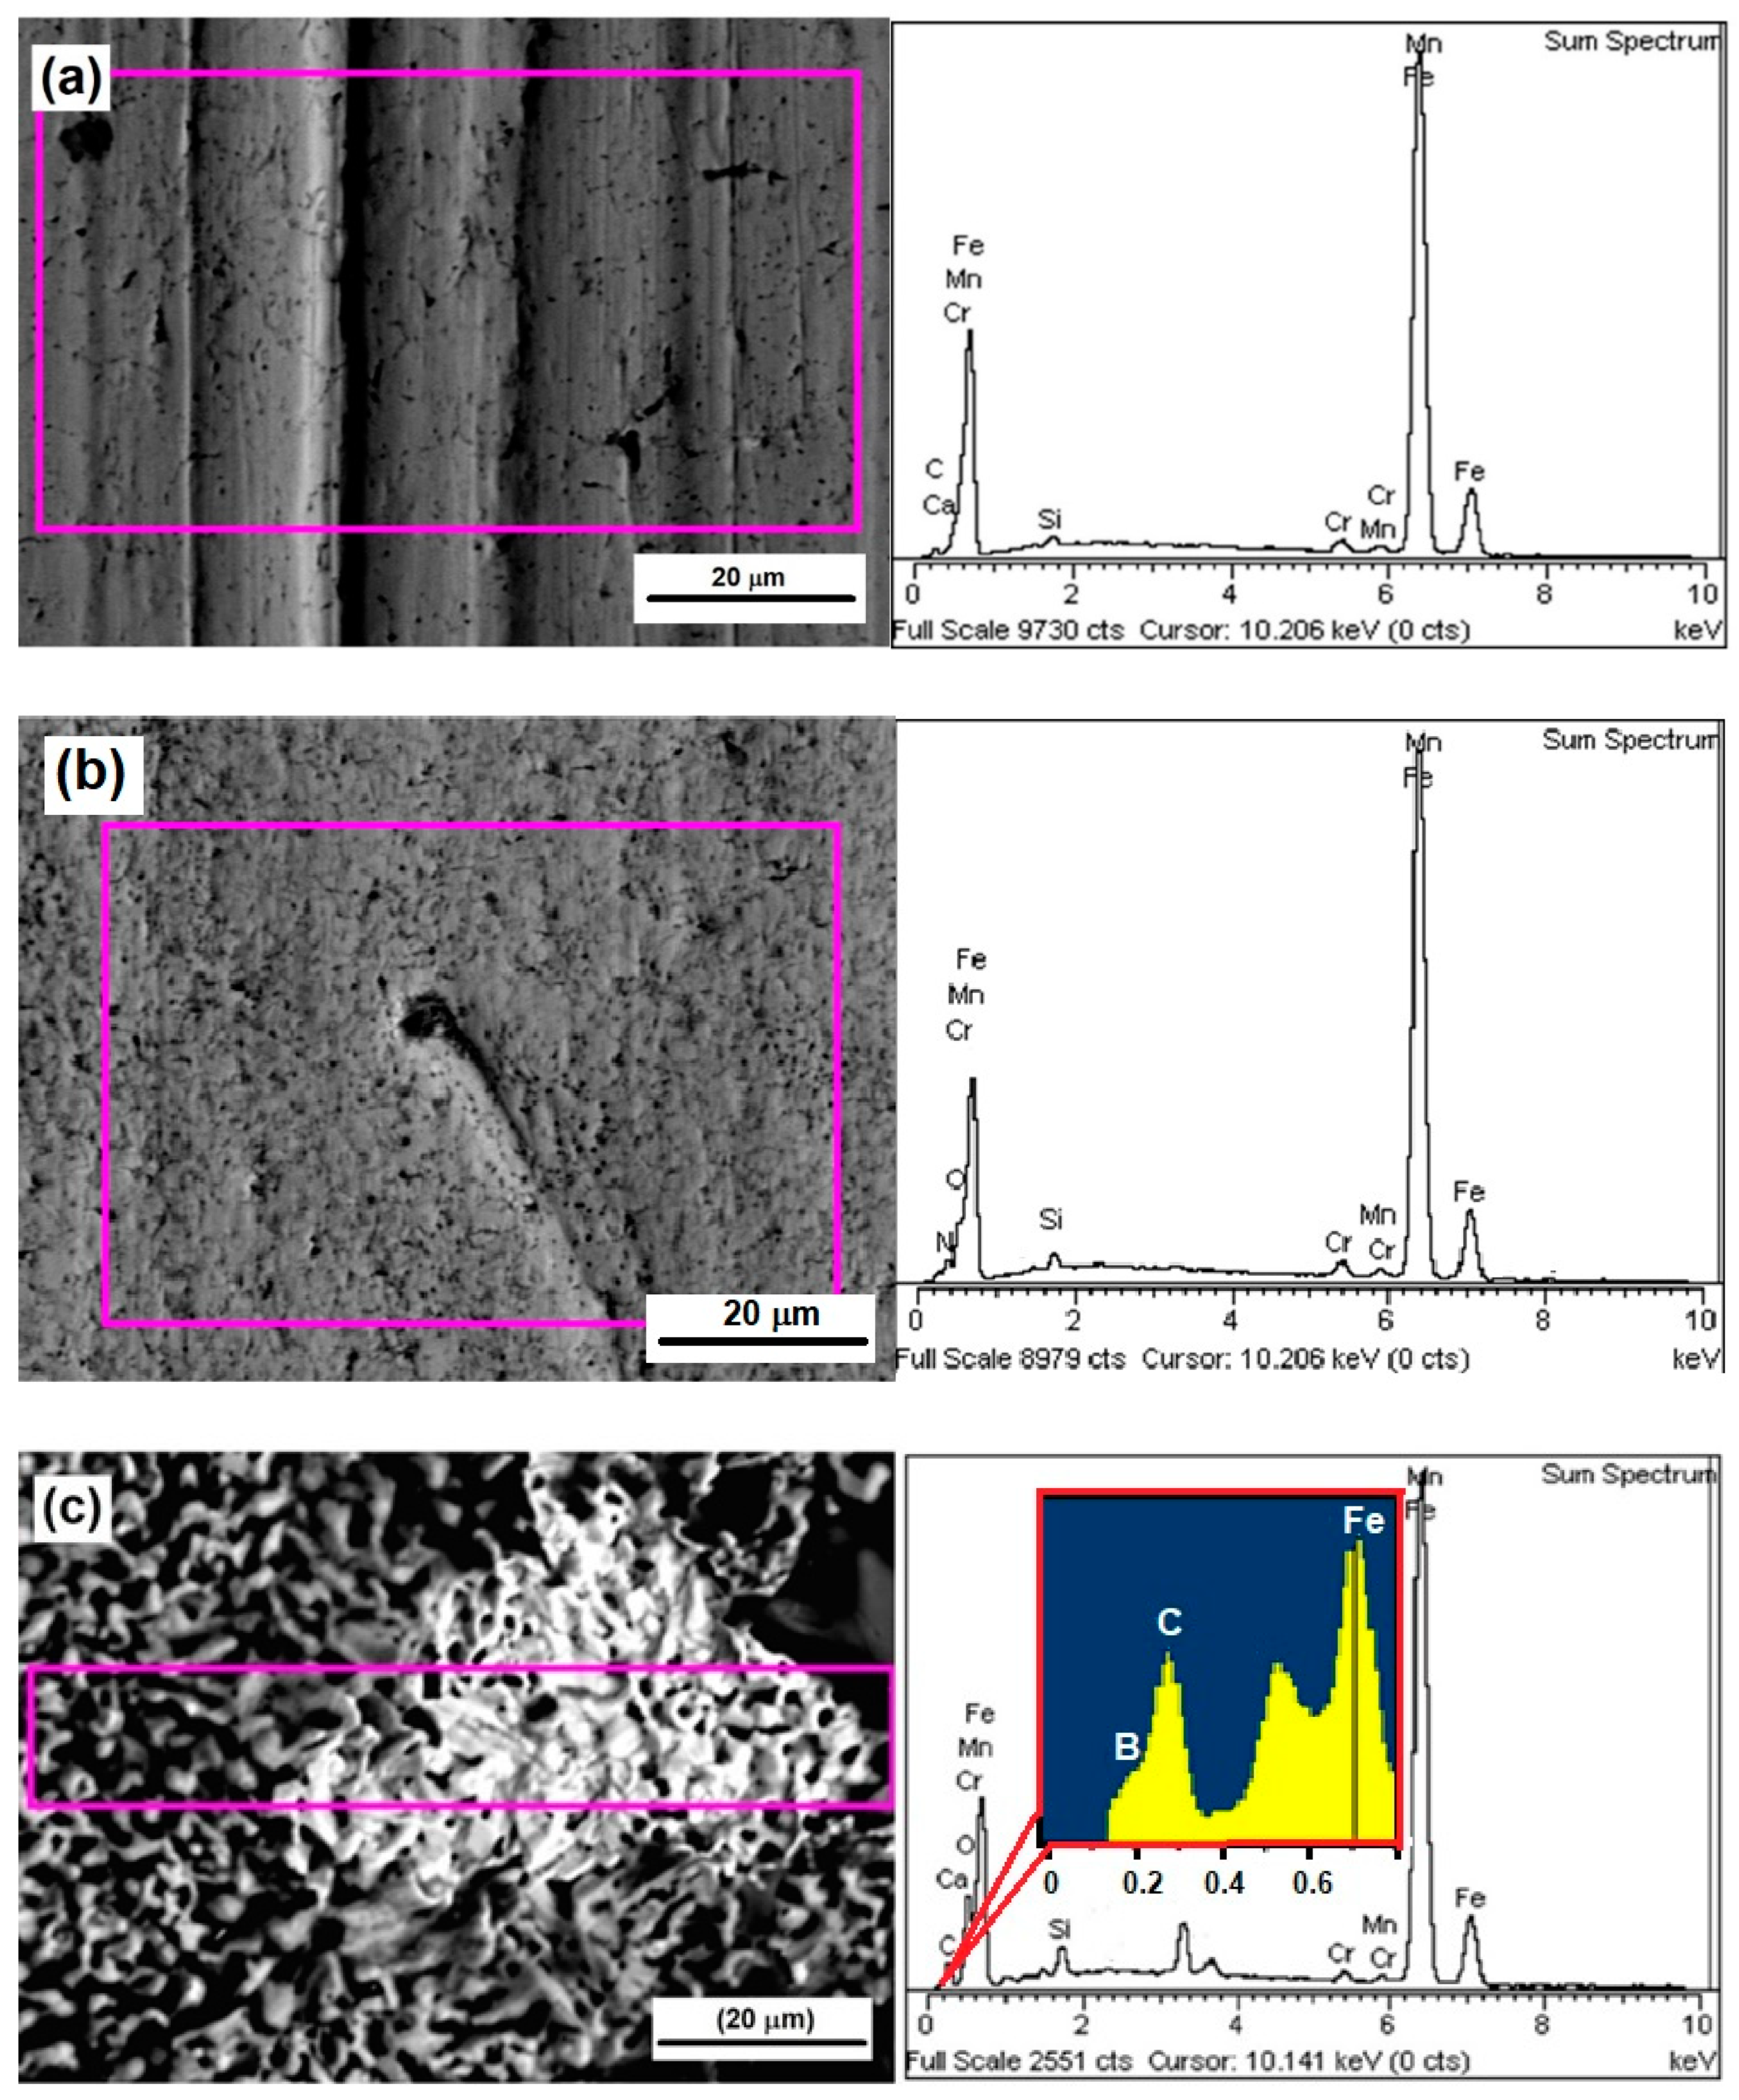
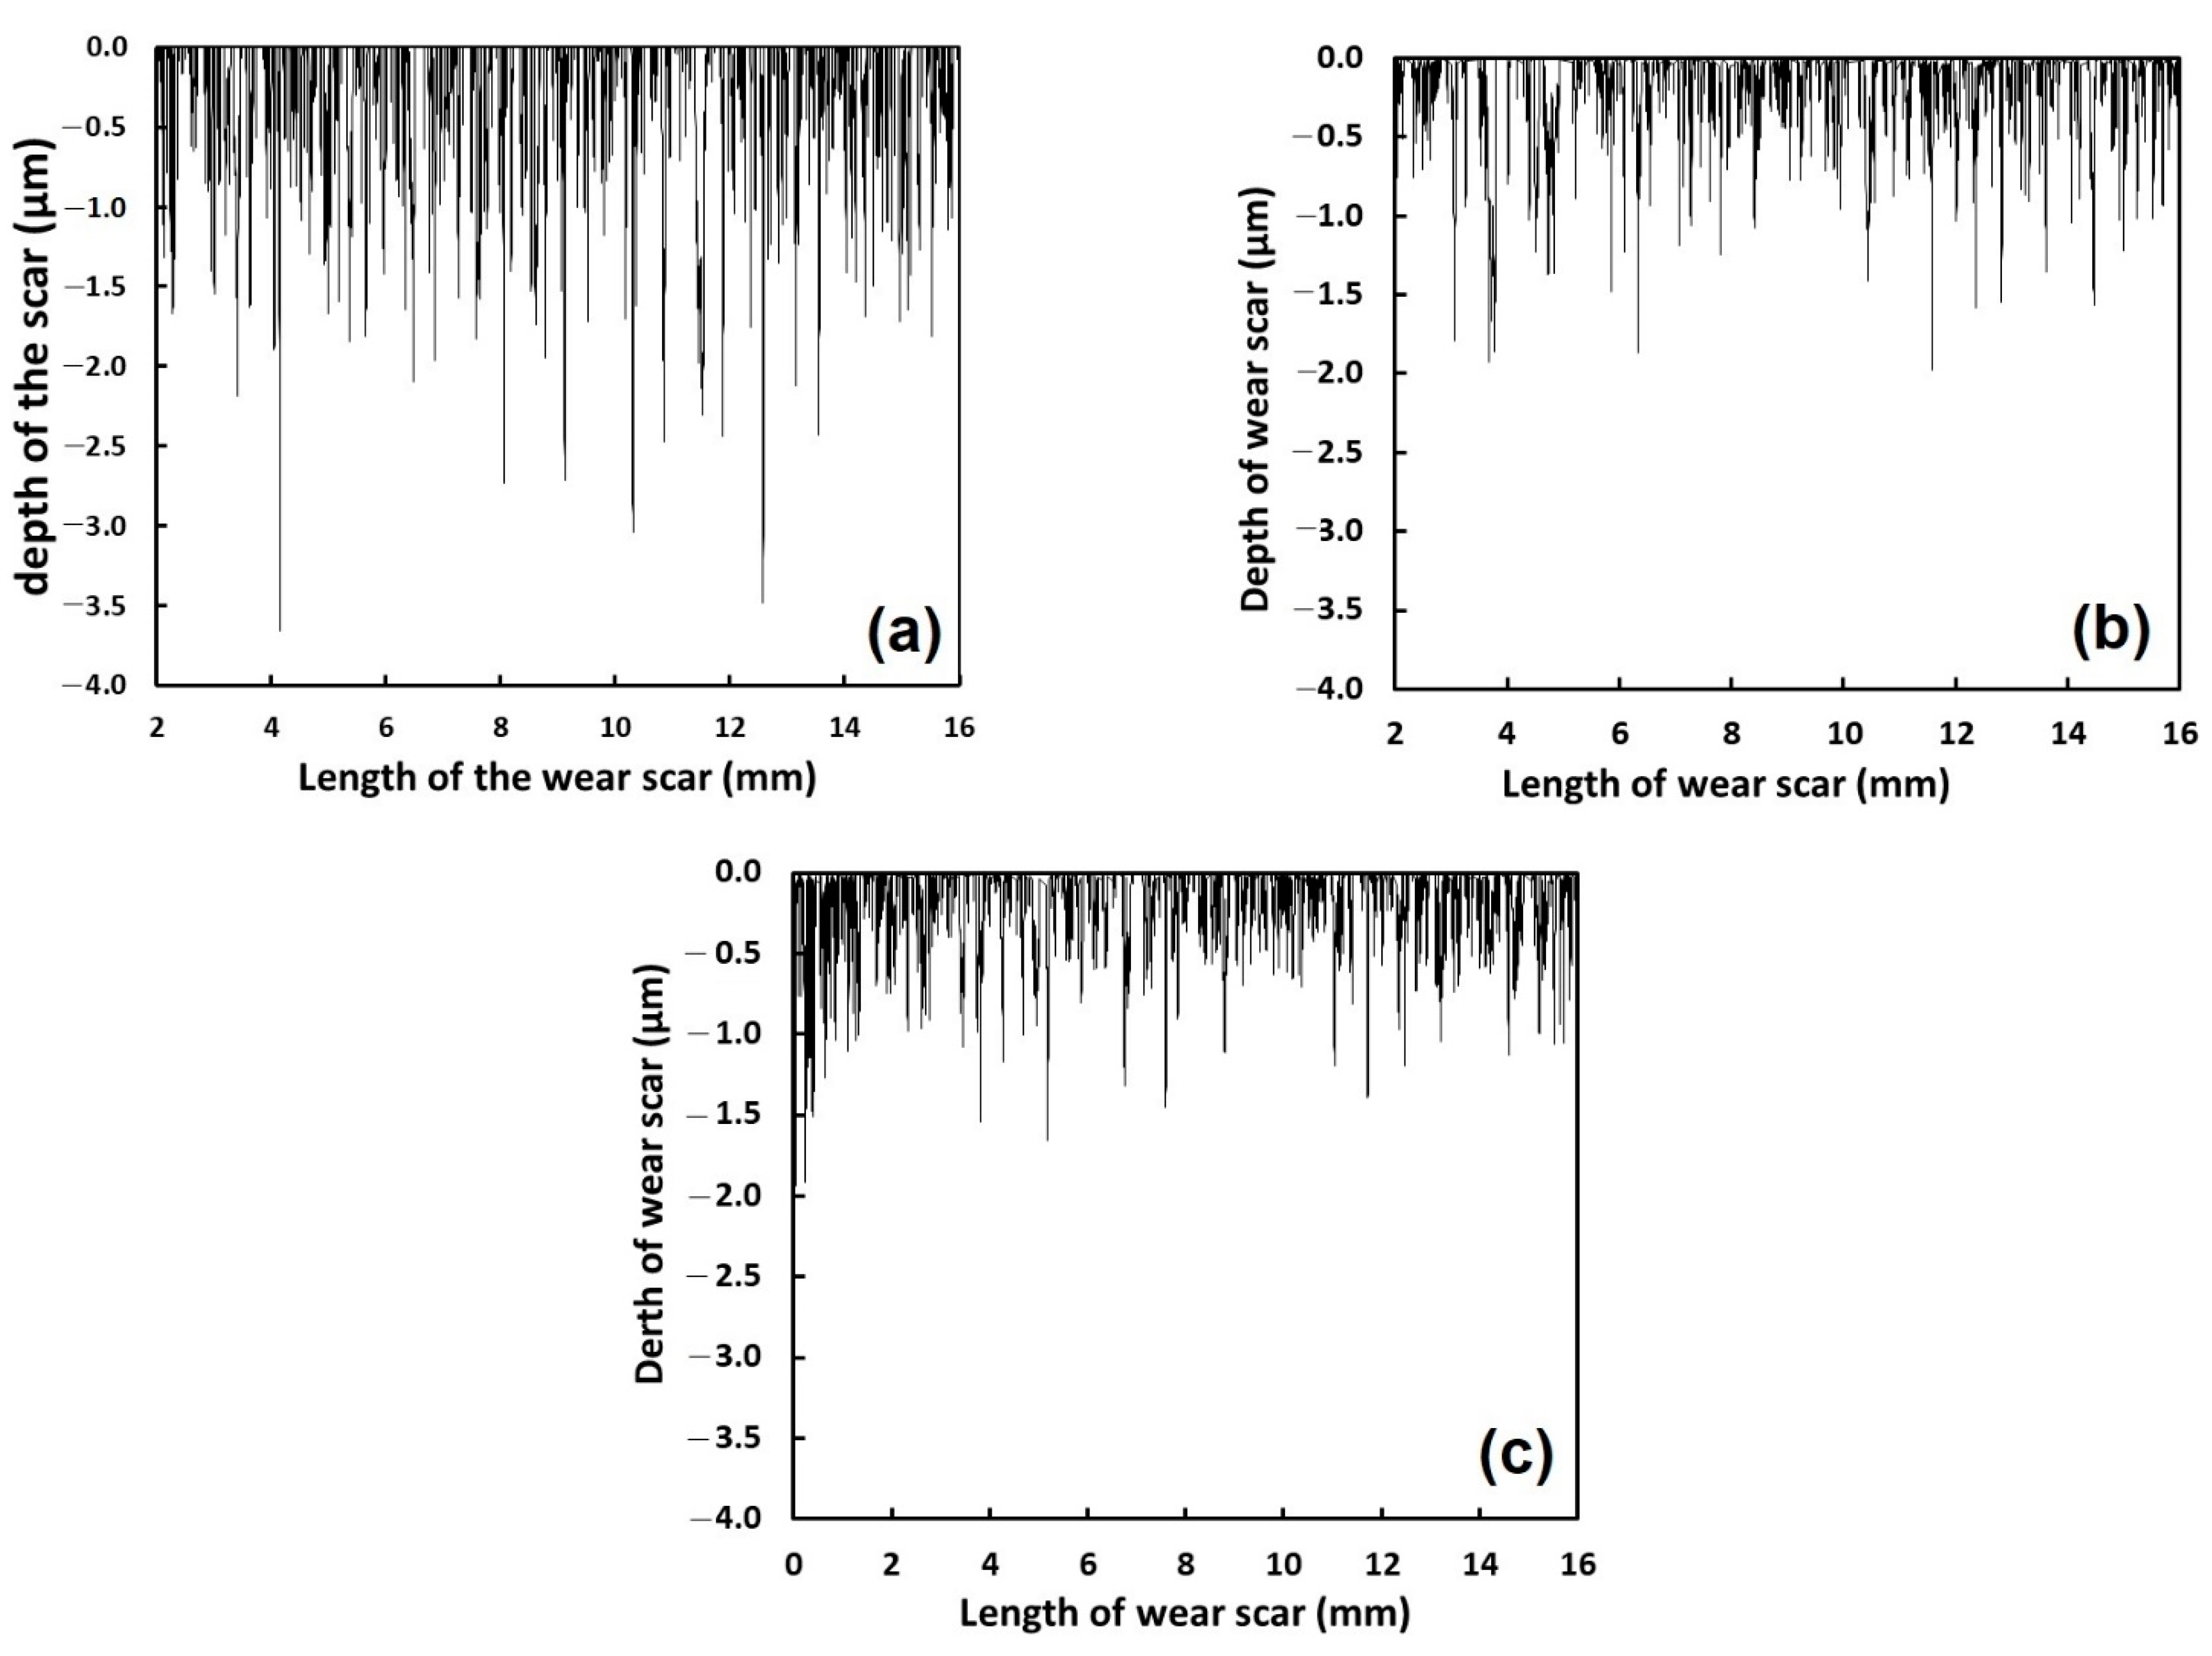
3.4.1. Wear Tests

The results of mass and volume losses are summarized in Table 8. As was expected, the untreated samples were those with the highest volume loss. The sample exposed to carburizing had the highest volume loss, while the sample exposed to boriding exhibited the lowest volume loss of the treated samples. This behavior agreed with that observed for the hardness values (Table 7), where samples exposed to carburizing were those with the lowest hardness values. According to the results, wear resistance was assumed to be directly related to the hardness of the material, which is the primary condition to reduce wear.
The tribological behavior of the material was a result of the hardness of the different conditions of treatment. Boriding provided the highest hardness values in the range of 1600–2000 HV to the treated materials and carburizing afforded hardness values in the range of 500–620 HV; the wear resistance was directly related to hardness [16,26].
Figure 4 shows the scars of the wear tests of the different surface-hardening processes. The carburized sample (Figure 4a) exhibited the most significant damage, while the borided sample (Figure 4c) exhibited the lowest damage during the wear tests.
The main reason for the low damage observed in the borided sample was attributed to it possessing the highest hardness values, as compared to the other hardening processes. Additionally, according to Erdemir et al. [27] and Hernández et al. [28], the boride layer could have reacted with the moisture of the environment to form a thin film of boric acid (H3BO3), which could act as a solid lubricant inhibiting the wear of the surface. Likewise, the scars of wear were aligned to the movement of the rubber wheel, which indicated a controlled process.
Different signs of wear can be seen in Figure 4. In the case of carburizing (Figure 4b), the sample exhibited the most significant damage as a function of the wear scar. The signs present during testing were micro-cracking, micro-plowing, micro-fatigue, and micro-cutting. However, micro-plowing and micro-cracking appeared to be the signs exhibited with the most frequency; therefore, micro-plowing and micro-cracking may be the precursors for wear in the carburized samples.
In the nitrided samples (Figure 4c), micro-cracking, micro-plowing, micro-fatigue, and micro-cutting were all observed. These wear signs are typically present when hard layers are exposed to wear due to the interaction between the surface of the sample and the wear agent.
Finally, the borided samples exhibited a scar covered by a surface film that acted as a solid lubricant (Figure 4d), and only small micro-cracking could be detected. This behavior was attributed to the reaction of the boriding layer to the moisture in the environment to form boric acid (H3BO3), which acts as a solid lubricant and can inhibit wear [27,28].
The EDS analysis of the wear tracks of the three hardened surfaces is shown in Figure 5. The carburized, nitrided, and borided samples show the presence of Fe, Cr, Mn, Si, and O. The first four elements are present in the steel alloy, but the presence of oxygen suggests the formation of oxides that could have contributed to the wear of the surface. However, the Si present in the EDS analysis reflected a higher content than that reported in the steel alloy. That result was likely due to the chemical composition of the abrasive agent used during the wear tests.
The depth of the wear tracks shown in Figure 6 were estimated by a mechanic profilometer.
The depths of the wear scars presented in Figure 6 were concordant to the volume loss results, as the samples with the highest volume lost (i.e., the carburized samples) were also the samples with the most increased depth of the wear scar. The depth of the wear scars was lower than the layer thickness in all the samples (see Table 6). This condition indicated that the hard layer remained functional even after the wear tests under all treatment conditions. The density of the material to determine the volume lost should be those obtained by Equation (3), which are depicted in Table 5.

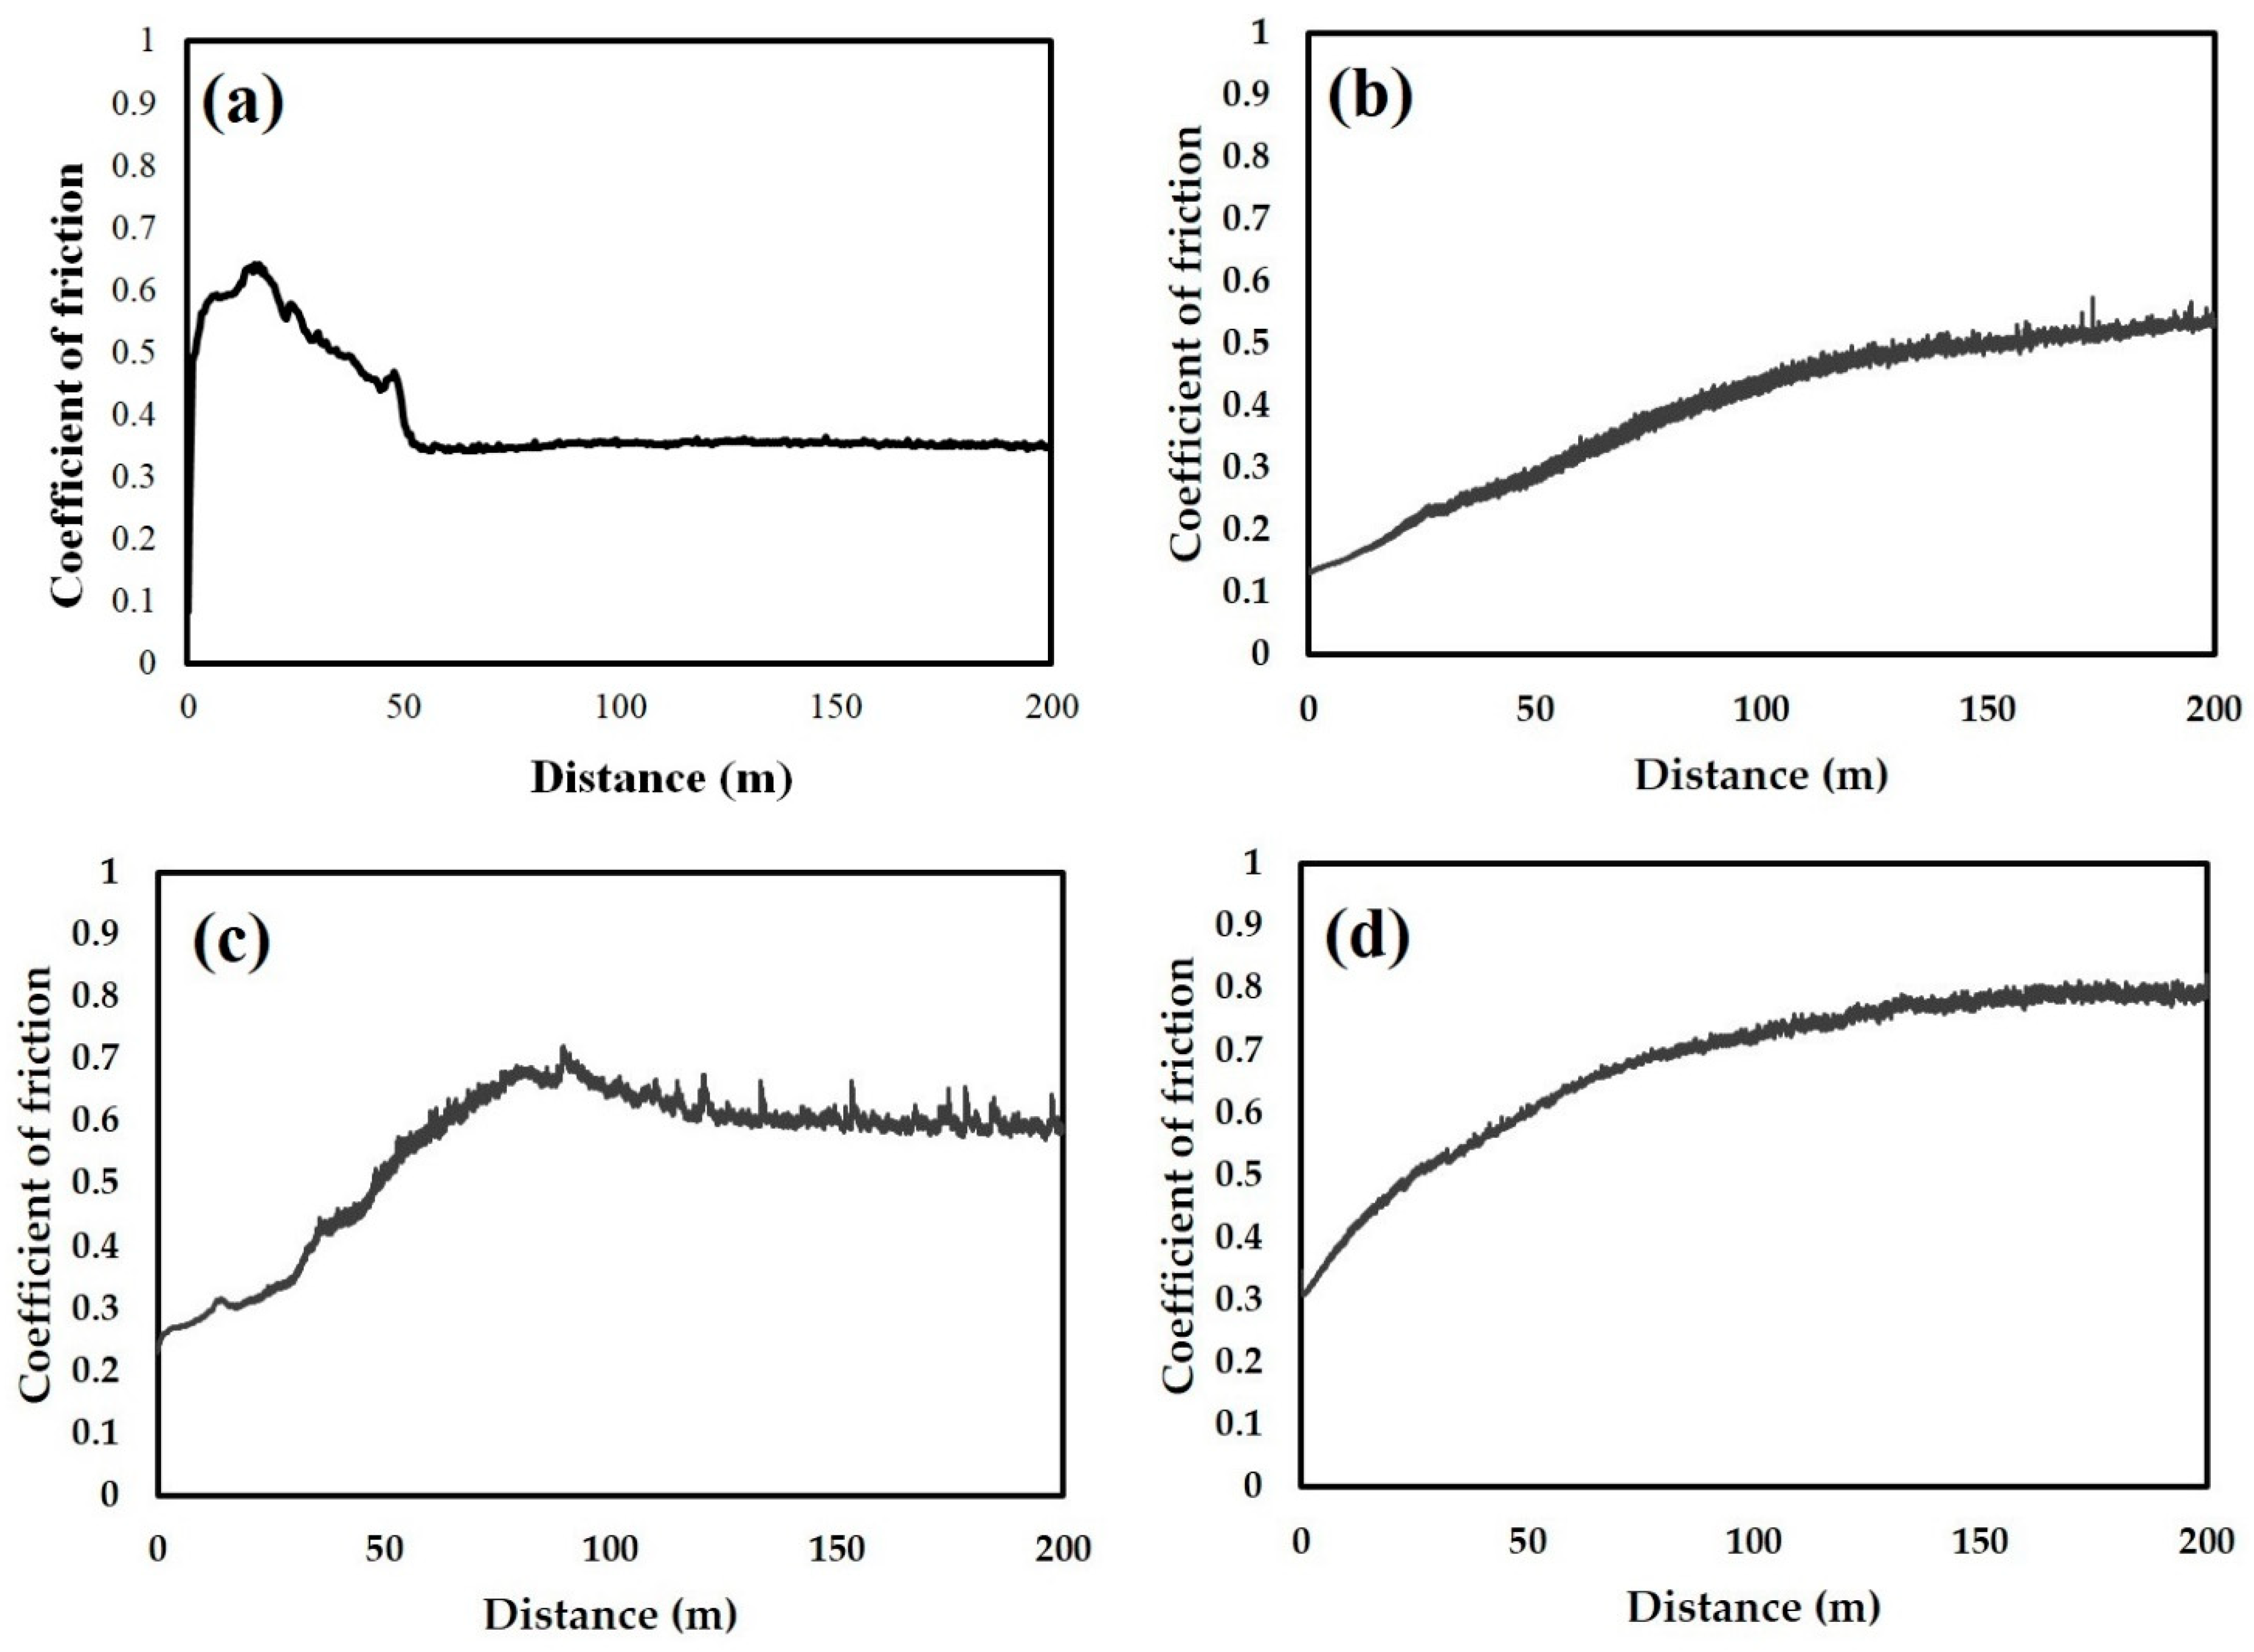
3.4.2. Pin-on-Disk Tests

The results of the pin-on-disk tests applied to the different hardened-surface processes are presented in Figure 7.
As observed in Figure 7, the mean values of CoF of the hardened surfaces were 0.39, 0.55, and 0.65 for carburized, nitrided, and borided samples, respectively, while the CoF of the untreated sample was 0.4.
Interestingly, the samples with the lowest CoF were those exposed to carburizing even though they had the highest surface damage during wear tests. This apparently contradictory behavior was attributed to the low hardness of the carburized surface, as compared to the others. When the carburized surface was in contact with the hard WC ball counterpart, it experienced plastic deformation, which resulted from the low resistance to shear of the carburized surface. It led to a low friction coefficient, as shown in in Figure 7 [20]. Furthermore, the differences in hardness between the three surface-hardening processes also reflected differences in the layers’ CoF. The same behavior can be observed in the untreated sample, where the achieved CoF was close to that of the sample exposed to the carburized sample. Some differences can be observed, especially in the CoF values, compared to those reported in the literature. For example, Mustafa Ulutan et al. [12] reported different values of CoF for the boriding and carburized AISI 4140 steel. However, they applied a different technique and a different material as counterpart (silicon carbide abrasive paper).
On the other hand, Saduman Sen et al. [29] evaluated the tribological properties of oxidized boride coatings on the same steel. Again, they reported different values of CoF. The reason for the differences in the values of CoF can be explained because they evaluated the CoF using the treated material as a flat pin and the counterpart was a disk of 440C stainless steel. The main difference in values of CoF can be explained because the CoF is a result of the interaction between two surfaces with relative movement.
The present study evaluated the CoF by the pin-on-disk tests using a tungsten carbide ball as a counterpart. Thus, the differences in technique and counterpart materials result in different values of CoF, even when the evaluated material was the same.

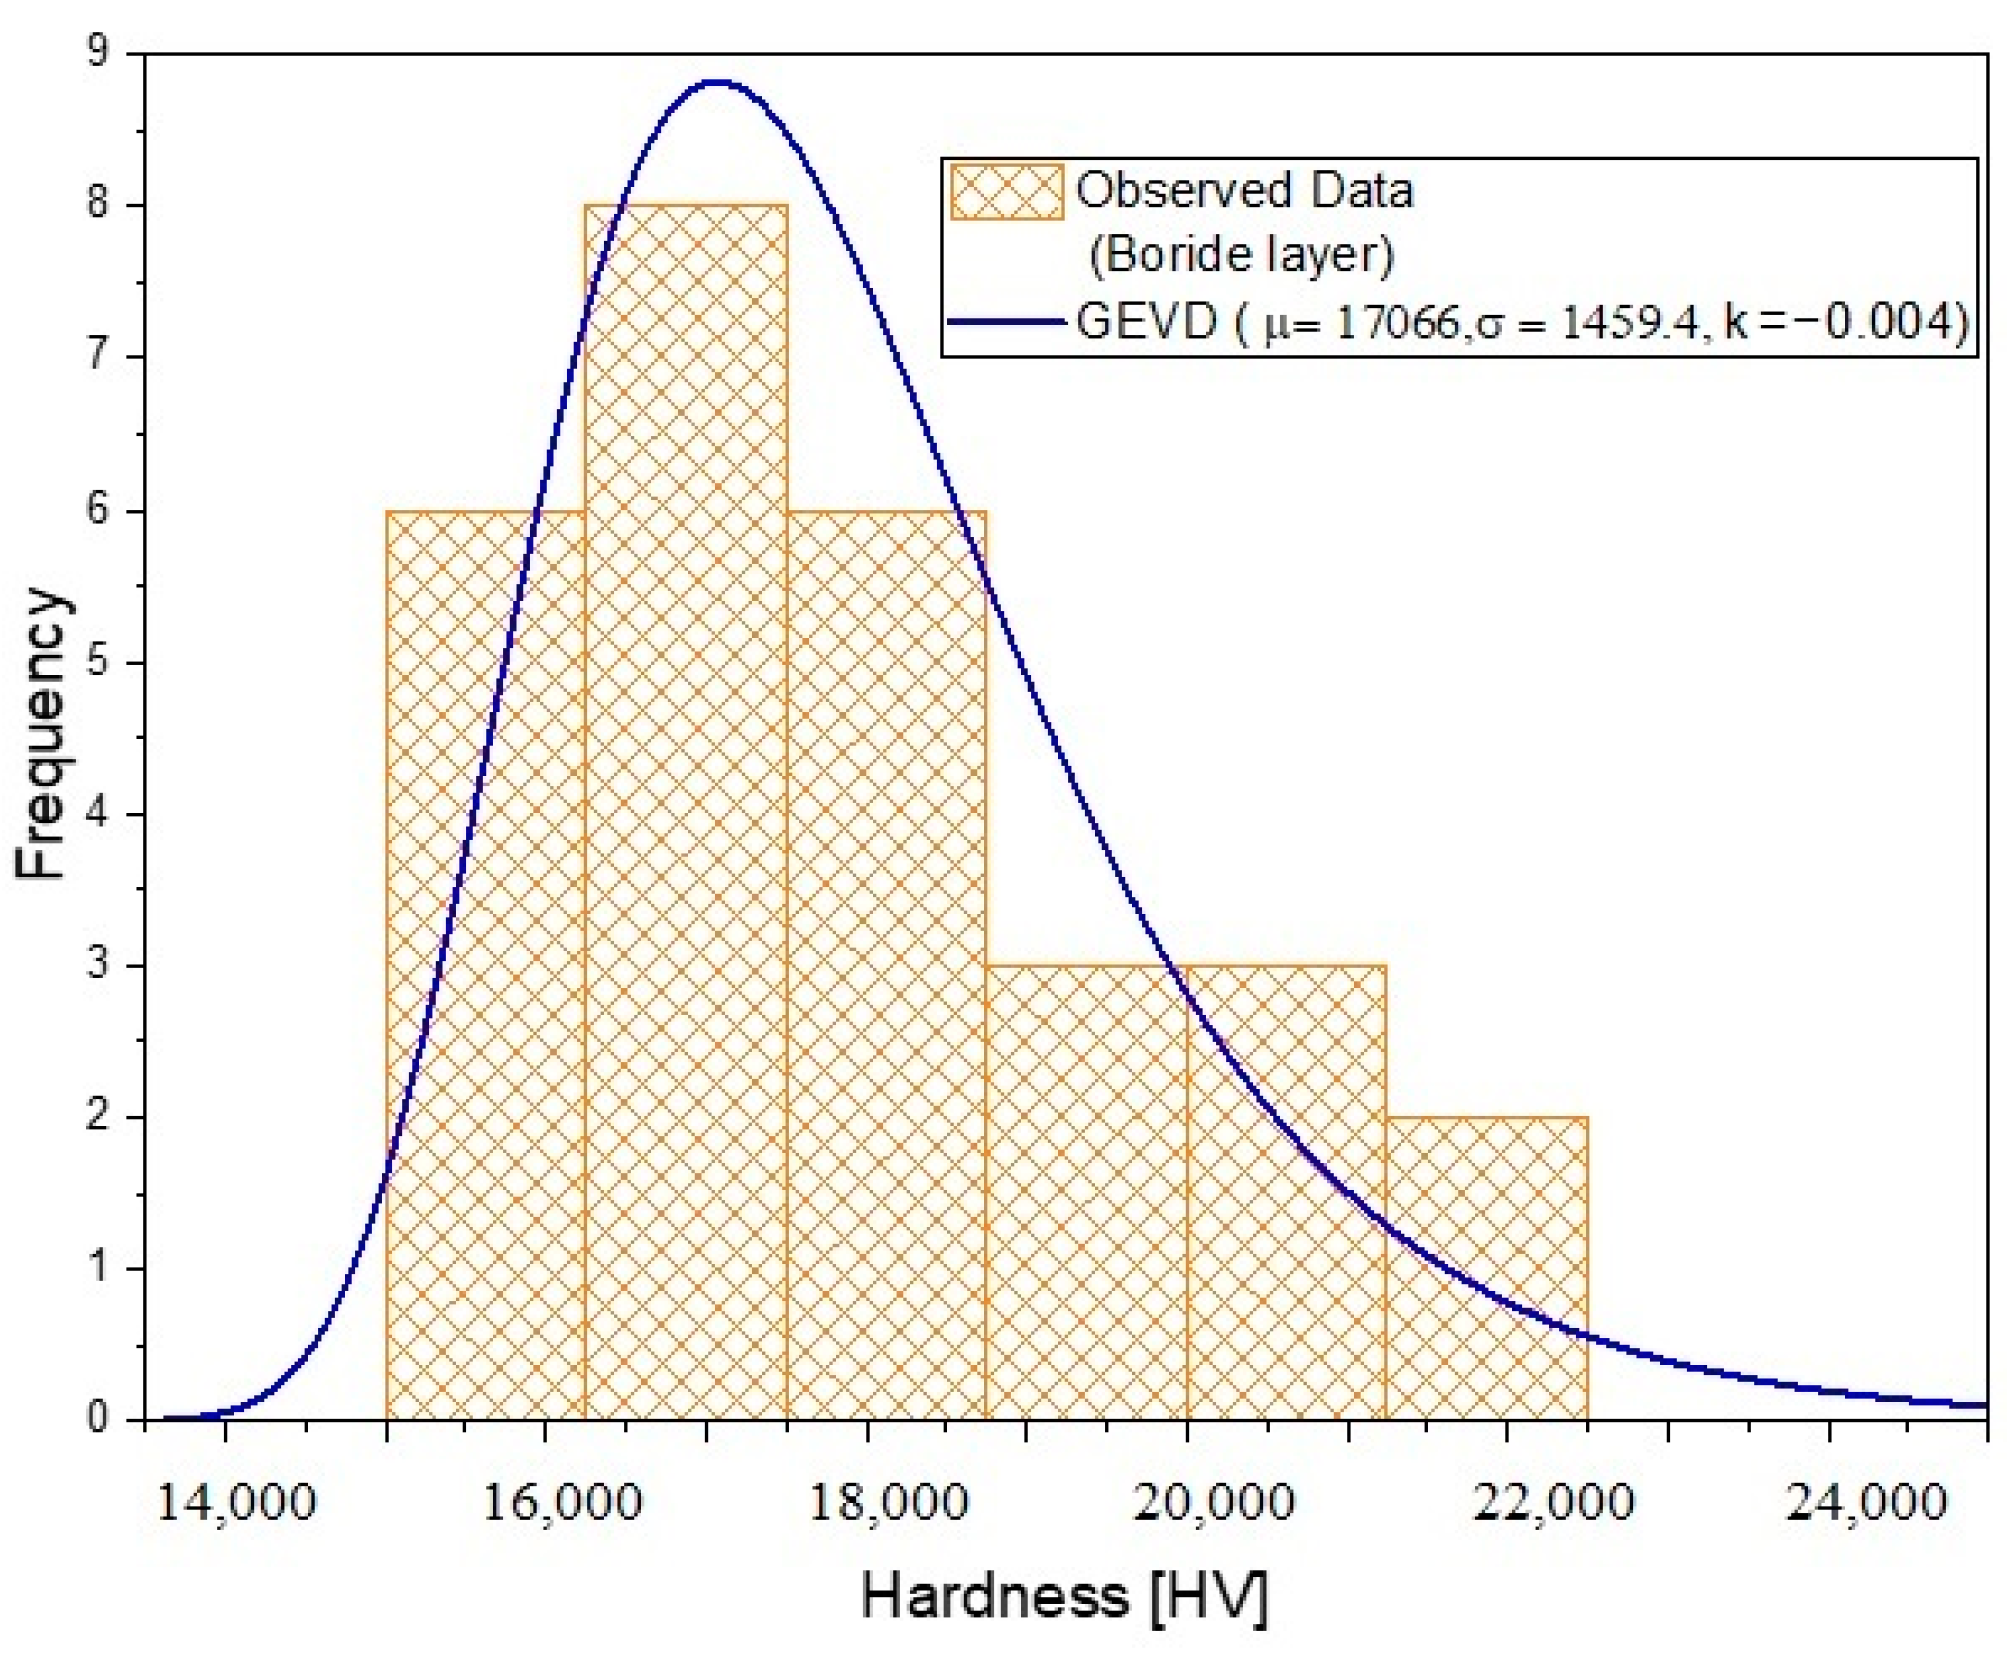
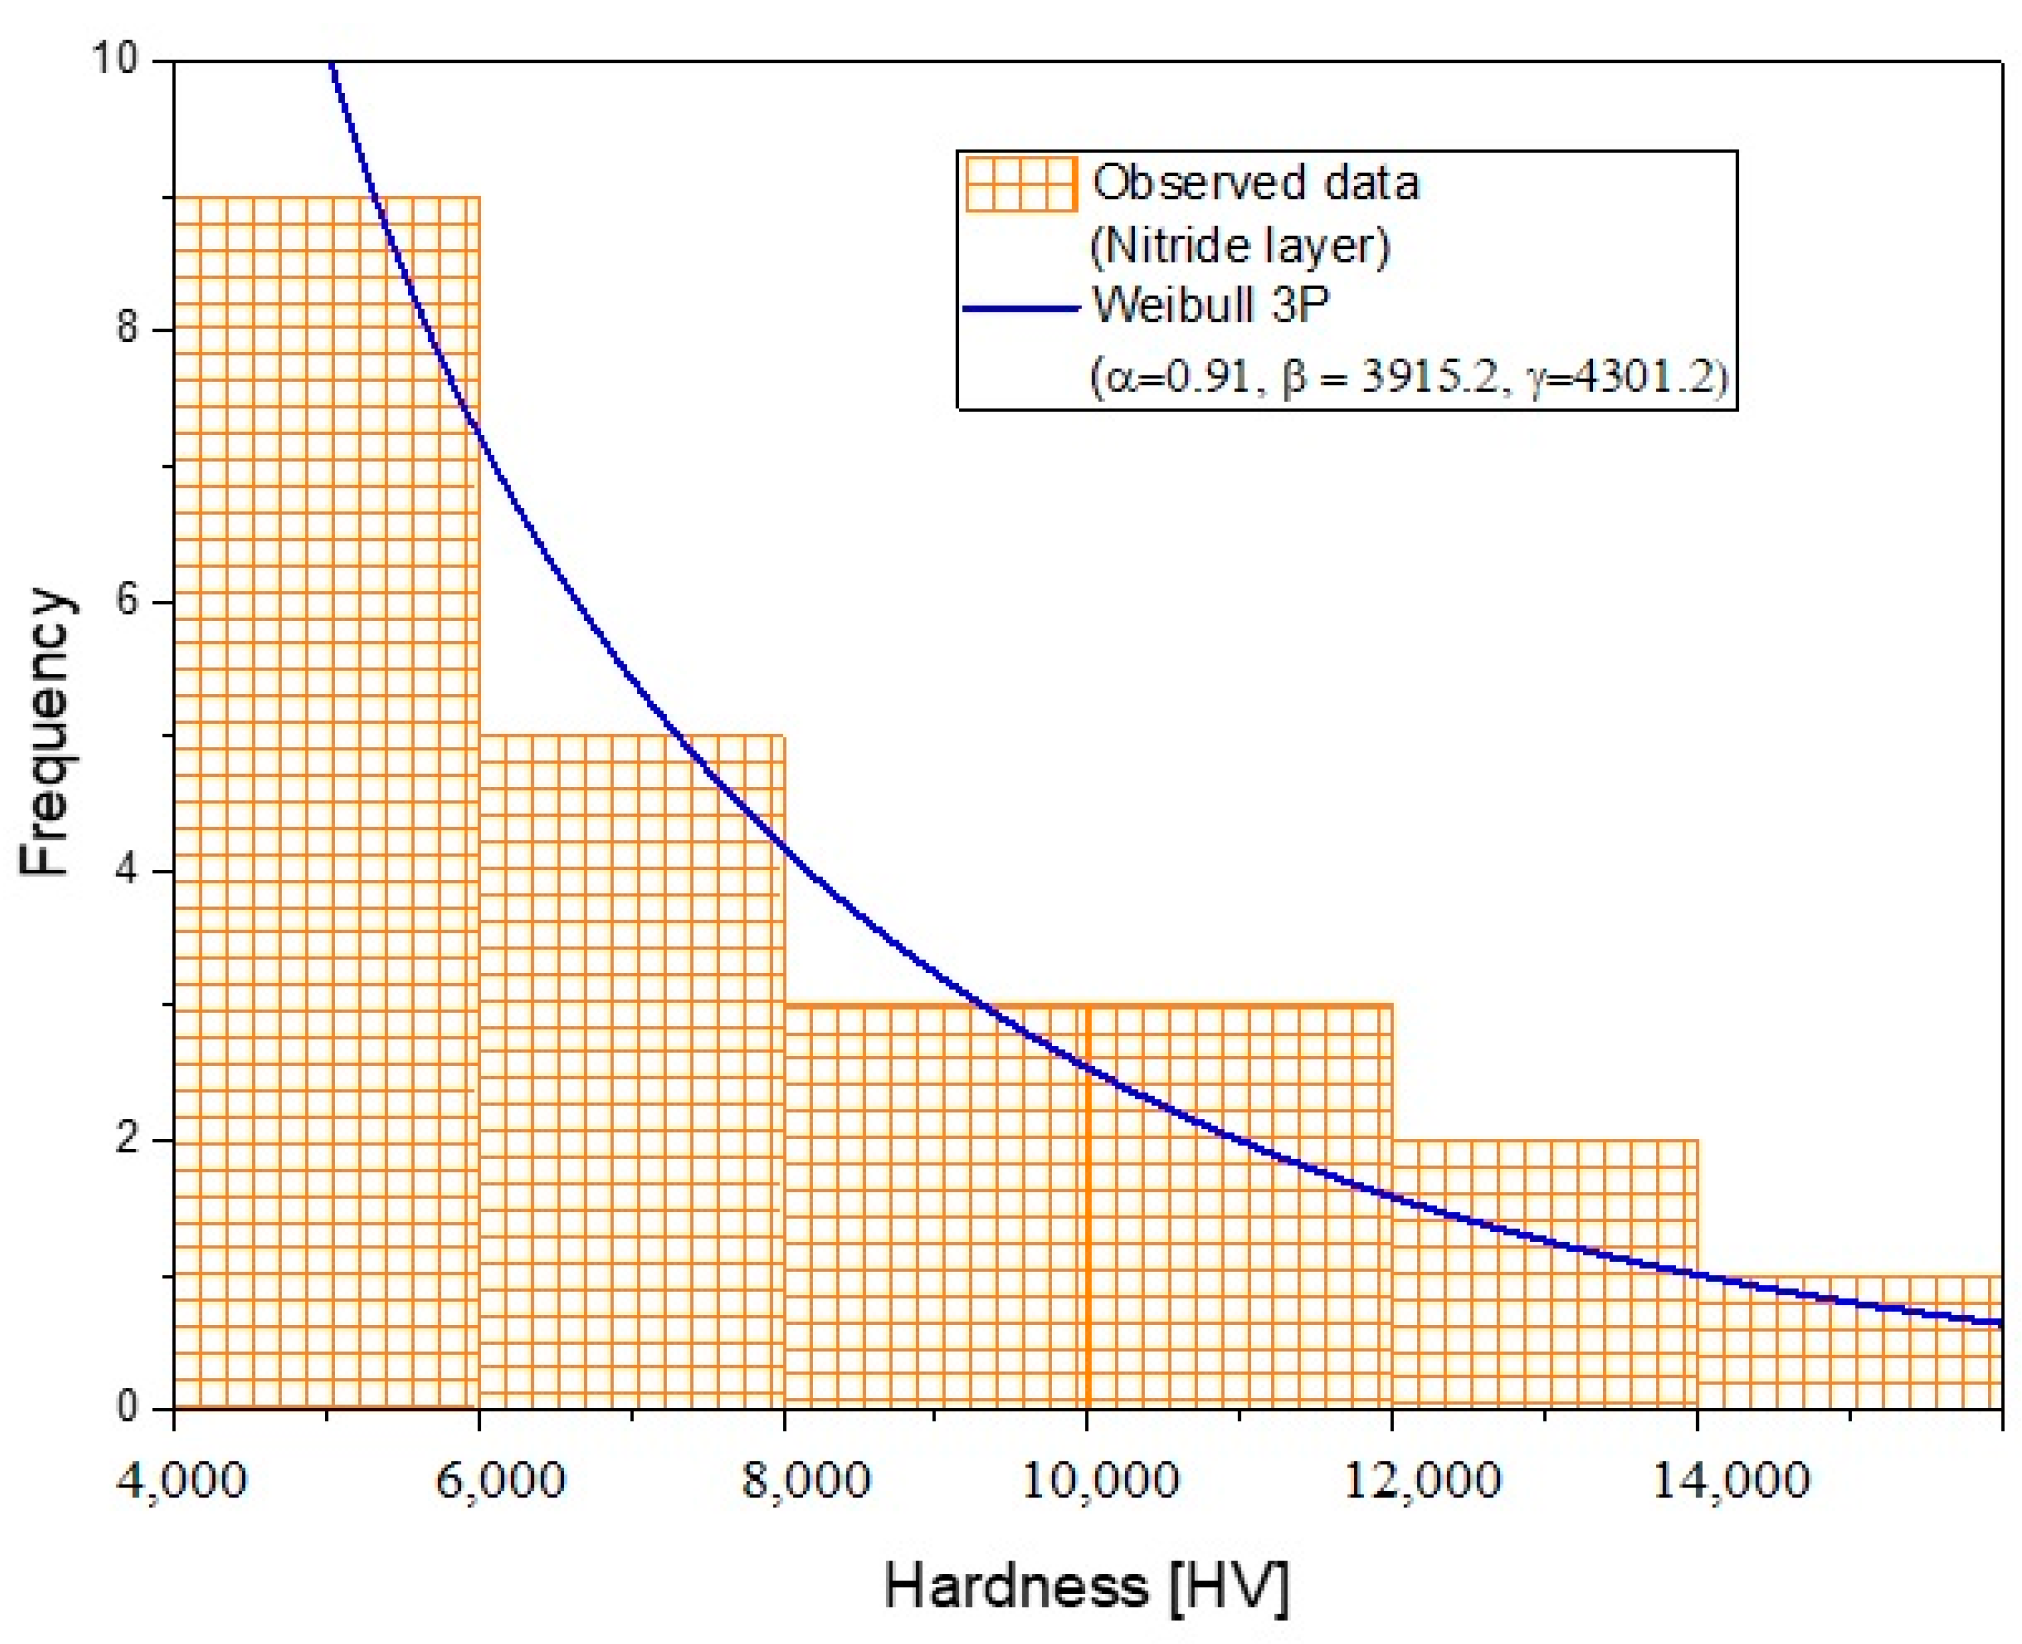
3.5. Statistical Analysis

As mentioned by Velázquez et al. [17], boride layer thickness formed on low carbon steel has a random behavior, indicating that the probability density function that best fits what was observed is the generalized extreme value distribution [30]. To better understand the random behavior of layers formed on AISI 4140 steel, this research investigated a statistical study using the histograms obtained with the data collected during the experiment. In addition, we modeled the evolution of the boride layer thickness using Markov chain techniques.
A microhardness profile was performed for each hard layer (i.e., boride, nitride, and carbide) formed on AISI 4140. A histogram was plotted using this information, and its corresponding probability density function that best fit was drawn as well (See Figure 8, Figure 9 and Figure 10). To select the probability density function that best fit, the generalized extreme value distribution (GEVD), the Weibull 3P distribution, the Fréchet 3P distribution, and the log-normal 3P distribution were compared using the Kolmogorov–Smirnov test [31]. The results obtained with this analysis are shown in Table 9. The best-fit distribution for micro-hardness tested for boride layers was the GEVD, and for the nitride layer and carbide layer, Weibull 3P results were the best choice.
Another key parameter to study was the layer thickness, as this parameter would indicate the metal’s lifetime and its application. Histograms for each layer thickness were also plotted and fitted to find the probability density function representing the observations data. Table 10 shows the results obtained after fitting the observation data to the functions provided in Table 9 using the Kolmogorov–Smirnov test. In addition, Figure 11, Figure 12 and Figure 13 show the observed histogram and its corresponding best-fit probability density function. Weibull 3P was the best choice to represent the layer thickness in the three cases. Furthermore, as Weibull 3P is a variation of the GEVD but shifted γ along the x-axis, it could better represent the information obtained in the experiment.
From the three hardening processes studied, all of them showed a random nature because of the diffusion process does not happen simultaneously and because of the anisotropy of the material. To study and model the growth of three different hardening processes, it is necessary to consider their random nature. The greater the variance of layer thickness means that the hardness which it is required to reach is not homogeneous. The layer thickness histogram is slightly skewed to higher values, which means that there is a greater probability of having a large thickness than a reduced layer thickness. To optimize these hardening processes should be indispensable in order to model stochastically to reduce the chances of having a failure in the layer.

4. Conclusions

The following conclusions can be made after the analysis of the results:
(a)
During the surface-hardening processes applied to the samples, layers with different thicknesses and harnesses were obtained.
(b)
The differences in loss of mass and volume during the wear tests can be attributed to the differences in hardness resulting from the different surface-hardening processes that were applied (i.e., nitriding, carburizing, and boriding).
(c)
The samples with the lowest CoF were not those with the highest hardness, which suggests that the coefficient of friction could be not directly related to the hardness of the materials.
(d)
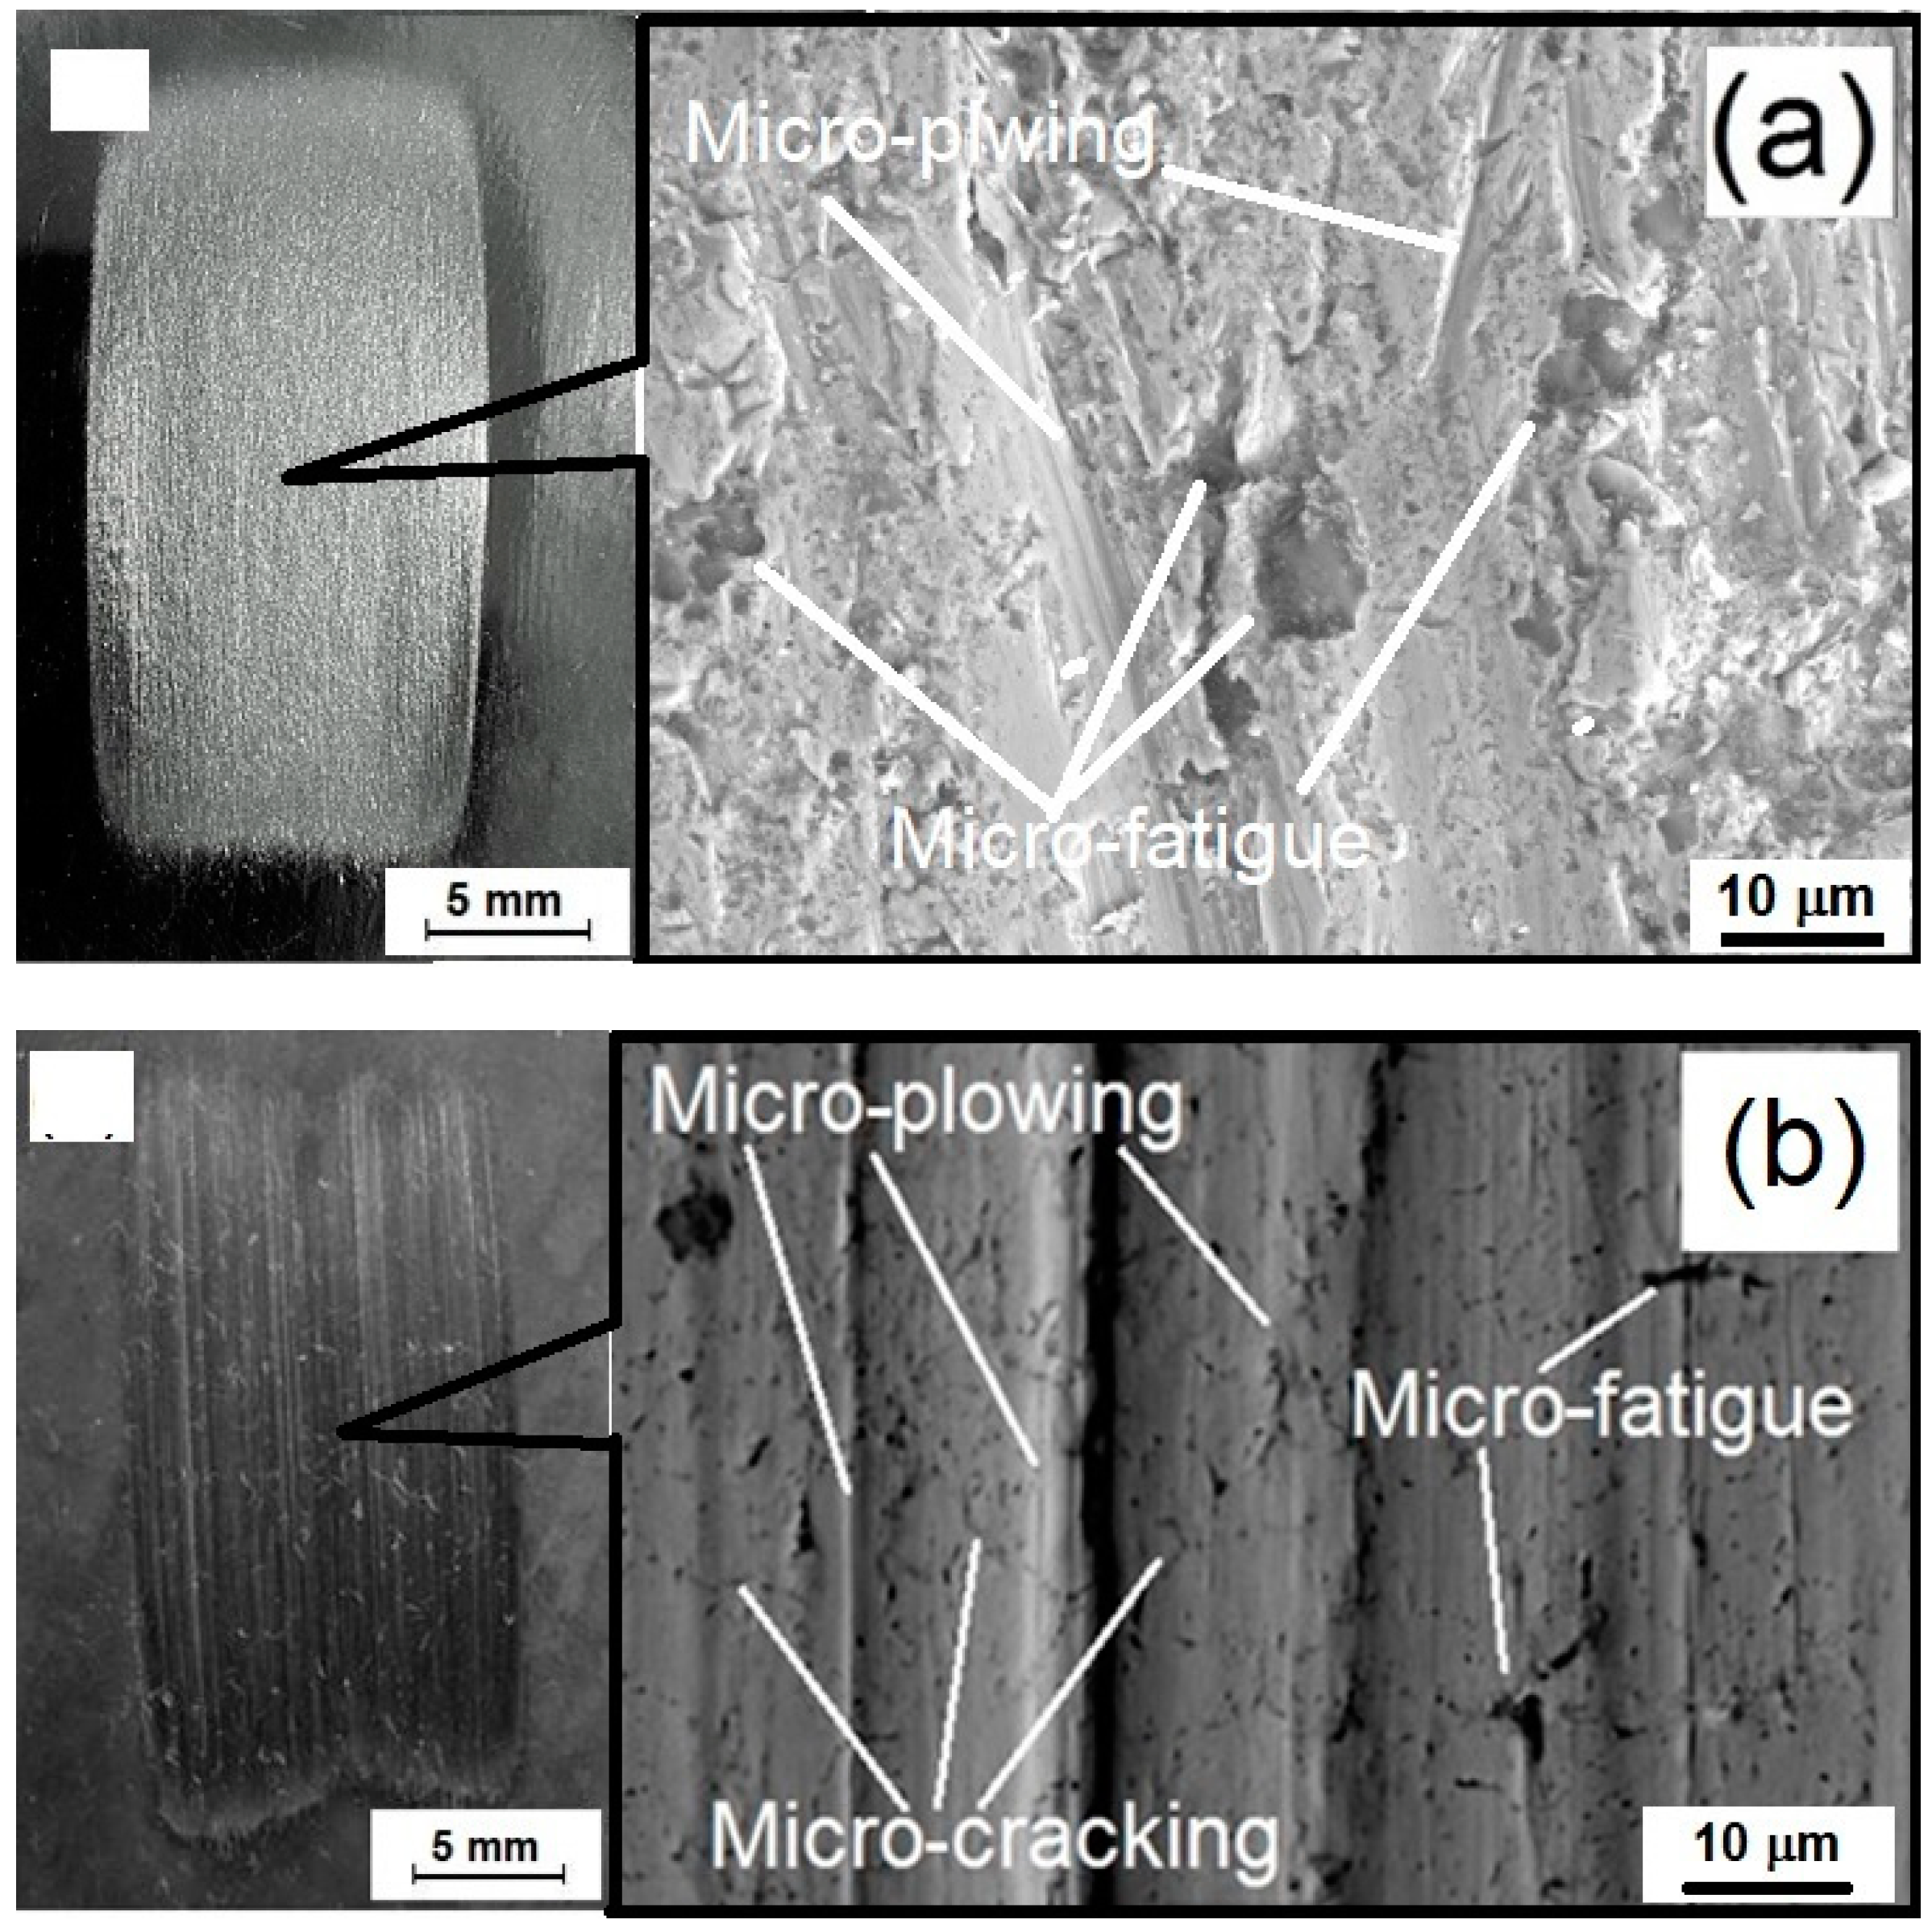
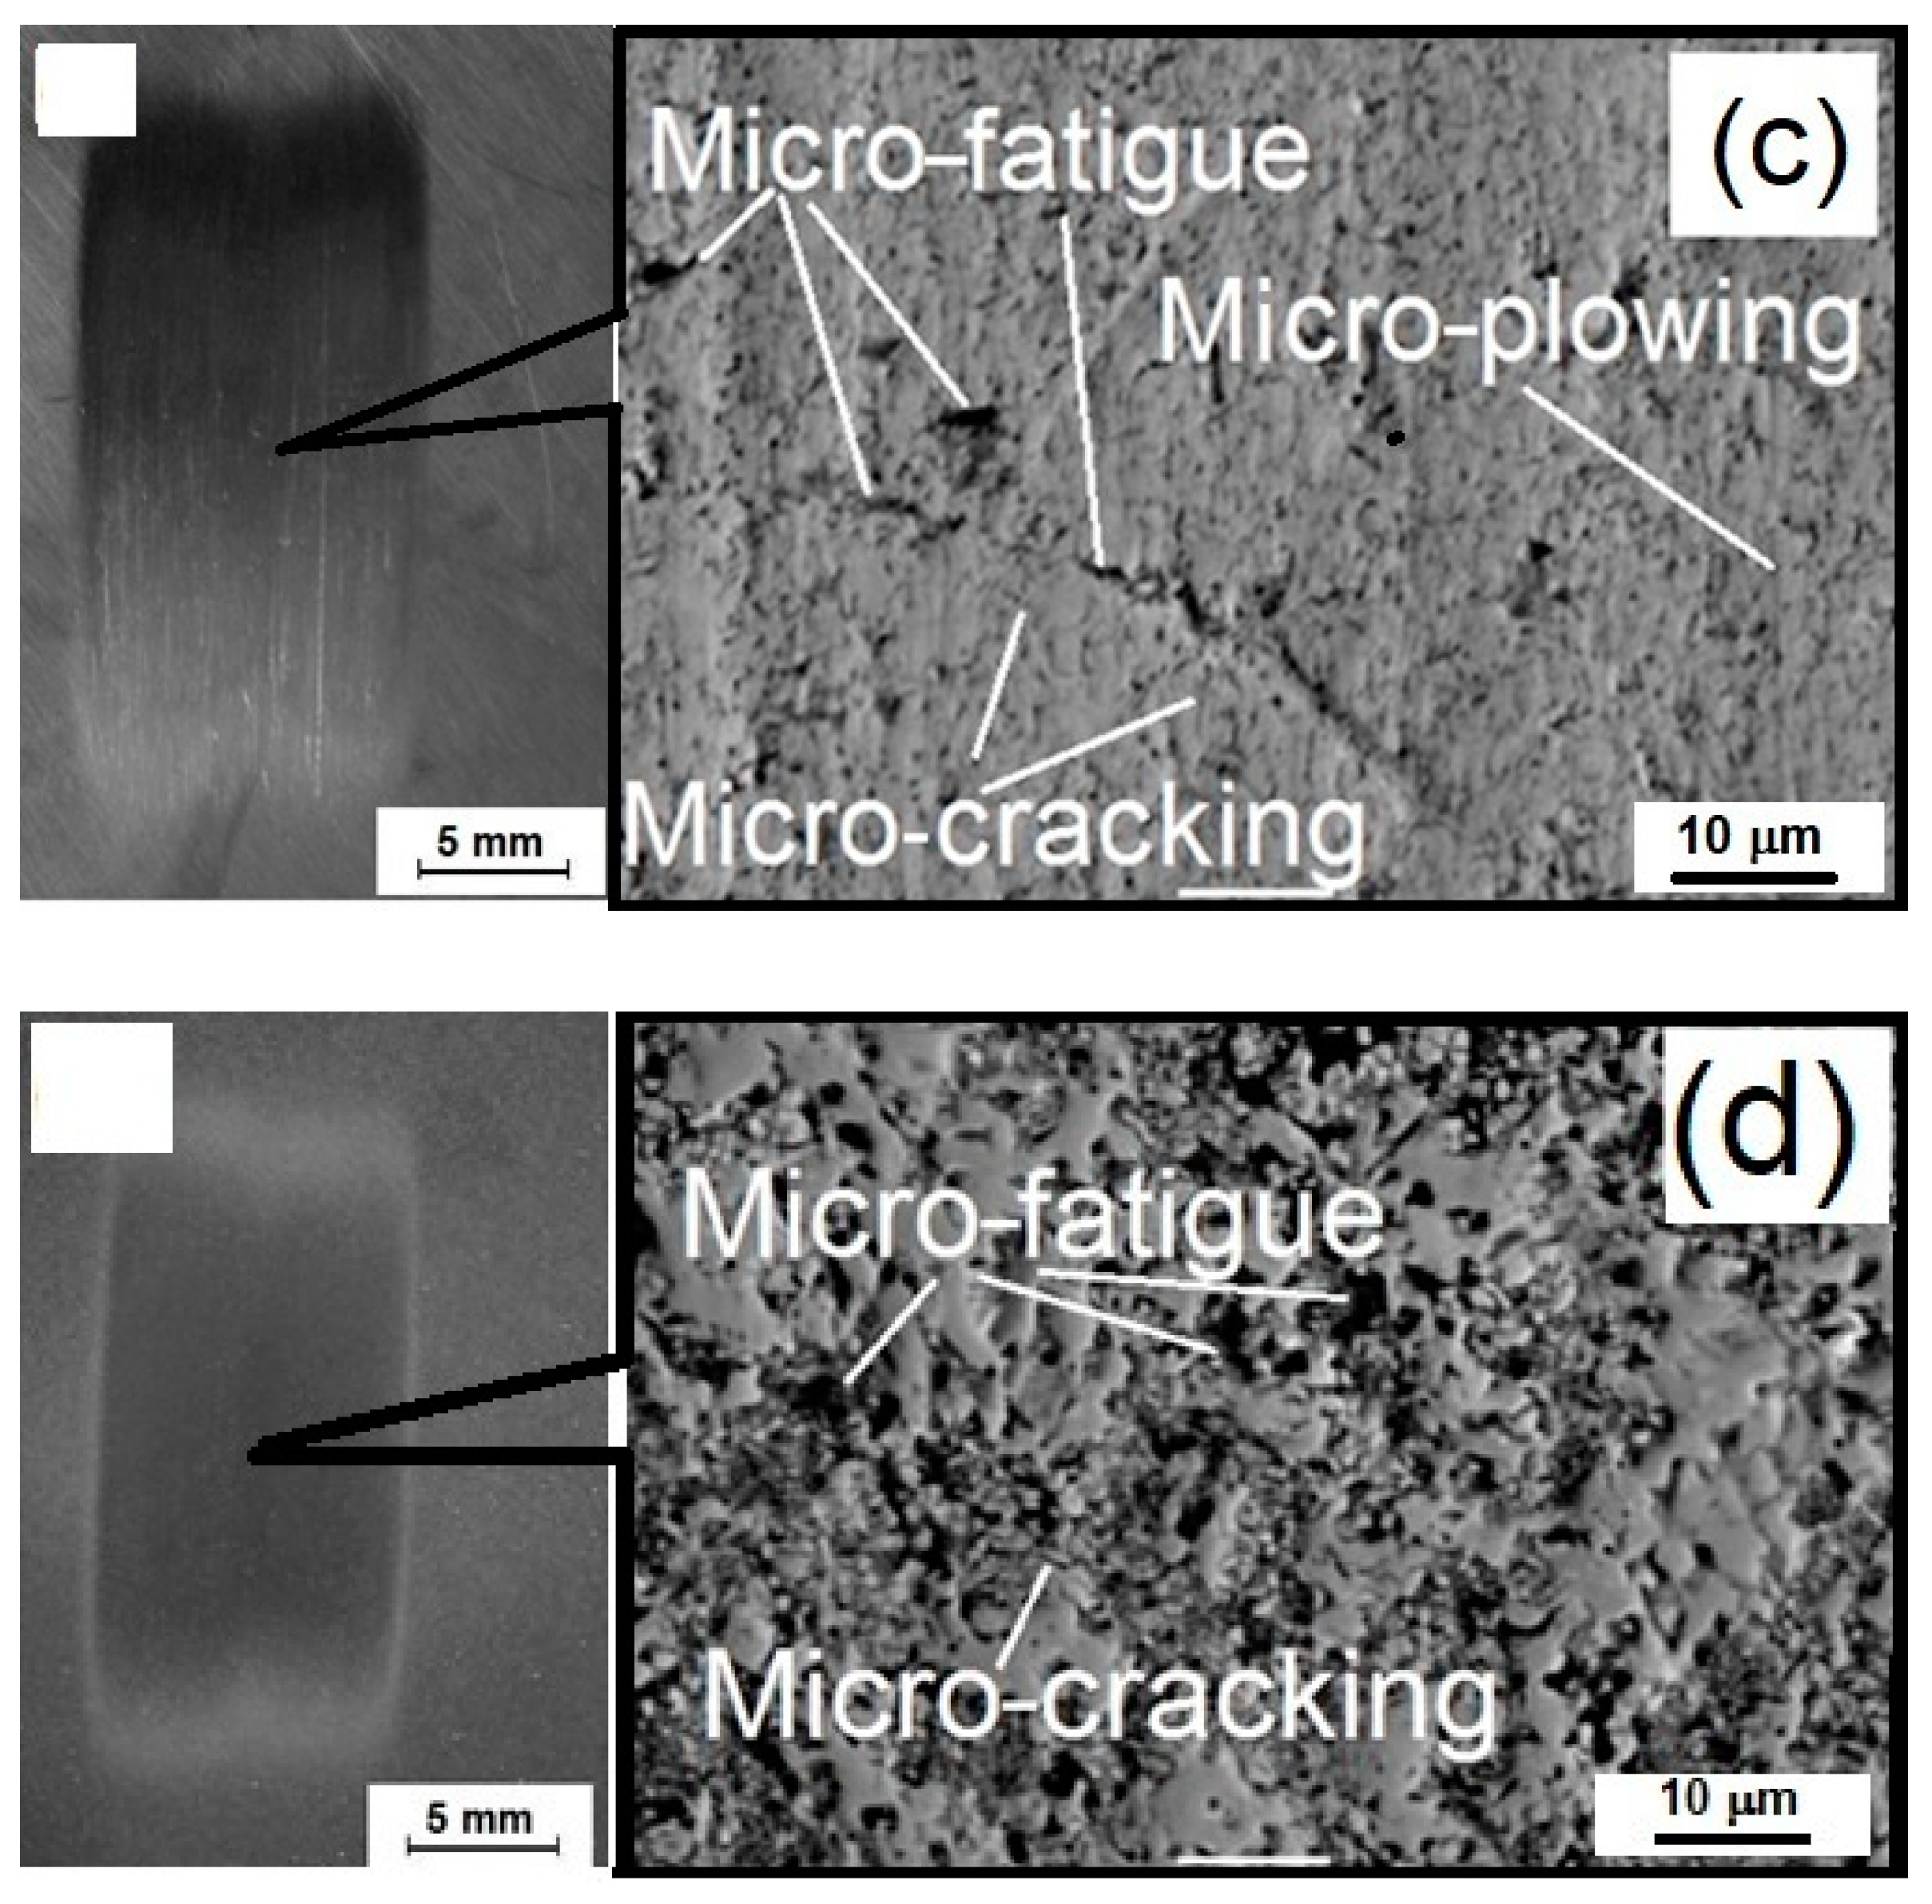
The samples with the lowest hardness (i.e., carburized) exhibited wear signs, such as micro-plowing, micro-cracking, micro-fatigue, and micro-cutting. In contrast, the samples with the highest hardness values showed less damage and only exhibited some minor marks of micro-fatigue and micro-cracking.
(e)
The main reason for the tribological behavior of the borided samples appears to be the naturally occurring boric acid films when the boride layers were exposed to open air.
(f)
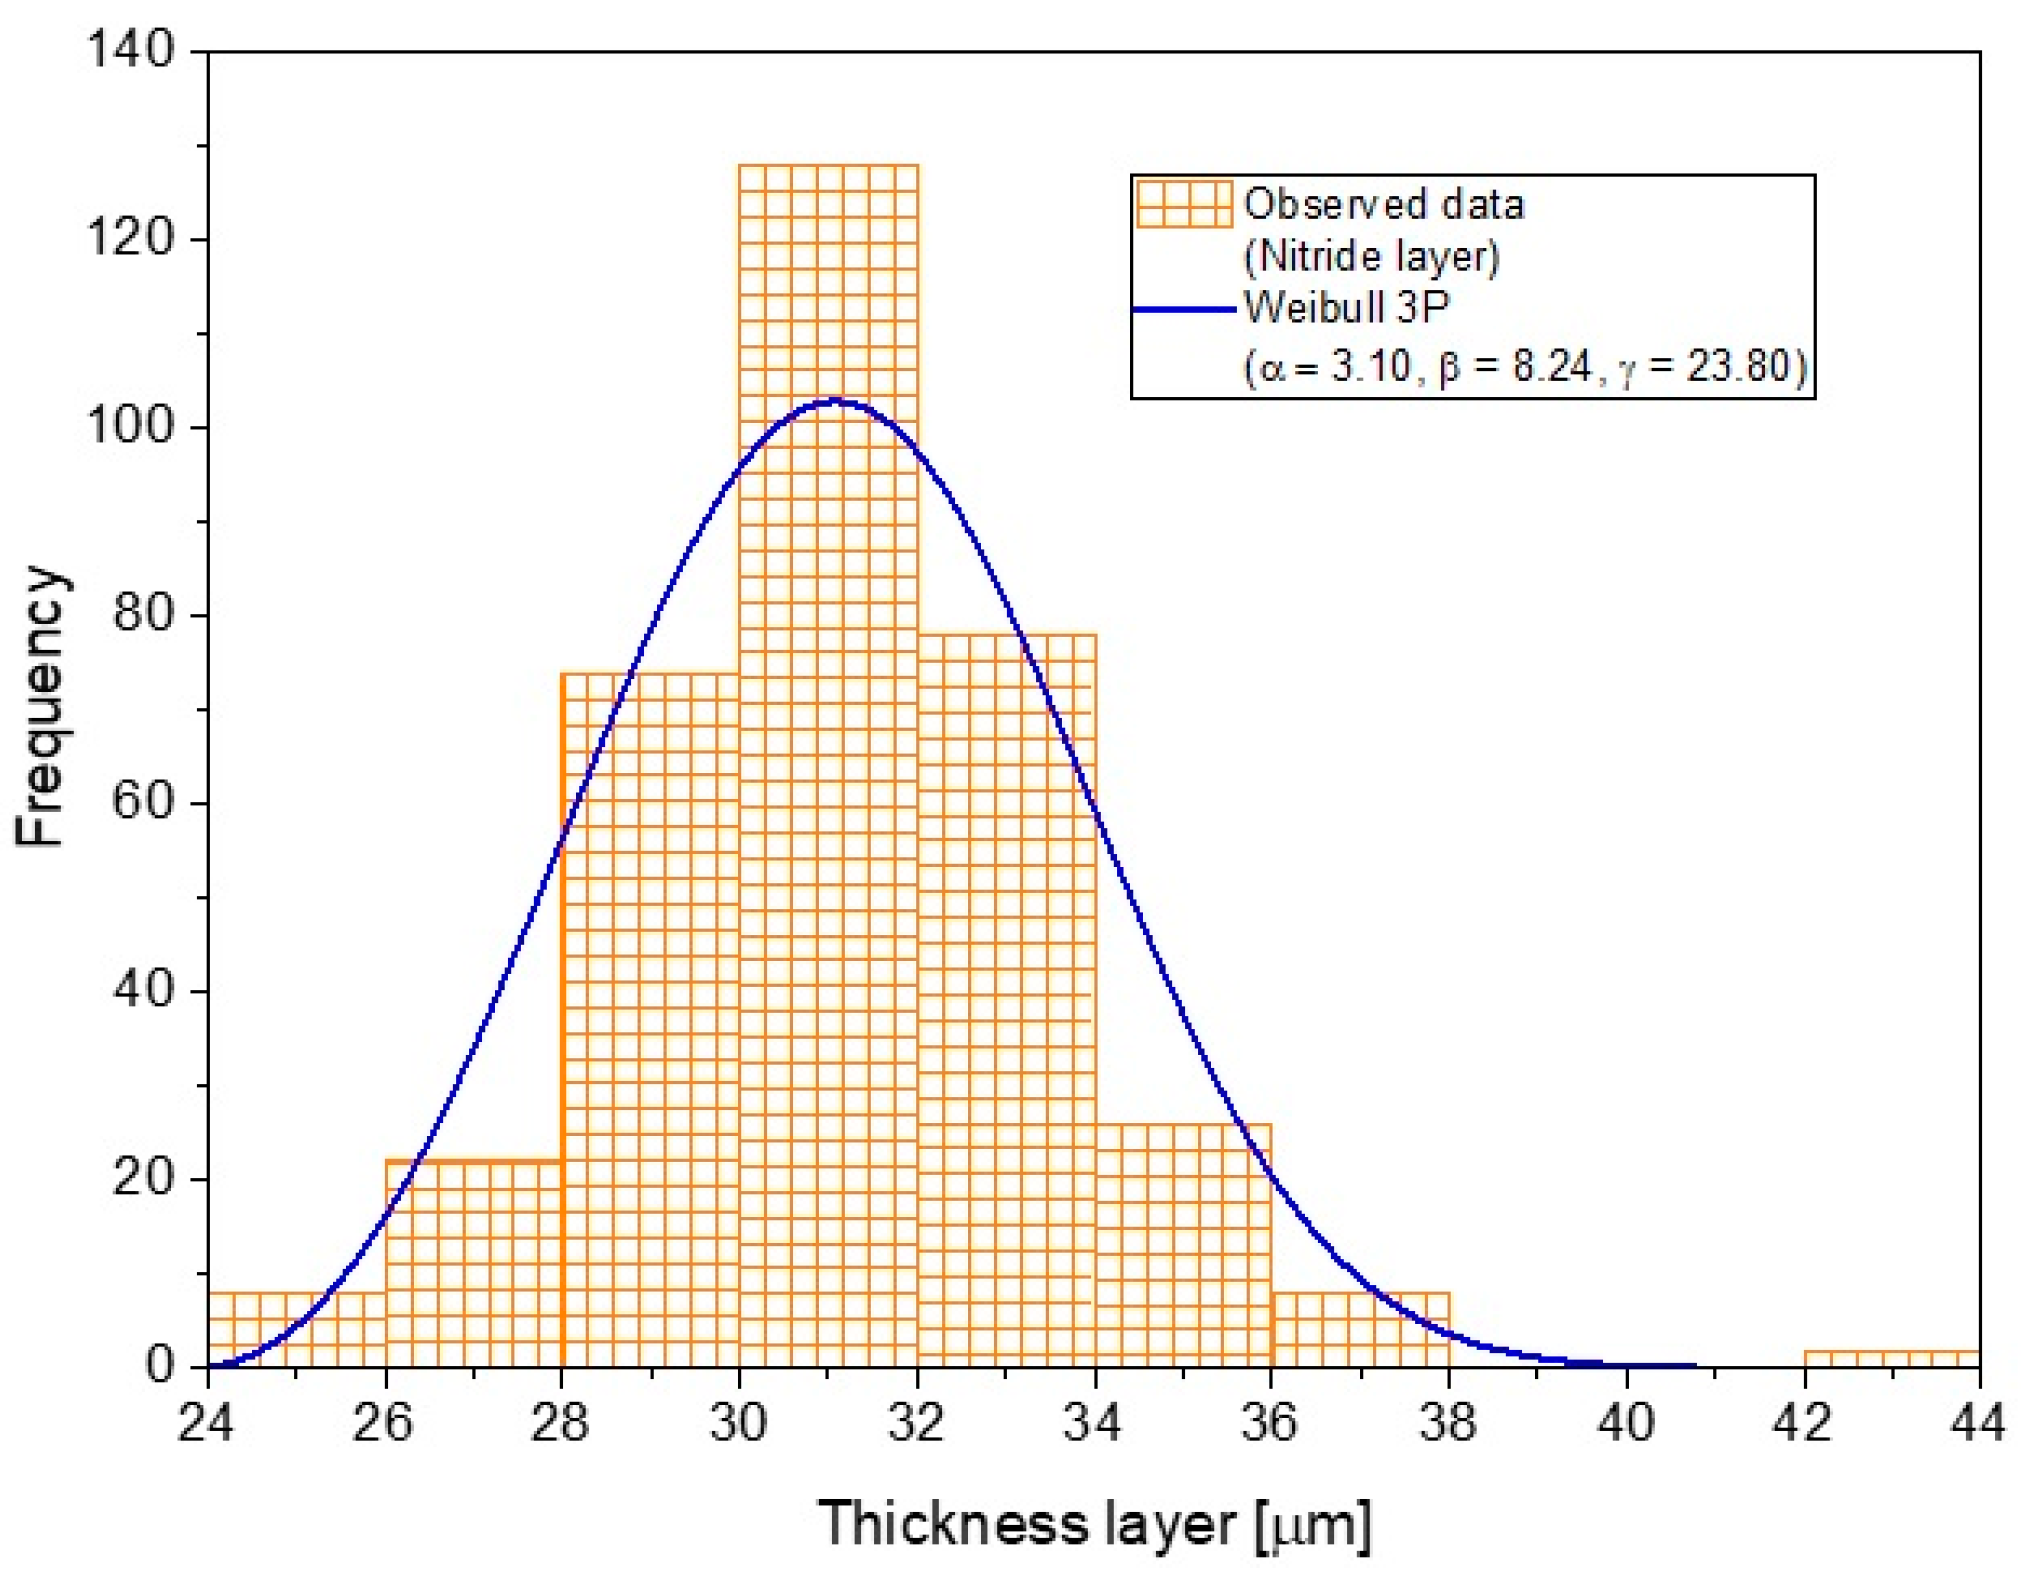
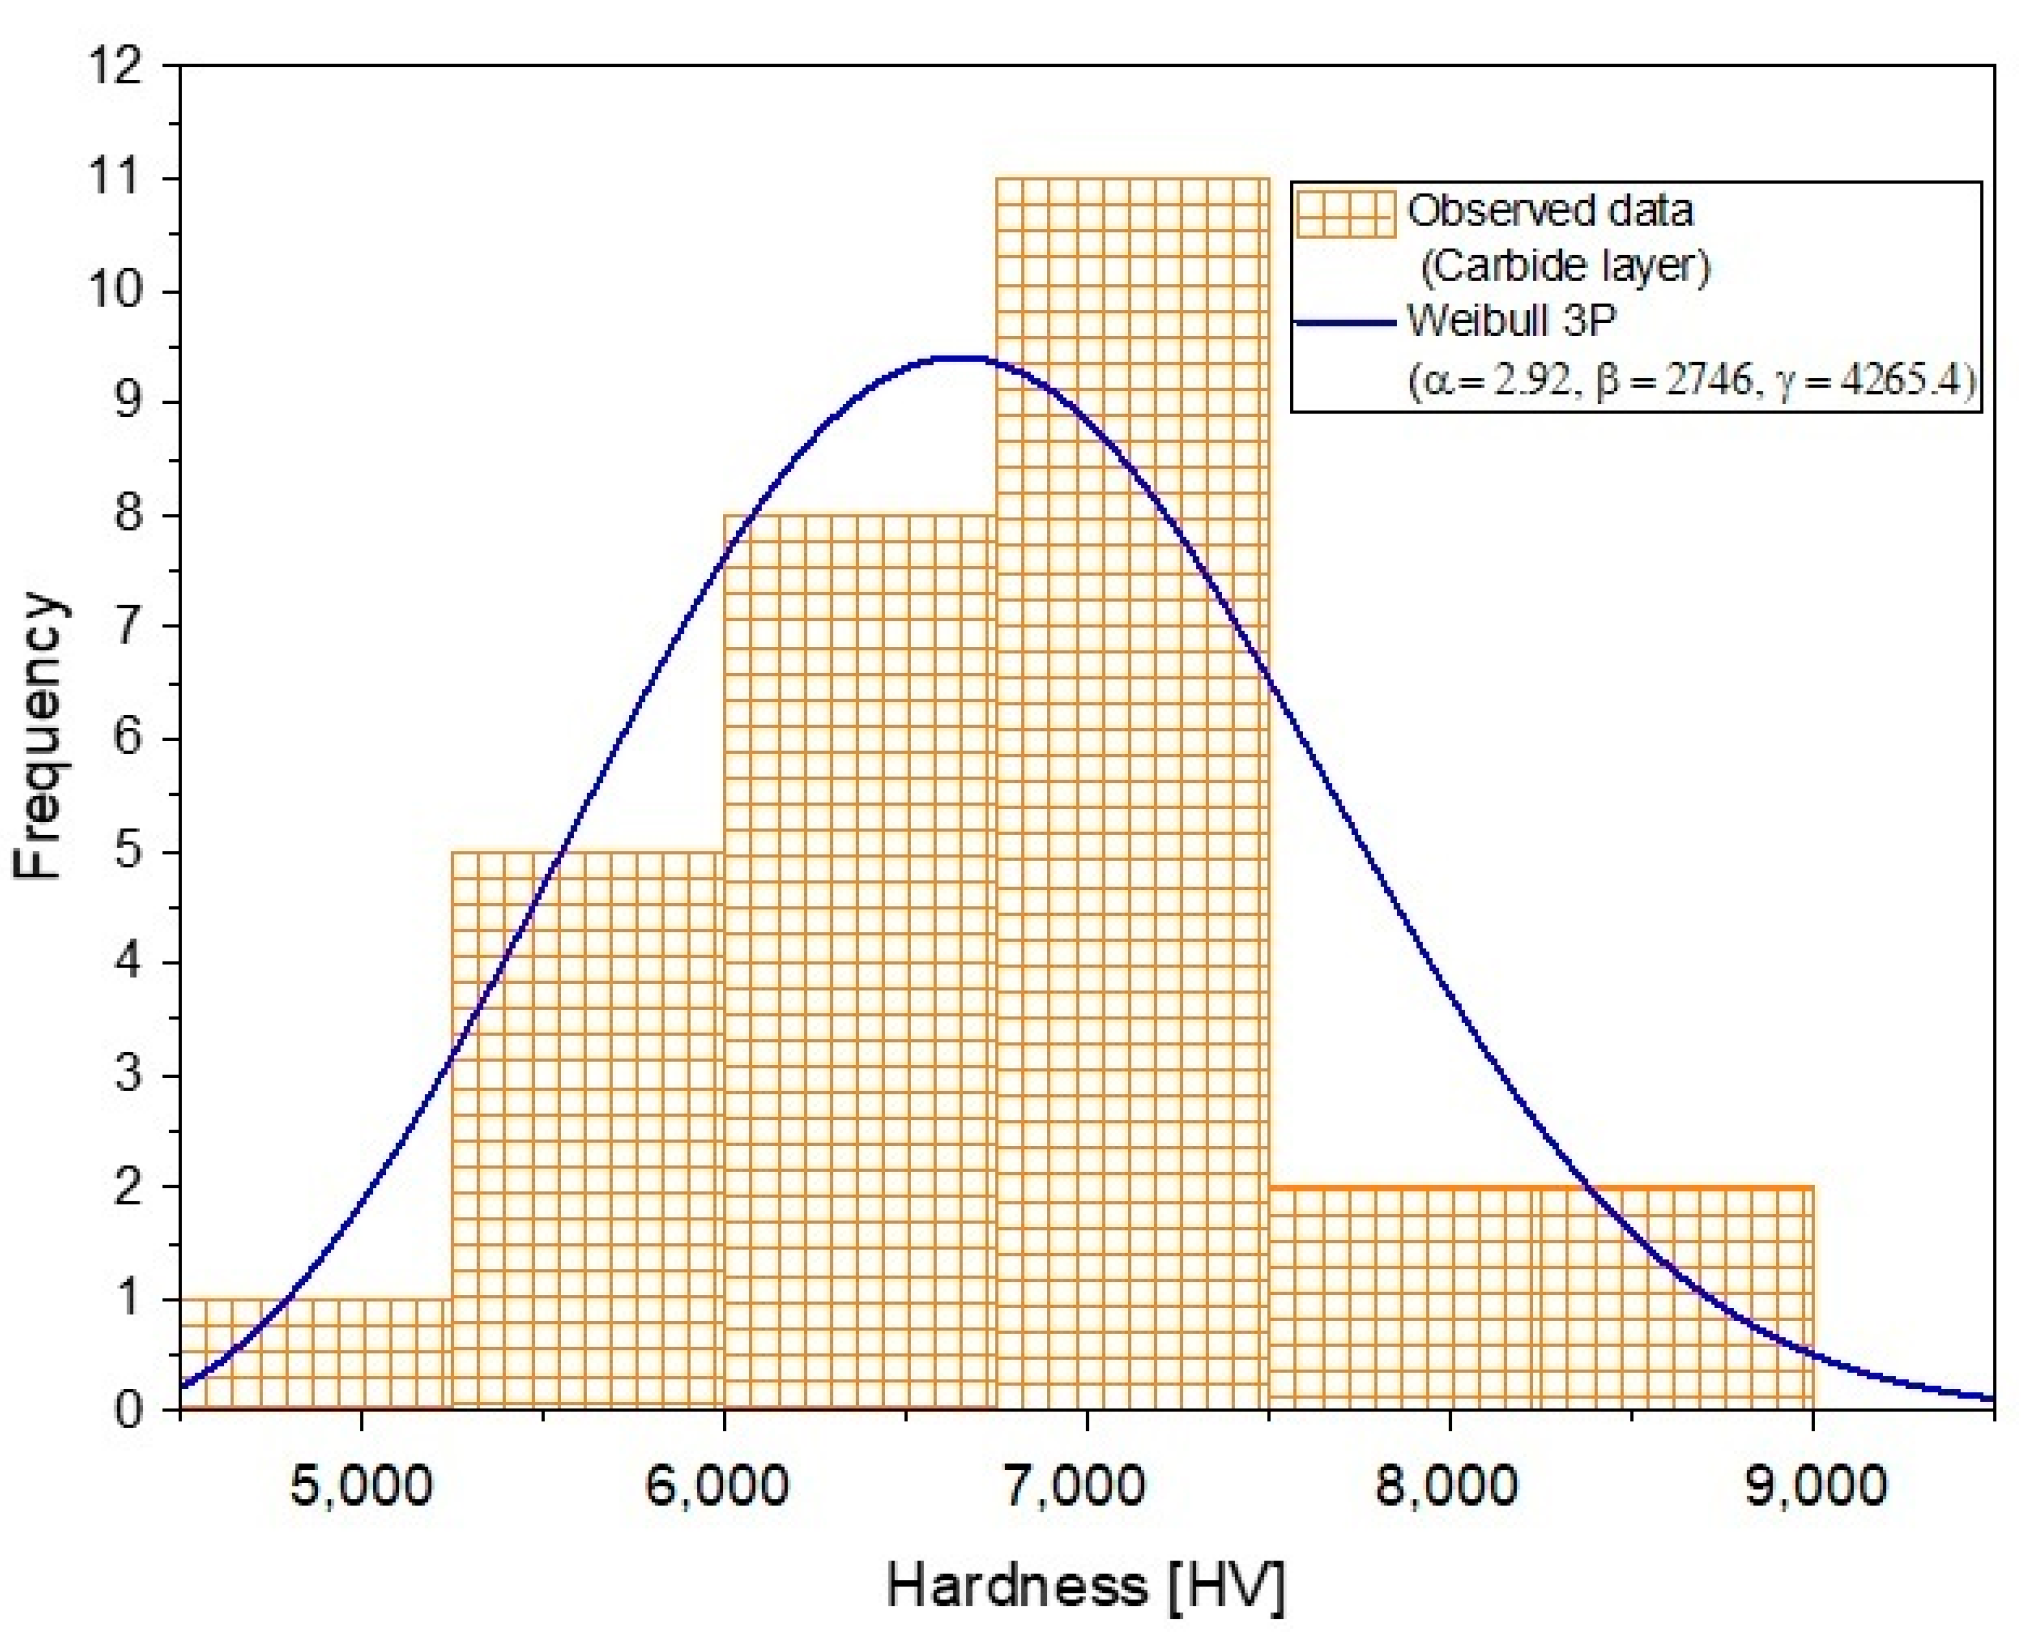
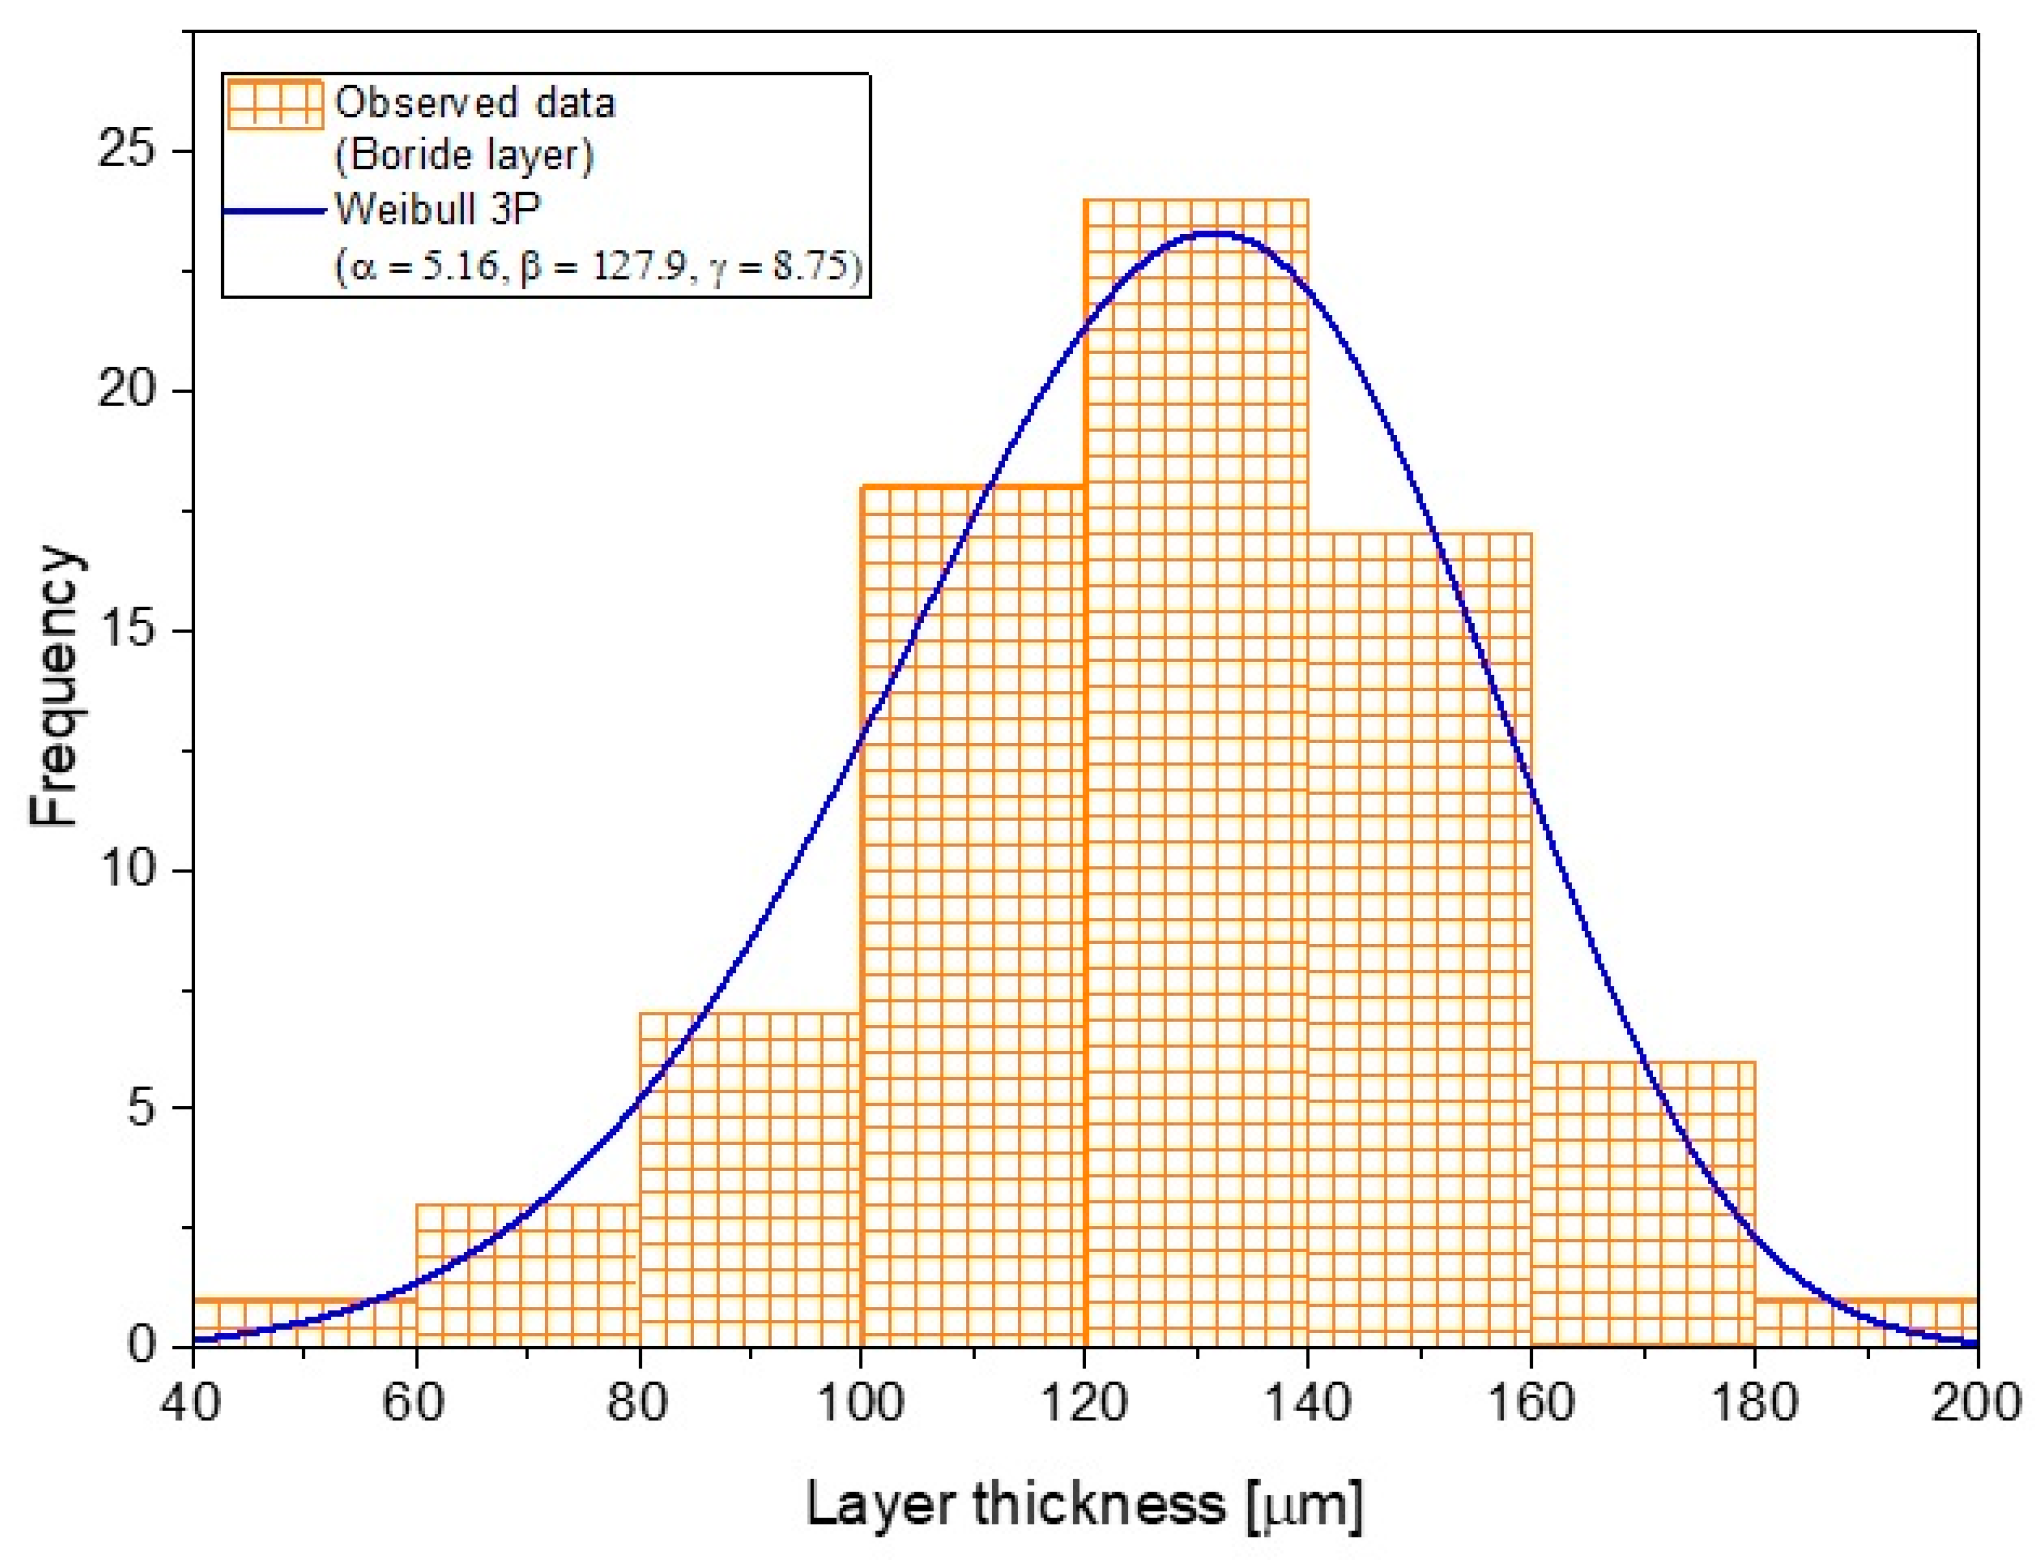
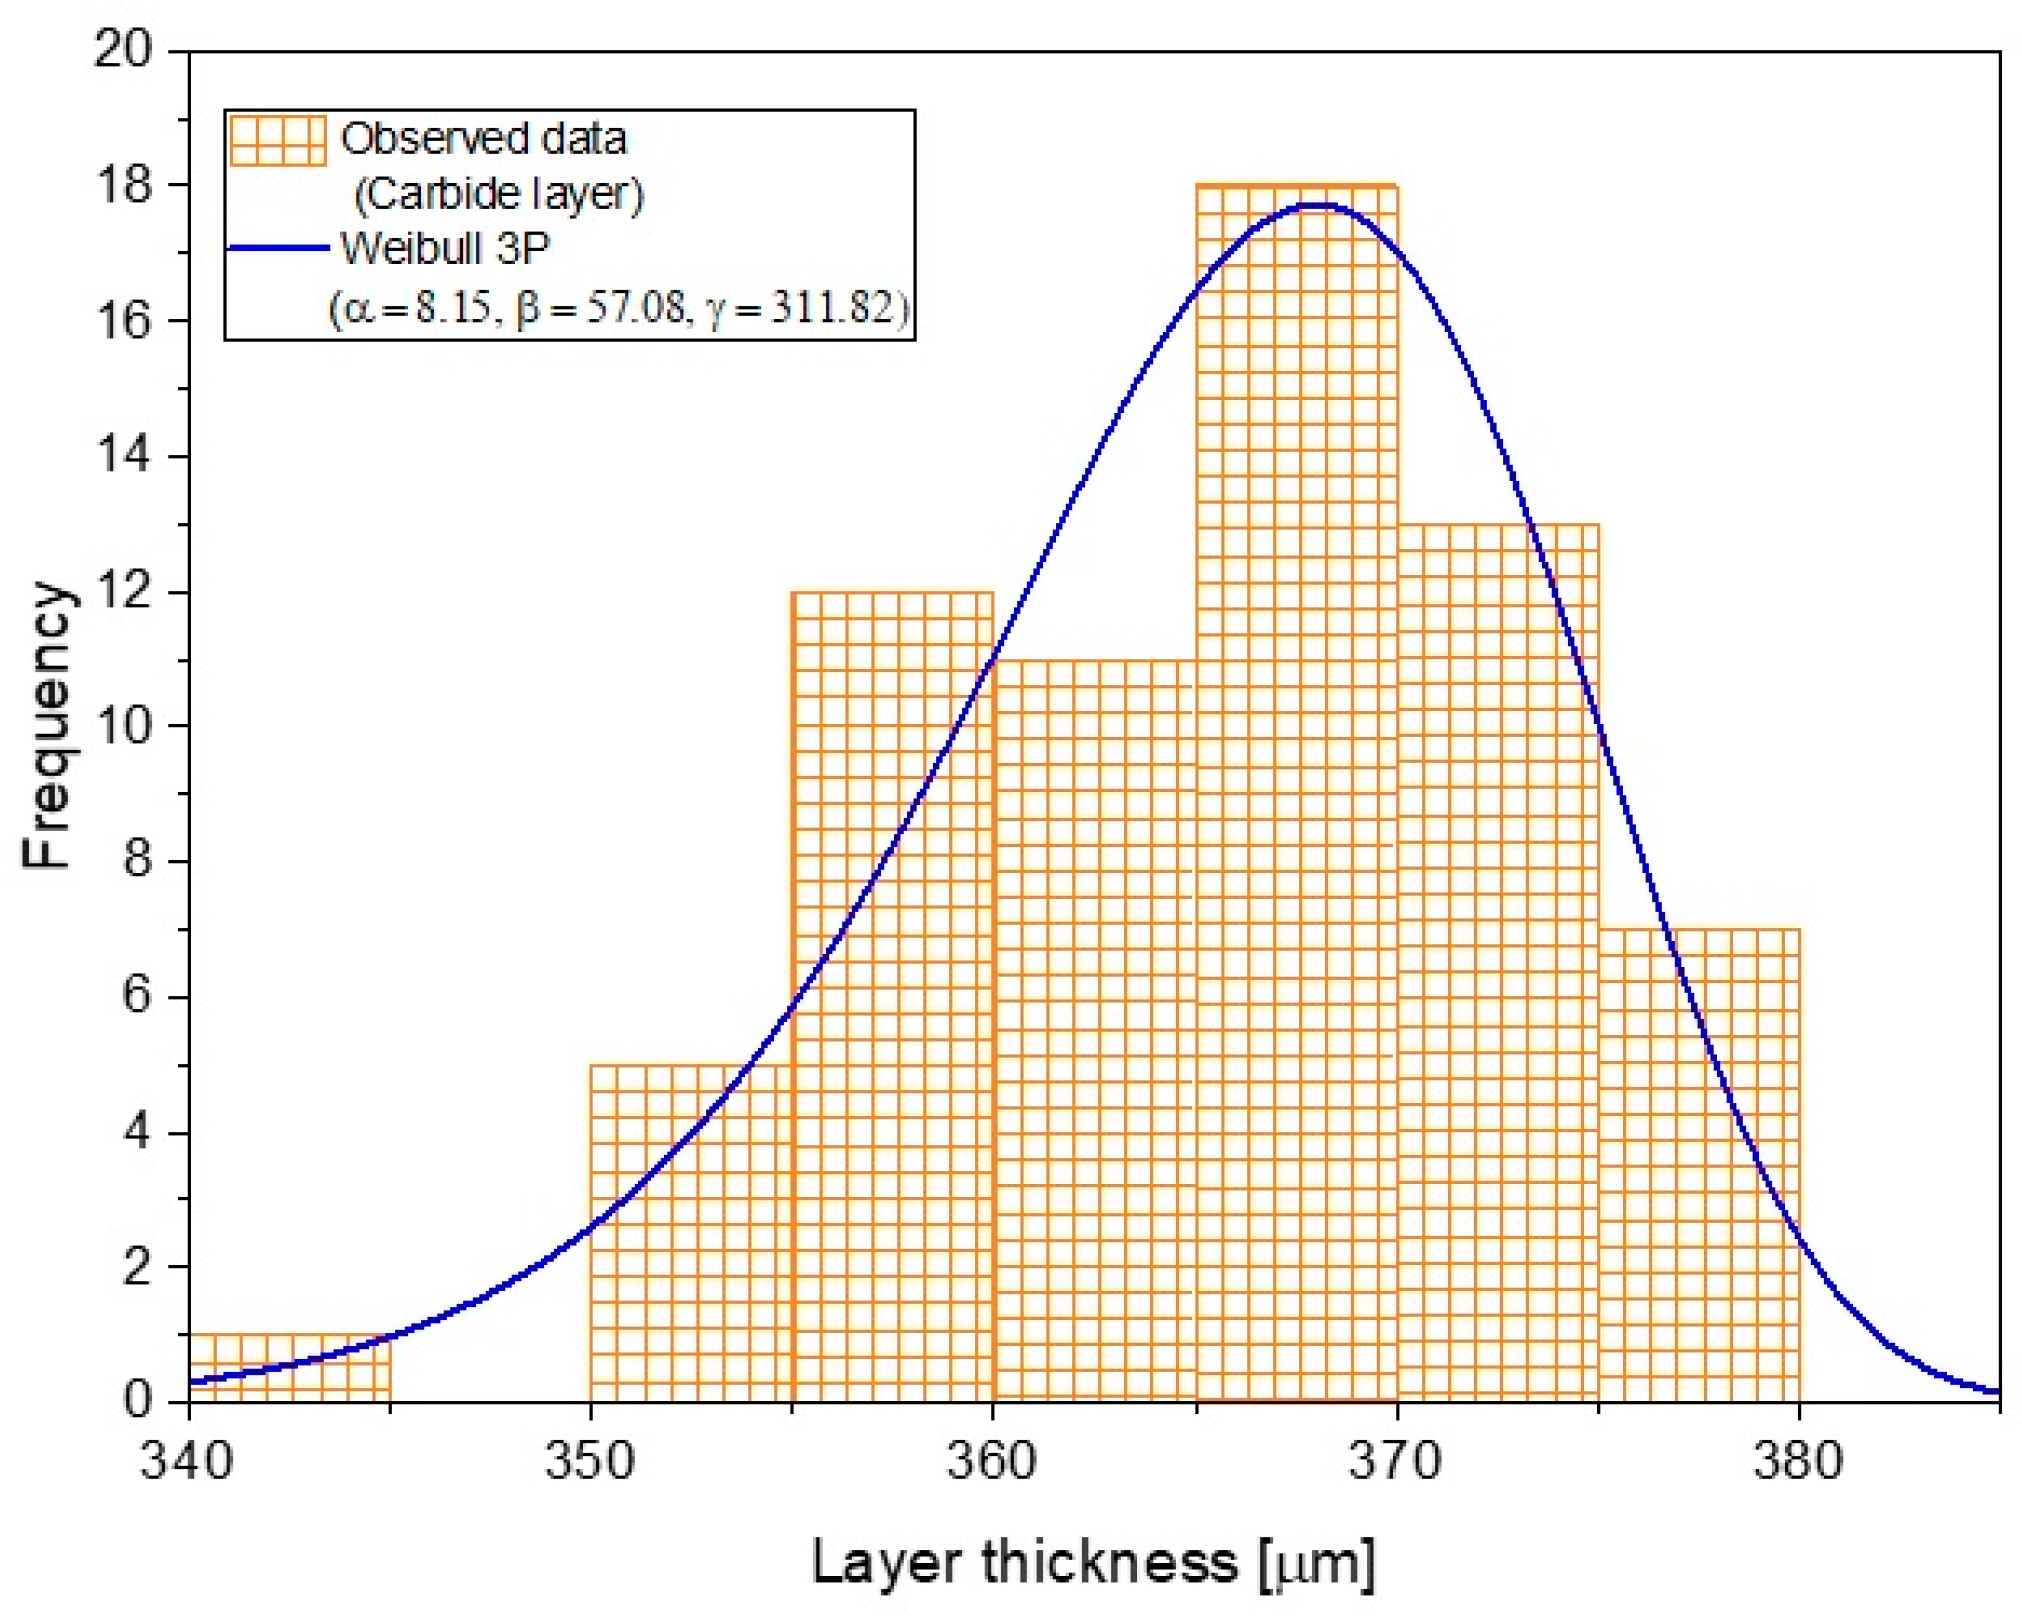
In the three layers studied in this research work, it was possible to confirm that the layer thickness and the layer hardness had a random behavior. The confirmation of this behavior could assist in modeling the layer growth and optimize the formation process.
(g)
Layer thickness and surface hardness can be studied as random variables, and they can be analyzed using generalized extreme valued distribution and Weibull 3P distribution with enough confidence degree.

Author Contributions

Conceptualization, R.C.-E. and E.H.-S.; Data curation, A.C.-U. and J.G.M.-H.; Formal analysis, R.C.-E., J.C.V. and E.H.-S.; Investigation, P.A.R.-T., A.C.-U. and R.T.-R.; Methodology, A.C.-U., R.T.-R. and J.C.V.; Project administration, J.G.M.-H. and E.H.-S.; Validation, R.C.-E., J.C.V. and E.H.-S.; Writing—review and editing, R.C.-E., J.C.V. and E.H.-S. All authors have read and agreed to the published version of the manuscript.

Funding

This work was supported by research Grant 20210181 of Instituto Politécnico Nacional in Mexico.

Institutional Review Board Statement

Not applicable.

Informed Consent Statement

Not applicable.

Data Availability Statement

The data that support the findings of this study are available from the corresponding author upon reasonable request.

Acknowledgments

The authors wish to thank the Center of Nanosciences and Micro-Nano Technologies of the Instituto Politécnico Nacional for the cooperation. Additionally, they would like to thank Instituto Tecnológico de Estudios Superiores Monterrey in Mexico for its collaboration in developing this work.

Conflicts of Interest

The authors declare no conflict of interest.

References

  1. Findik, F. Latest progress on tribological properties of industrial materials. Mater. Des. 2014, 572, 18–24. [Google Scholar] [CrossRef]
  2. Erdemir, A.; Eryilmaz, O.L. Chapter 16, Superlubricity in Diamond-Like Carbon Films, Superlubricity; Elsevier Science: Amsterdam, The Netherlands, 2007; pp. 253–271. [Google Scholar]
  3. García, B.S.; Muruzabal, T.C.; Royo, L.P.; Mata, J.S.; Íñigo, E.S. Interface patológica por fricción metal-metal y metal-polietileno, diferencias microscópicas. Rev. Esp. Cir. Osteoartic. 1996, 31, 171–176. [Google Scholar]
  4. Sánchez, E.H.; Avila, I.P.T.; Chino-Ulloa, A.; Alvarez, C.O.; Hernández-Rodríguez, M.A.L.; Tadeo-Rosas, R.; Carrera-Espinoza, R.; Yescas-Hernández, J.A. Tribological Behavior of a Self-Lubricant Surface Film of H3BO3 Formed on a Borided Biomedical Steel by a Post-Treatment. Defect Diffus. Forum 2020, 400, 65–74. [Google Scholar] [CrossRef]
  5. Hasan, M.Z.; Hussein, A.A.; Hasan, A.S.; Ali, O.M. Improvement of AISI 1018 Carbon Steel Gr 1018 mechanical properties by liquid carburizing in salt bath. Mater. Today Proc. 2020, 20, 512–516. [Google Scholar] [CrossRef]
  6. Navío, C.; Capitán, M.J.; Álvarez, J.; Miranda, R.; Yndurain, F. Formation of a non-magnetic metallic iron nitride layer on bcc Fe (100). New J. Phys. 2010, 12, 073004. [Google Scholar] [CrossRef]
  7. Hernández-Sanchez, E.; Velázquez, J.C. Kinetics of growth of iron boride layers on a low-carbon steel surface. In Laboratory Unit Operations and Experimental Methods in Chemical Engineering, 1st ed.; InTechOpen: London, UK, 2018; Chapter 3. [Google Scholar]
  8. 15 Common Applications for Versatile 4140 Steel. 2021. Available online: https://www.astmsteel.com/steel-knowledge/15-application-4140-steel/ (accessed on 19 February 2022).
  9. 10 Common Applications for 4140 Steel. 2021. Available online: https://wisconsinmetaltech.com/4140-steel-applications-top-10/ (accessed on 19 February 2022).
  10. Aircraft Alloy Steel AISI 4140. 2021. Available online: https://www.aircraftmaterials.com/data/alstst/4140.html (accessed on 19 February 2022).
  11. Meysami, A.H.; Ghasemzadeh, R.; Seyedein, S.H.; Aboutalebi, M.R. An investigation on the microstructure and mechanical properties of direct-quenched and tempered AISI 4140 steel. Mater. Des. 2010, 31, 1570–1575. [Google Scholar] [CrossRef]
  12. Ulutan, M.; Celik, O.N.; Gasan, H.; Er, U. Effect of different surface treatment methods on the friction and wear behavior of AISI 4140 steel. J. Mater. Sci. Technol. 2010, 26, 251–257. [Google Scholar] [CrossRef]
  13. Ulutan, M.; Yildirim, M.M.; Çelik, O.N.; Buytoz, S. Tribological properties of borided AISI 4140 steel with the powder pack-boriding method. Tribol. Lett. 2010, 38, 231–239. [Google Scholar] [CrossRef]
  14. ASTM G65-16e1; Standard Test Method for Measuring Abrasion Using the Dry Sand/Rubber Wheel Apparatus. ASTM International: West Conshohocken, PA, USA, 2016.
  15. Holmberg, K.; Ronkainen, H.; Matthews, A. Tribology of thin coatings. Ceram. Int. 2000, 26, 787–795. [Google Scholar] [CrossRef]
  16. Von Matuschka, M.G. Boronizing, 1st ed.; Carl Hanser: Munich, Germany, 1980. [Google Scholar]
  17. Velázquez-Altamirano, J.C.; Torres-Avila, I.P.; Teran-Méndez, G.; Capula-Colindres, S.I.; Cabrera-Sierra, R.; Carrera-Espinoza, R.; Hernández-Sánchez, E. A stochastic model and investigation into the probability distribution of the thickness of boride layers formed on low-carbon steel. Coatings 2019, 9, 756. [Google Scholar] [CrossRef] [Green Version]
  18. Amuth, S.; Sasidhar, K.N.; Meka, S.R. High nitrogen alloying of AISI 316 L stainless steel powder by nitriding. Powder Technol. 2021, 39, 456–463. [Google Scholar]
  19. Wang, B.; Liu, B.; Zhang, X.; Gu, J. Enhancing heavy load wear resistance of AISI 4140 steel through the formation of a severely deformed compound-free nitrided surface layer. Surf. Coat. Tech. 2018, 356, 89–95. [Google Scholar] [CrossRef]
  20. Da Costa-Aichholz, S.A.; Meruvia, M.S.; Soares, P.C.; Torres, J.R.D. Tribocorrosion behavior of boronized AISI 4140 steel. Surf. Coat. Tech. 2018, 352, 265–272. [Google Scholar] [CrossRef]
  21. Jenson, A.D.; Roy, S.; Sundararajan, S. The evolution of hardness and tribofilm growth during running-in of case carburized steel under boundary lubrication. Tribol. Int. 2018, 118, 1–10. [Google Scholar] [CrossRef] [Green Version]
  22. Staia, M.H.; Pérez-Delgado, Y.; Sanchez, C.; Castro, A.; le Bourhis, E.; Puchi-Cabrera, E.S. Hardness properties and high-temperature wear behavior of nitrided AISI D2 tool steel, prior and after PAPVD coating. Wear 2009, 267, 1452–1461. [Google Scholar] [CrossRef]
  23. Kartal, G.; Eryilmaz, O.L.; Krumdick, G.; Erdemir, A.; Timur, S. Kinetics of electrochemical boriding of low carbon steel. Appl. Surf. Sci. 2011, 257, 6928–6934. [Google Scholar] [CrossRef]
  24. Campos-Silva, I.; Hernández-Sánchez, E.; Rodríguez-Castro, G.; Cimenoglu, H.; Nava-Sánchez, J.L.; Meneses-Amador, A.; Carrera-Espinoza, R. A study of indentation for mechanical characterization of the Fe2B layer. Surf. Coat. Technol. 2013, 232, 173–181. [Google Scholar] [CrossRef]
  25. Tromas, C.; Stinville, J.C.; Templier, C.; Villechaise, P. Hardness and elastic modulus gradients in plasma-nitrided 316L polycrystalline stainless steel investigated by nanoindentation tomography. Acta Mater. 2012, 60, 1965–1973. [Google Scholar] [CrossRef]
  26. Selçuk, B.; Ipek, R.; Karamiş, M.B.; Kuzucu, V. An investigation on surface properties of treated low carbon and alloyed steels (boriding and carburizing). J. Mater. Process. Tech. 2000, 103, 310–317. [Google Scholar] [CrossRef]
  27. Erdemir, A.; Bindal, C.; Zuiker, C.; Savrun, E. Tribology of naturally occurring boric acid films on boron carbide. Surf. Coat. Tech. 1996, 86–87, 507–510. [Google Scholar] [CrossRef]
  28. Hernández-Sanchez, E.; Herrera-Hernández, H.; Chino-Ulloa, A.; Velázquez, J.C.; Velázquez-Mancilla, R.; Carrera-Espinoza, R. Effect of Relative Humidity on the Tribological Properties of Self-Lubricating H3BO3 Films Formed on the Surface of Steel Suitable for Biomedical Applications. Adv. Mater. Sci. Eng. 2015, 2015, 436597. [Google Scholar] [CrossRef] [Green Version]
  29. Sen, S.; Sen, U.; Bindal, C. Tribological properties of oxidised boride coatings grown on AISI 4140 steel. Mater. Lett. 2006, 60, 3481–3486. [Google Scholar] [CrossRef]
  30. Castillo, E.; Hadi, A.S.; Balakrishnan, N.; Sarabia, J.M. Extreme Value and Related Models with Applications in Engineering and Science; John Wiley and Sons, Inc.: Hoboken, NJ, USA, 2005. [Google Scholar]
  31. EasyFit. Distribution Fitting Software, Version 5.6. MathWave Technologies. 2015. Available online: https://easyfit.informer.com (accessed on 26 November 2021).
  32. Coles, S. An Introduction to Statistical Modeling of Extreme Values; Springer Series in Statistics; Springer: London, UK, 2001. [Google Scholar]
  33. Kowaka, M. Introduction to Life Prediction of Industrial Plant Materials: Application of the Extreme Value Statistical Method for Corrosion Analysis; Allerton Press, Inc.: New York, NY, USA, 1994. [Google Scholar]
  34. Walpole, R.E.; Myers, R.H. Probability and Statistics for Engineers and Scientists; Macmillan Publishing Company: New York, NY, USA, 1989. [Google Scholar]
  35. Dekking, F.; Kraaikamp, C.; Lopuha, H.; Meester, L.A. Modern Introduction to Probability and Statistics—Understanding Why and How; Springer Texts in Statistics; Springer: London, UK, 2005. [Google Scholar]
Figure 1. Schematic representation of (a) the sand/rubber apparatus for the wear tests and (b) the sample’s holder [4].
Crystals 12 00298 g001
Figure 2. SEM images of the cross-sections of the samples exposed to (a) carburizing, (b) nitriding and (c) boriding.
Crystals 12 00298 g002
Figure 3. X-ray diffraction patterns of the AISI 4140 (a) untreated, exposed to (b) carburizing, (c) nitriding, and (d) boriding.
Crystals 12 00298 g003
Figure 4. Wear tracks at the surface of the (a) untreated sample, and (bd) samples exposed to carburizing, nitriding and boriding processes, respectively.
Crystals 12 00298 g004aCrystals 12 00298 g004b
Figure 5. EDS analysis of the wear tracks of the samples exposed to (a) carburizing, (b) nitriding, and (c) boriding processes.
Crystals 12 00298 g005
Figure 6. Depth of the wear scar of the sample exposed to a (a) carburizing, (b) nitriding, and (c) boriding process.
Crystals 12 00298 g006
Figure 7. CoF evaluated by a pin-on-disk test applied to sample (a) untreated and (bd) exposed to carburizing, nitriding, and boriding hardening processes, respectively.
Crystals 12 00298 g007
Figure 8. Boride layer micro-hardness histogram fitted to generalized extreme value distribution.
Crystals 12 00298 g008
Figure 9. Nitride layer micro-hardness histogram fitted to Weibull 3P distribution.
Crystals 12 00298 g009
Figure 10. Carbide layer micro-hardness histogram fitted to Weibull 3P distribution.
Crystals 12 00298 g010
Figure 11. Boride layer thickness histogram fitted to Weibull 3P.
Crystals 12 00298 g011
Figure 12. Carbide layer thickness histogram fitted to Weibull 3P.
Crystals 12 00298 g012
Figure 13. Carbide layer thickness histogram fitted to Weibull 3P.
Crystals 12 00298 g013
Table 1. AISI 4140 steel application for different kinds of industries [8,9,10].
Aerospace IndustryOil and Gas IndustryAutomotive IndustryManufacturing IndustryOther Industries
  • Sheets and plates
  • Tubing
  • Rod and forgings
  • Bars
  • Bolts and nuts
  • Fixtures
  • Ejectors
  • Coupling
  • Tubing
  • Piping and fittings
  • Drill collar
  • Ejectors
  • Valves
  • Pump shafts
  • Shafts
  • Crankshafts
  • Fixtures
  • Gears
  • Bars
  • Piston rod
  • Milling spindles
  • Machinery parts
  • Bolts and nuts
  • Slides
  • Steel collet
  • Steel Conveyor and Roll
  • Forks
  • Axles
  • Tracks
  • Sprockets
  • Lathe spindles
  • Guides
Table 2. Chemical composition of the AISI 4140 steel.
Nominal Composition
ElementContent (wt.%)
Carbon0.40
Manganese0.90
Silicon0.30
Chromium1.00
Molybdenum0.20
IronBalance
Table 3. Applied load and distance from the surface to evaluate the hardness for the different surface-hardening processes.
TreatmentApplied Load
(g)
Distance from the Surface
(µm)
Number of Indentations
(n)
Carburizing2518010
Nitriding251510
Boriding256510
Table 4. Tests parameters for the wear assays according to ASTM-G65 standard [14].
Test Type
(ASTM-G65)
Load
(N)
Speed
(rpm)
Sliding Distance
(m)
Time
(s)
Sand Flow
(g/min)
C13010071.830300–400
Table 5. The density of the corresponding hardening surface according to Gloker’s model [16].
MaterialDensity (g cm−3)
FeB6.72
Fe2B7.43
FeN5.81
Fe2N7.15
Fe3N7.12
Fe3C7.78
AISI 41407.85 (literature)
Table 6. Thickness of the hardened layers as a function of the different hardening treatments.
Treatment ConditionLayer Thickness (µm)Number of Measurements (n)
Carburizing365.6 ± 7.9100
Nitriding30.9 ± 4.1100
Boriding126.6 ± 26.2100
Table 7. The hardness and the elastic modulus values for the different hardening treatments.
Treatment ConditionHardness (GPa)Elastic Modulus (GPa)
Untreated0.305 ± 0.03198.3 ± 2.3
Carburizing5.533 ± 0.35248.5 ± 9.2
Nitriding9.462 ± 0.76129.9 ± 13.0
Boriding18.988 ± 056330.3 ± 12.4
Table 8. Volume loss as a function of the different hardening processes.
Treatment ConditionInitial Mass (g)Final Mass (g)Mass Loss (g)Loss of Volume (mm−3)Wear Rate (mm3 N−1 m−1)
Untreated197.4762 ± 0.1197197.4564 ± 0.11870.0198 ± 0.00202.5352 ± 0.25612.7161 × 10−4
Carburizing189.1966 ± 0.929189.1867 ± 0.09660.0099 ± 0.00381.2734 ± 0.48721.3633 × 10−4
Nitriding186.475 ± 0.2360186.46777 ± 0.23730.077 ± 0.00170.9766 ± 0.21561.1538 × 10−4
Boriding178.5808 ± 0.1889178.5735 ± 0.18950.073 ± 0.00060.9299 ± 0.07641.01526 × 10−4
Table 9. Probability density function studied for microhardness observations in different hard layers.
DistributionProbability Density FunctionThe p-Value for Each Hard LayerReference
Generalized Extreme Value f ( x ) = { { 1 σ exp ( ( 1 + k   z ) 1 k ) 1 σ exp ( z exp ( z ) ) , k = 0 ( 1 + k z ) 1 1 k , k 0 z = x μ σ Boride layer
p-value = 0.74
[30,32]
Nitride layer
p-value = 0.80
Carbide layer
p-value = 0.86
Weibull 3P f ( x ) = α β ( x γ β ) α 1 exp ( ( x γ β ) α ) Boride layer
p-value = 0.13
[33]
Nitride layer
p-value = 0.92
Carbide layer
p-value = 0.87
Fréchet 3P f ( x ) = α β ( β x γ ) α + 1 exp ( ( β x γ ) α ) Boride layer
p-value = 0.63
[30]
Nitride layer
p-value = 0.77
Carbide layer
p-value = 0.68
Log-normal 3P f ( x ) = exp ( 1 2 ( ln ( x γ ) μ σ ) 2 ) ( x γ ) σ 2 π Boride layer
p-value = 0.45
[34,35]
Nitride layer
p-value = 0.55
Carbide layer
p-value = 0.83
Table 10. Thickness layer observations fitted to probability density functions.
Hard LayerProbability Density FunctionK–S p-Value
Boride layerGEV0.70
Weibull 3P0.53
Fréchet 3P0.50
Log-normal 3P0.45
Nitride LayerGEV0.81
Weibull 3P0.94
Fréchet 3P0.77
Log-normal 3P0.55
Carbide layerGEV0.85
Weibull 3P0.87
Fréchet 3P0.69
Log-normal 3P0.85
Publisher’s Note: MDPI stays neutral with regard to jurisdictional claims in published maps and institutional affiliations.

